Article

Classification of Corrosion Severity in Concrete Structures Using Ultrasonic Imaging and Linear Discriminant Analysis

by
Prasanna Kumar Mayakuntla
1,
Debdutta Ghosh
2 and
Abhijit Ganguli
3,*
1
Department of Civil and Environmental Engineering, Indian Institute of Technology Tirupati, Chindepalle 517619, India
2
CSIR—Central Building Research Institute, Roorkee 247667, India
3
Department of Civil Engineering & Built Environment, Liverpool John Moores University, Liverpool L3 3AF, UK
*
Author to whom correspondence should be addressed.
Sustainability 2022, 14(23), 15768; https://doi.org/10.3390/su142315768
Submission received: 19 October 2022 / Revised: 21 November 2022 / Accepted: 23 November 2022 / Published: 27 November 2022
(This article belongs to the Special Issue Structural Health Monitoring and Sustainable Built Structures)

Abstract

:
The deterioration of concrete structures due to rebar corrosion is a key issue affecting the safety and service life of civil infrastructure. Reinforced concrete (RC) structures in coastal areas are subjected to harsh environmental conditions that cause rebar corrosion. From the perspective of safety, repair, and structural rehabilitation, it is essential to ascertain the level of corrosion severity and associated damage in RC structures through non-destructive evaluation (NDE) techniques. In this study, the potential of pattern recognition techniques for ascertaining the severity damage at various stages of rebar corrosion in concrete samples was explored. A contact ultrasonic compressional wave transducer pair with 250 kHz centre frequency was used as source and reflected signals from the rebar were acquired using a tied-together scanning approach. To expedite the corrosion process in the laboratory, accelerated corrosion of the embedded rebar was employed. The synthetic aperture focusing technique (SAFT) was applied to reconstruct the image of the concrete subsurface from the acquired B-scans. Two approaches, i.e., the Mahalanobis distance (MD) and linear discriminant analysis (LDA), were adopted; both methods correctly classified the level of corrosion severity and damage to the concrete. The developed pattern recognition techniques can, therefore, be potential tools for generating important information towards economical and timely repair of damaged concrete structures affected by rebar corrosion.

1. Introduction

The deterioration of reinforced concrete (RC) structures due to corrosion is a global issue, with rebar corrosion being one of the primary reasons behind the concrete cover cracking and spalling. An aggressive chloride environment is a severe exposure condition for concrete structures [1] leading to rebar corrosion. The corrosion products are expansive, leading to progressive cracking and spalling which may lead to fatal accidents [2]. Even though corrosion may take years to be evident, the process causes significant loss of strength and durability. Therefore, the necessity of detecting and severity classification of corrosion in the concrete structures can hardly be understated.
Generally, formal inspection of RC structures involves detailed visual assessments and application of some standard NDE procedures. However, detection of internal deterioration due to corrosion is often quite difficult. Controlling and prevention of crack propagation are crucial, and several repair and rehabilitation techniques are available, such as local strengthening and application of inhibitors to address corrosion-related issues [3]. Therefore, the monitoring and evaluation of internal damage due to rebar corrosion in concrete structures are crucial for infrastructural maintenance. Hence, effective NDE methodologies are needed to be developed for systematic and reliable management of concrete infrastructural assets.
The most common in situ electrochemical technique for monitoring the vulnerability of RC elements towards corrosion is the half-cell potential technique, which is presented in the ASTM C876 code of practice [4] and application of this technique is demonstrated in [5,6]. Ground-penetrating radar (GPR)-based assessments have been applied to investigate attenuation of signals due to moisture and chloride content in concrete samples [7]. Estimations of concrete cover thickness and the identification of rebar locations using GPR scans are discussed in [8,9]. Detection of chloride-induced corrosion in concrete slabs using this technique is reported in [10,11] through analysis of time domain waveforms. The authors concluded that the decrease in the reflection amplitudes in the B-scan can be treated as a diagnostic indicator of corrosion. The GPR scanning technique has also been successfully implemented for detection of defects in concrete bridge decks [12,13].
Among other non-destructive testing (NDT) methods, impact echo (IE), acoustic emission (AE) ultrasound, etc., use elastic waves for the flaw detection and voids in the concrete. In the IE technique, the impactor (steel ball) is used to generate stress waves, and the transducer receives a response from the subsurface concrete medium. The IE technique has been successfully applied for the detection of delamination in post-tensioned slabs and bridge decks [14], void detection in grouted ducts [15,16,17], and detection of cracks [18]. Corrosion monitoring in RC structures was analysed in frequency domain using the Fourier transform of time domain signals [19,20]. However, the efficiency of the IE method is highly dependent on the duration of impact and the technique fails to detect smaller sized defects due to the wavelength limit. The AE technique provides passive real-time monitoring of damage in concrete structures. Waves originate due to crack formation within the concrete medium, which are detected by AE sensors installed on the concrete surface [21]. The tracking of crack propagation in concrete beams under bending was demonstrated by AE and digital image correlation (DIC) [22]. The DIC provides more detailed information regarding the crack location and localised strain in 3D, as well as the onset and progression of corrosion activity. However, this method is not suitable for concrete structures that are already cracked [23].
Ultrasonic-wave-based testing is one of the popular NDT techniques for evaluating material properties, detecting flaws, and monitoring corrosion. Direct transmission ultrasonic pulse velocity (UPV) experiments on concrete prisms subjected to corrosion have demonstrated that the ultrasonic wave velocities decrease significantly with progress in the corrosion process [24]. Ultrasonic guided waves (UGW), which can travel longer distances without substantial attenuation, have been applied for the detection of cracks in bolted joints in steel structures [25], for detecting deterioration of the rebar-concrete interface [26], and detection of pitting corrosion in RC structures [27]. CODA wave interferometry (CWI) is another advanced technique for detection of cracks during four point bending test on concrete beams using the authors in [28] reported about efficiency of CWI. and the mapping of stress patterns and cracking in concrete subsurface medium is explored in [29]. Ultrasonic compressional-wave-based imaging of the subsurface of RC elements usually employs the synthetic aperture focusing technique (SAFT) [30,31]. The SAFT has also been applied for imaging of near-surface artificial defects, using a wedged transducer system for generation and reception of Rayleigh waves [32]. Furthermore, the SAFT has been applied for the detection of various stages of corrosion of a rebar in a concrete slab [33]. The inspection of concrete structures through contact-based ultrasonic measurements is time-consuming and challenging, due to the large size of concrete structures. This has partially been addressed through sophisticated ultrasonic equipment such as dry contact transducers. Evaluation of precast beams, walls, and foundation structures have been performed using shear wave transducers [34]. Using the C-scan tomography technique, the authors identified cracks and delaminations in pavements [35]. Applications of the reverse time migration technique to monitor the concrete elements using compressional and shear waves are reported in [36,37].
The above literature survey focuses primarily on detection of structural voids, propagating cracks, rebars, estimation of cover thickness, and corrosion detection in concrete, involving analysis of the received signals in the time and frequency domain, and image processing techniques. The application of statistical techniques is a growing area within NDT of civil engineering structures and pattern recognition; machine-learning-based NDT can be applied to classify the severity of damage. These methods are predominantly categorised into two types: unsupervised and supervised learning methods. In unsupervised learning, specific information of various classes is not available in the training data set, whereas in supervised learning, the labelled class information is available for the classification process. In order to classify the level of damage, various approaches are available: similarity checks through Mahalanobis distance (MD), clustering through unsupervised Gaussian mixture model (GMM), and k-means, and supervised learning through linear discriminant analysis. Artificial-neural-network-based algorithms are also being explored. Similarity checks with MD with respect to an undamaged condition has been used in investigating the effect on stiffness of a degraded concrete bridge due to changing traffic conditions [38]. In another study, the authors implemented a combination of MD and artificial neural networks (ANNs) for classification of cracks using time domain impact echo A-scans and the MD approach was observed to be computationally less intensive compared with ANN for a small data set [39]. The authors in [40] used GMM to demarcate tensile and shear cracks on a full-scale RC wall using mounted AE sensors. GMM has been used for the detection of cracks around bolt holes in aircraft wings [41]. The classification of shear and tensile cracks using AE signals has been demonstrated using GMM in [42,43]. Damage classification in composite materials is demonstrated in [44] through a k-means algorithm using the frequency corresponding to the peak amplitude as a feature vector. The detection and classification of rebar corrosion in concrete bridge decks through application of the k-means clustering algorithm and thresholding of GPR images is presented in [45]. The corrosion severity classification by applying k-means using signal intensities and frequencies obtained from through transmission on bare rebar is reported in [46]. Researchers have applied the k-NN (k-neural network) technique in classifications of the severity of corrosion in pre-stressed tendons in concrete beams subjected to chloride ingress [47]. Regarding the image-based identification and classification of concrete damage, there are a few related publications. The images of cracked concrete beams were used to determine the crack length and width using convolutional neural networks (CNNs) in [48]. The classification of foundation failure condition with radial, horizontal, and vertical displacements as the feature vector is implemented using linear discriminant analysis in [49]. Corrosion classification by applying LDA on digital images of petroleum refinery elements exposed to the marine environment is demonstrated in [50]. In [51], the combination of AE signals and LDA to classify the level of rebar corrosion in concrete constructions has been explored.
The studies presented above are related to the detection of various types of defects in the concrete subsurface. A few research groups have applied statistical learning techniques, i.e., MD, ANN, k-means, and GMM to classify the type of cracks, by analysing signals obtained by IE, AE, and ultrasonic methods. The classification of corrosion severity and associated damage to concrete using ultrasonic SAFT images has not been explored in the literature, to the best of the authors’ knowledge. In this context, the authors propose a novel approach by combining features extracted from SAFT images and harnessing the capabilities of statistical learning to ascertain the level of severity of corrosion affliction in concrete structures. The SAFT is an intuitive visualisation tool for inspecting features or changes in the concrete subsurface, which otherwise cannot easily be interpreted from acquired B-Scans.
To induce corrosion, the accelerated corrosion methodology is implemented. Ultrasonic reflection data is acquired by scanning concrete slabs over the rebar locations at different levels of induced corrosion. The features extracted from the SAFT images of the rebar are used in calculation of MD and input into a linear discriminant analysis (LDA)-based classifier, which identifies the level of corrosion associated with concrete cracking and spalling. To the best of the authors’ knowledge, image-based classification of corrosion severity in concrete structures is a relatively new concept.
The paper is organised as follows. The details of mix design, sample dimensions and rebar arrangement are presented in “Specimen Details”. The laboratory-based corrosion setup is introduced in the “Accelerated Corrosion Setup” section. The SAFT imaging approach is discussed in “Methodology of Ultrasonic Scanning” and imaging results are presented. The classification of corrosion severity is discussed in “Statistical Classification”. The paper ends with the “Conclusions”.

2. Research Methodology

2.1. Specimen Details

Two prismatic concrete slab specimens with dimensions 400   mm × 400   mm × 100   mm , and three beams with 700   mm × 150   mm × 150   mm were cast with an embedded rebar of diameter 10 mm and 32 mm, respectively, as shown in Figure 1. A simplified specimen geometry was adopted in order to understand the corrosion induced cracking process without complications arising out of multiple rebar layers, which would be a part of future research. Ordinary Portland cement (53 grade) was used to cast the samples with 20 mm as the nominal size of coarse aggregates.
In slabs 1 and 2, the side cover was 150 mm, and a clear cover of 45 mm from the top is provided. The slabs were used for the ultrasonic scanning technique; relevant details are presented in Section 2.3. The concrete samples were assumed to be a part of a larger slab system and the beam samples corresponded to examples where inspection was conducted on corner reinforcement, which is more vulnerable to corrosion. For ease of understanding, the authors have considered a simpler geometry and the clear covers used in the study conform to Indian Standards of design practice (IS 456:2000) [52].
The mix proportion (by weight) of concrete ingredients are shown in Table 1. The concrete slabs were cured for 28 days in a curing tank before the experimental inspection. The concrete design was based on IS 10262: 2019 [53] with a target strength of 30 MPa. The average compressive strength of concrete cubes was 43.25 MPa. The mix design was not targeted towards any specific compressional wave velocity. However, the compressional wave velocity was measured for each sample and used in the imaging algorithm.

2.2. Accelerated Corrosion Setup

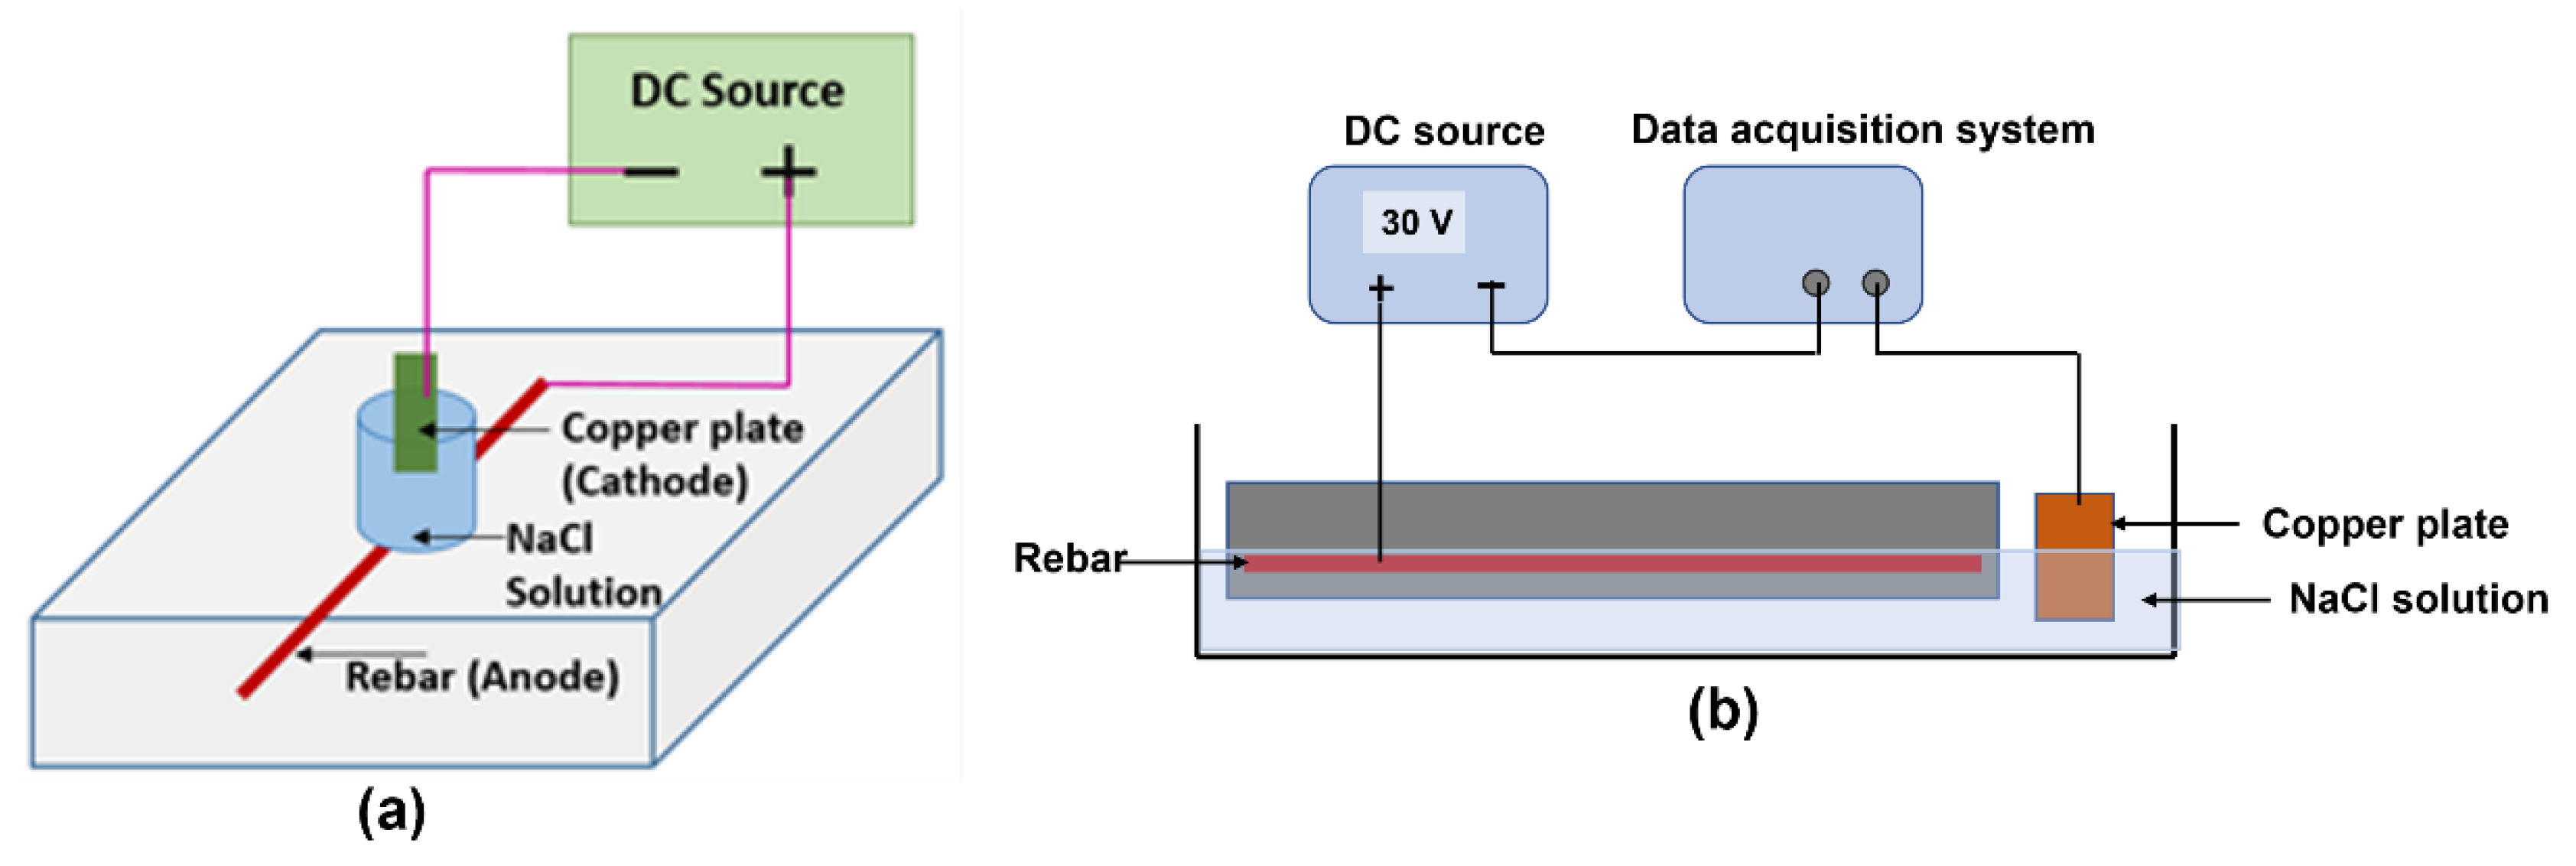
The primary purpose of accelerated corrosion is to expedite the damage to the rebar since the normal process of corrosion may take a longer time. In the first corrosion setup, the current was induced in the rebar using constant 30 Volts DC source. A bottle filled with 3.5% NaCl solution (electrolyte) was installed on the top surface of the slab specimen to generate corrosion around the central region along the rebar. The steel rebar (anode) was connected to the positive terminal of the DC source, and the negative terminal was connected to the copper plate (cathode) immersed in the NaCl solution, as shown in Figure 2a.
In the second corrosion setup, the beam was partially immersed in a 3.5% NaCl solution (as shown in Figure 2b) to corrode rebar uniformly along the length. The rebar was connected to positive terminal and copper plate was connected to negative terminal.
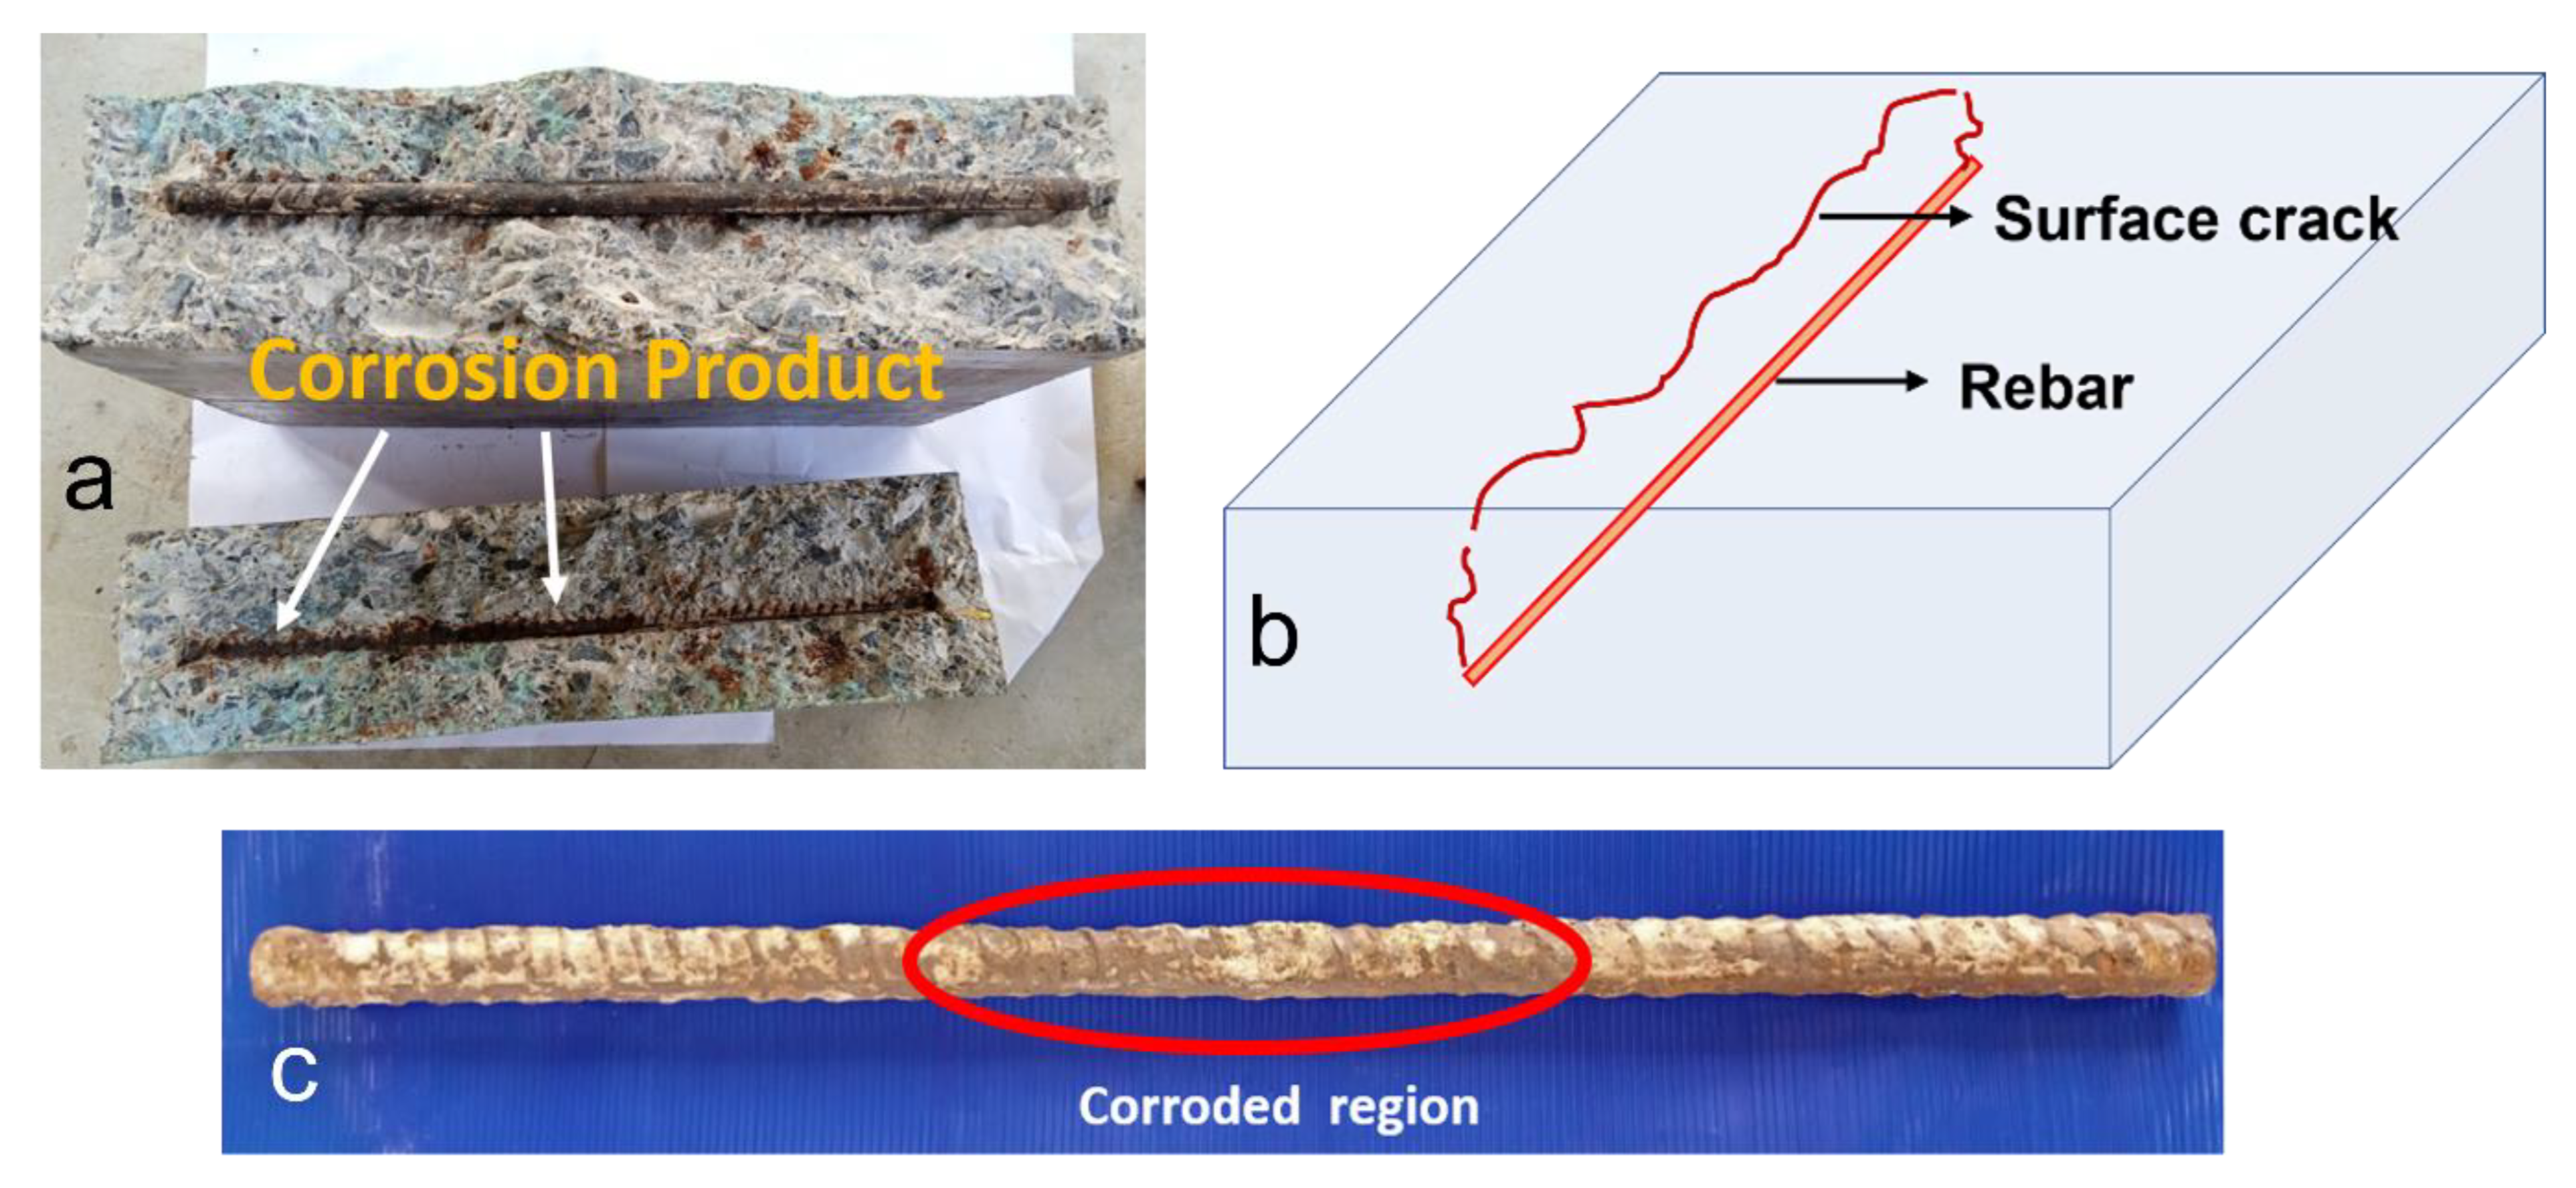
To understand the process of corrosion induced cracking, slab 1 was corroded until cracking; the extracted rebar is shown in Figure 3. Slab 2 was corroded in three stages and the central portion of rebar was observed to have undergone a loss in diameter, due to corrosion induced by the saline solution placed directly above the centre of the rebar.
The beams were corroded in seven stages of corrosion, as shown in Table 2, and ultrasonic scanning was performed at all corrosion stages.
Slab 1 was subjected to corrosion until a surface crack appeared (refer to Figure 3b). The rebar was extracted for physical examination post cracking; the corresponding photos are shown in Figure 3. A surface breaking crack along the rebar axis that ran approximately vertically through the concrete from the rebar level to the exposed surface is schematically shown in Figure 3b.
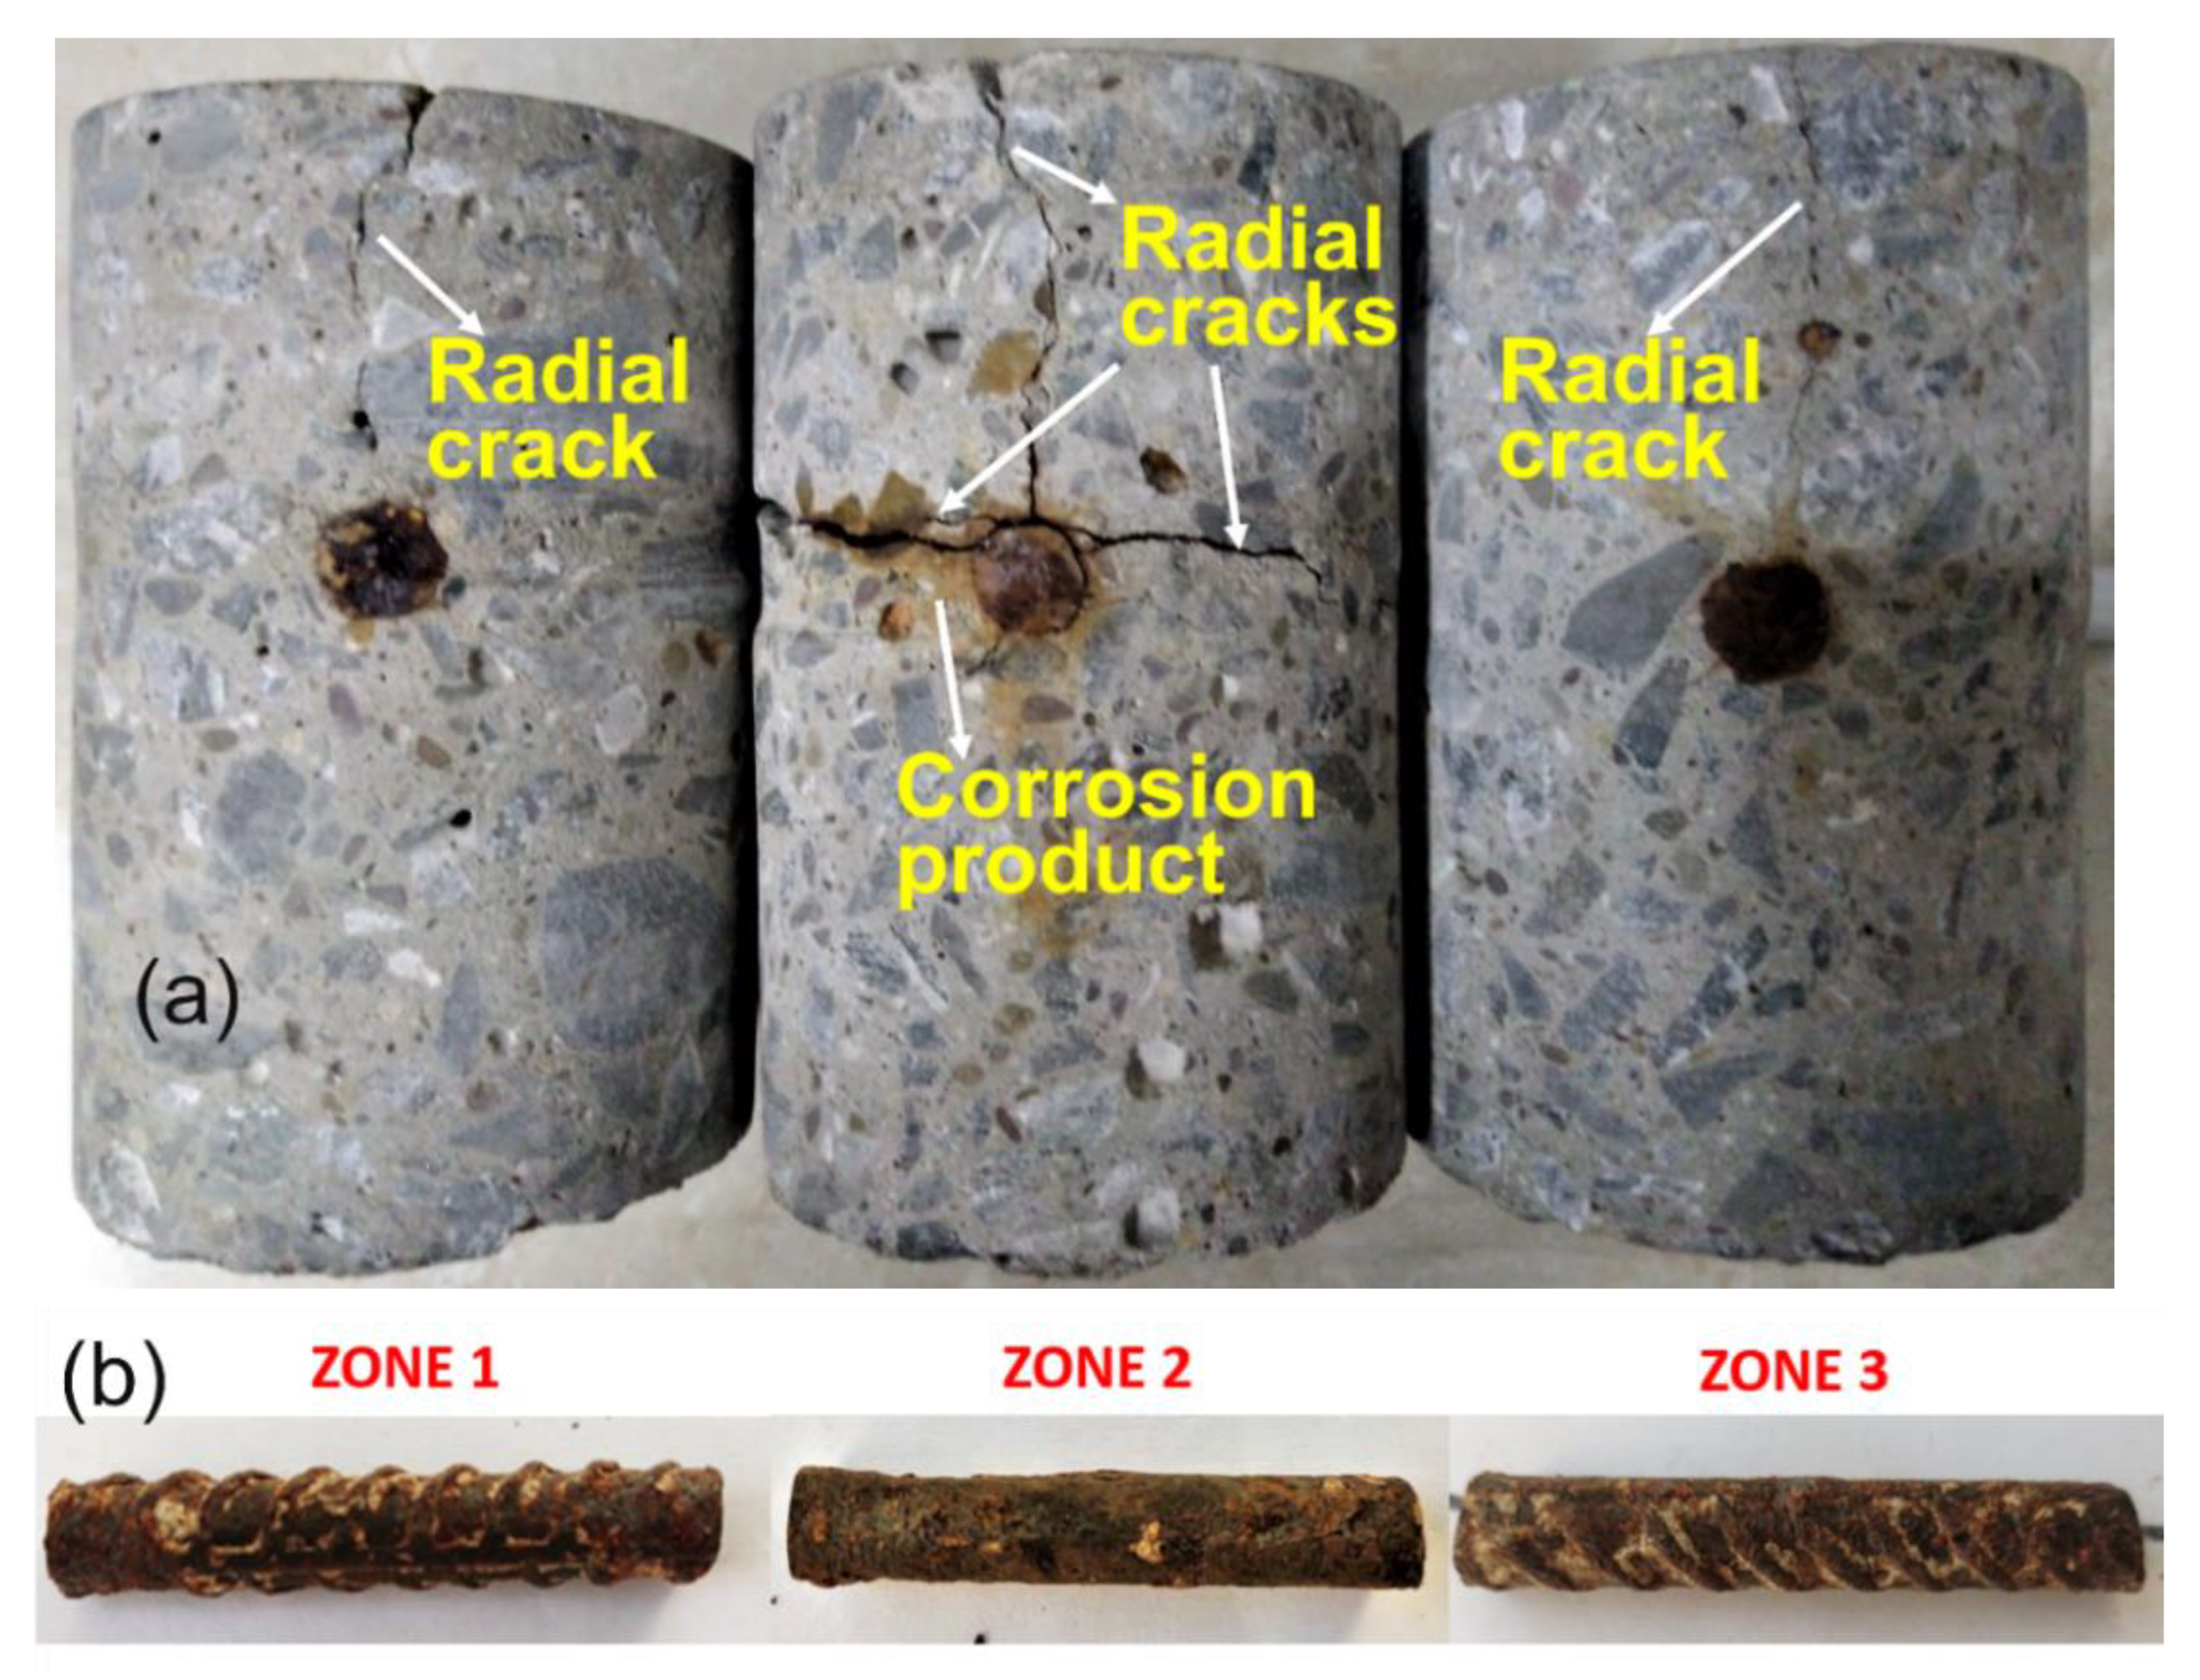
Slab 2 was subjected to three levels of corrosion until cracking, and cores were extracted along the rebar in slab 2 after the final stage, as shown in Figure 4a. The central core was affected more with the radial cracks and surface breaking crack. The extracted rebars also showed that the middle portion corroded more with the loss of the rib structure and pitting corrosion along the length.
For the other two cores on the side, only a surface breaking crack was generated. The rebars from the three cores are labelled according to the convention shown in Figure 4b; a detailed explanation is presented in Section 3.
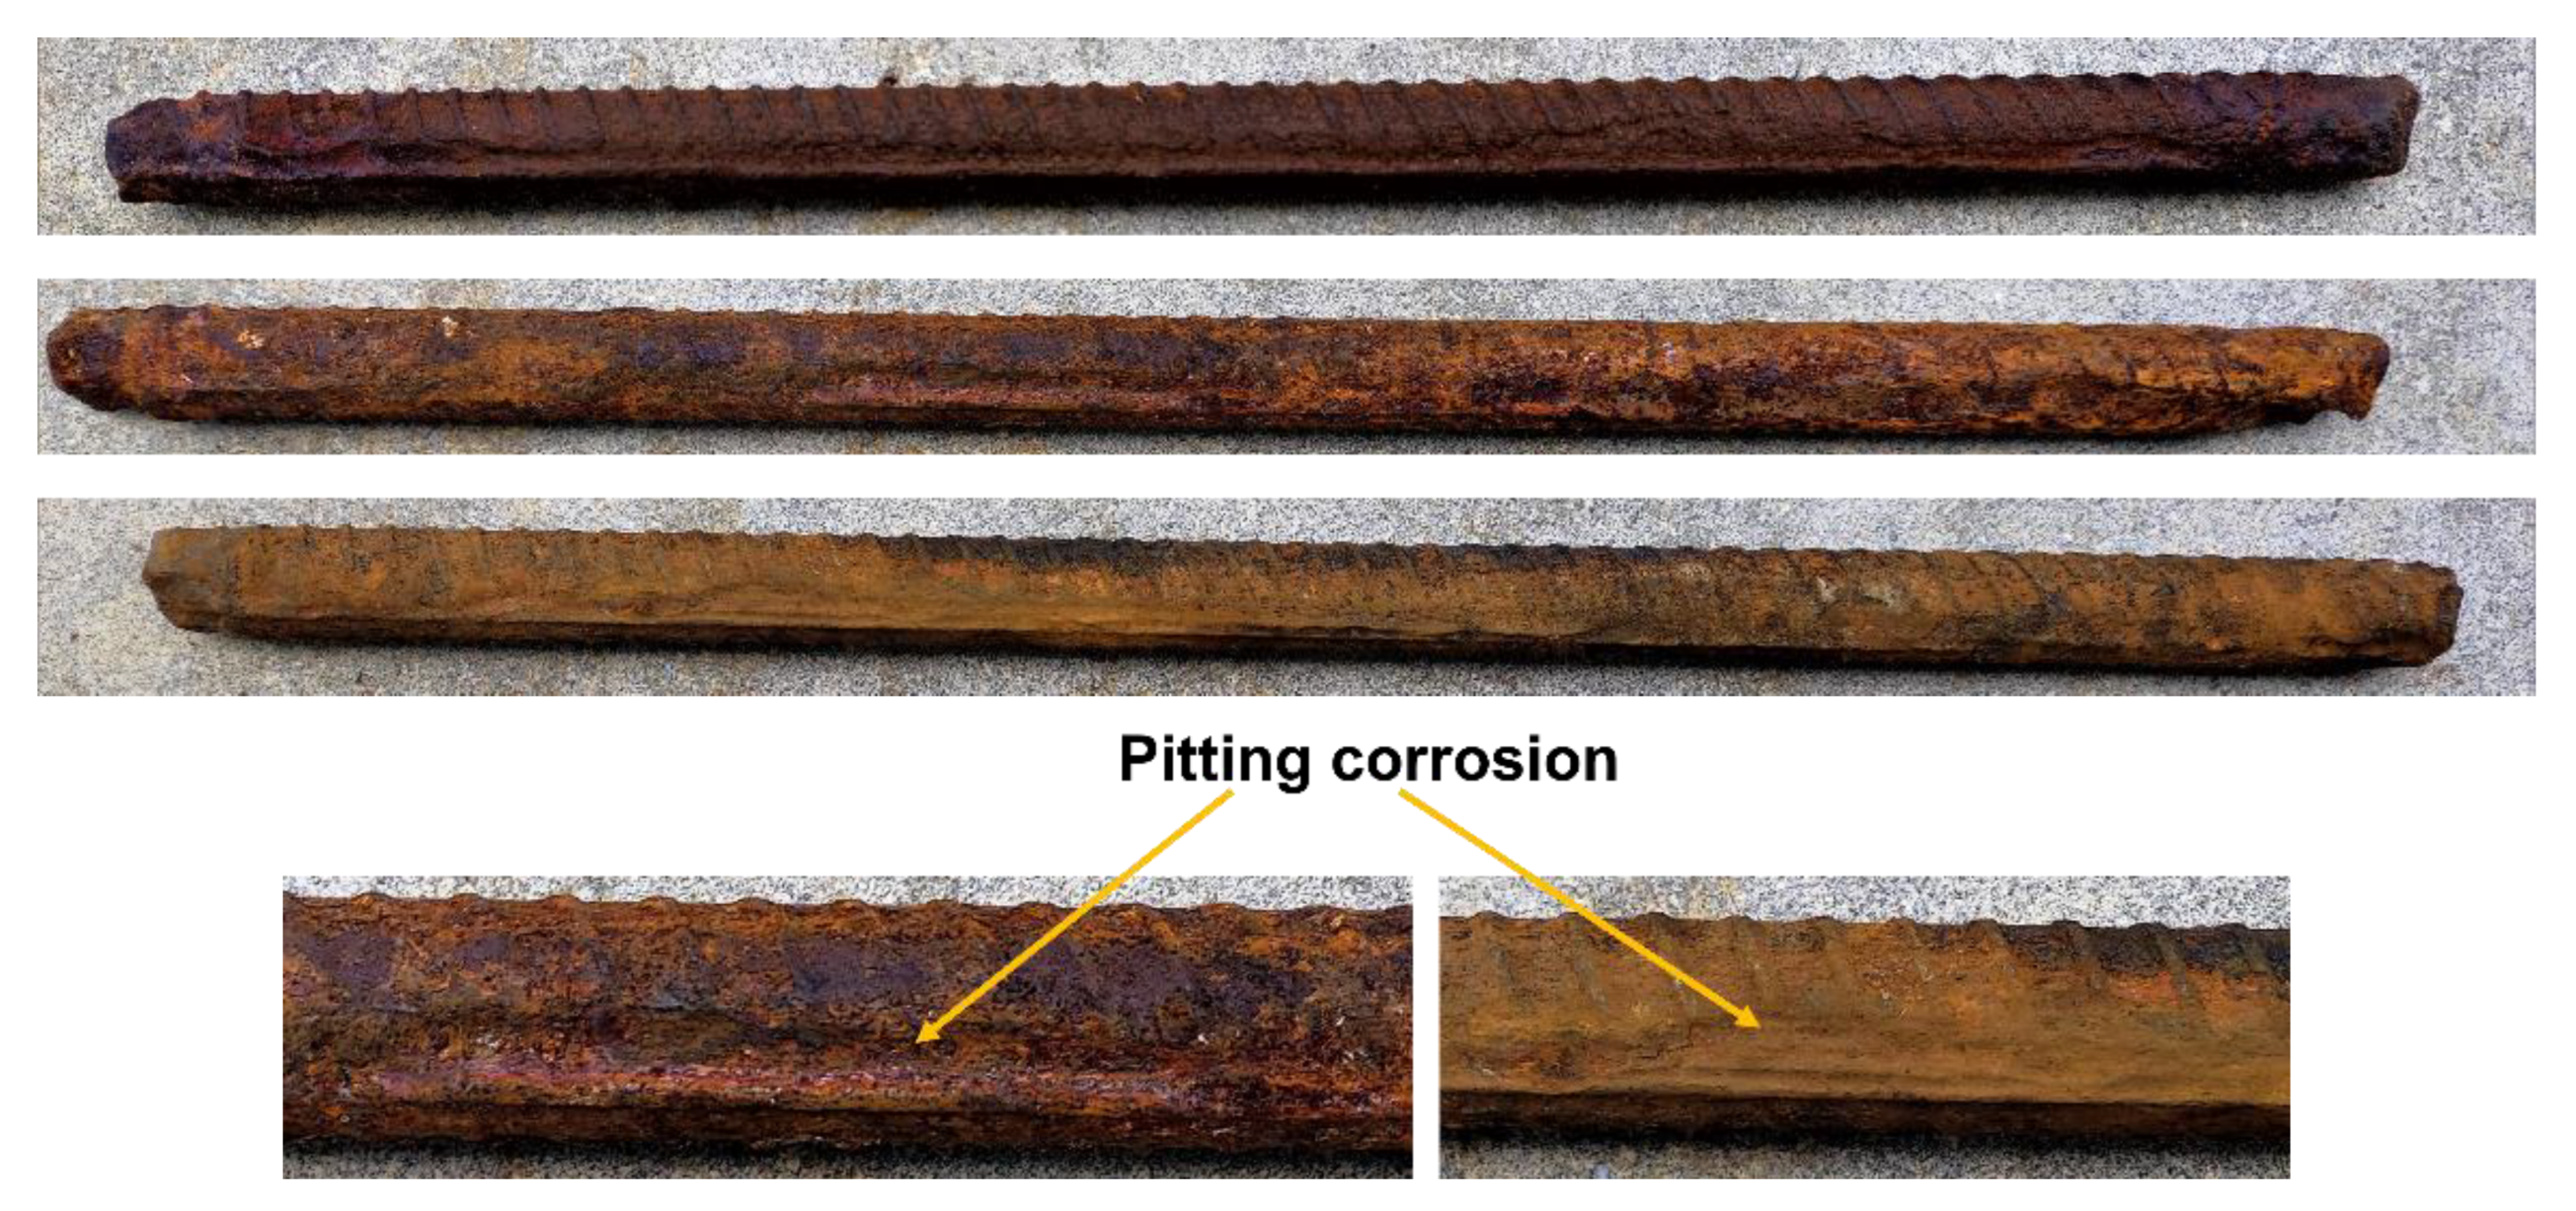
In Figure 5, corresponding photographs of the 32 mm rebars extracted from the beams are shown. Rebar from beams exhibits pitting corrosion and diameter reduction along the rebar.
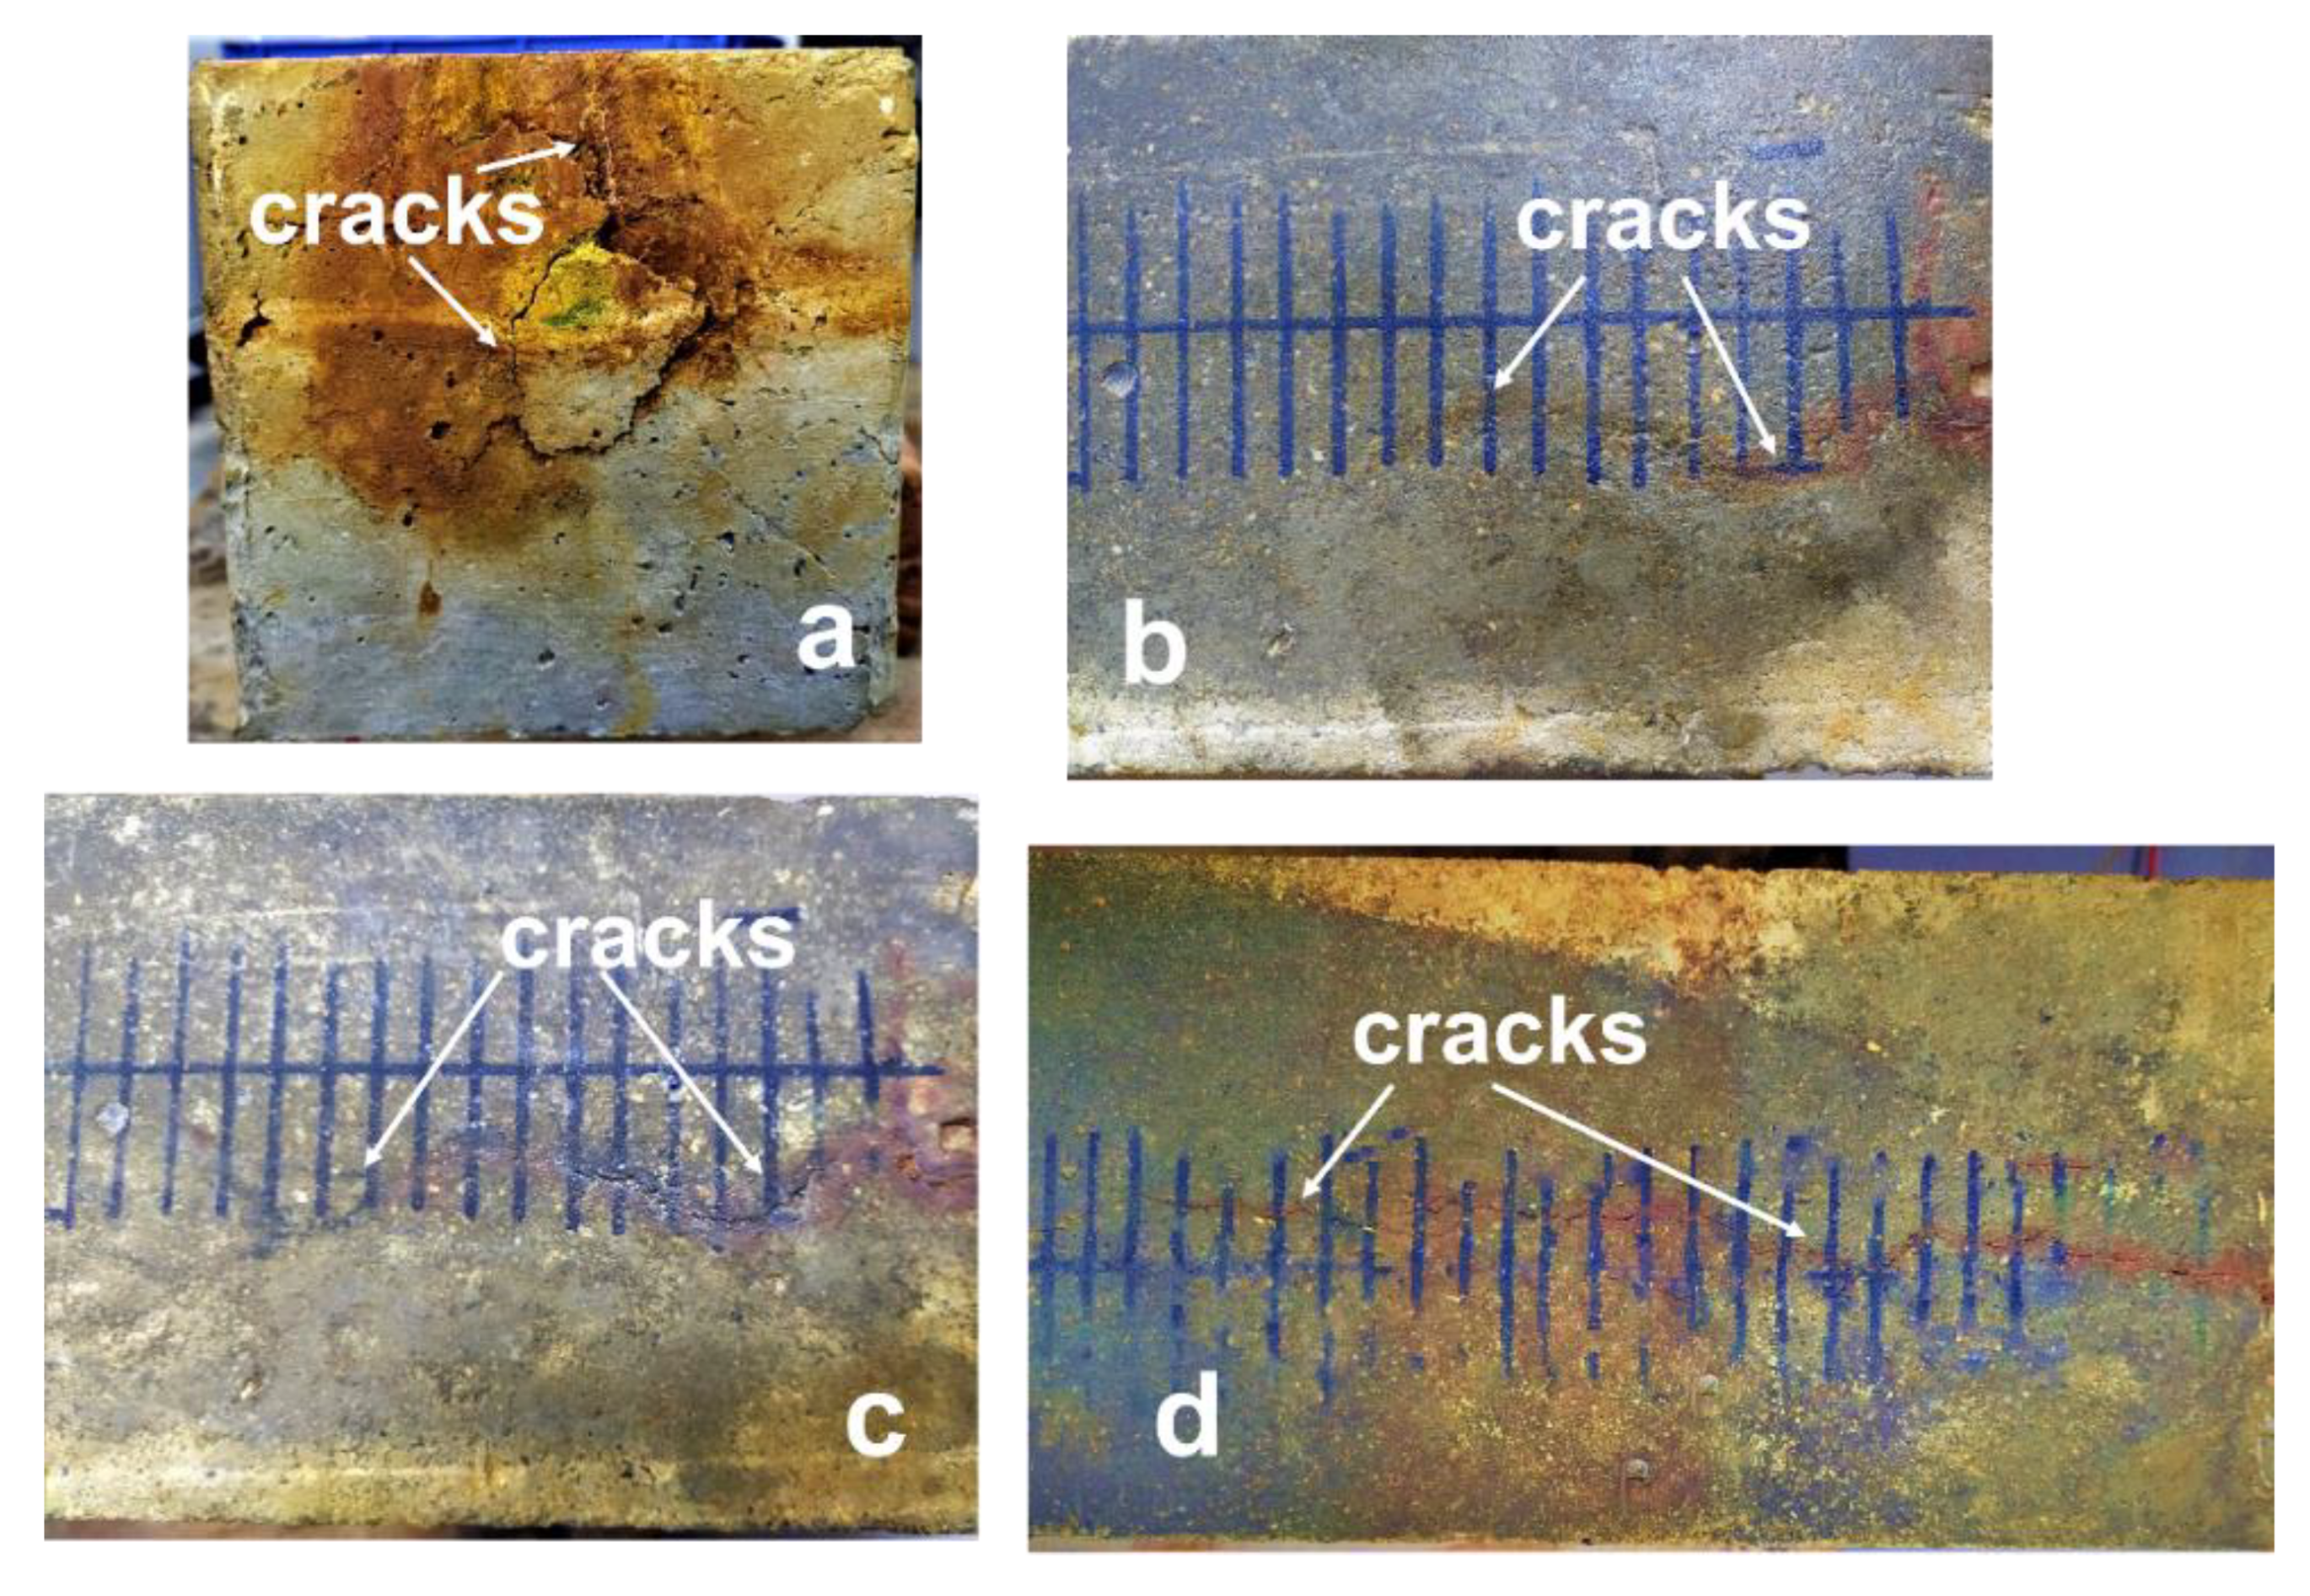
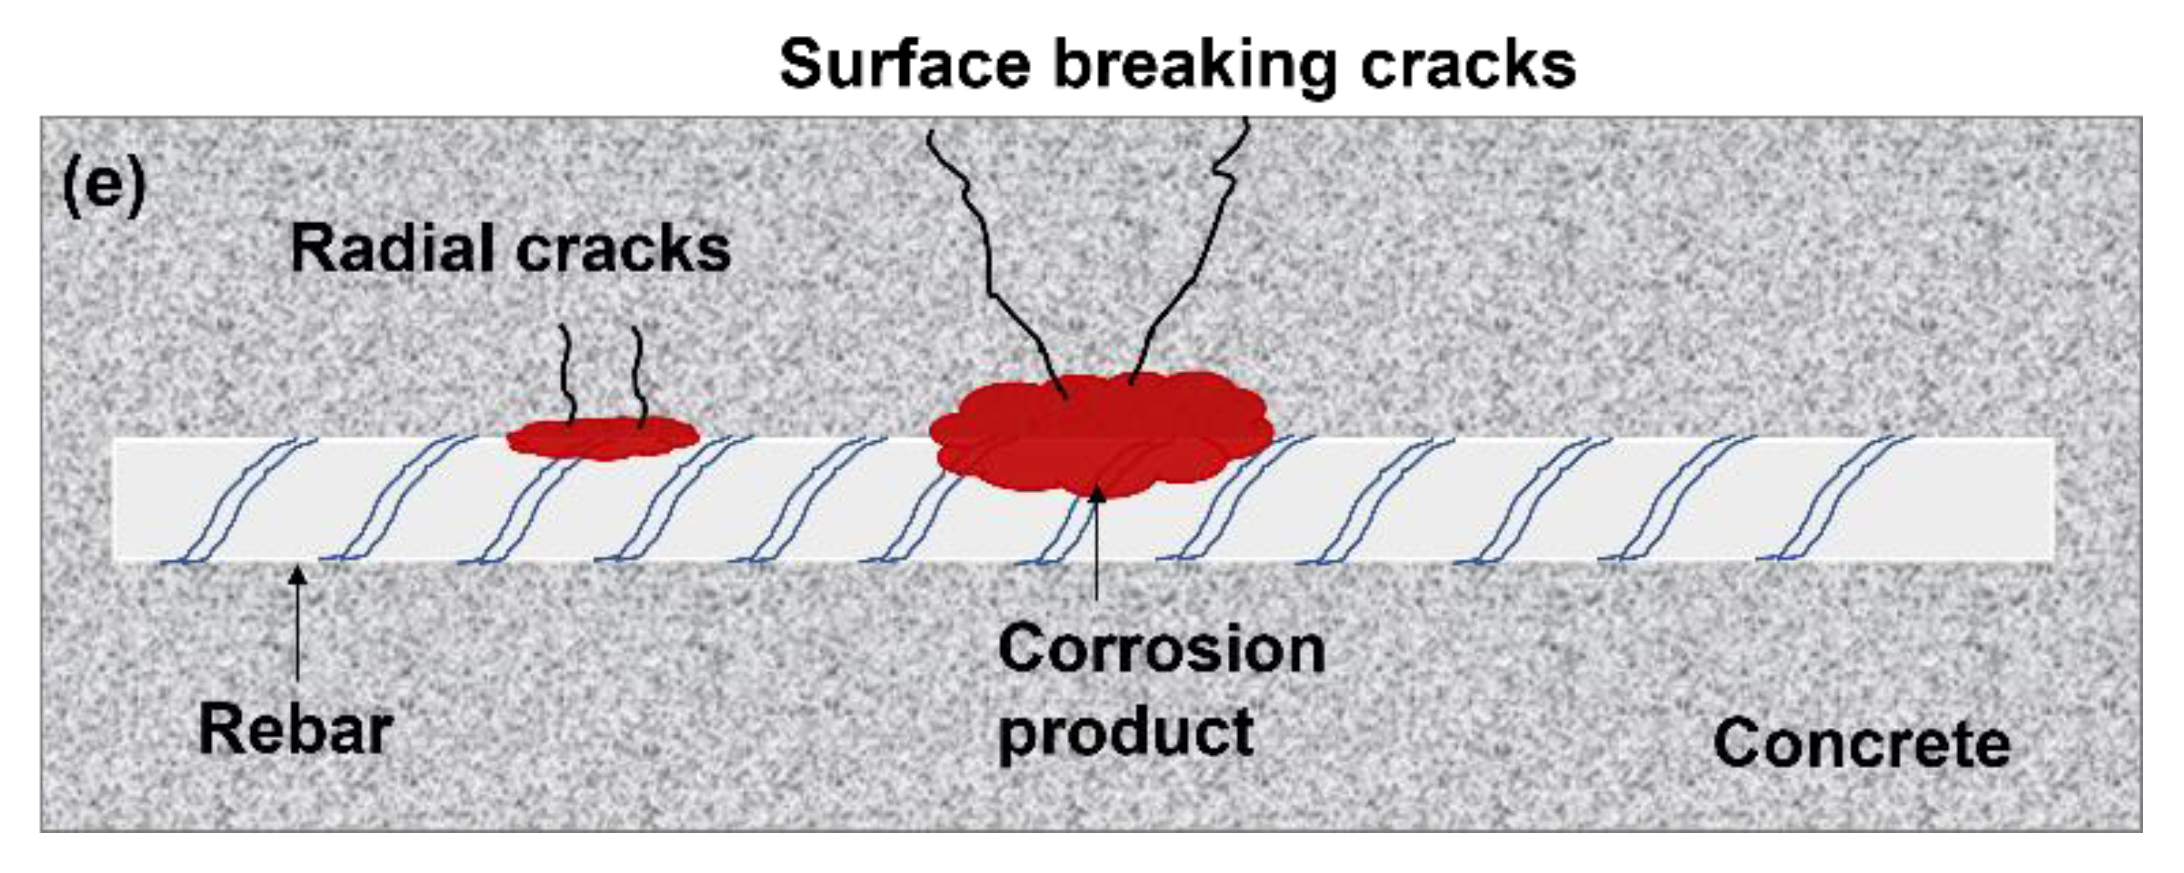
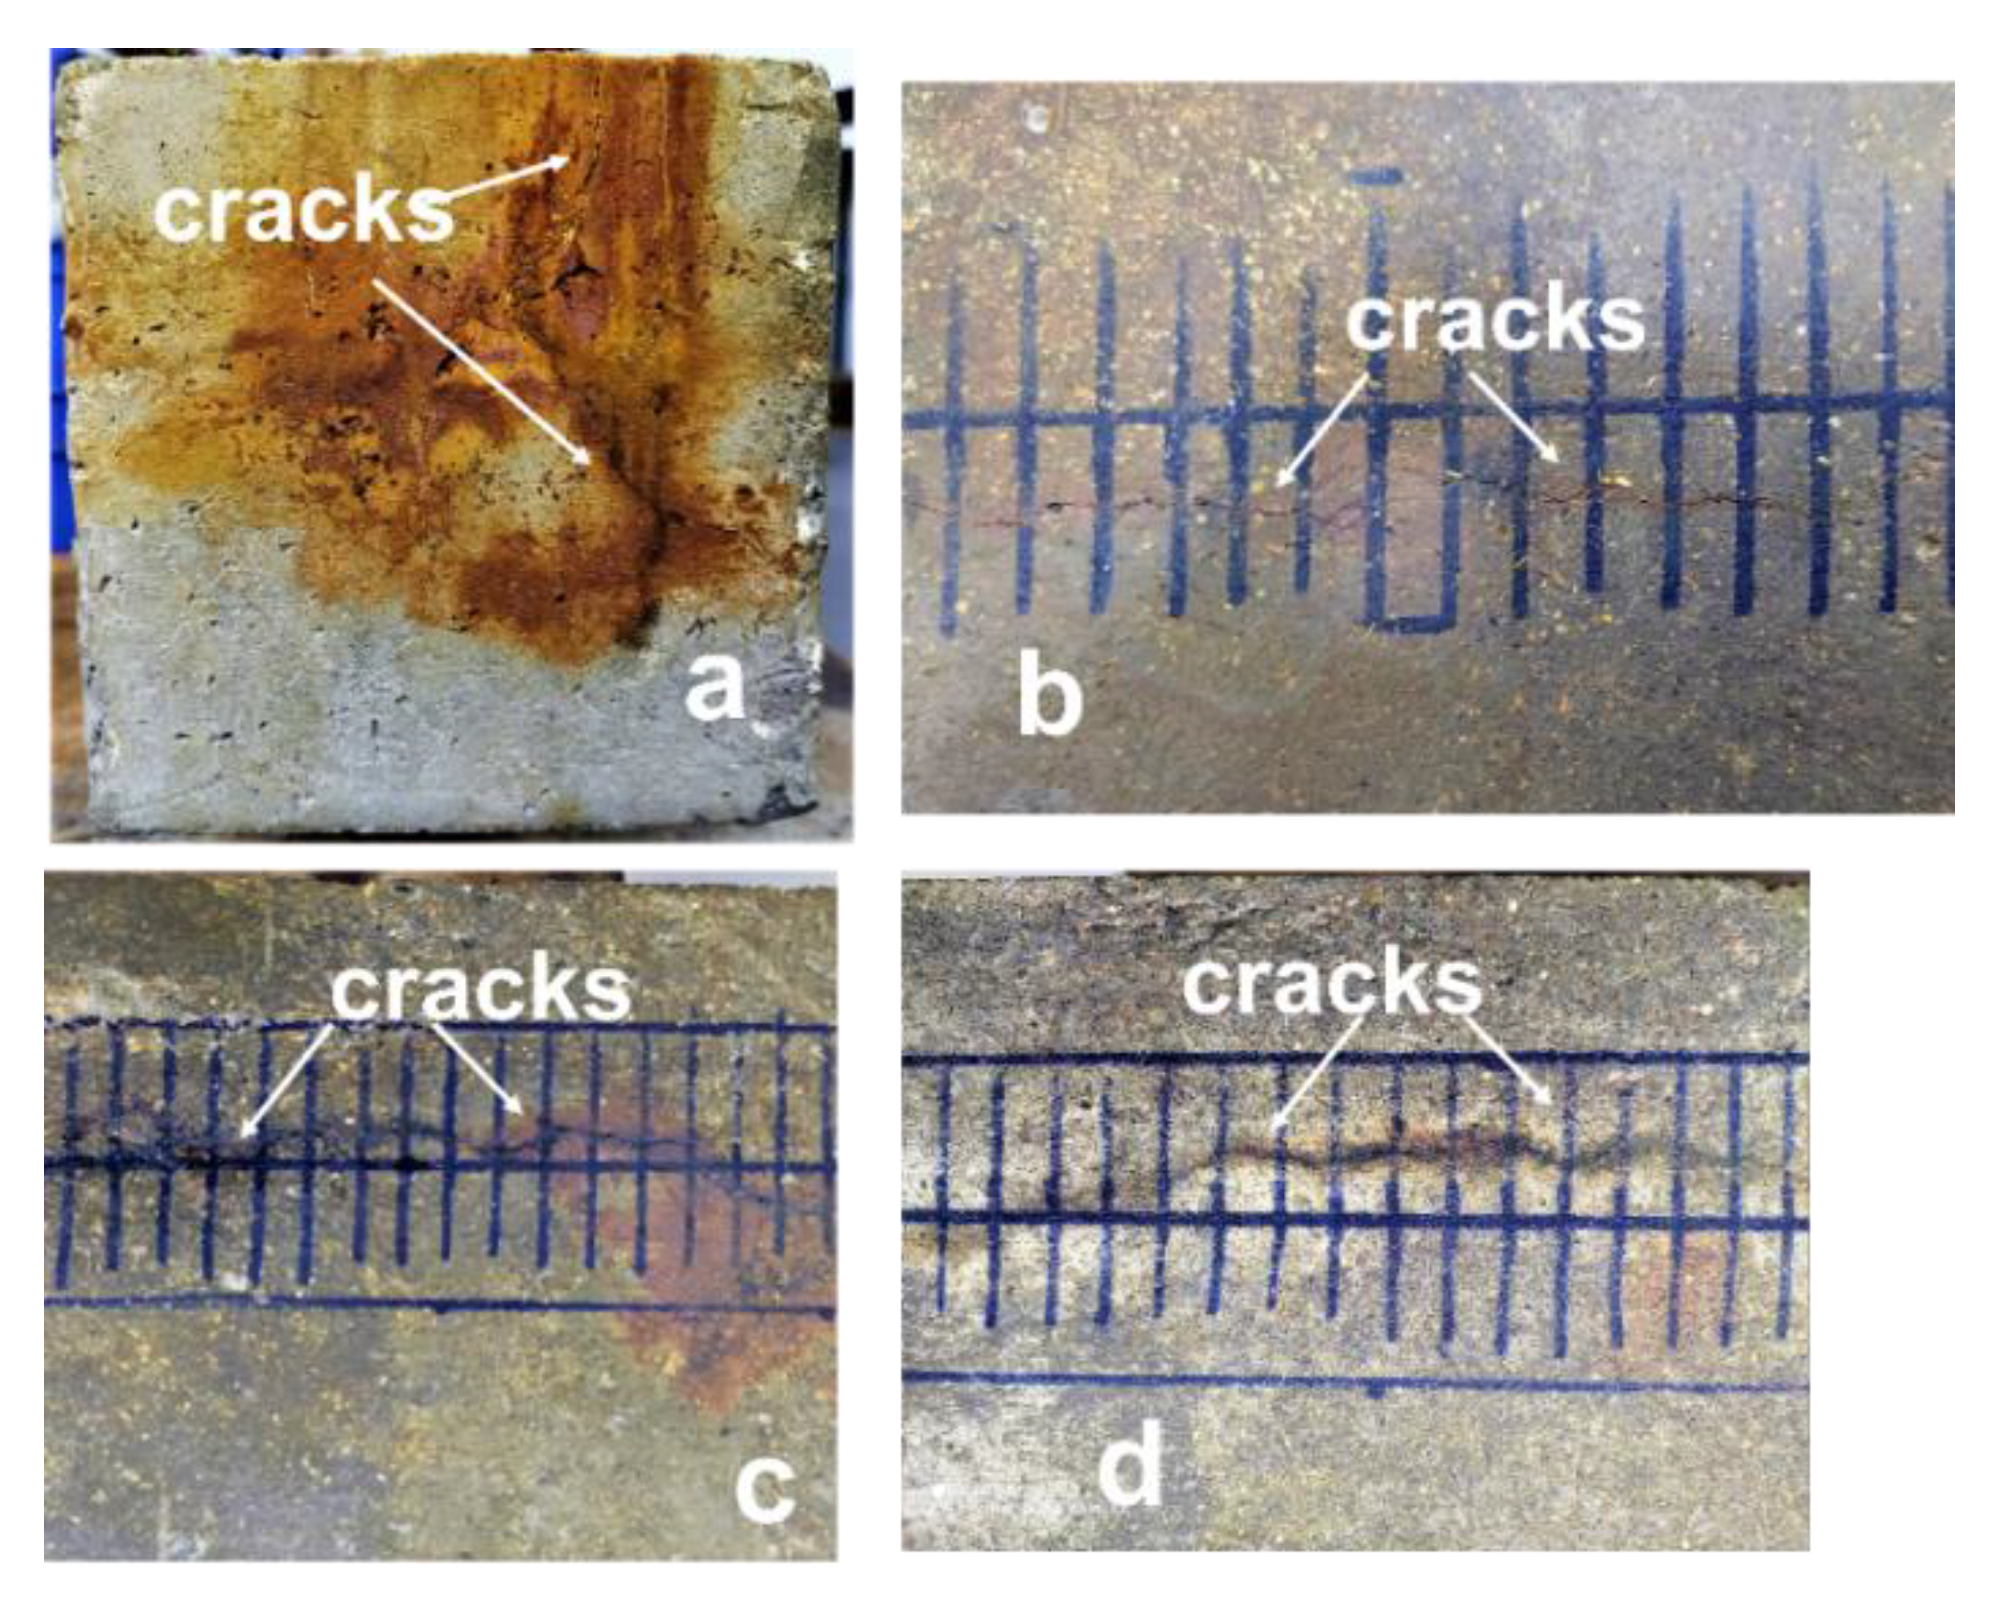
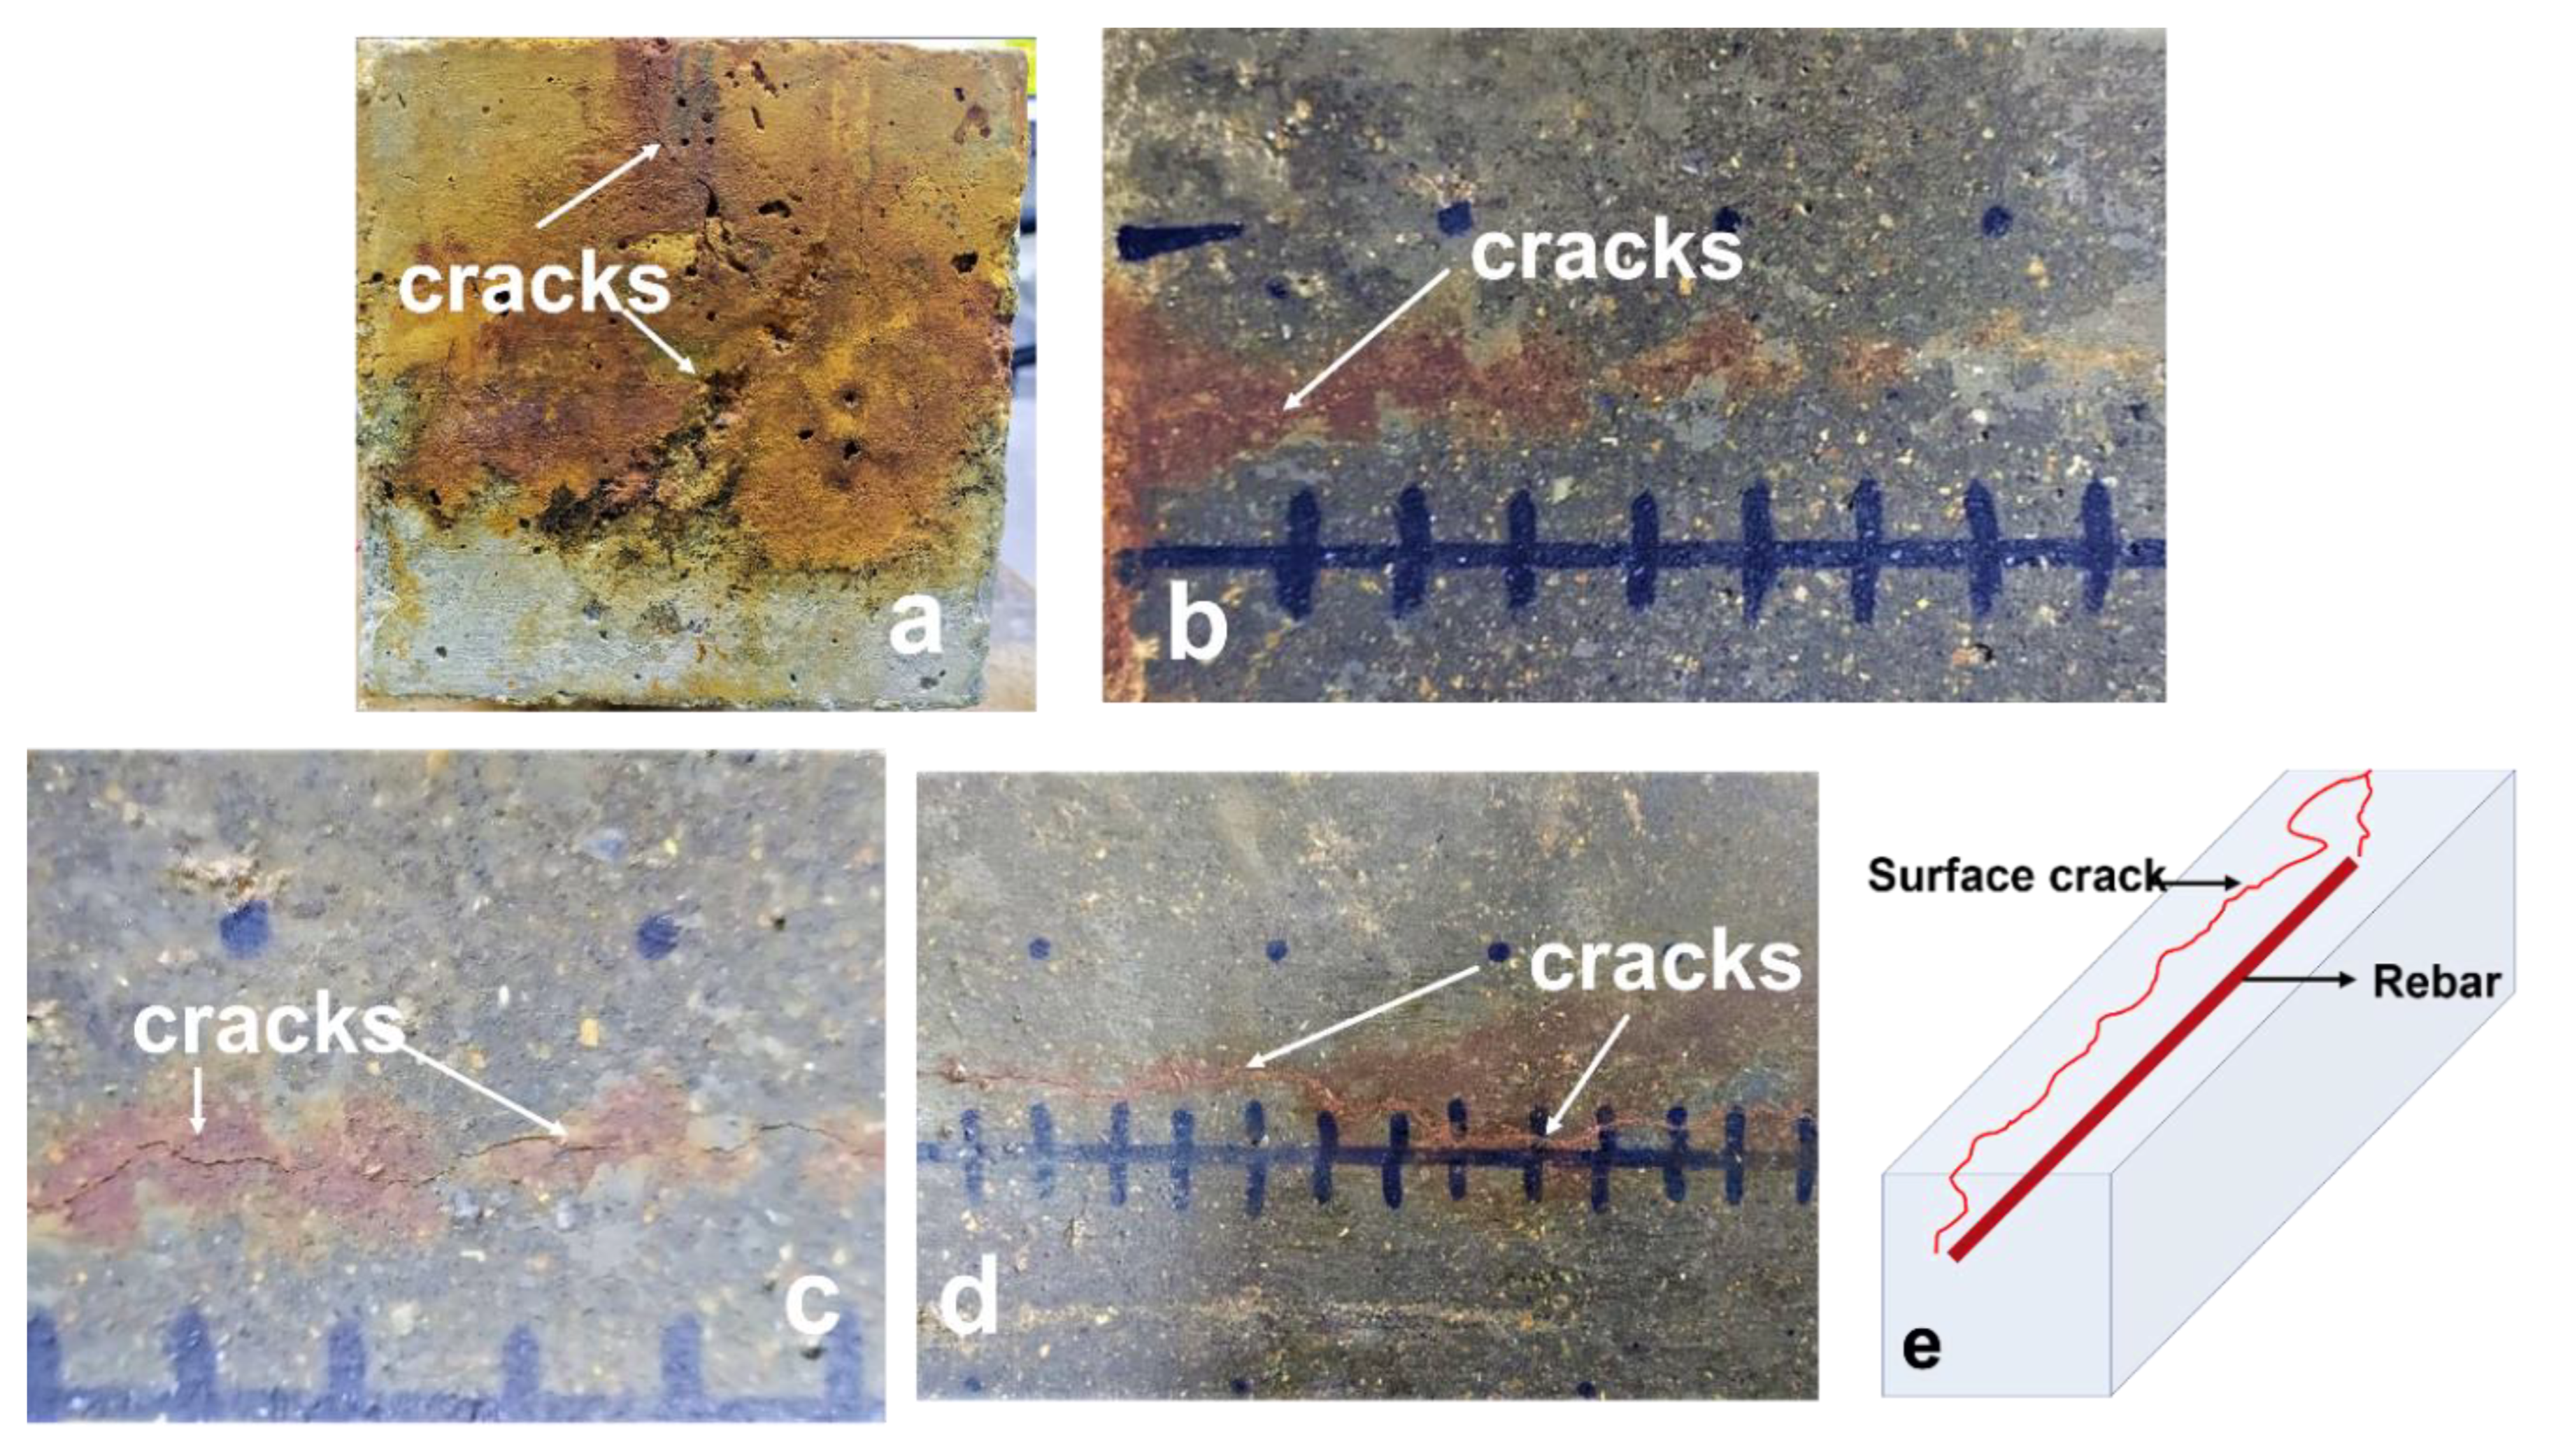
Figure 6, Figure 7 and Figure 8 show the cracked images of beams 1, 2 and 3. The intensity of the reflected signal depends on the acoustic impedance of the concrete rebar interface. the latter changes due to progressive accumulation of corrosion product and micro cracking of the surrounding concrete which eventually leads to the formation of surface breaking cracks and spalling, in cases of heavy corrosion (Figure 6e). These two effects occur simultaneously and influence the intensity of reflected signals, which was observed independently by [33,35]. A surface breaking crack on the side surface of the specimen is observed after the third corrosion cycle in all the beams (Figure 6a, Figure 7a and Figure 8a). With the progress in corrosion, the surface breaking cracks and oozing of corrosion product were observed, as shown in Figure 8e.

2.3. Methodology of Ultrasonic Scanning

Ultrasonic scanning above the rebar level on RC slabs 1 and 2 was conducted during the three stages of corrosion, i.e., (a) pre-cracking stage I, (b) pre-cracking stage II, and (c) cracked stage.
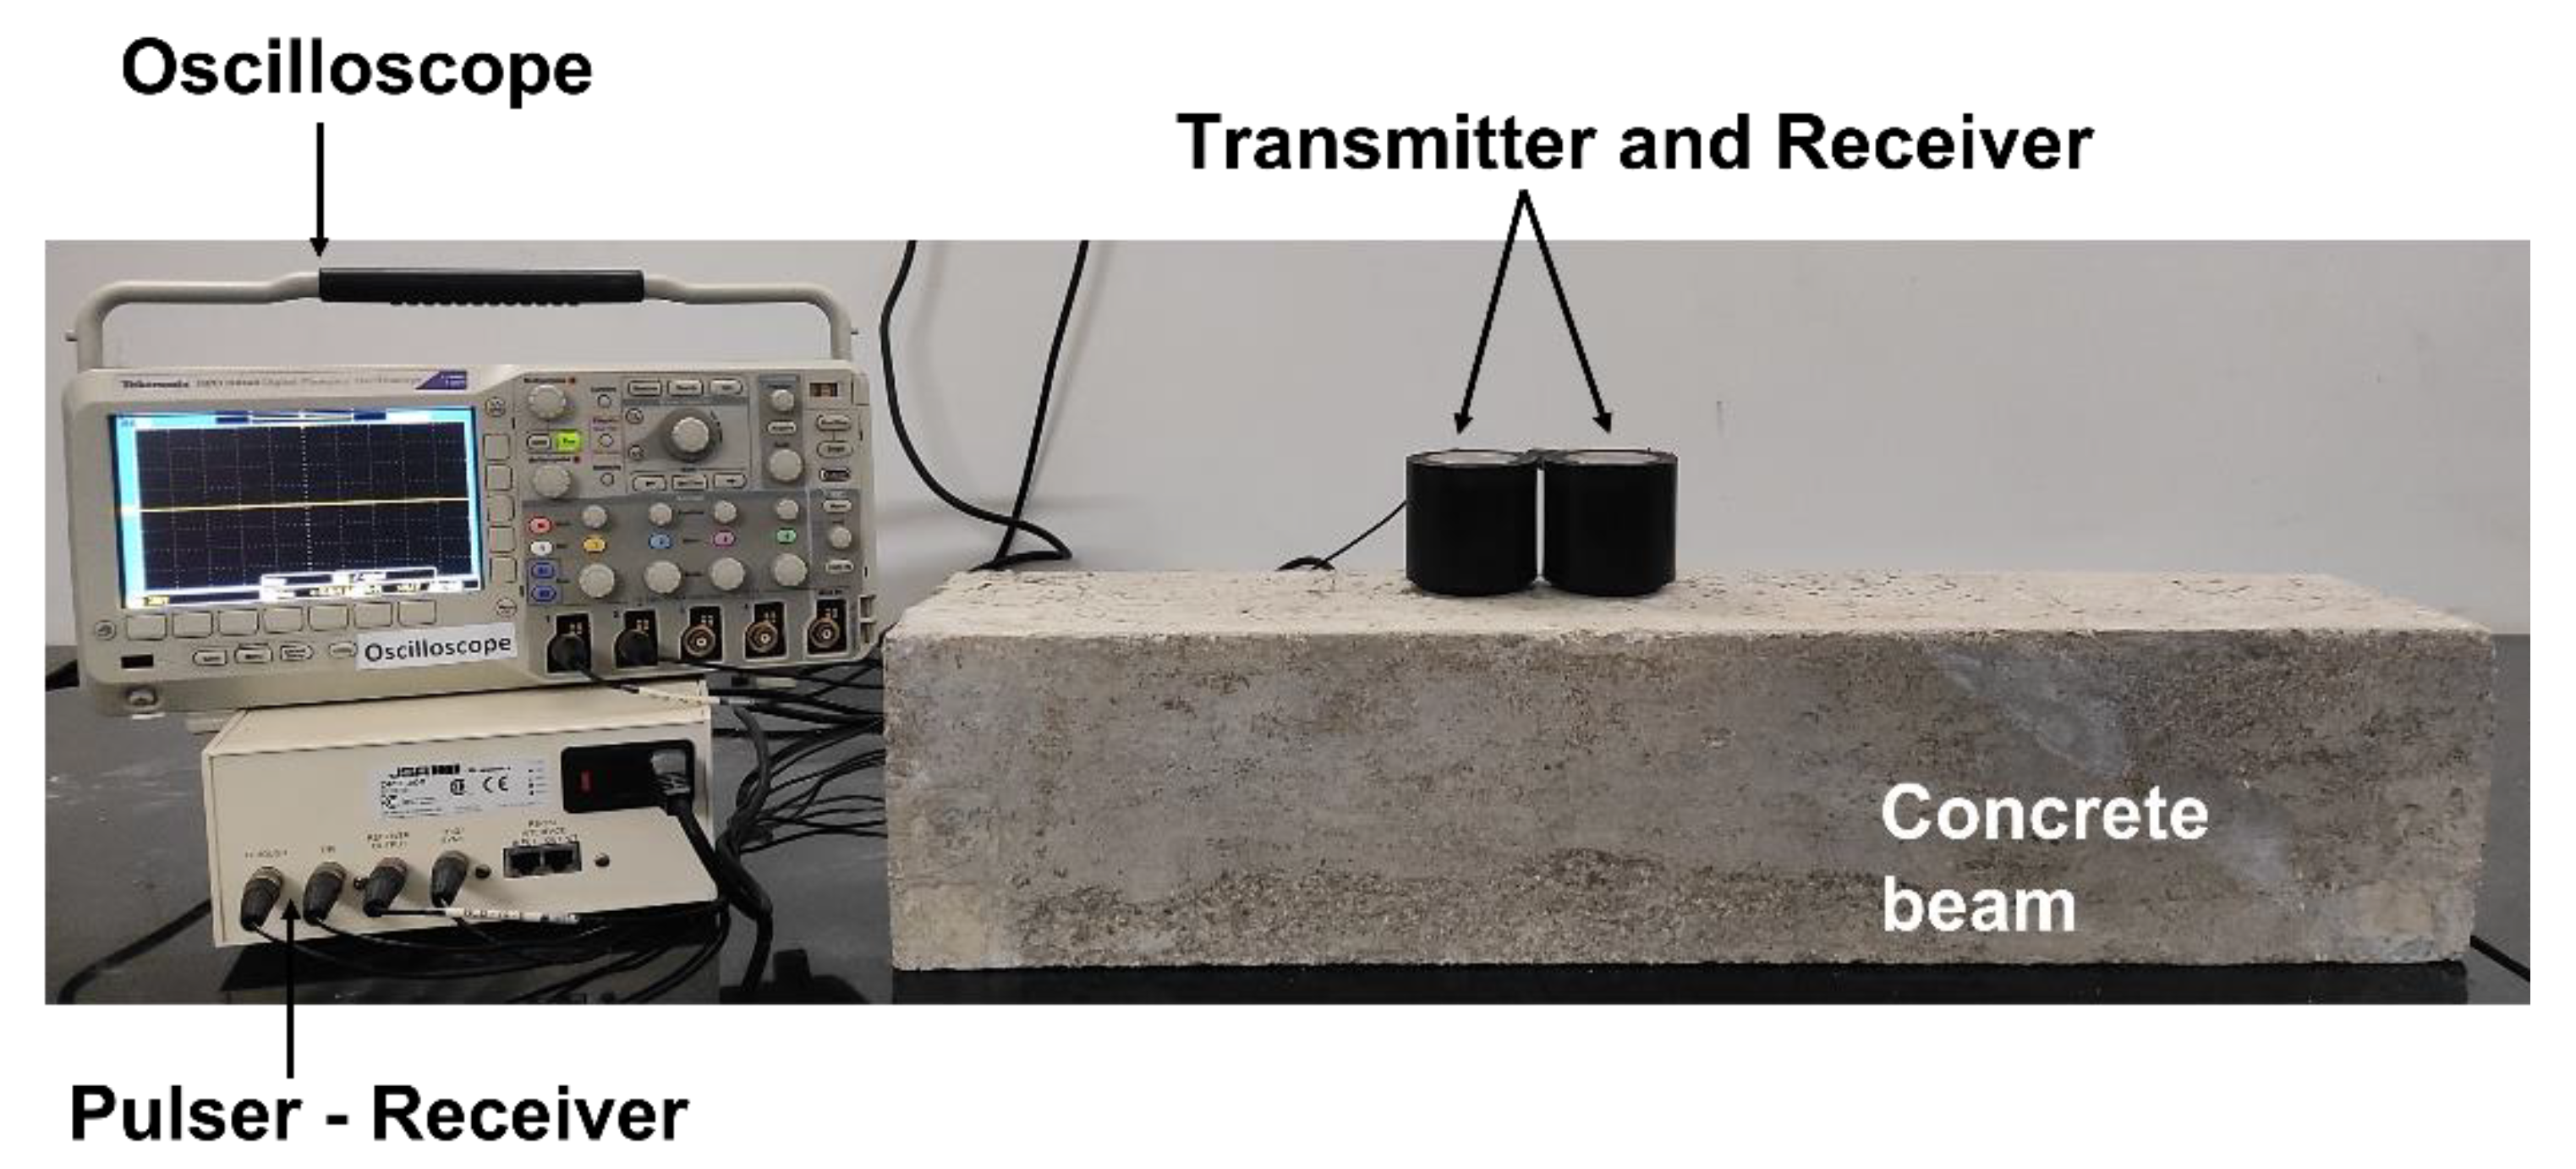
As mentioned before, the beams were corroded at seven levels of corrosion, and ultrasonic scanning was performed at (a) pre-cracking stage I, (b) pre-cracking stage II, (c) pre-cracking stage III, (d) cracked stage I, (e) cracked stage II, (f) cracked stage III, and (g) cracked stage IV. Compressional wave transducers with a centre frequency of 250 kHz were used for transmission and reception in a tied-together mode along the rebar axis, as shown in Figure 9. The acquired signals or A-scans were digitised in an oscilloscope in a time window of 500 μs. Petroleum jelly was used as the couplant between the transducers and the concrete surface.
The slab surface was marked with a network of grid lines at an interval of 10 mm in both directions, and waveforms were acquired at various grid points along the aperture line. The experimental inspection for slabs 1 and 2 was carried out over a linear aperture above the rebar. Tests on the slabs and the beams were conducted independently in two different laboratories at different points of time and similar results have been observed and are published in the literature [33,35]. This corroborates the effectiveness of the implemented technique with regard to the implemented methodologies. In the current study, for the beams, ultrasonic scanning was performed over the rebar at 45 inspection points per slab. In total, 45 × 7 × 3 = 945 wave forms were acquired and analysed, and the results were consistent with previous findings. Similarly, the inspection of slabs was carried out at 26 inspection points over the rebar. Therefore, 26 × 4 = 104 waveforms were acquired. The acquired signals were analysed and processed using the SAFT algorithm, and vertical cross-sectional images through the rebar axis were generated on the y–z plane (Figure 1) at various levels of corrosion.

2.4. Imaging Methodology

The image reconstruction approach adopted to generate images at various corrosion levels was the synthetic aperture focusing technique (SAFT) [30,33,34,54]. The SAFT was implemented to create a 2D vertical cross-sectional image through the rebar of the concrete subsurface to explore changes due to accelerated corrosion of the rebar. The image reconstruction methodology is explained in the following sub-section.

2.4.1. Image Reconstruction Using the Synthetic Aperture Focusing Technique

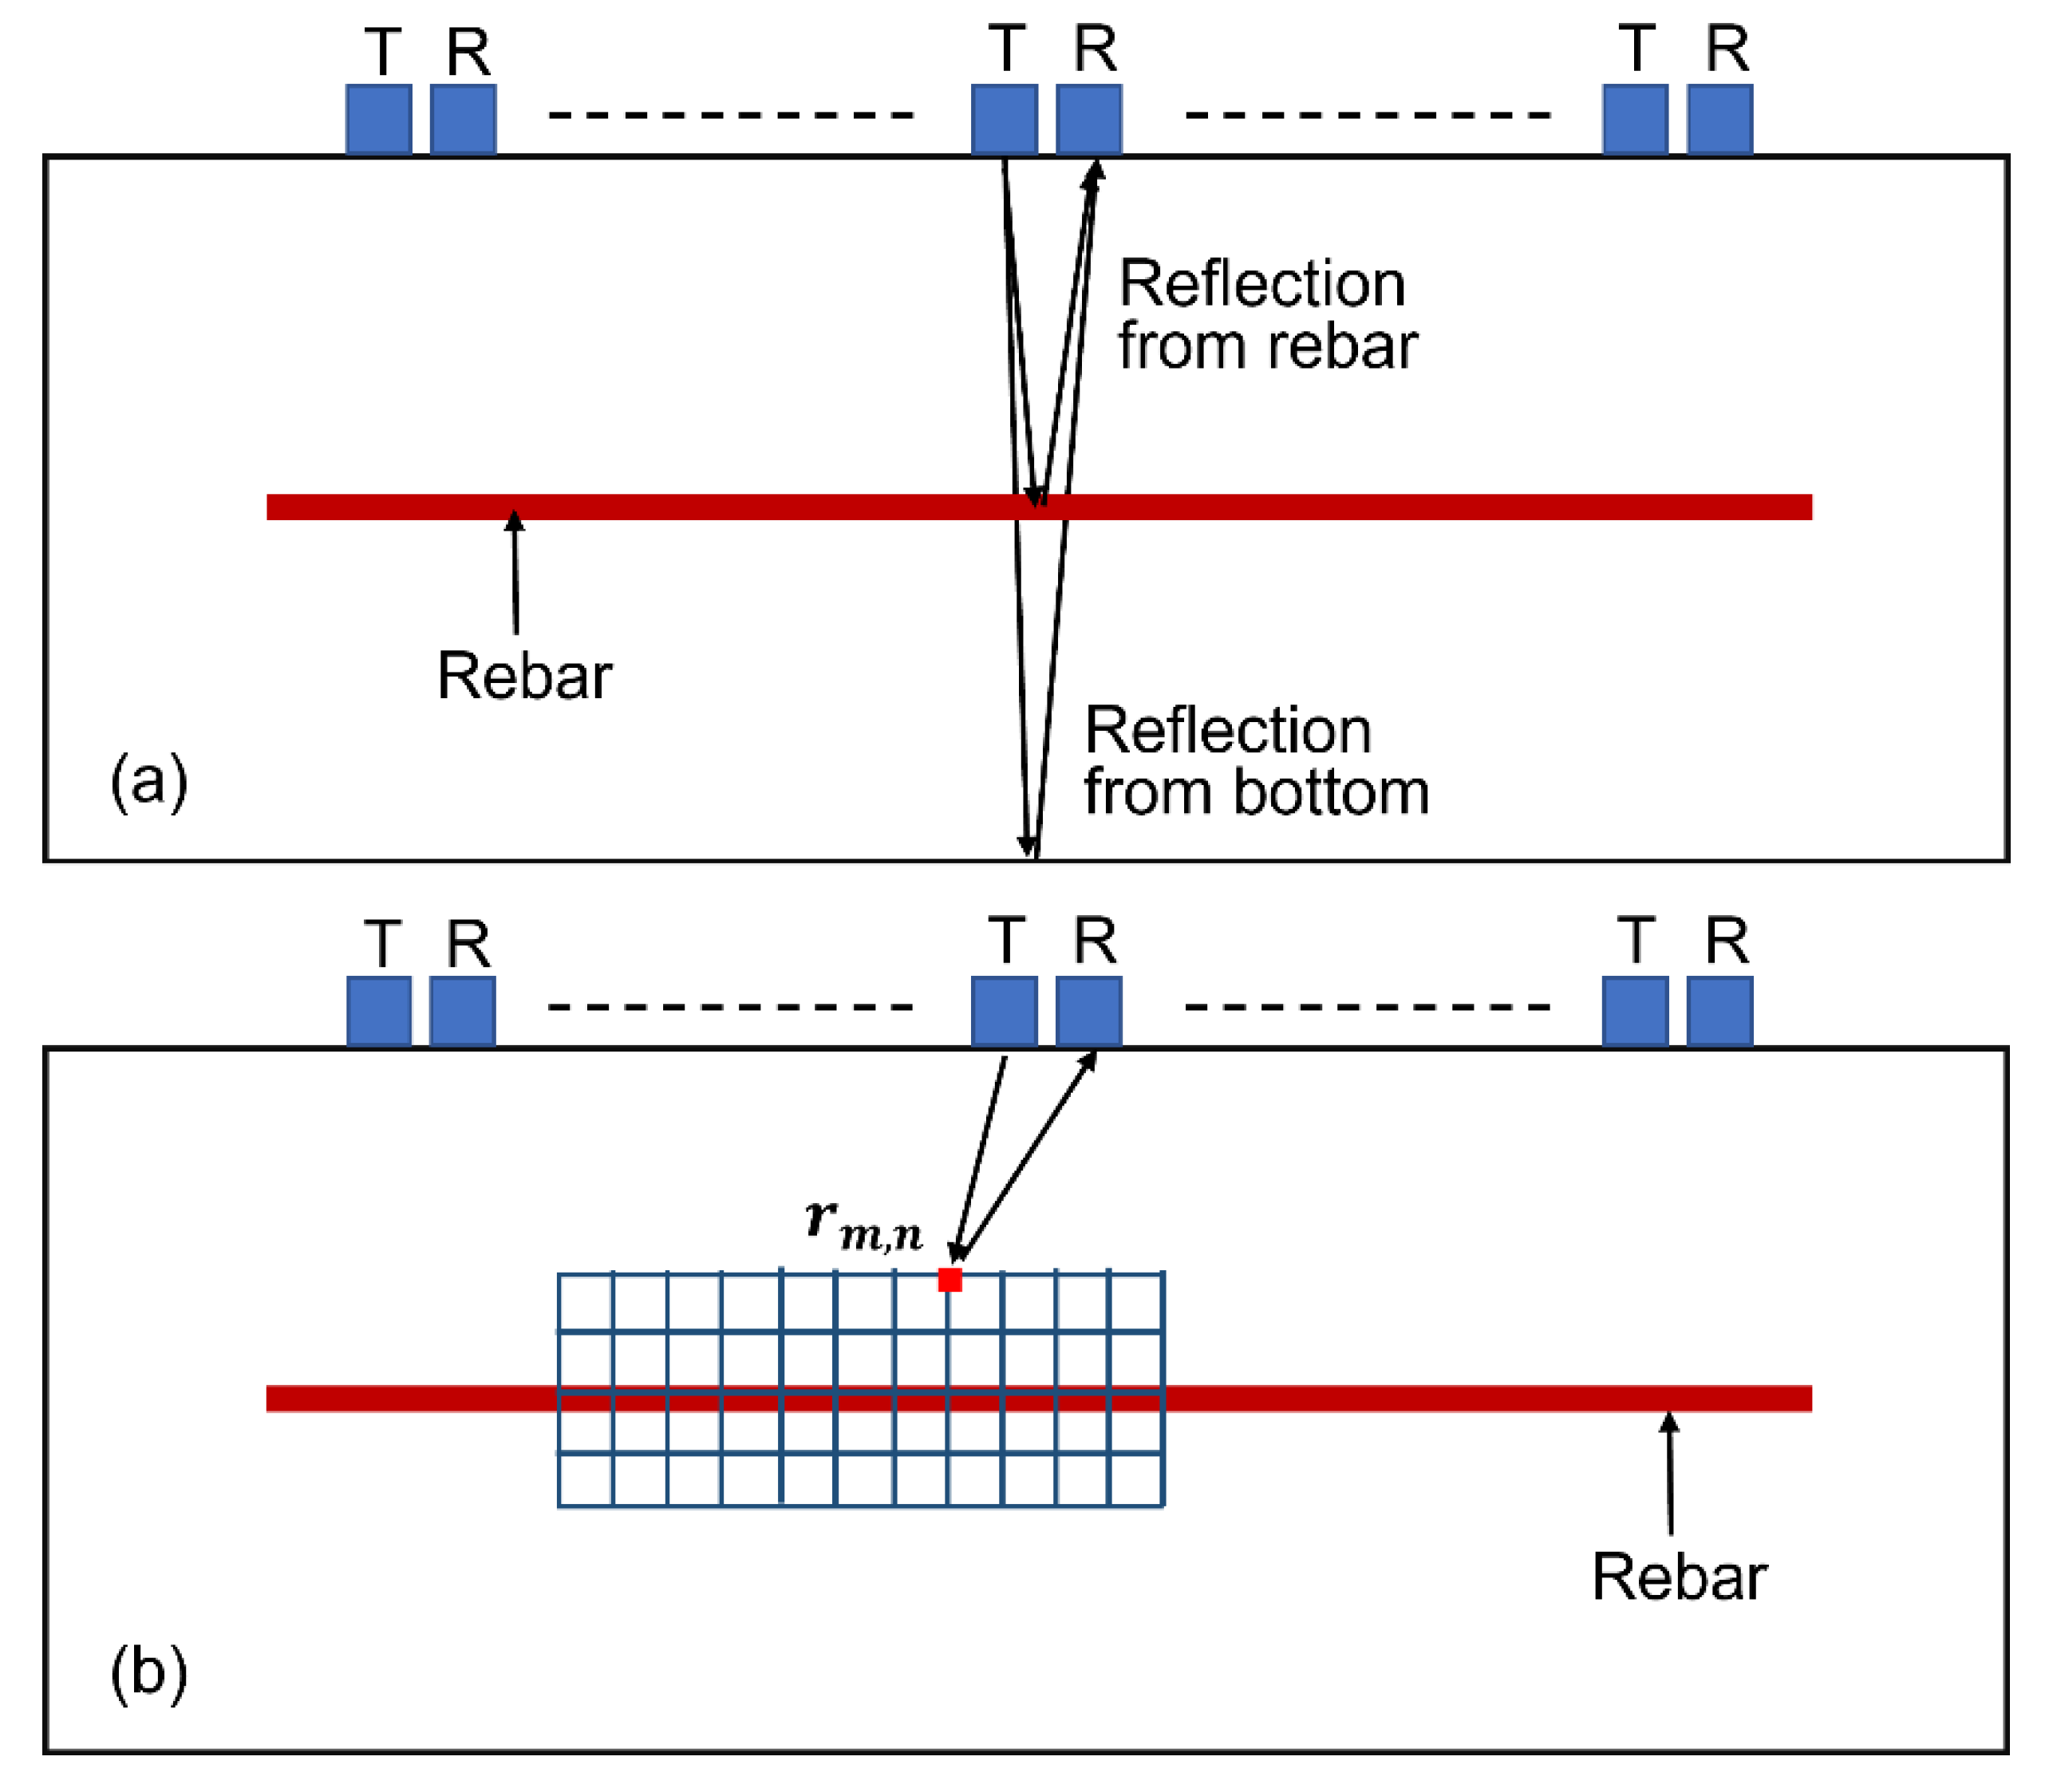
The SAFT is a time-of-flight-based technique which involves the analysis of time-domain waveforms received at various locations on the linear aperture. The implemented scanning methodology is explained in Figure 10. The transmitter (T) and the receiver (R) were moved in tied-together approach over the rebar [35,36].
The time-of-flight (TOF) of the traveling ultrasonic compressional wave, originating from the source to a subsurface point on a vertical grid and back to the receiver, was calculated through Equation (1) as:
T O F = d r T + d r R V c  
where d r T is the distance between the source transducer T i and grid point r m , n , d r R is the distance between the grid point r m , n and receiver transducer R i , T O F is the time of flight from T i to R i via the grid point r m , n , and V c is the velocity of the compressional wave.
The image value I m , n , associated with the grid point r m , n , was obtained as a sum of the contributions from the A-scans received from K source–receiver combinations, as shown in Equation (2):
I m , n = i = 1 K A i T O F
where A i t is the amplitude of the A-scan received at the receiver of the i t h source–receiver pair.

2.4.2. Vertical SAFT Images in the y–z Plane—Slabs

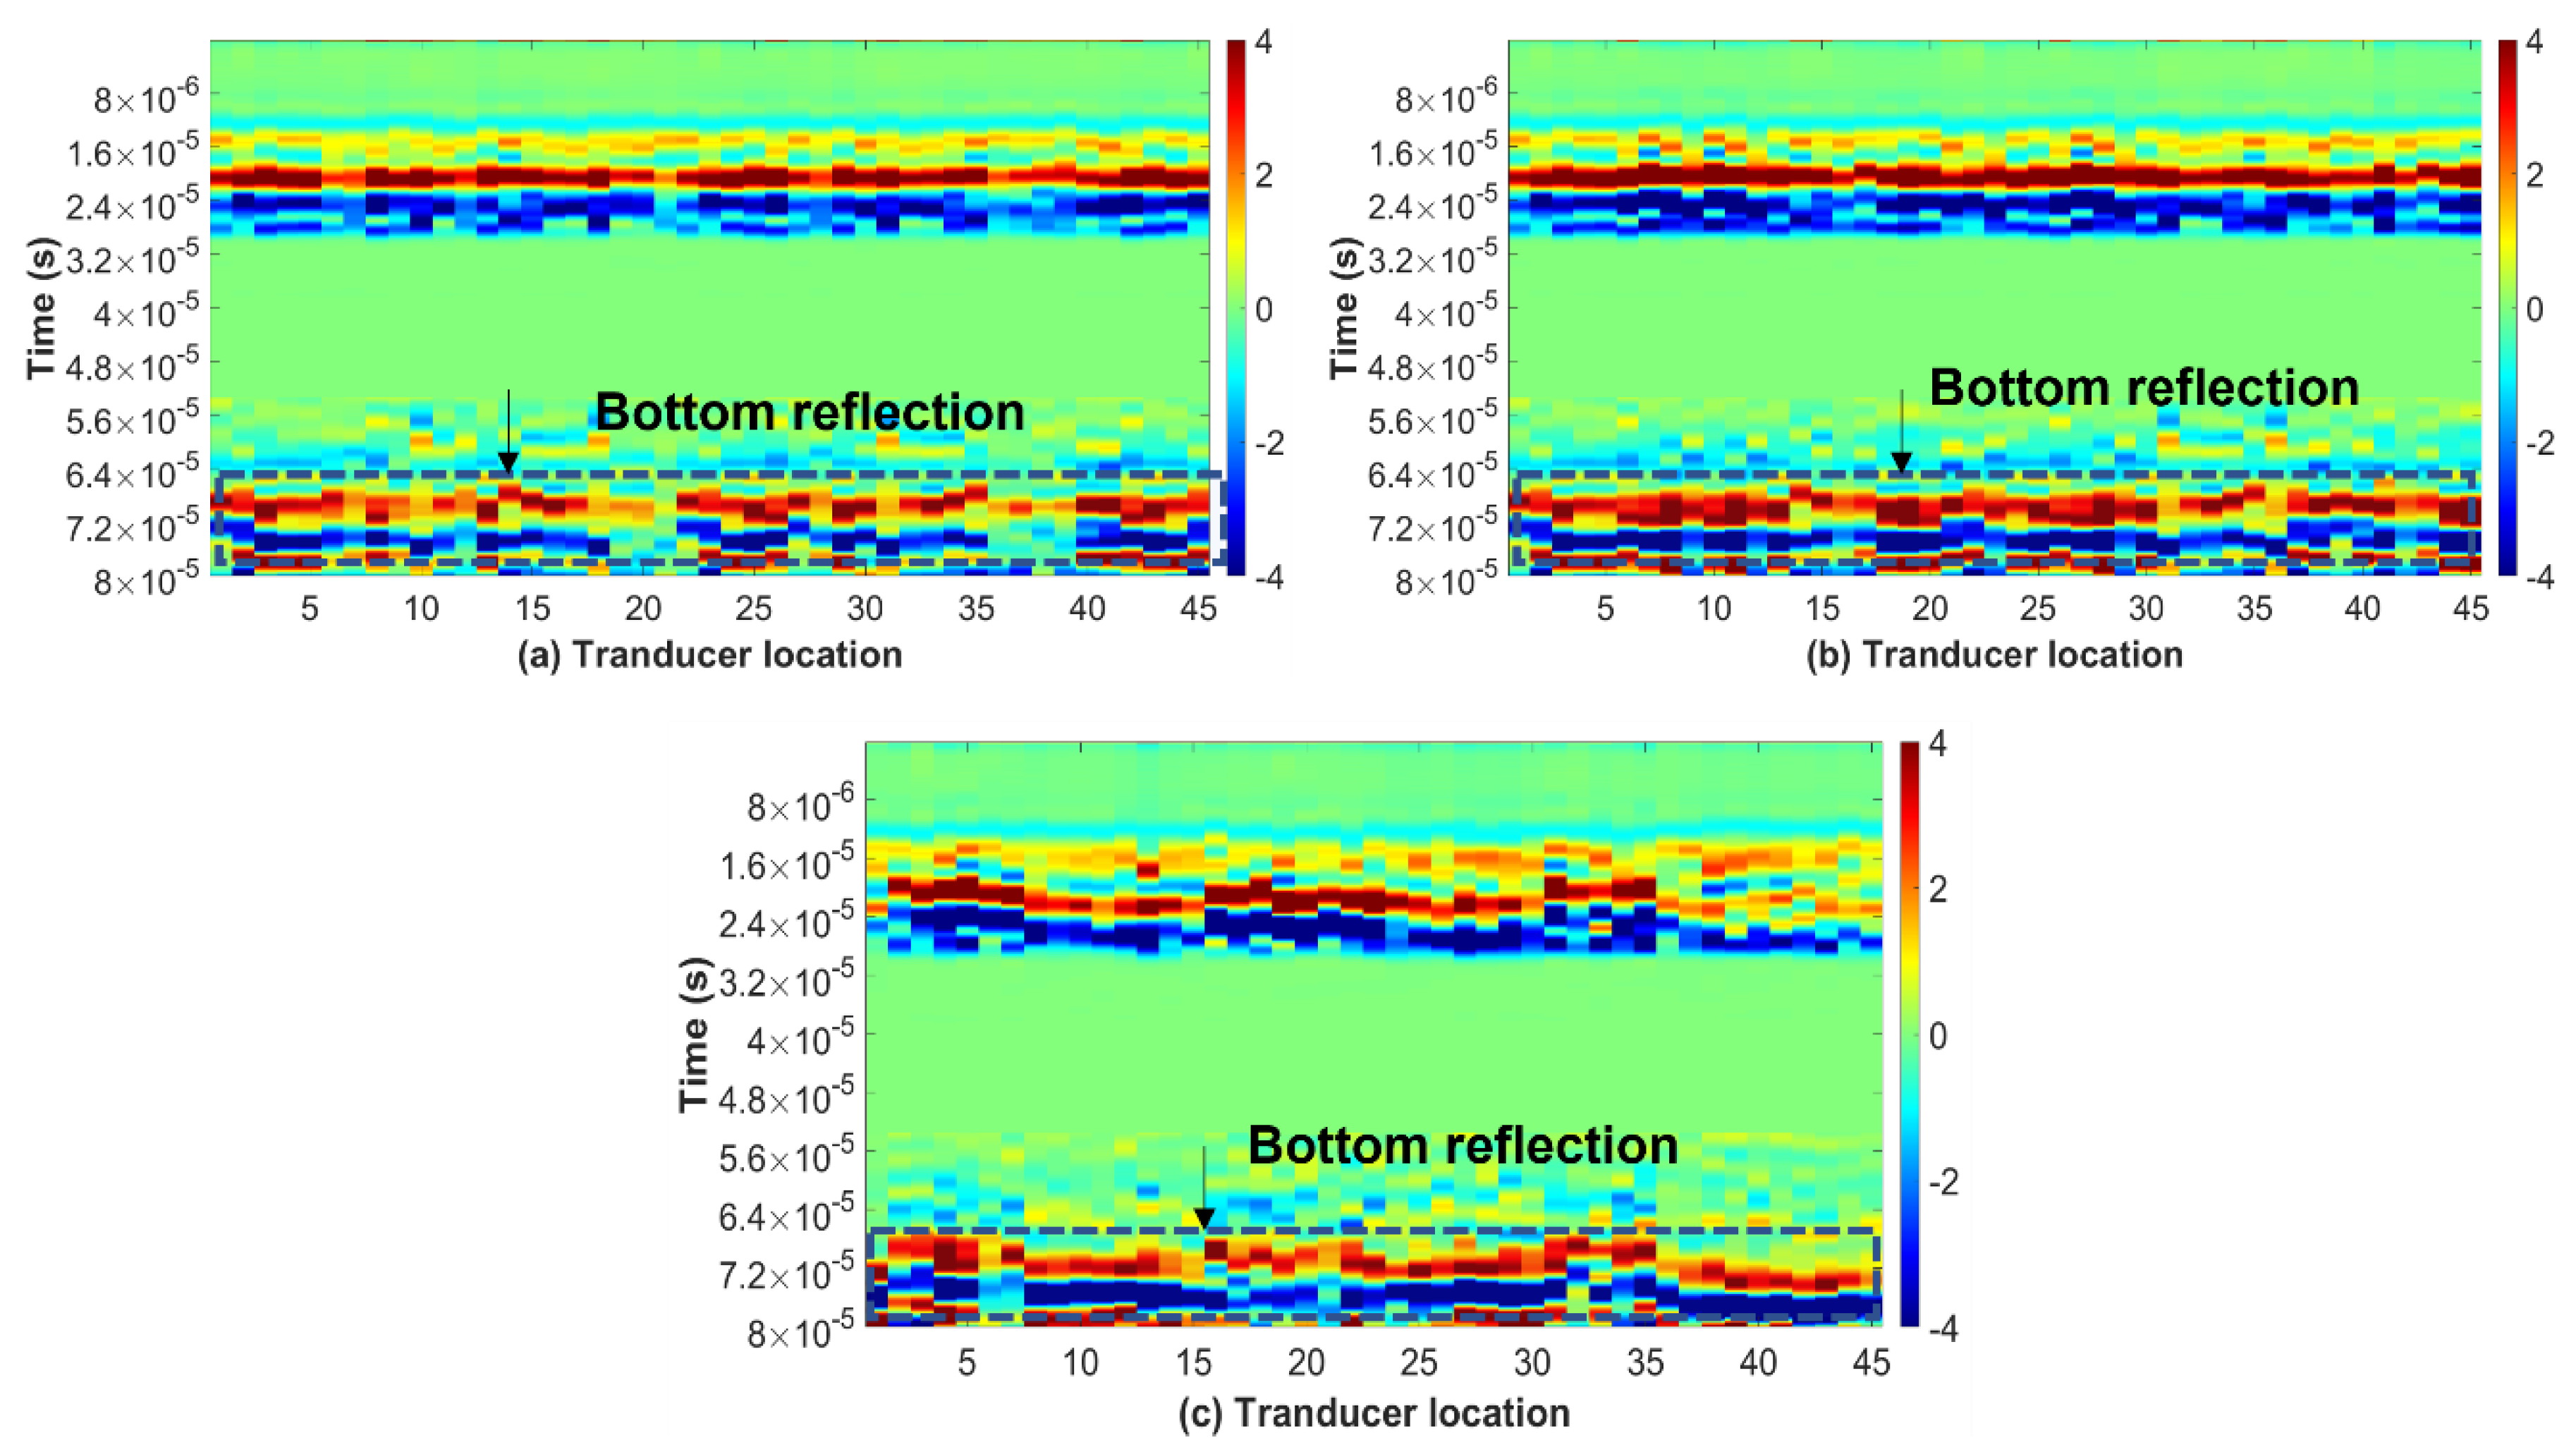
Several demonstrative B-Scans at various levels of rebar corrosion and acquired at different points in time are shown in Figure 11. The bottom reflection at all stages was approximately same, i.e., 72 microseconds. The ambient conditions were not that significant so as to cause significant change in the ultrasonic compressional wave velocity. The image corresponding to the pre-cracking stages I and III and cracked stage III depicts a similar arrival time of bottom reflection as emphasised by rectangular box (Figure 11a–c).
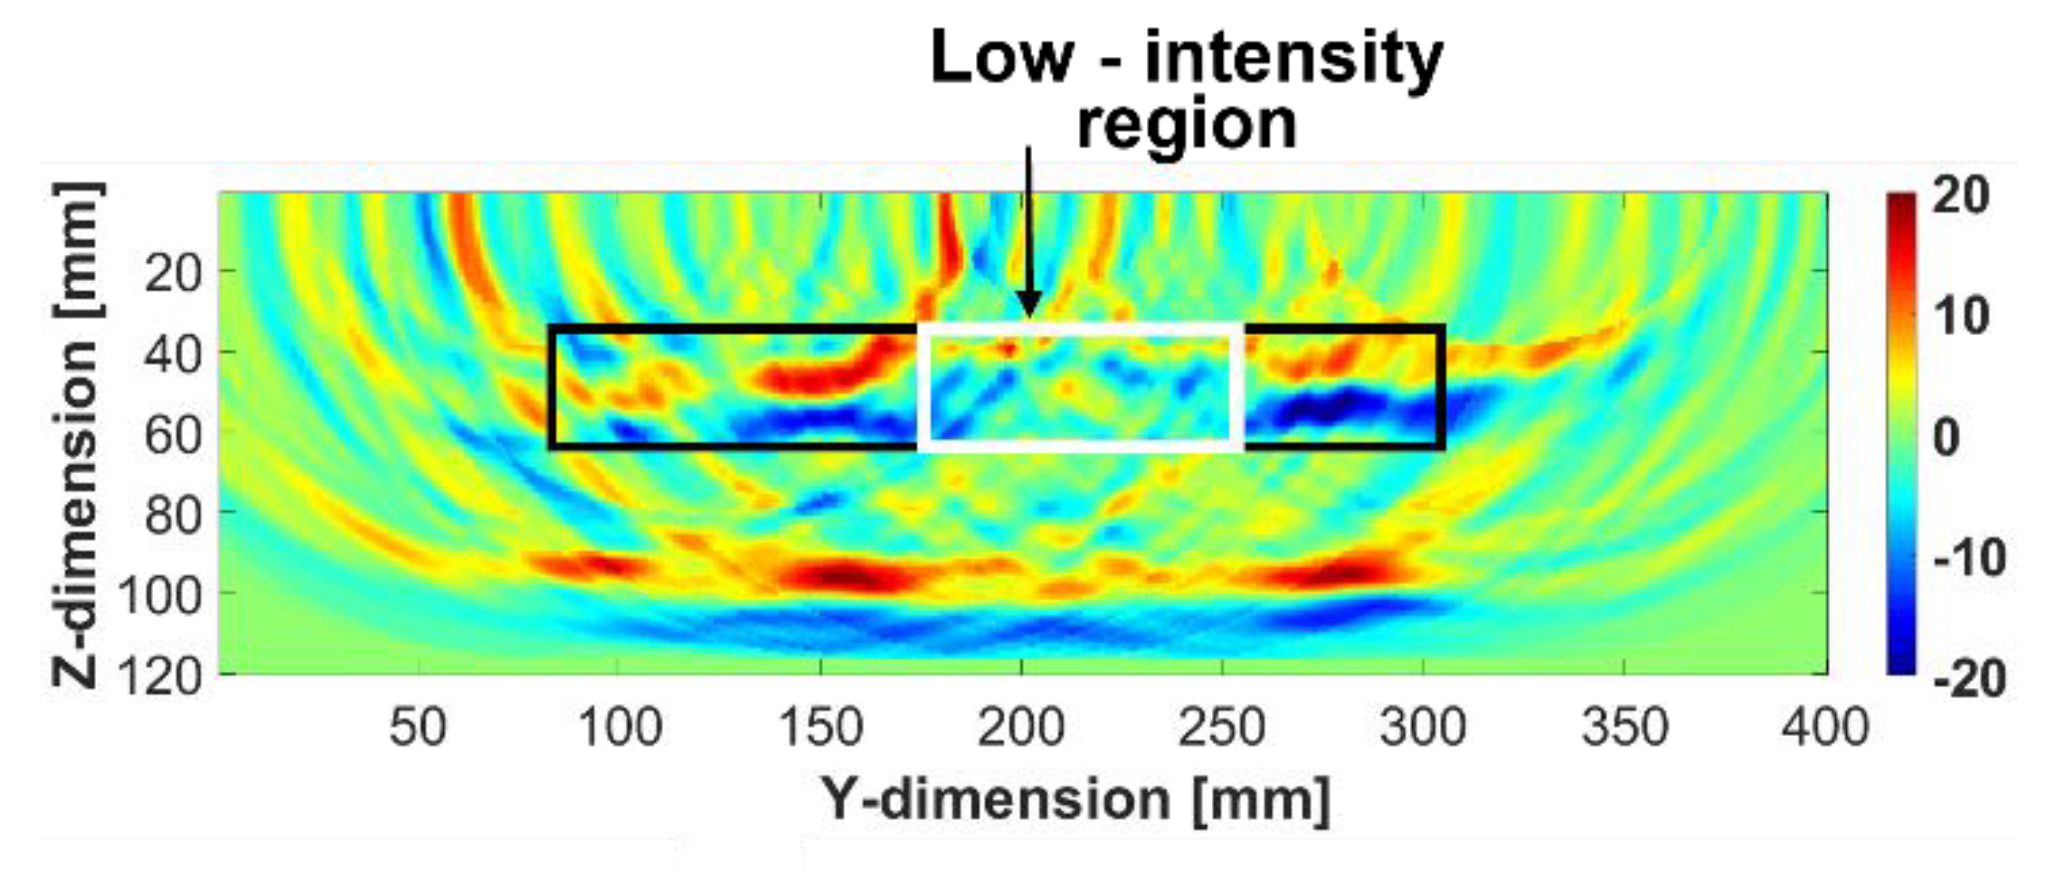
Referring to Figure 1, the images of vertical cross-sections through the rebars in slabs 1 and 2, created by SAFT, are shown and related discussions are presented in this section. The data were acquired and processed at various stages of corrosion for slab 2, and only in the post-cracked stage for slab 1 (refer to Table 2). For slab 2, the acquired A-scans were fed into the SAFT algorithm to generate the images at three stages: (a) pre-cracking stage I; (b) pre-cracking stage II; (c) cracked stage. Slab 1 is corroded continuously until cracks appeared on the surface of the specimen, in order to determine the duration after which the specimen cracks. The ultrasonic scanning on slab 1 was performed when fine surface-breaking cracks appeared. The received waveforms were normalised with respect to amplitude corresponding to initial arrival and the corresponding SAFT image of the rebar (emphasised by the rectangular area) at the cracked stage of the concrete is shown in Figure 12.
As shown in Figure 2, the accelerated corrosion of the rebar was conducted by the ponding technique over the central region of the rebar. Hence, the rebar was expected to corrode more in the central portion. The SAFT image (between 170 and 250 mm—emphasised by the white rectangle) shows lower intensity, whereas portions of the rebar away from the centre (especially between 250 and 300 mm) have brighter intensity. The weakening of the rebar image intensity is attributed to corrosion, an observation reported previously in [31,32].
For slab 2, ultrasonic scanning was performed at three stages of corrosion. The SAFT images of rebar condition at various corrosion levels are shown in Figure 13. The full rebar is visible in pre-cracking stage I, as a relatively continuous patch of positive and negative amplitudes in Figure 13a.
The width of zone 2 in the SAFT images was taken as equal to the diameter of the NaCl solution container, which was placed on the slab surface for accelerated corrosion. The remaining two portions of the image were labelled as zones 1 and 3. With progress in the corrosion activity, the rebar intensity near the centre diminished, as shown in Figure 13b. The SAFT images corresponding to the cracked stage are shown in Figure 13c, where the rebar image is significantly weak, especially in the central region, which is consistent with authors’ observations in the previously published literature [34,35].

2.4.3. Vertical SAFT Images in the y–z Plane—Beams

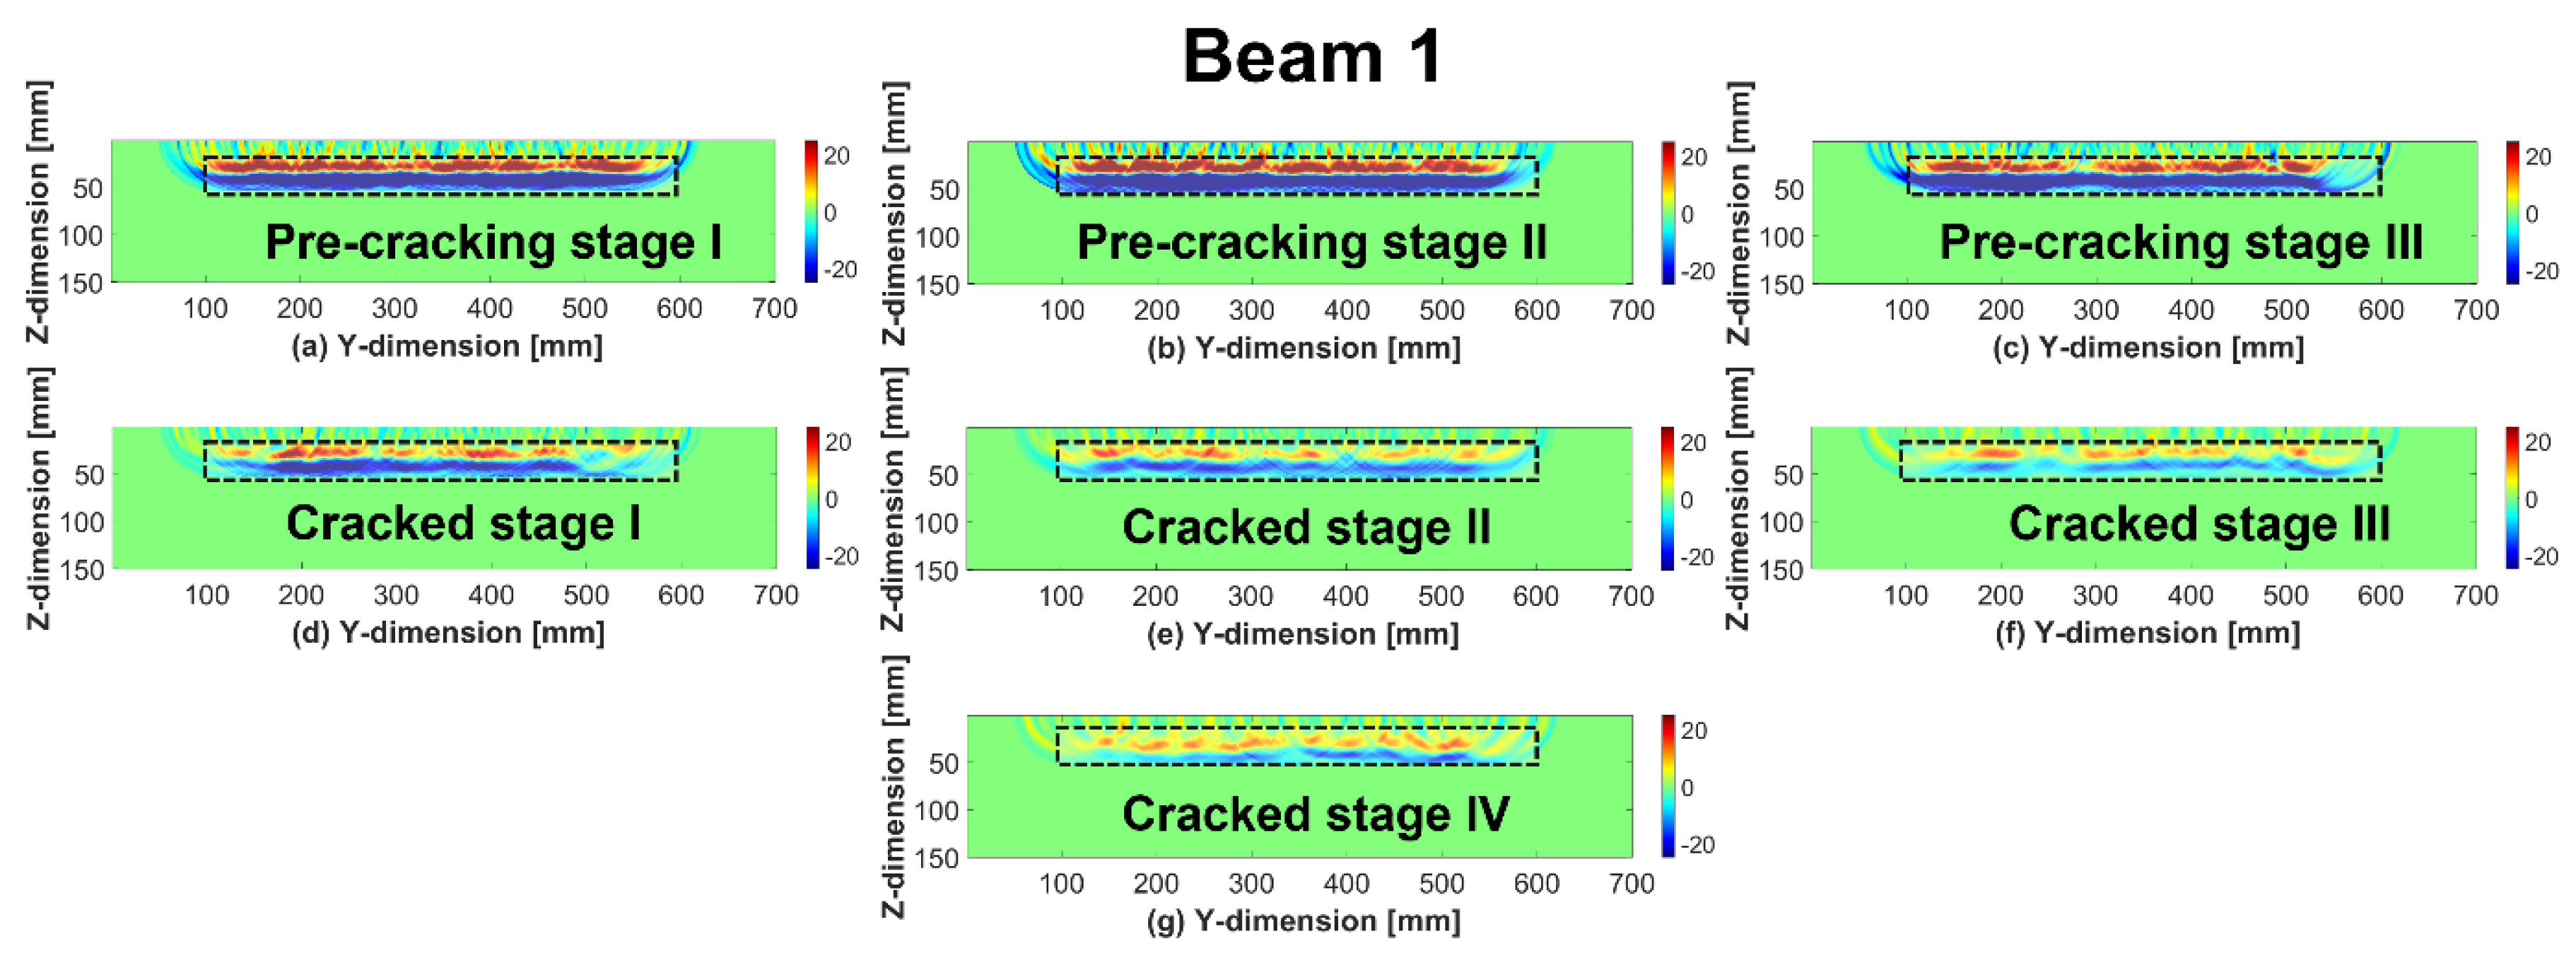
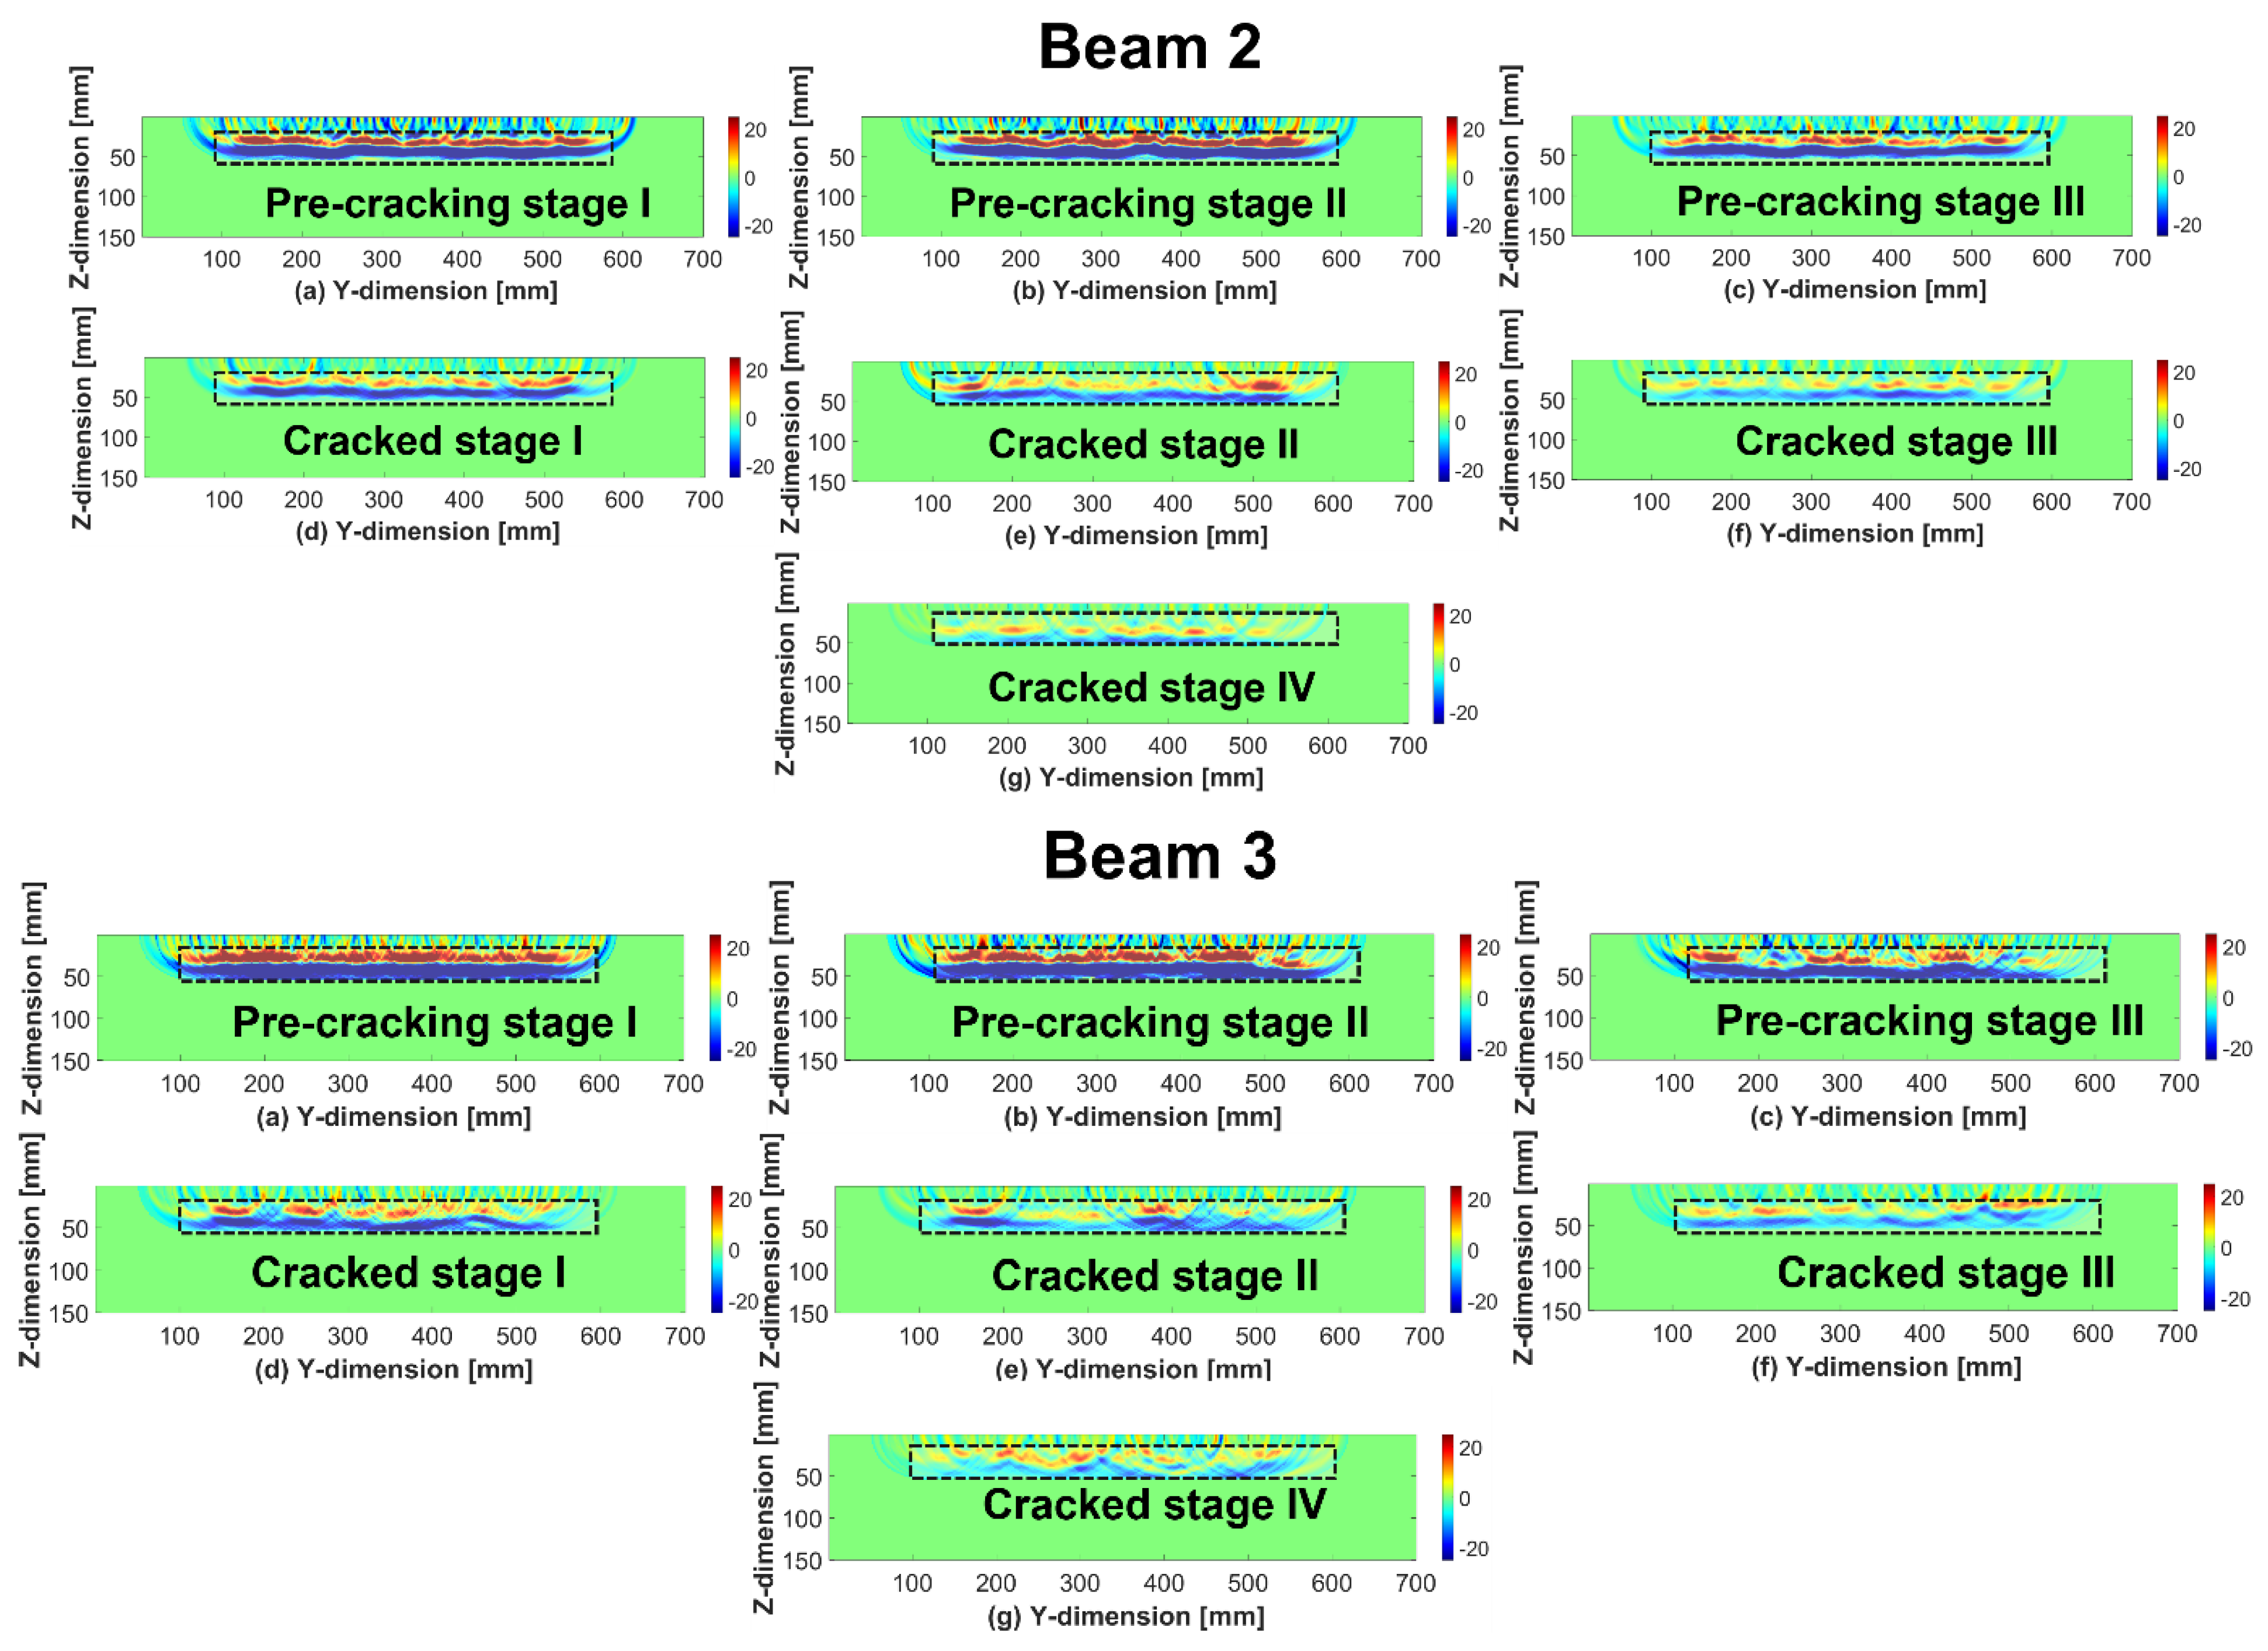
The SAFT images of the rebar in beams 1, 2 and 3 at various levels of corrosion are shown in Figure 14. The image corresponding to pre-cracking stages I and II (Figure 14a,b) depict a continuous patch of positive and negative amplitudes at the depth where the rebar is located.
There was a decrease in the intensity of the positive intensity in the image from pre-cracking stage III (Figure 14c). After 3 days of accelerated corrosion, a crack emerged on the side surface of the specimen (Cracked Stage I; Figure 6a) and the red (positive image value) and blue (negative image value) patches begin to fade from the SAFT image (Figure 14d). In cracked stage II (Figure 14e) the amplitude of the image intensity further decreases. In cracked stages III and IV, the pixel values are reduced even further (Figure 14f,g). The reason may be attributed to attenuation and scattering of the incident compressional wave, due to rebar corrosion during the accelerated corrosion process. Therefore, the phenomenon of rebar disappearance in the SAFT images can be considered as a diagnostic indicator of corrosion activity in concrete structures.

3. Statistical Classification

In this study, for corrosion severity classification, we propose two methods, (a) Mahalanobis distance (MD) and (b) linear discriminant analysis (LDA), for analysing the rebar signature in the SAFT images and assess the level of severity of the corrosion damage. We present a brief description of the classification methodology and model development in the subsequent subsections.

3.1. Mahalanobis Distance

Mahalanobis distance (MD) measures the distance between a test point in n-dimensional space and a reference cluster. This approach was used to classify image data matrices in this study. The reference data distribution was characterised by mean μ and the covariance matrix Σ and the test data were denoted by Y . The Mahalanobis distance is calculated as [49]:
MD =   Y k μ p   T Σ p 1 Y k μ p
where MD is the Mahalanobis distance; Σ p is the covariance matrix = S j p μ p T S j p μ p ; S j p is the j-th column from the p-th reference image matrix of size M × N ; μ p is the mean vector of the p-th reference image matrix of size M  × 1; and Y k is the k-th column of test image matrix of size M × N .
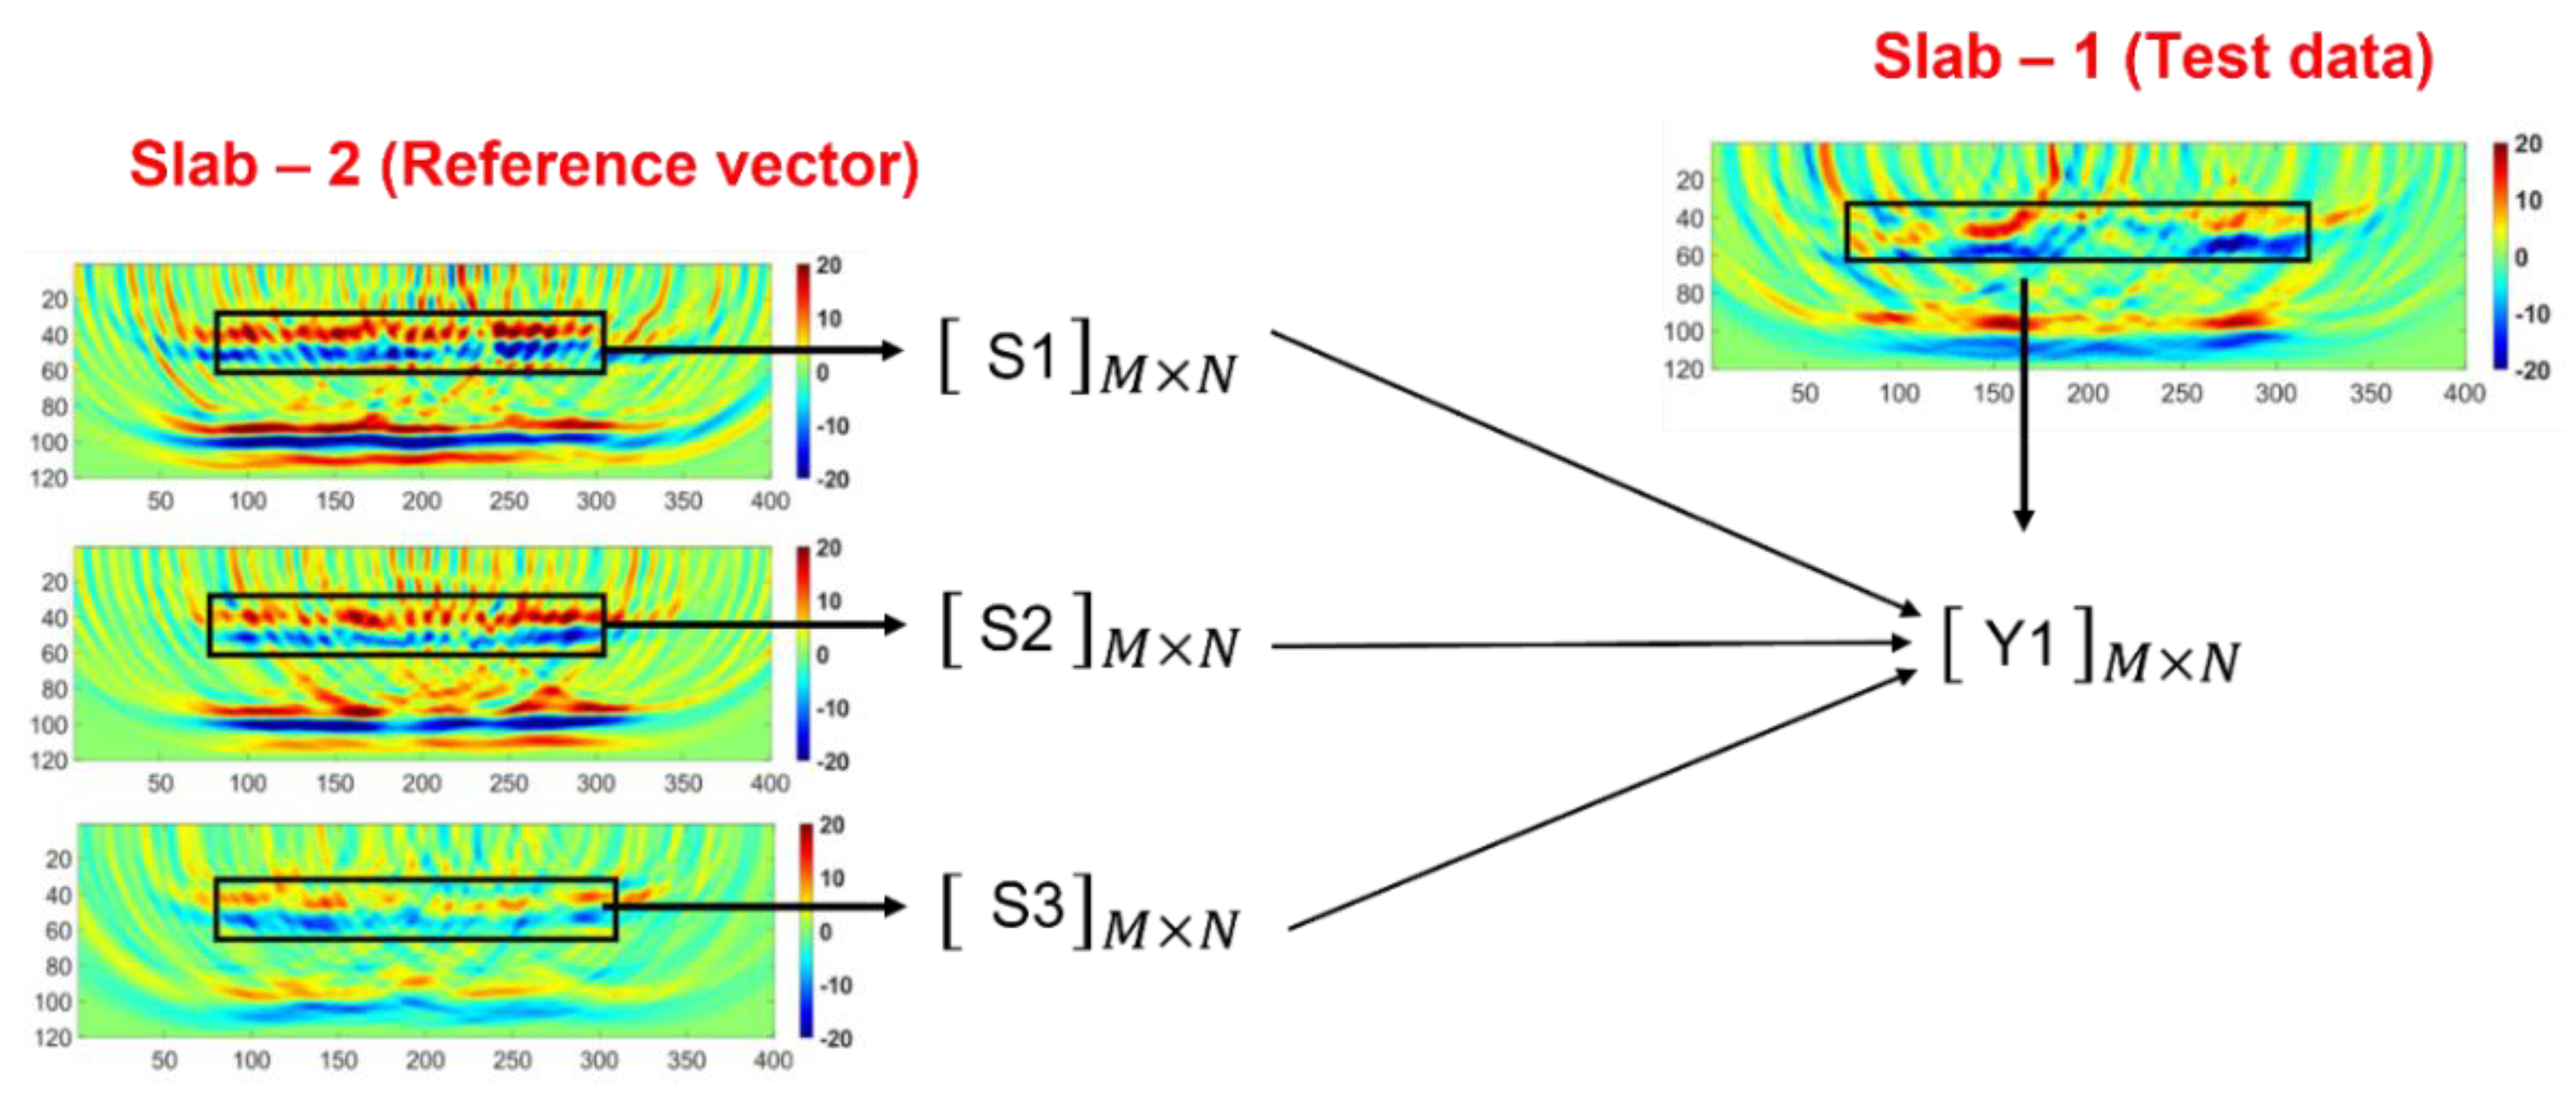
A schematic representation of the calculation adopted in this study is shown in Figure 15. For severity classification, the MD was calculated by considering the rebar signature in the SAFT image (Figure 12) from slab 1 at the cracked stage as the test data and the individual rebar image data at various levels of corrosion in slab 2 as reference vectors. The MD between each column of the test matrix of size M × N and each column of the M × N reference image matrix (emphasised by the boxes) was calculated. The mean and standard deviation of the MD values were further calculated to establish the similarity between the image matrices.
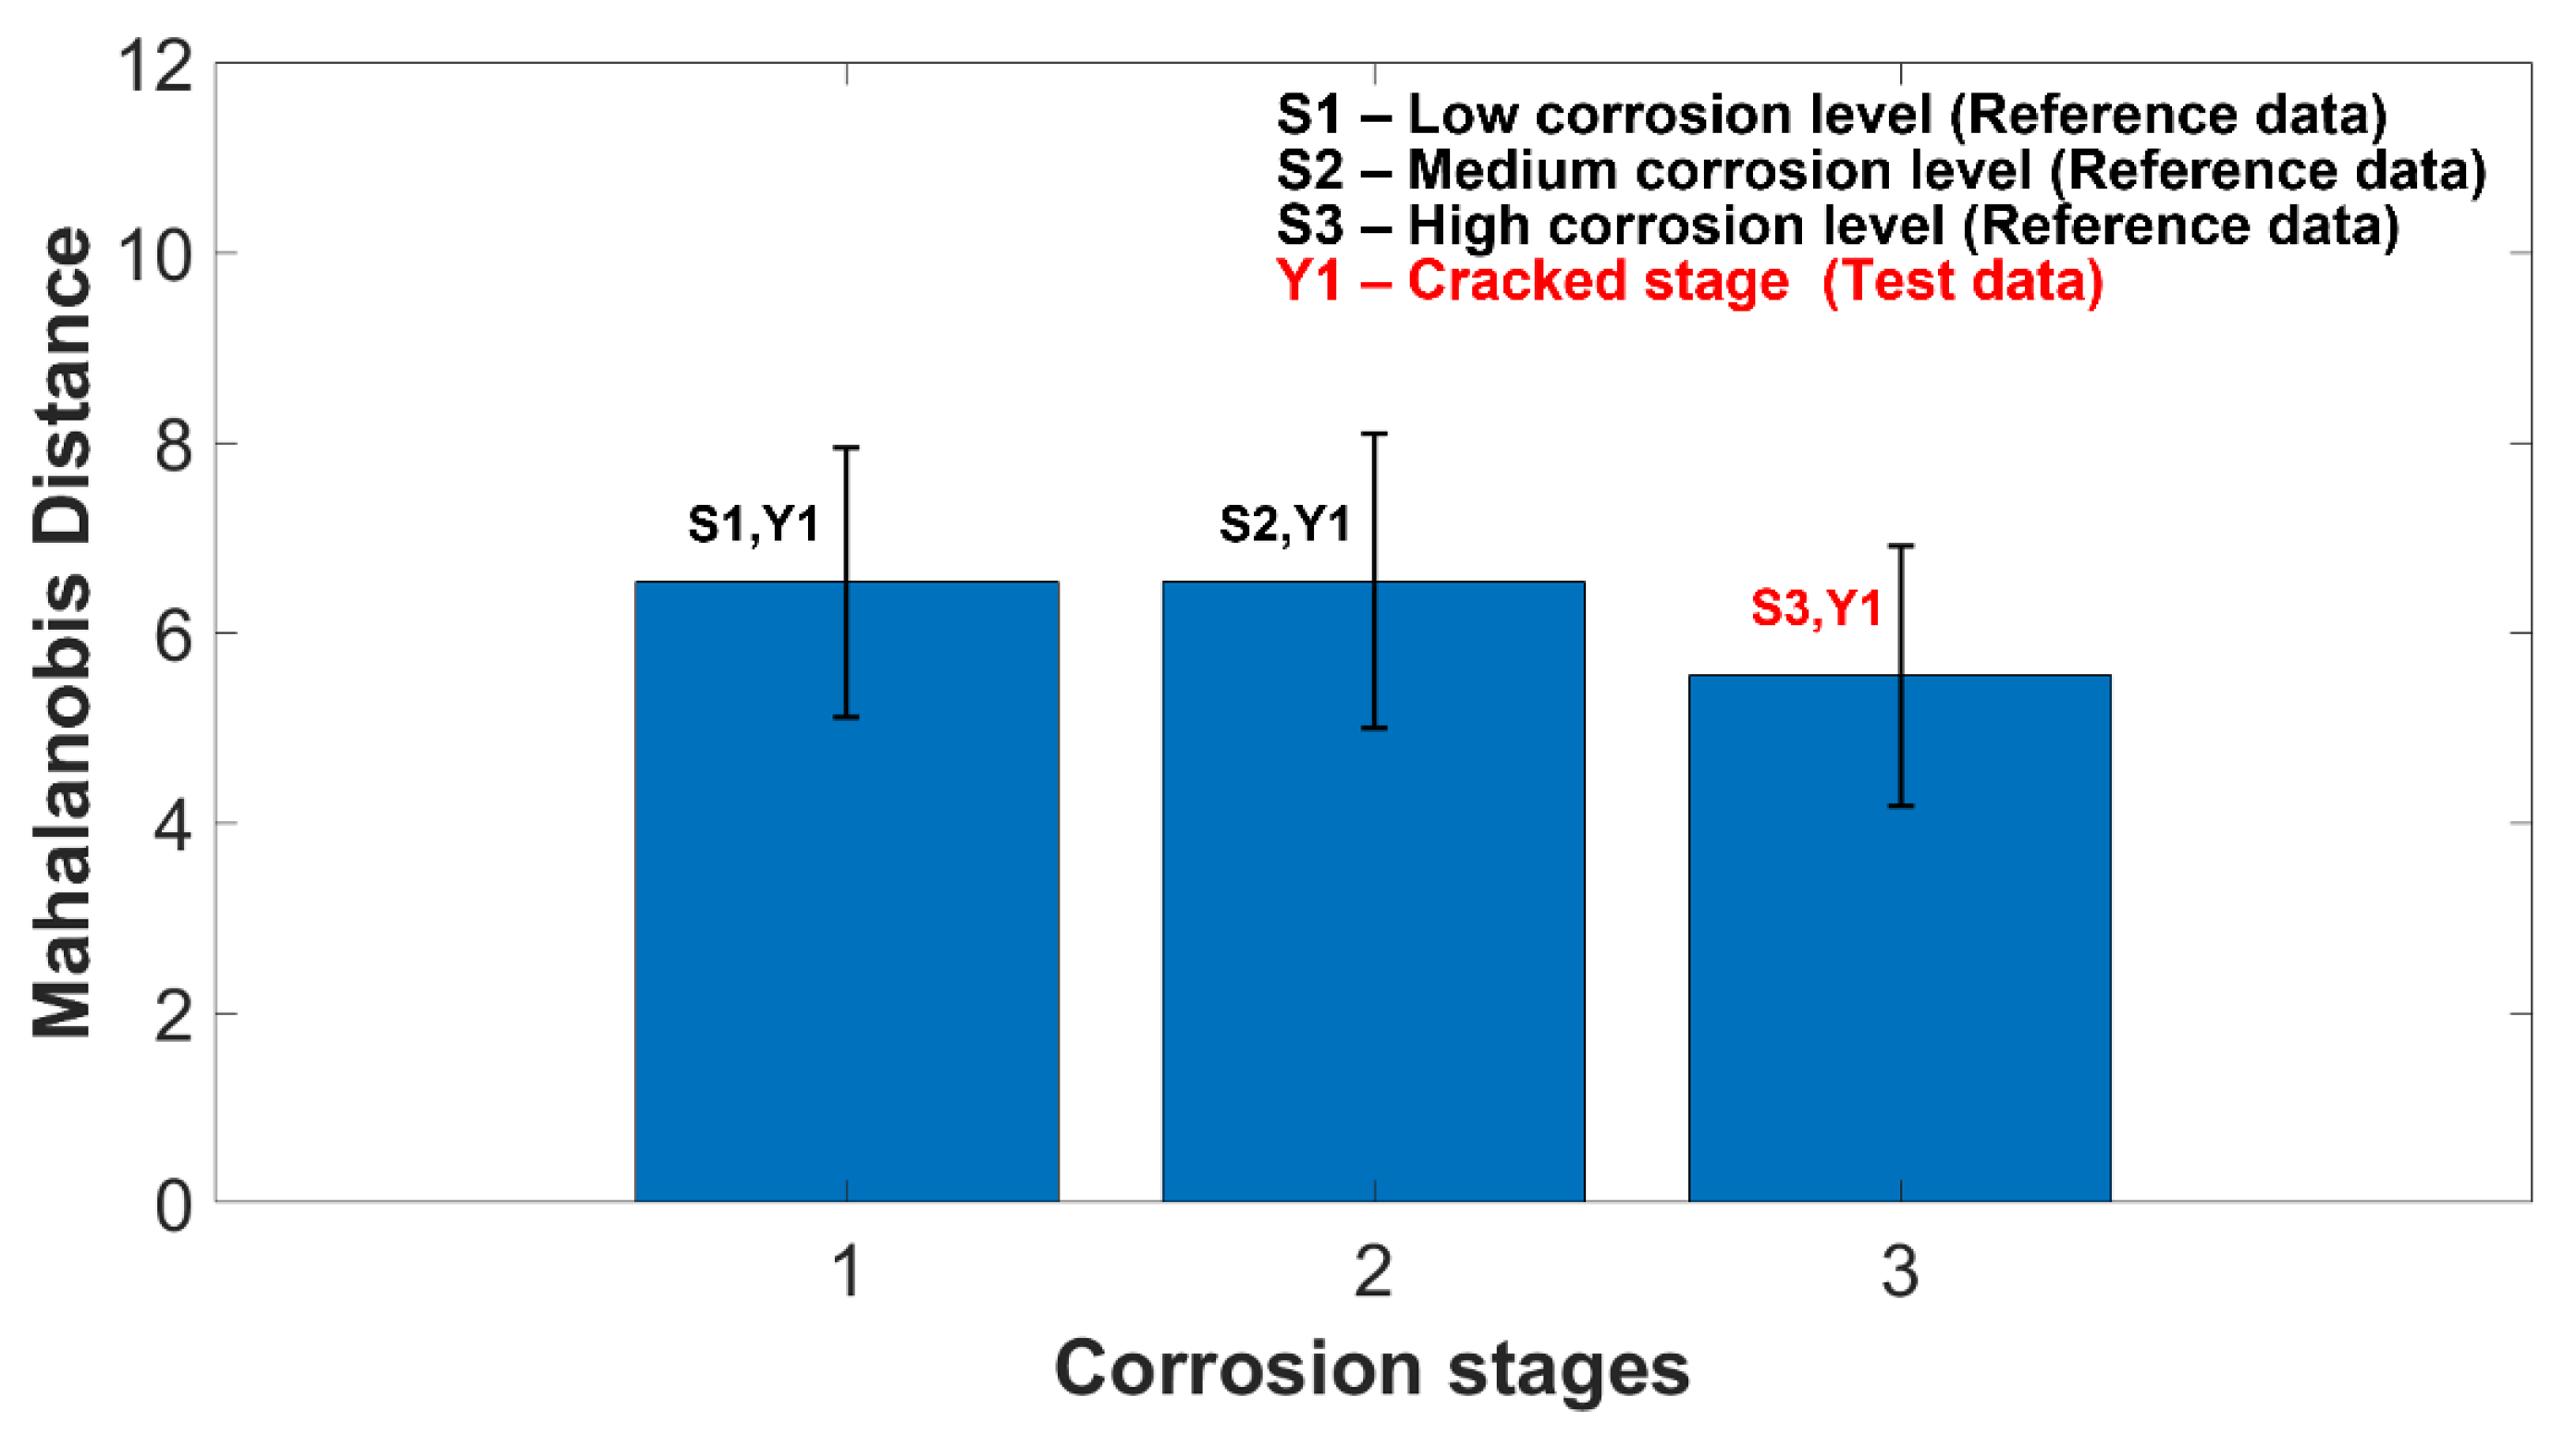
The reference matrices are labelled as S1, S2, and S3, and the test is labelled as Y1, respectively. The MD values were calculated between the columns of reference matrices (S) and the test data set (Y) according to Equation (3) and presented in Figure 16. The mean and the standard deviation of the calculated MD values are presented for further analysis.
From Figure 16, it is observed that the similarity between Y1 is high with S3 (i.e., the cracked stage image of slab 2), because the mean MD value is the lowest. The average MD values are higher for the other two cases indicating lesser similarity. The error bar represents the one standard deviation of MD values. Therefore, the condition of slab 1 is classified as one with “high corrosion level” class.
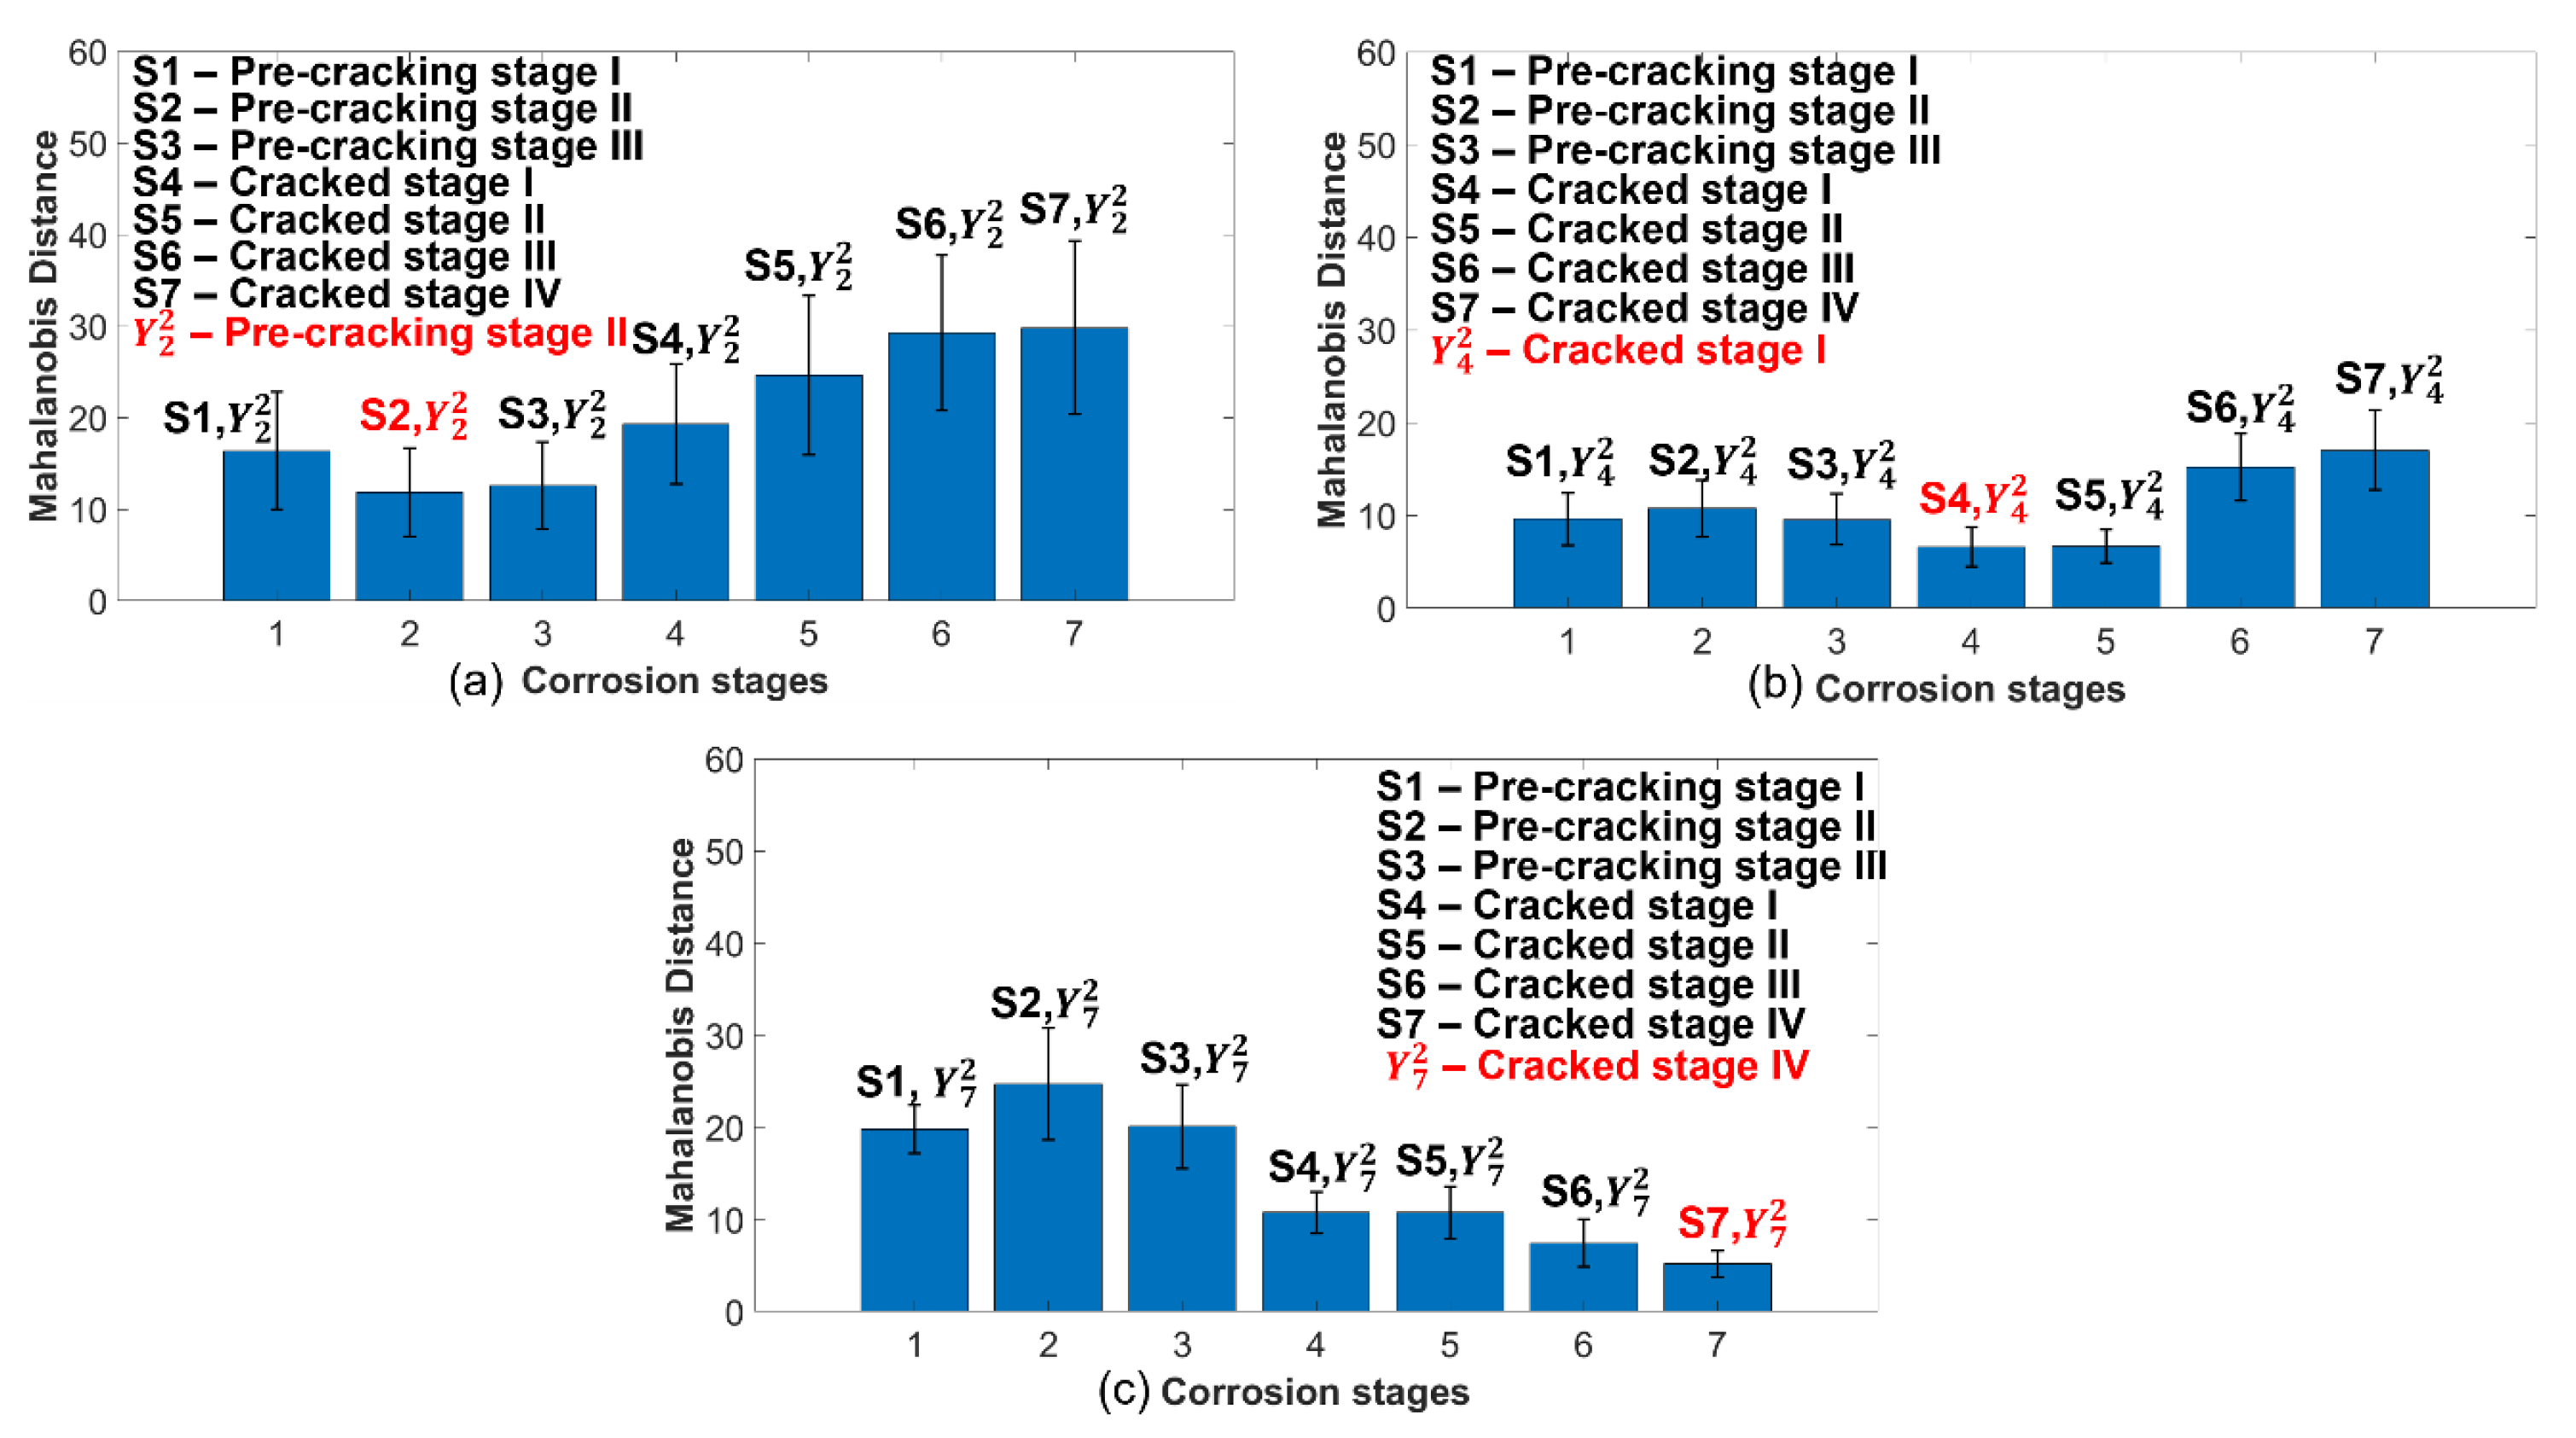
The rebar signatures extracted from the SAFT images of beam 1 were used as reference matrices (S1 to S7) and the remaining data from beams 2 and 3 were considered as test data matrices. The nomenclature for test data is Y m n , where m refers to corrosion stage and n refers to beam specimen number. Three representative test values were considered from beam 2: Y 2 2 (pre-cracking stage II), Y 4 2 (cracked stage 1) and Y 7 2 (cracked stage IV). Similar test data vectors were considered from beam 3. As observed in Figure 17a, the mean MD between Y 2 2 and S2 was the lowest, indicating “low level corrosion”.
Similarly, in Figure 17b, the similarity between Y 4 2 (cracked stage I) and S4 was the highest and the corrosion affliction may be classified as “medium level corrosion”. After 6 days of corrosion, i.e., cracked stage IV ( Y 7 2 ) , it was classified as “high level corrosion” due to high similarity with S7, as shown in Figure 17c.
The test vectors extracted from beam 3 at various level of corrosion were similarly compared with the reference vectors, and a similar trend as beam 2 was observed as shown in the Figure 18.

3.2. Linear Discriminant Analysis

Linear discriminant analysis is a simple supervised classification method, in which the data are assumed to follow the multivariate normal distribution. In this study, the mathematical and algorithmic development followed the procedures presented in [55].
The flowchart in Figure 19 is a brief description of the LDA technique, adopted in this study. First, the feature vectors (maximum and minimum amplitudes from every column within zone 2 (i.e., the middle rectangular box) were extracted from the SAFT images at various levels of corrosion. After extraction, the linear discriminant boundaries were calculated to classify the data, based on three levels of corrosion, i.e., “low corrosion level”, “medium corrosion level”, and “high corrosion level”. The choice of three classes was logically based on the fact that, for slab I, data were acquired at two pre-cracking stages I and II, and at one post-cracking stage. The corrosion levels were named as low, medium, and high.
Once the classification boundaries were obtained using the LDA algorithm, a new data set was tested to check whether the severity of corrosion was correctly identified. The accuracy of the classification was expressed using a confusion matrix. The details of the results are presented in the next section.

3.3. Image-Based Corrosion Classification

The classification of corrosion severity in each RC slab was achieved through analysis of the rebar signature within the SAFT images at various levels of corrosion. This is discussed in the following subsections.

3.3.1. Corrosion Severity Classification—Slabs

As explained in the flowchart, the LDA model was developed using zone 2 data from slab 2 as training data and three classes were defined as “low corrosion level”, “medium corrosion level”, and “high corrosion level”, as shown in Figure 20.
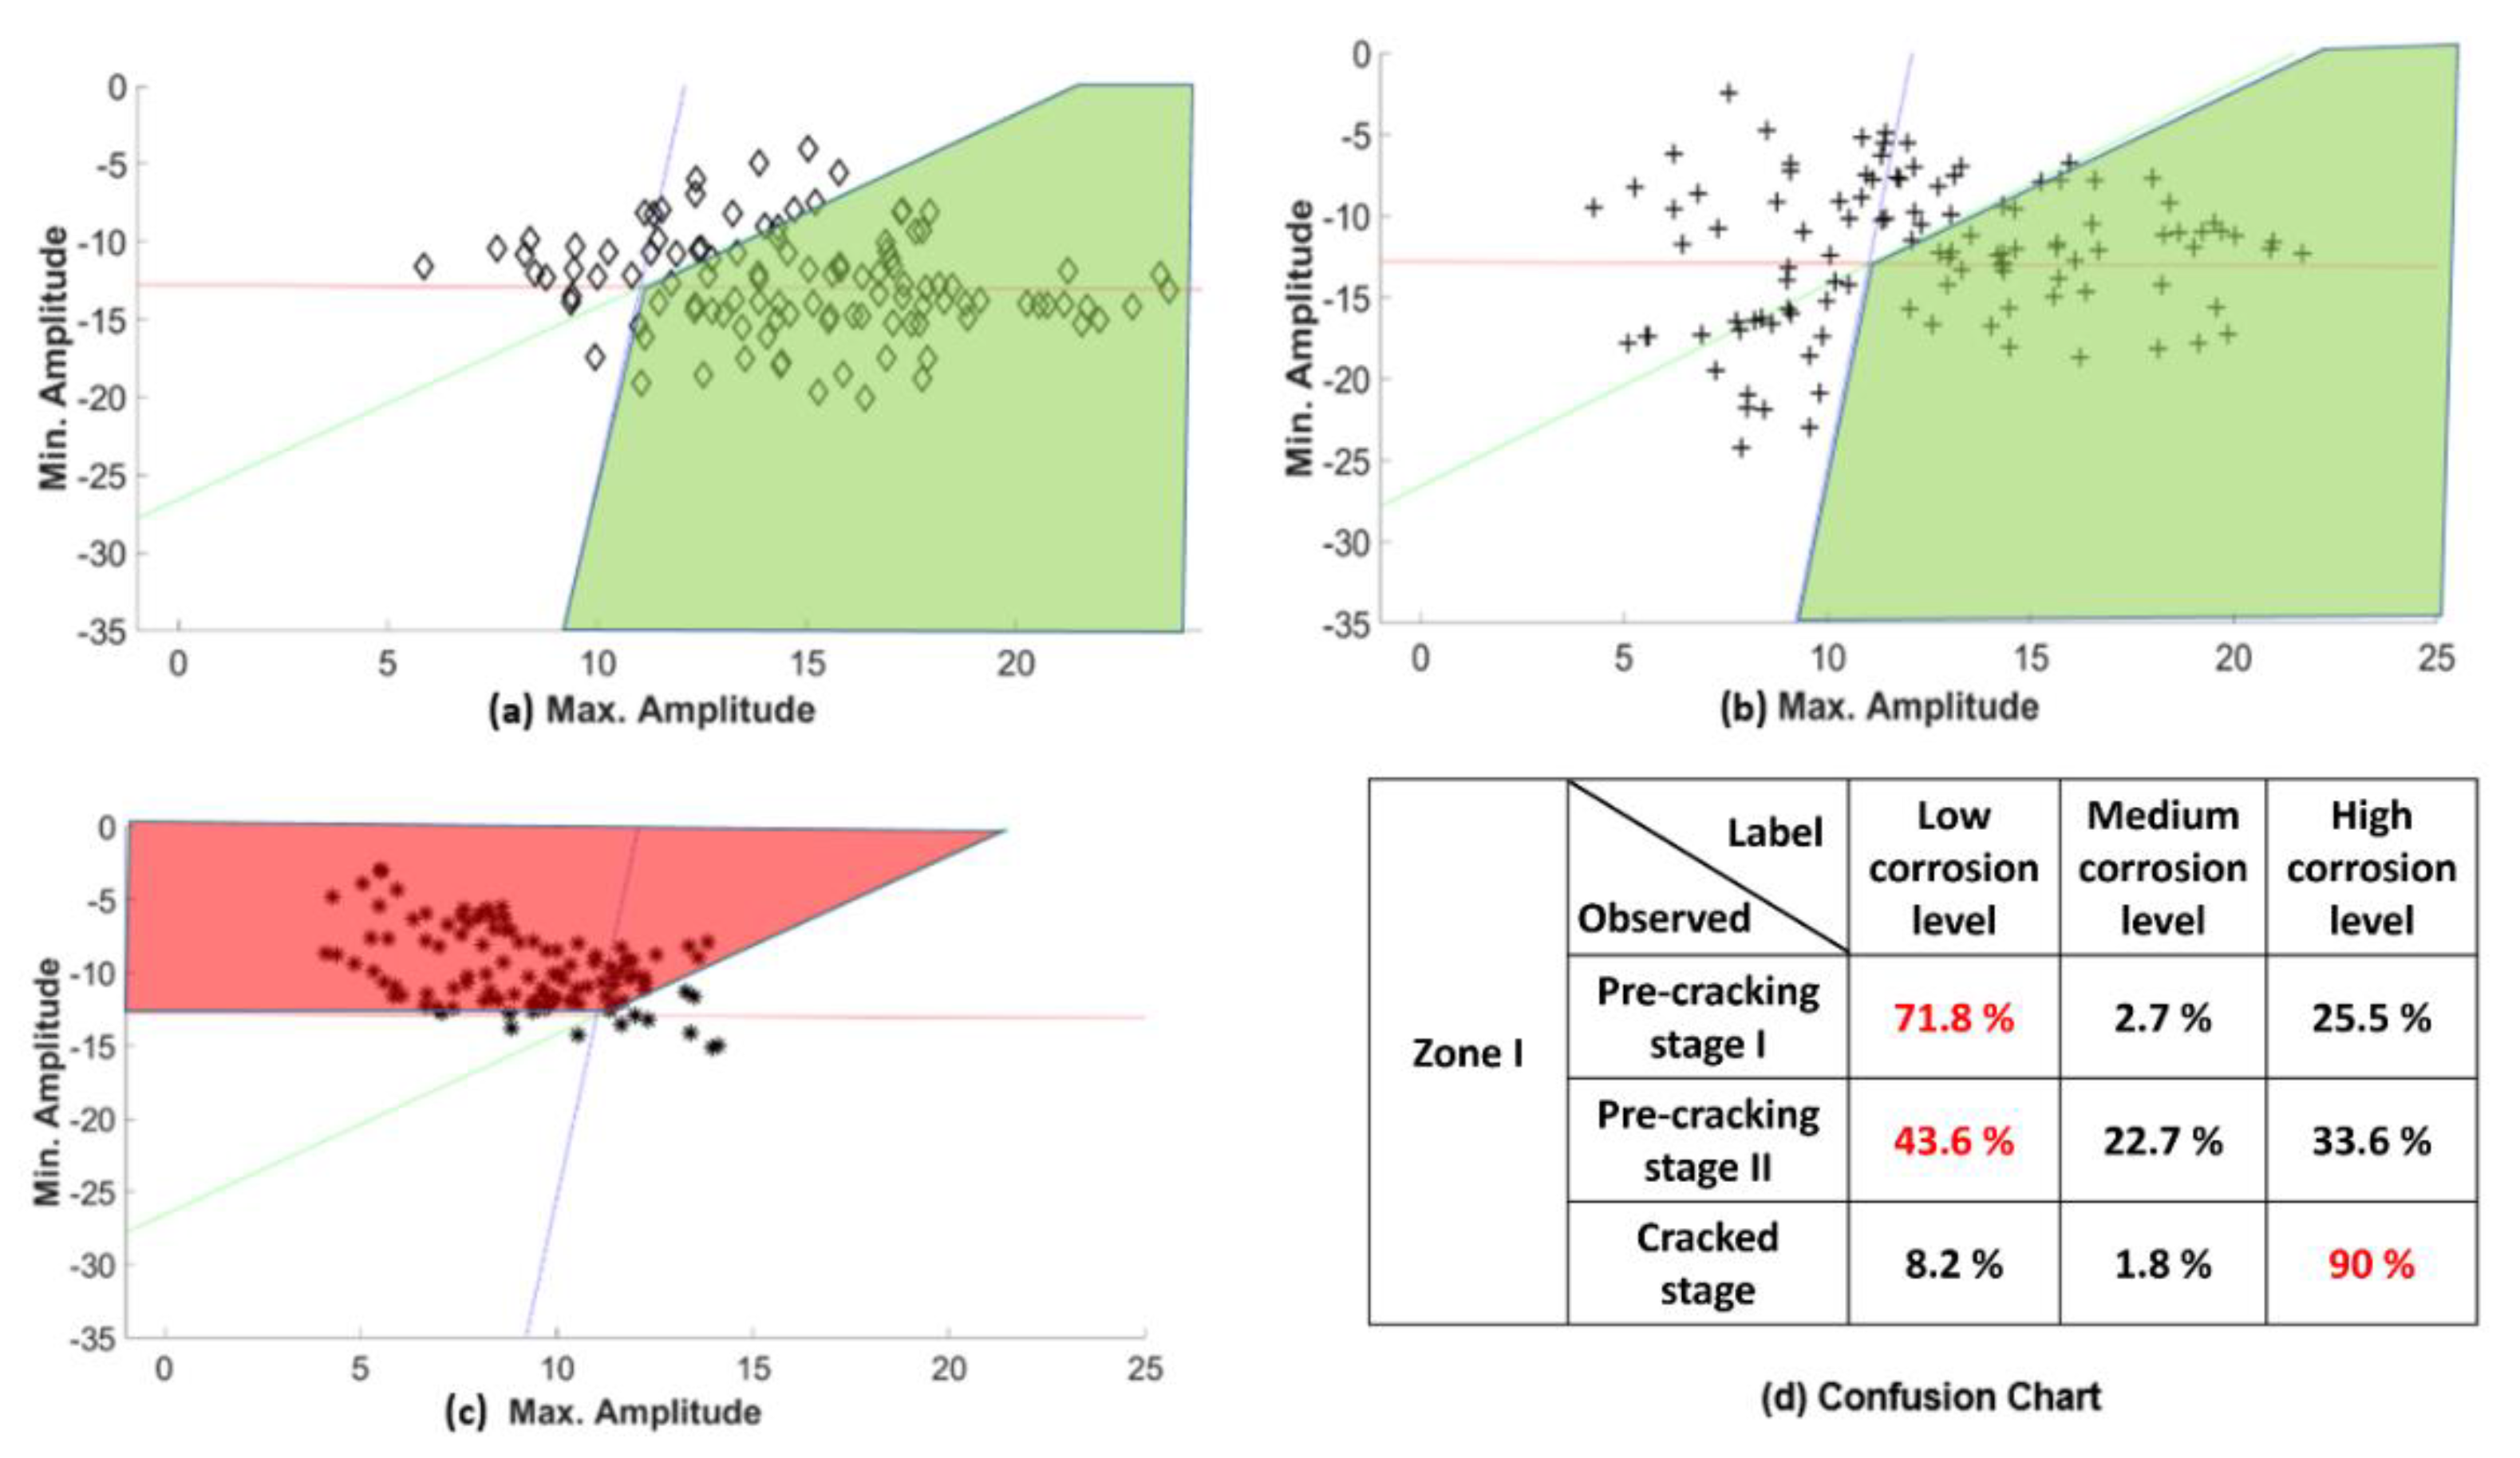
Referring to Figure 20a, it is observed that the feature vector values are delineated into various zones and associated with the defined classes, which is summarised in the confusion chart shown in Figure 20b. The percentage of the feature vector values corresponding to pre-cracking stage I, associated with “low corrosion level”, is 78.3%. A similar observation can be made about the feature vector belonging to the other stages of corrosion, which show that the classification is correctly performed by the algorithm. Once the LDA-based classification boundaries were developed, the feature vectors from zones 1 and 3 of slab 2 at various corrosion levels were examined (please refer to Section 2.4.2 and Figure 13). The classification of this test data set and the confusion matrix is shown in Figure 21.
The zone I feature vectors of pre-cracking stage I are correctly classified as “low corrosion level” in Figure 21a, which is expected. Feature vectors of pre-cracking stage II are also identified to be belonging to the “low corrosion level” class. The cracked stage feature vectors are classified into the “high corrosion level” group; this is also expected from the low intensity of the rebar image in Figure 13c. This situation is associated with high chances of spalling of the concrete cover.
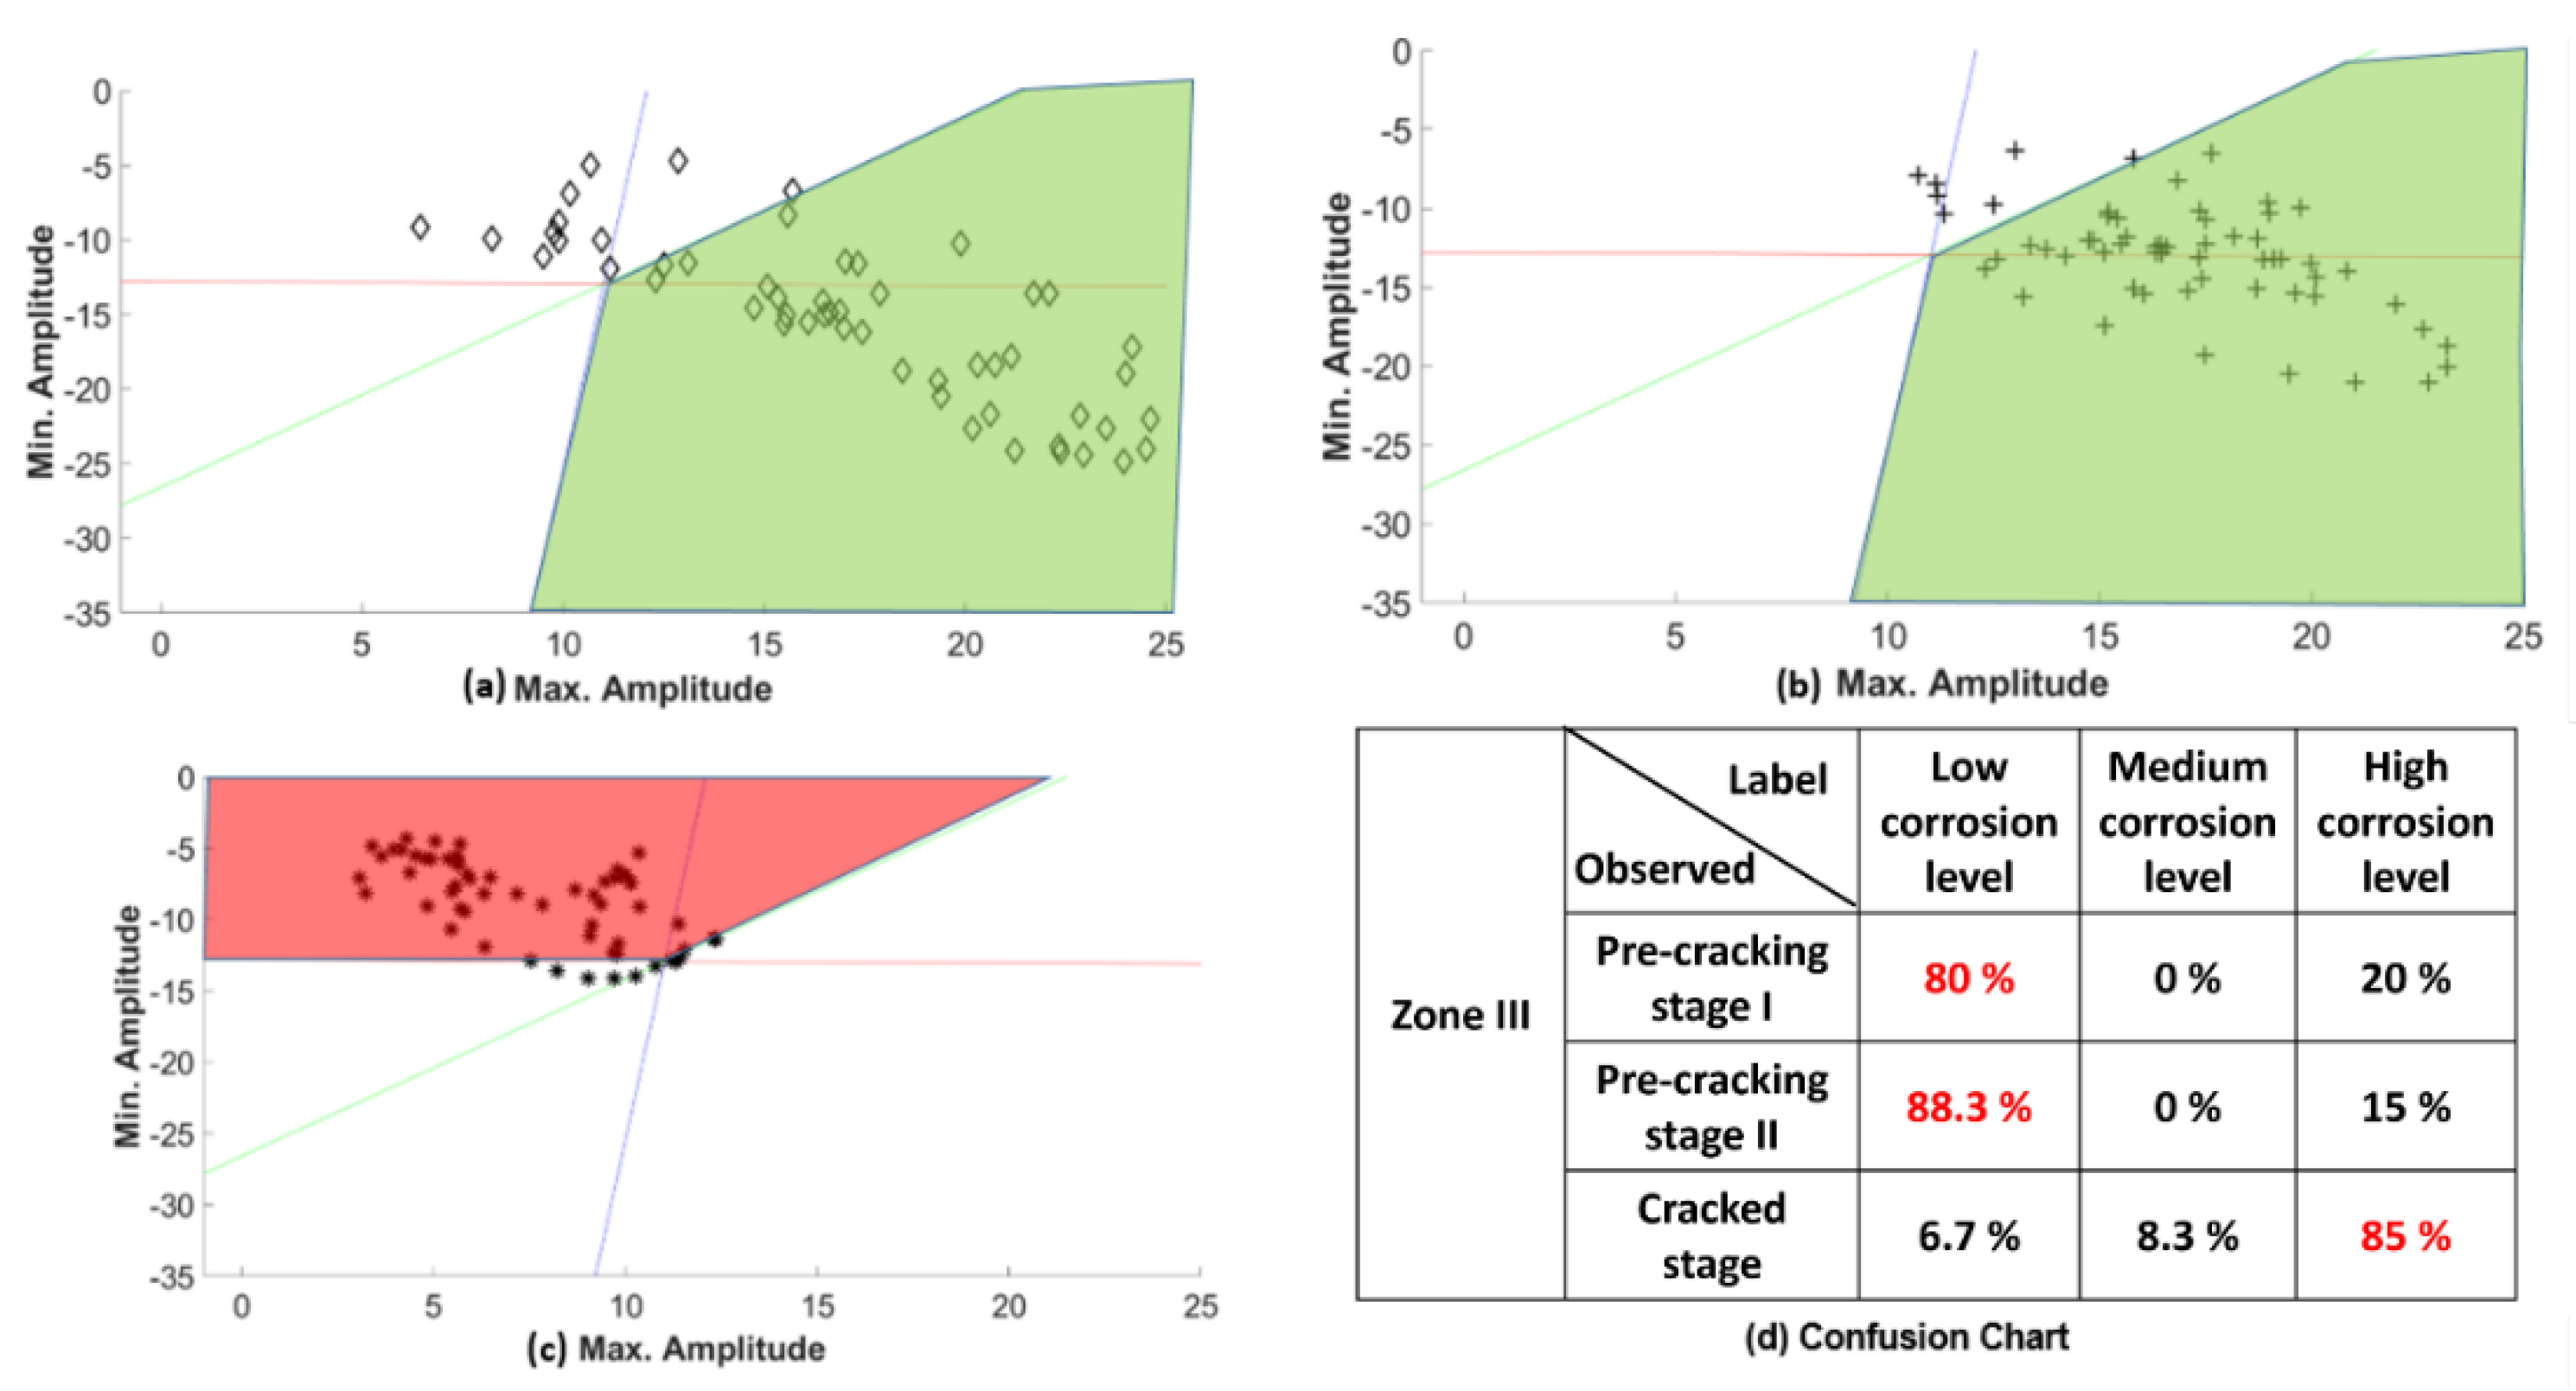
Similar observations are made w.r.t to the zone III feature vectors as shown in Figure 22.
Figure 23a shows feature vector data from slab1, which had been acquired post cracking. The data are correctly classified as belonging to “high corrosion level” class. This is expected since the rebar image intensity in Figure 12 had significantly reduced due to corrosion.

3.3.2. Corrosion Severity Classification—Beams

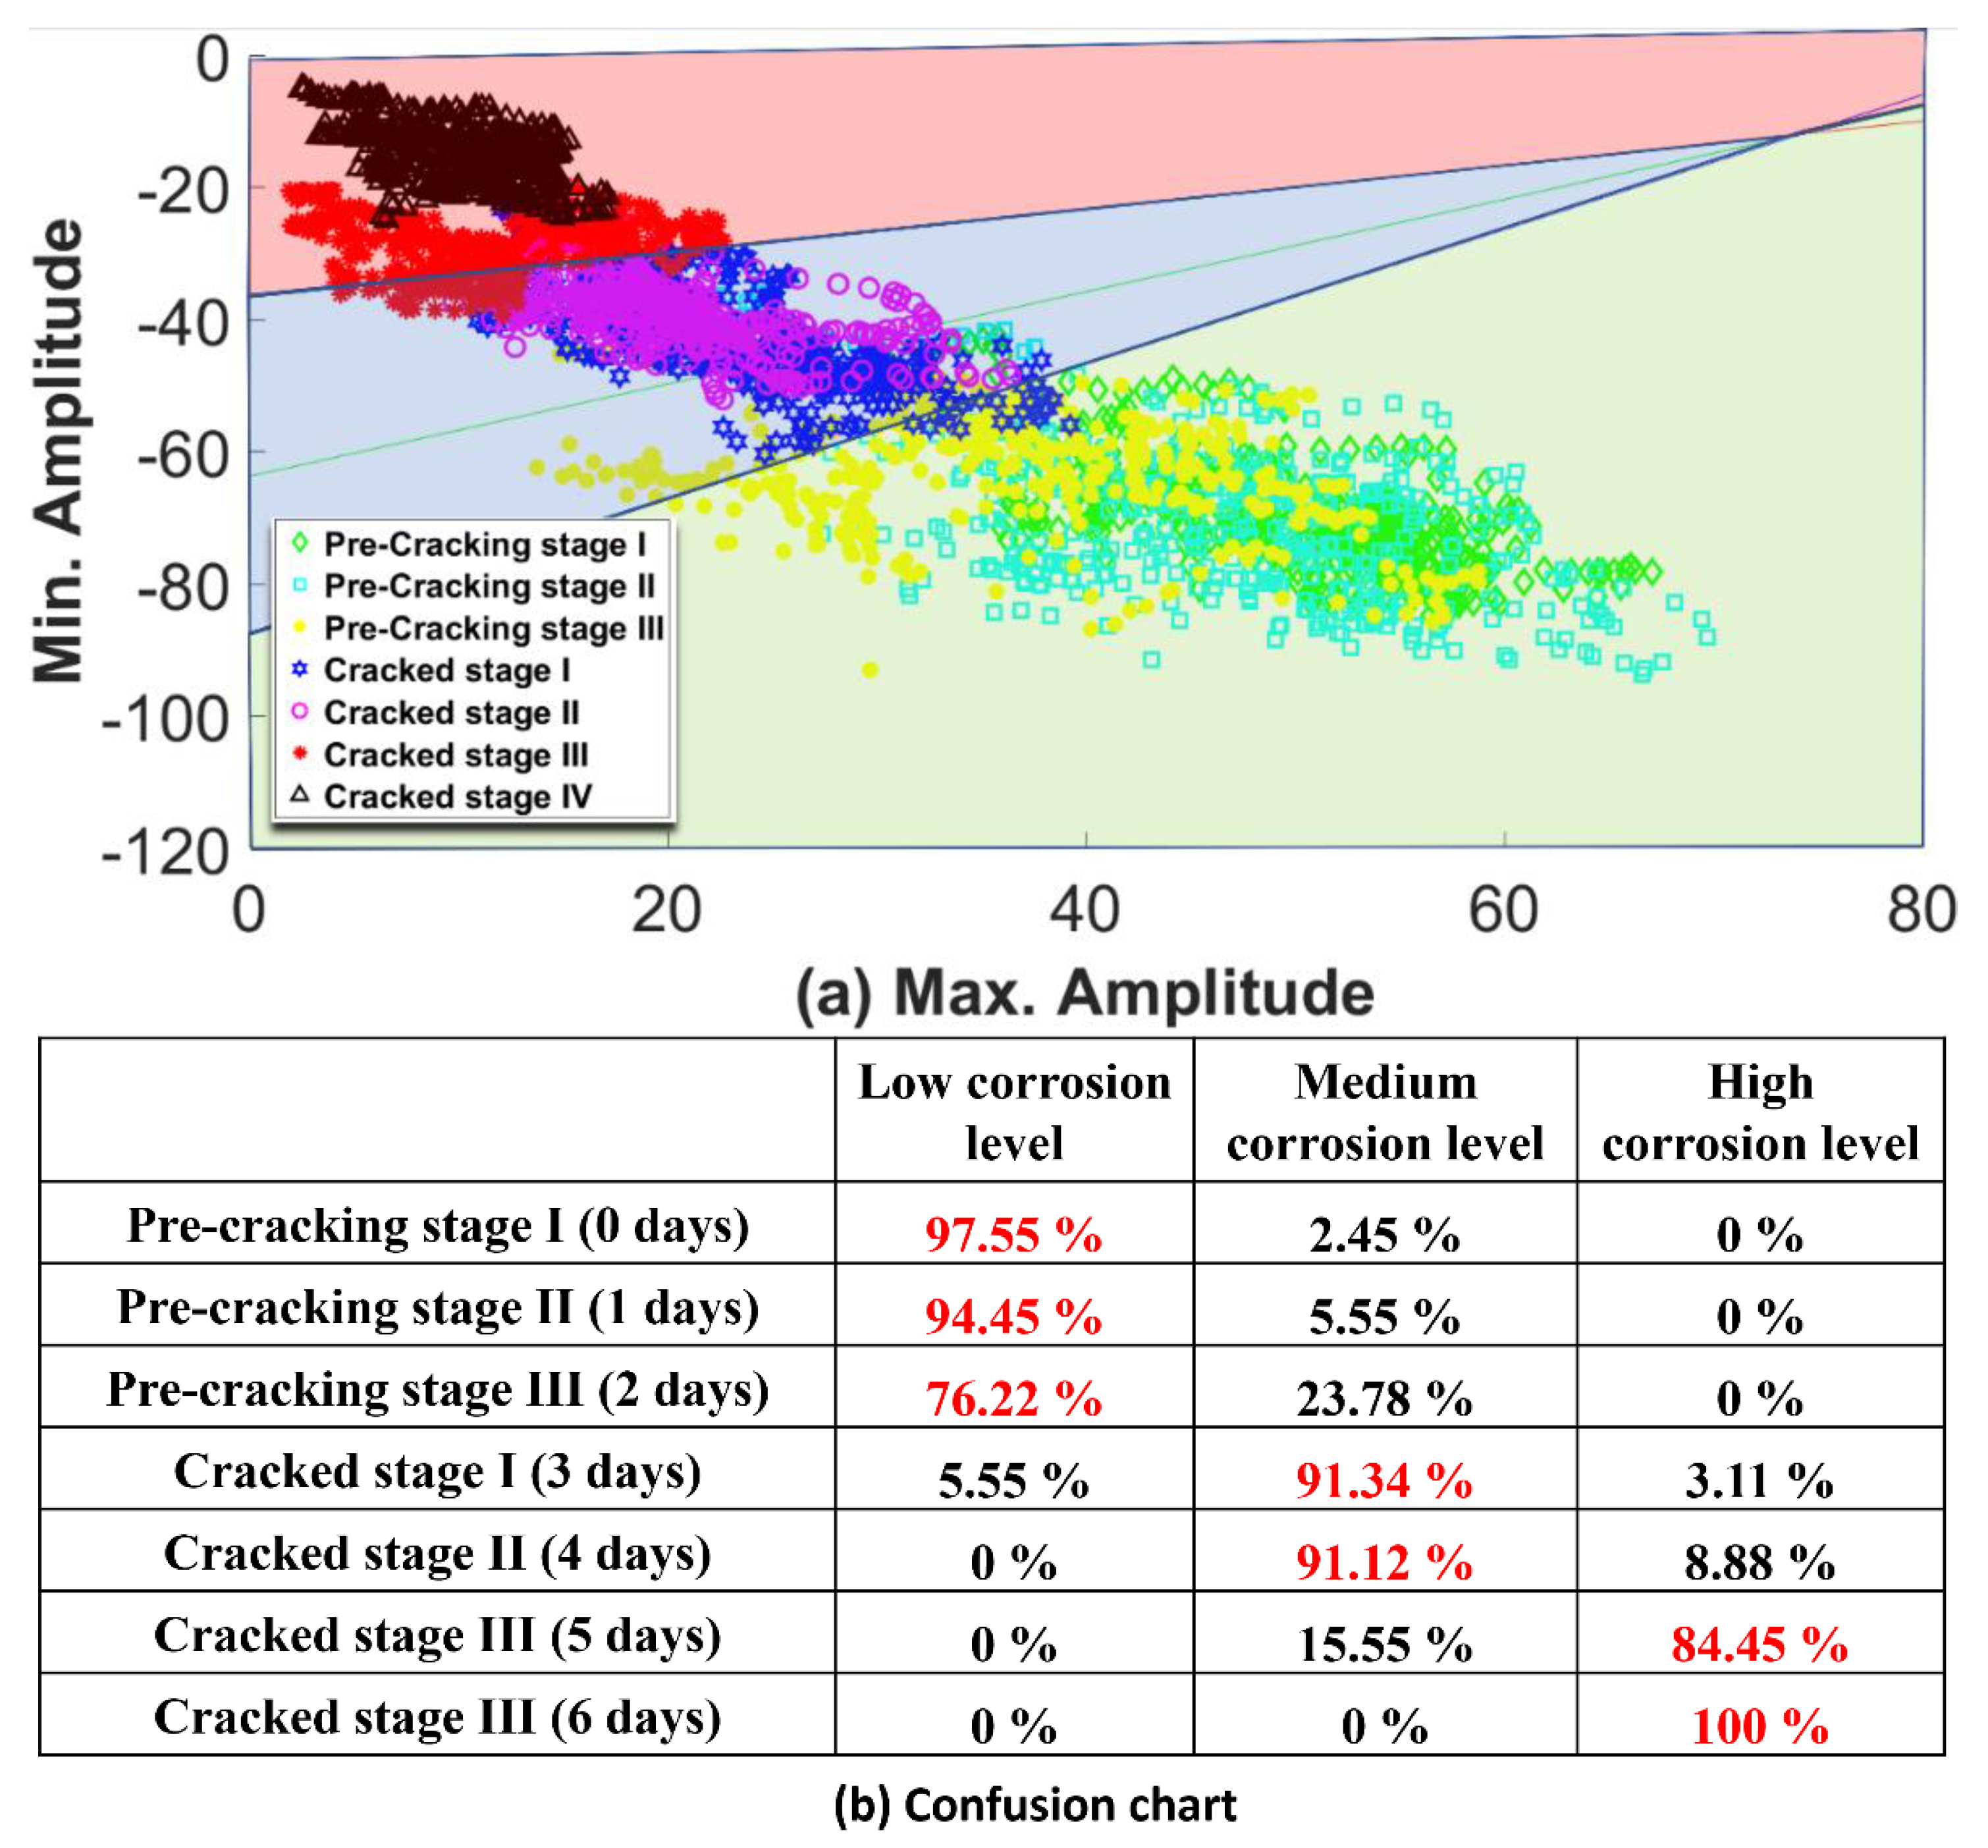
The LDA classification model for the beams considers three classes are labelled as “low corrosion level”, “medium corrosion level”, and “high corrosion level”, as shown in Figure 24.
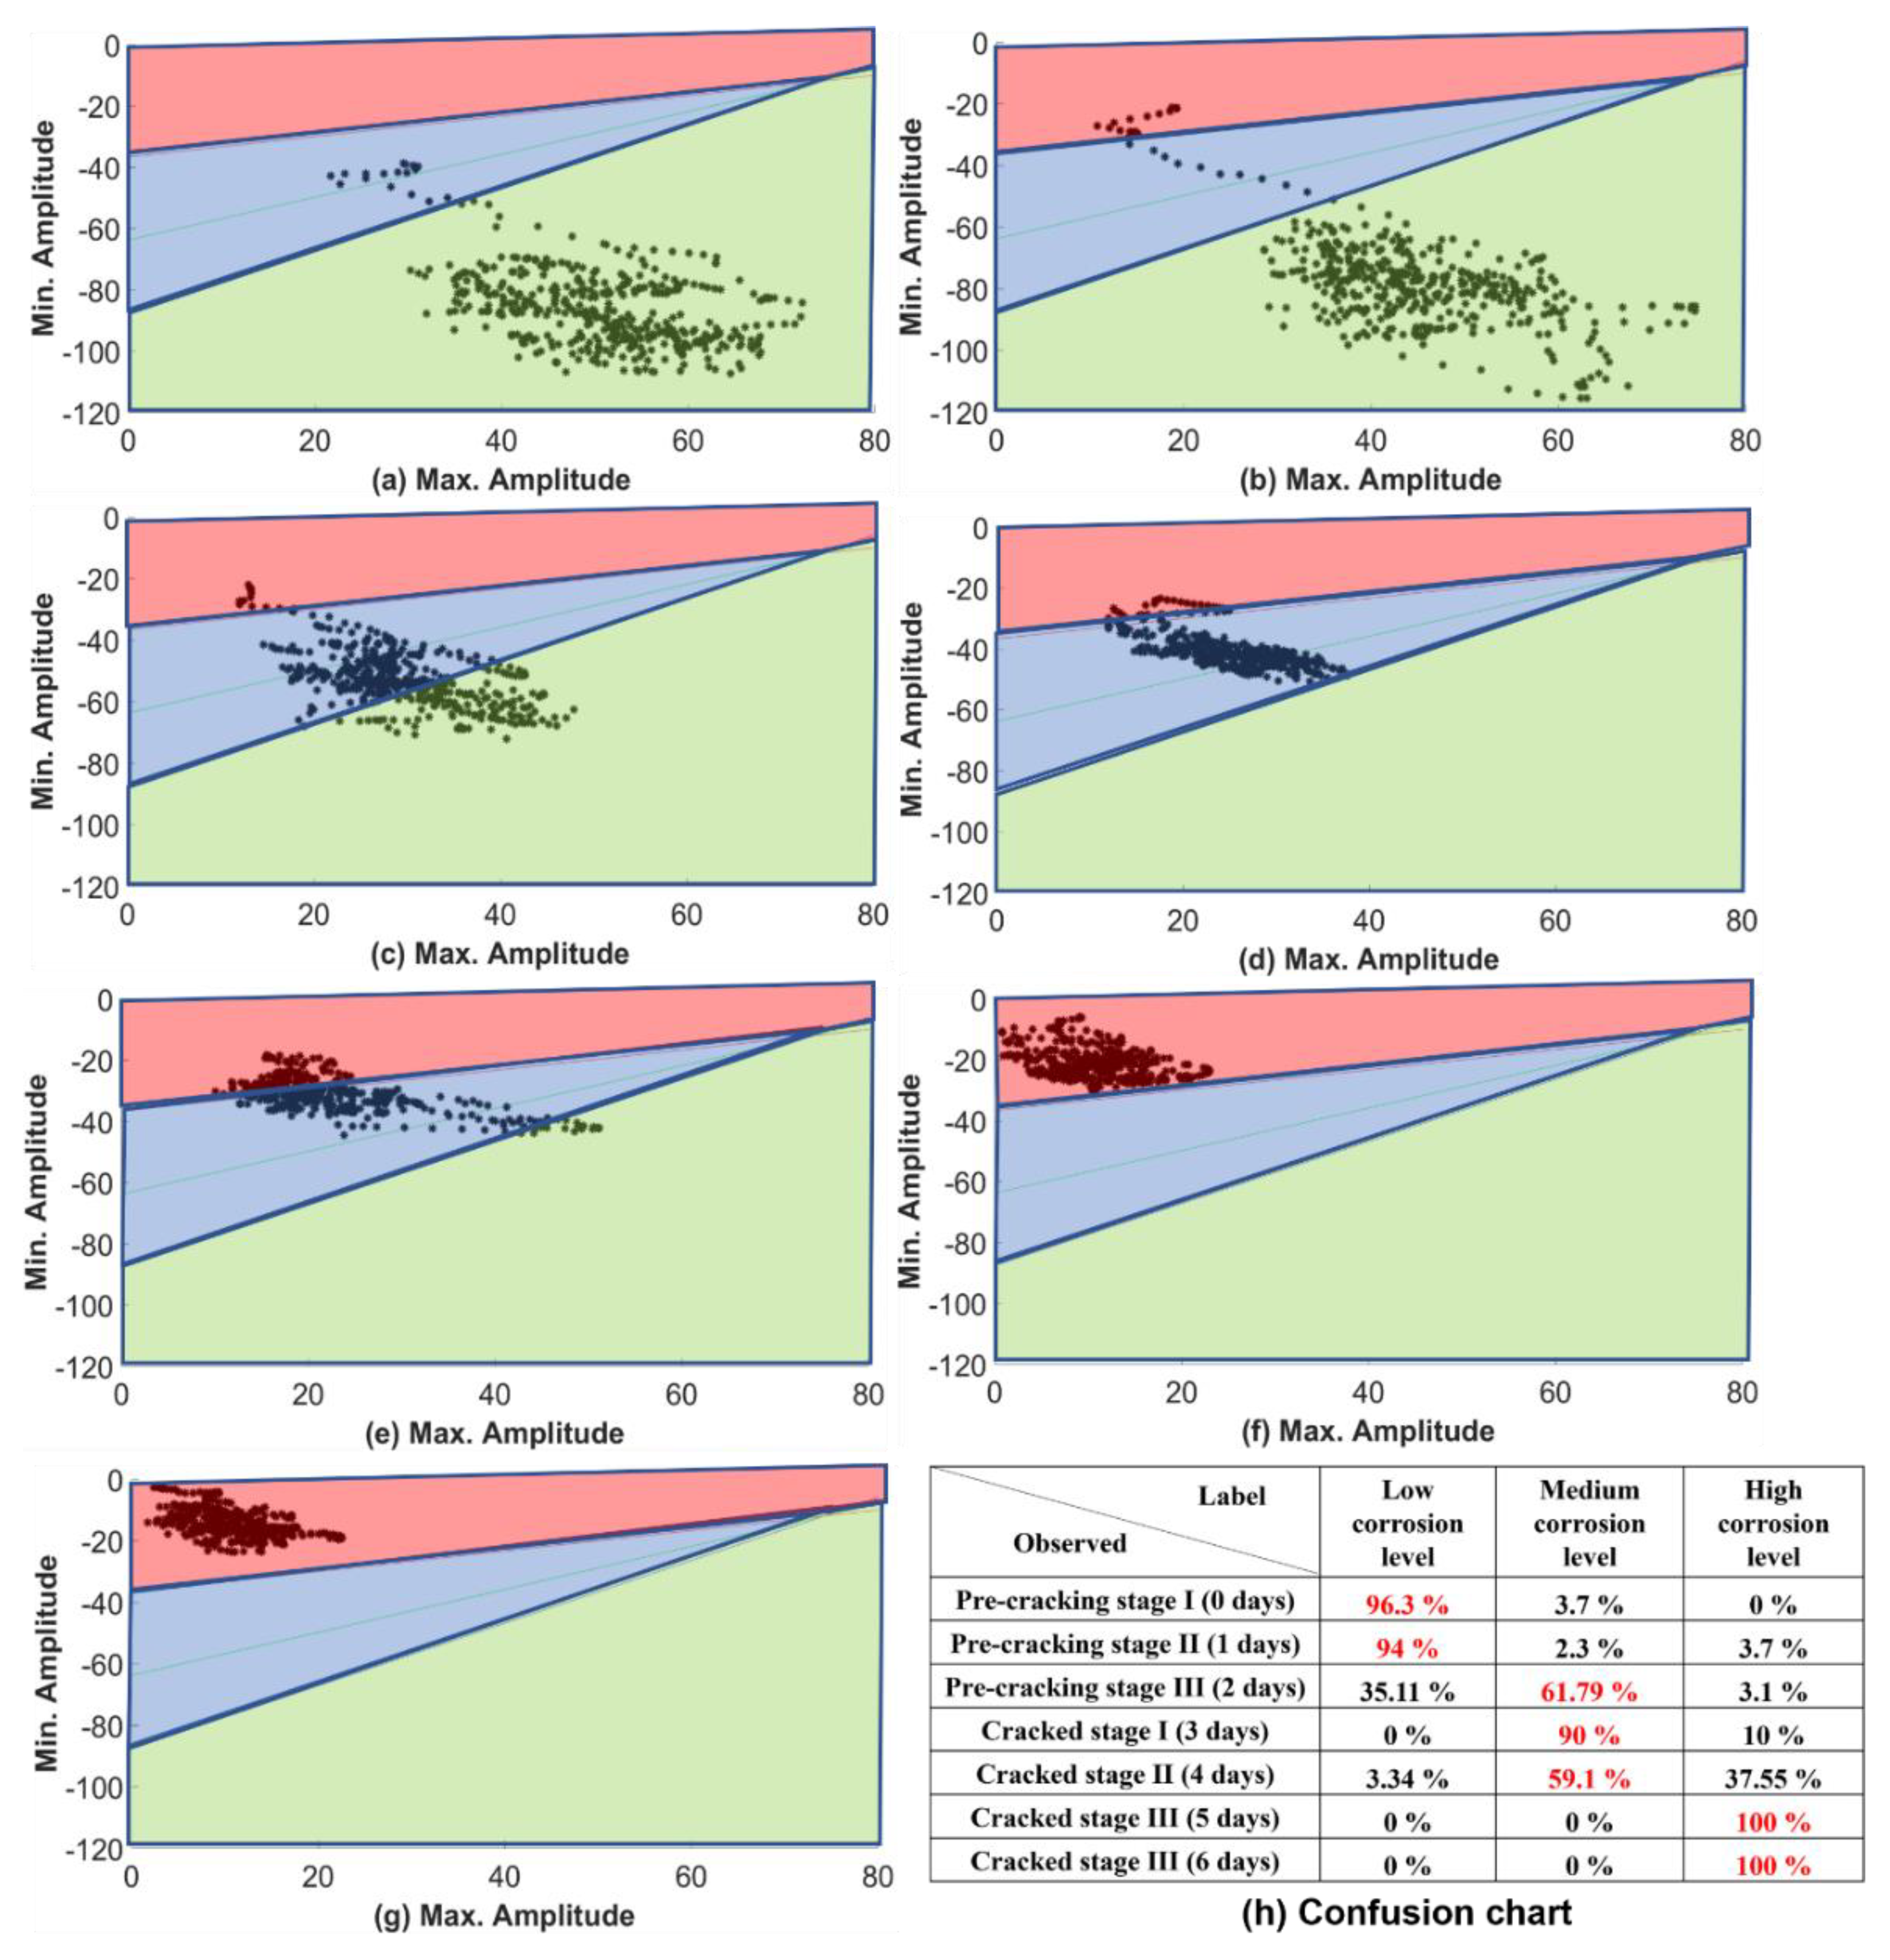
Referring to Figure 24a, it is observed that the feature vectors extracted from SAFT images (Figure 14) are classified into various classes., which is summarised in the confusion chart, shown in Figure 24b. The LDA model is developed using beam 1 as training data and the data from beams 2 and 3 are used as test data. The percentage of the feature vector values, corresponding to pre-cracking stages I, II, and III associated with “low corrosion level” are 97.55%, 94.45 % and 76.25%, respectively.
With progress in rebar corrosion (i.e., cracked stages I and II) 91.34% and 91.12% of the feature vectors belong to “medium level corrosion”. In cracked stages III and IV, the 84.45% and 100% of data belongs to “high level corrosion”.
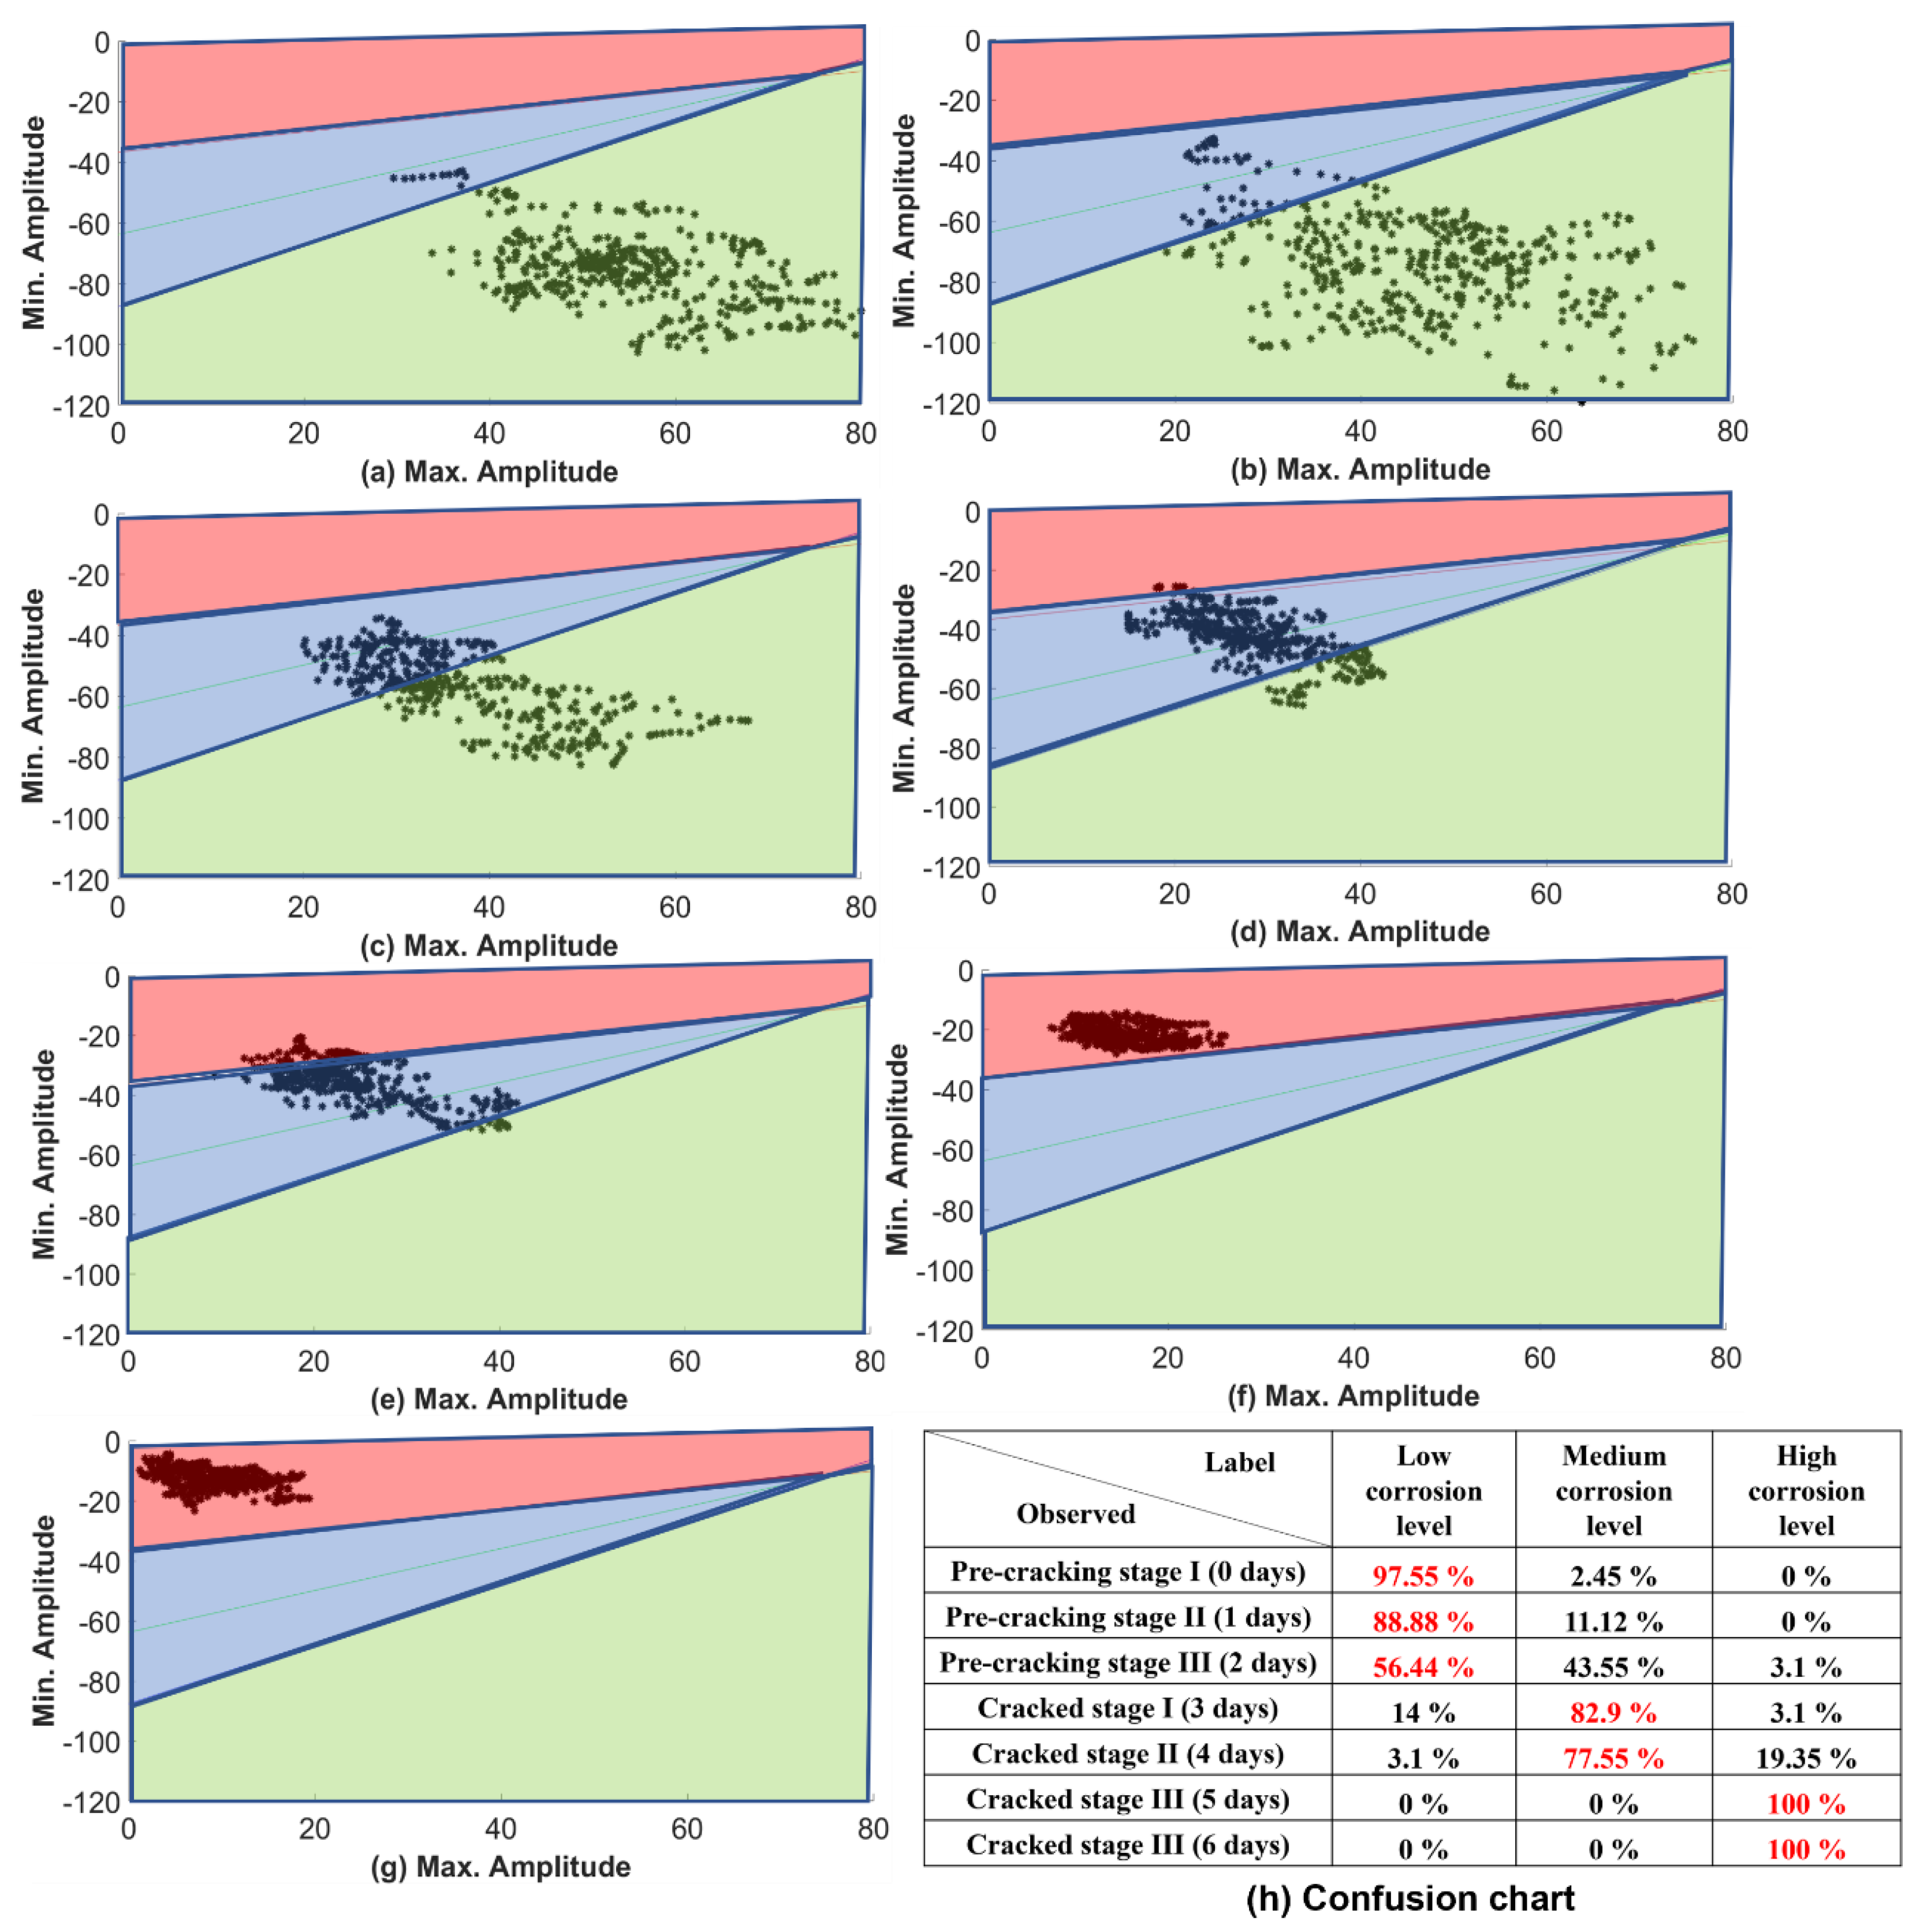
The test data extracted from the beams 2 and 3 are now investigated to classify the corrosion severity and results are presented in Figure 25 and Figure 26. For pre-cracking stages I, and II, the data are classified as “low corrosion level” (Figure 25 and Figure 26a,b). The percentage of the data points at pre-cracking stage III associated with “low level corrosion” is 35.11% and 56.44%, respectively and the 61.9% and 43.55% have migrated to the “medium corrosion level”, which indicates a progress in the corrosion. This is also the final stage before cracking of the beams. Cracked stage I (Figure 25 and Figure 26d), is classified as “medium corrosion level”.
In cracked stage II (Figure 25 and Figure 26e), 59.1% and 77.55% of the data are associated with “medium corrosion level”, and 37.55% and 19.35% have shifted towards “high corrosion level”, respectively. From cracked stage III and IV, the rebar data are classified as “high corrosion level”, which is consistent with observations pertaining to the SAFT images in Figure 14f,g.
The level of classification accuracy of each corrosion level based on the training and the test data sets are presented in the confusion charts (Figure 20b, Figure 21d, Figure 22d, Figure 23b, Figure 24b, Figure 25h and Figure 26h). The accuracy of algorithm demonstrated good reliability, since the test cases were correctly identified. Thus, the LDA algorithm, presented in this study, is successful in identifying the level of corrosion severity. Additionally, similar results were obtained using the MD. Thus, the proposed pattern recognition techniques have good potential towards generating important information about the level of damage which would help decisions related to repair and maintenance.

4. Conclusions and Future Work

This article presents the potential of ultrasonic SAFT imaging for classification of corrosion severity in rebars through the development of a statistical learning approaches. The following are the conclusions obtained from the study:
  • The SAFT images, generated at various levels of progressing corrosion, depict a gradually depleting rebar image. This can be treated as the primary evidence of corrosion activity.
  • Two methods were examined for assessing the severity of damage due to corrosion—Mahalanobis distance and linear discriminant analysis. Both methods are able to classify the corrosion severity correctly.
  • The LDA-based algorithm has been implemented successfully using simple feature vectors, i.e., maximum, and minimum amplitudes of the rebar images.
  • The results from the test data are consistent with the photographs of extracted rebars from the concrete specimens. The proposed techniques have a good potential of enabling decisions towards economical and timely repair of infrastructural assets.
  • Future research will involve investigations with data obtained from the more complicated rebar distribution in beams with shear reinforcement and in prestressed concrete girders.

Author Contributions

Conceptualization, A.G.; Methodology, P.K.M., D.G. and A.G.; Software, P.K.M.; Formal analysis, P.K.M. and A.G.; Investigation, P.K.M. and D.G.; Data curation, P.K.M. and D.G.; Writing—original draft, P.K.M.; Writing—review & editing, A.G.; Visualization, P.K.M. and D.G.; Supervision, A.G.; Project administration, P.K.M. and A.G. All authors have read and agreed to the published version of the manuscript.

Funding

This research was supported by funds received at IIT Tirupati from the Ministry of Education, Government of India.

Institutional Review Board Statement

Not applicable.

Informed Consent Statement

Not applicable.

Data Availability Statement

Not applicable.

Acknowledgments

Support from the Indian Institute of Technology Tirupati, India, is gratefully acknowledged by the authors.

Conflicts of Interest

The authors declare no conflict of interest.

References

  1. Aggelis, D.G.; Shiotani, T. Repair evaluation of concrete cracks using surface and through-transmission wave measurements. Cem. Concr. Compos. 2007, 29, 700–711. [Google Scholar] [CrossRef]
  2. Pidaparti, R.M.; Aghazadeh, B.S.; Whitfield, A.; Rao, A.S.; Mercier, G.P. Classification of corrosion defects in NiAl bronze through image analysis. Corros. Sci. 2010, 52, 3661–3666. [Google Scholar] [CrossRef]
  3. James, A.; Bazarchi, E.; Chiniforush, A.A.; Aghdam, P.P.; Hosseini, M.R.; Akbarnezhad, A.; Martek, I.; Ghodoosi, F. Rebar corrosion detection, protection, and rehabilitation of reinforced concrete structures in coastal environments: A review. Constr. Build. Mater. 2019, 224, 1026–1039. [Google Scholar] [CrossRef]
  4. C876-09; Standard Test Method for Corrosion Potentials of Uncoated Reinforcing Steel in Concrete. ASTM: Conshohocken, PA, USA, 2009.
  5. Veerachai, L.; Je-Woon, K.; Masayasu, O.; Masaru, Y. Analysis of half-cell potential measurement for corrosion of reinforced concrete. Constr. Build. Mater. 2004, 18, 155–162. [Google Scholar]
  6. Sadowski, L. Methodology for Assessing the Probability of Corrosion in Concrete Structures on the Basis of Half-Cell Potential and Concrete Resistivity Measurements. Sci. World J. 2013, 213, 1–8. [Google Scholar] [CrossRef] [Green Version]
  7. Senin, S.F.; Hamid, R. Ground Penetrating Radar Wave Attenuation Models for Estimation of Moisture and Chloride Content in Concrete Slab. Constr. Build. Mater. 2016, 106, 659–669. [Google Scholar] [CrossRef]
  8. Wiwatrojanagul, P.; Sahamitmongkol, R.; Tangtermsirikul, S.; Khamsemanan, N. A new method to determine locations of rebars and estimate cover thickness of RC structures using GPR data. Constr. Build. Mater. 2017, 140, 257–273. [Google Scholar] [CrossRef]
  9. Rathod, H.; Debeck, S.; Gupta, R.; Chow, B. Applicability of GPR and a rebar detector to obtain Rebar information of existing concrete structures. Case Stud. Constr. Mater. 2019, 11, e00240. [Google Scholar] [CrossRef]
  10. Dinh, K.; Zayed, T.; Tarussov, A. GPR image analysis for corrosion mapping in concrete slabs. In Proceedings of the Canadian Society of Civil Engineering Conference, Montreal, QC, Canada, 29 May–1 June 2013. [Google Scholar]
  11. Wong, P.T.W.; Lai, W.W.L.; Sham, J.F.C.; Poon, C. Hybrid non-destructive evaluation methods for characterizing chloride-induced corrosion in concrete. NDT E Int. 2019, 107, 102123. [Google Scholar] [CrossRef]
  12. Dinh, K.; Zayed, T.; Moufti, S.; Shami, A.; Jabri, A.; Abouhamad, M.; Dawood, T. Clustering-Based Threshold Model for Condition Assessment of Concrete Bridge Decks with Ground-Penetrating Radar. Transp. Res. Rec. 2015, 2522, 81–89. [Google Scholar] [CrossRef]
  13. Barnes, C.L.; Trottier, J.-F.; Forgeron, D. Improved concrete bridge deck evaluation using GPR by accounting for signal depth–amplitude effects. NDT E Int. 2008, 41, 427–433. [Google Scholar] [CrossRef]
  14. Tawhed, W.F.; Gassman, S.L. Damage assessment of concrete bridge decks using Impact-Echo method. ACI Mater. J. 2002, 99, 273–281. [Google Scholar]
  15. Schoefs, F.; Abraham, O.; Popovics, J.S. Quantitative evaluation of contactless impact echo for non-destructive assessment of void detection within tendon ducts. Constr. Build. Mater. 2012, 37, 885–892. [Google Scholar] [CrossRef] [Green Version]
  16. Krause, M.; Milmann, B.; Schickert, M.; Mayer, K. Investigation of tendon ducts by means of ultrasonic echo methods: A comparative study. In Proceedings of the 9th European Conference on Non-Destructive Testing, Berlin, Germany, 25–29 September 2006. [Google Scholar]
  17. Wang, Z.; Zhou, X. Impact-Echo Based Non-destructive Evaluation of Grout Condition in Post-Tensioned Bridge Ducts. Adv. Mater. Res. 2010, 168–170, 1122–1125. [Google Scholar]
  18. Yeh, P.-L.; Liu, P.L.; Hsu, Y.-Y. Parametric analysis of the impact-echo phase method in the differentiation of reinforcing bar and crack signals. Constr. Build. Mater. 2018, 180, 375–381. [Google Scholar] [CrossRef]
  19. Liang, M.; Su, P. Detection of the corrosion damage of rebar in concrete using impact-echo method. Cem. Concr. Res. 2001, 31, 1427–1436. [Google Scholar] [CrossRef]
  20. Alhawat, M.; Khan, A.; Ashour, A. Evaluation of Steel Corrosion in Concrete Structures Using Impact-Echo Method. Adv. Mater. Res. 2020, 1158, 147–164. [Google Scholar] [CrossRef]
  21. Mangual, J.; ElBatanouny, M.K.; Ziehl, P.; Matta, F. Acoustic-emission-based characterization of corrosion damage in cracked concrete with prestressing strand. ACI Mater. J. 2013, 110, 89. [Google Scholar]
  22. Tworzewski, P.; Teodorczyk, M.; Tworzewska, J. Tracking of Crack Formation in Concrete Using Acoustic Emission Method and Digital Image Correlation. IOP Conf. Ser. Mater. Sci. Eng. 2019, 471, 052032. [Google Scholar] [CrossRef]
  23. Sharma, A.; Sharma, S.; Sharma, S.; Mukherjee, A. Monitoring invisible corrosion in concrete using a combination of wave propagation techniques. Cem. Concr. Compos. 2018, 90, 89–99. [Google Scholar] [CrossRef]
  24. Karaiskos, G.; Deraemaeker, A.; Aggelis, D.G.; Hemelrijck, D.V. Monitoring of concrete structures using the ultrasonic pulse velocity method. Smart Mater. Struct. 2015, 24, 113001. [Google Scholar] [CrossRef] [Green Version]
  25. Shah, J.K.; Mukherjee, A. Monitoring and Imaging of Bolted Steel Plate Joints Using Ultrasonic Guided Waves. ASME J. Non-Destr. Eval. 2021, 4, 011003. [Google Scholar] [CrossRef]
  26. Na, W.B.; Kundu, T.; Ehsani, M. R. A Comparison of steel/concrete and glass fiber reinforced polymers/concrete interface testing by guided waves. Mater. Eval. 2003, 61, 155–161. [Google Scholar]
  27. Sriramadasu, R.C.; Banerjee, S.; Lu, Y.e. Sensitivity of longitudinal guided wave modes to pitting corrosion of rebars embedded in reinforced concrete. Constr. Build. Mater. 2020, 239, 117855. [Google Scholar] [CrossRef]
  28. Wang, X.; Chakraborty, J.; Bassil, A.; Niederleithinger, E. Detection of multiple cracks in four-point bending tests using the coda wave interferometry method. Sensors 2020, 20, 1986. [Google Scholar] [CrossRef] [PubMed]
  29. Niederleithinger, E.; Wang, X.; Herbrand, M.; Muller, M. Processing ultrasonic data by coda wave interferometry to monitor load tests of concrete beams. Sensors 2018, 18, 1971. [Google Scholar] [CrossRef] [PubMed] [Green Version]
  30. Beniwal, S.; Ganguli, A. Localized Condition Monitoring Around Rebars using Focused Ultrasonic Field and SAFT. Res. Non-Destr. Eval. 2016, 27, 48–67. [Google Scholar] [CrossRef]
  31. Beniwal, S.; Ghosh, D.; Ganguli, A. Ultrasonic imaging of concrete using scattered elastic wave modes. NDT E Int. 2016, 82, 26–35. [Google Scholar] [CrossRef]
  32. Ghosh, D.; Beniwal, S.; Ganguli, A.; Mukherjee, A. Reference free imaging of subsurface cracks in concrete using Rayleigh waves. Struct. Control. Health Monit. 2018, 25, e2246. [Google Scholar] [CrossRef]
  33. Ghosh, D.; Kumar, R.; Ganguli, A.; Mukherjee, A. Non-destructive Evaluation of Rebar Corrosion–Induced Damage in Concrete through Ultrasonic Imaging. J. Mater. Civ. Eng. 2020, 32, 04020294. [Google Scholar] [CrossRef]
  34. Mayakuntla, P.K.; Ghosh, D.; Ganguli, A. Non-destructive evaluation of rebar corrosion in concrete structures using ultrasonics and laser-based sensing. Non-Destr. Test. Eval. 2021, 37, 297–314. [Google Scholar] [CrossRef]
  35. De La Haza, A.O.; Samokrutov, A.A.; Samokrutov, P.A. Assessment of concrete structures using the Mira and Eyecon ultrasonic shear wave devices and the SAFT-C image reconstruction technique. Constr. Build. Mater. 2013, 38, 1276–1291. [Google Scholar] [CrossRef]
  36. Choi, P.; Kim, D.-H.; Lee, B.-H.; Won, M.C. Application of ultrasonic shear-wave tomography to identify horizontal crack or delamination in concrete pavement and bridge. Constr. Build. Mater. 2016, 121, 81–91. [Google Scholar] [CrossRef]
  37. Niederleithinger, E.; Wolf, J.; Mielentz, F.; Wiggenhauser, H.; Pirskawetz, S. Embedded Ultrasonic Transducers for Active and Passive Concrete Monitoring. Sensors 2015, 15, 9756–9772. [Google Scholar] [CrossRef] [Green Version]
  38. Meixedo, A.; Santos, J.; Ribeiro, D.; Calçada, R.; Todd, M. Damage detection in railway bridges using traffic-induced dynamic responses. Eng. Struct. 2021, 238, 112189. [Google Scholar] [CrossRef]
  39. Lai, W.C.; Chang, T.P.; Wang, J.J.; Kan, C.W.; Chen, W.W. An evaluation of Mahalanobis Distance and grey relational analysis for crack pattern in concrete structures. Comput. Mater. Sci. 2012, 65, 115–121. [Google Scholar] [CrossRef]
  40. Farhidzadeh, A.; Salamone, S.; Singla, P. A probabilistic approach for damage identification and crack mode classification in reinforced concrete structures. J. Intell. Mater. Syst. Struct. 2013, 24, 1722–1735. [Google Scholar] [CrossRef]
  41. Qiu, L.; Yuan, S.; Chang, Q.; Mei, H. On-line updating Gaussian mixture model for aircraft wing spar damage evaluation under time-varying boundary condition. Smart Mater. Struct. 2014, 23, 125001. [Google Scholar] [CrossRef]
  42. Vidya Sagar, R. Verification of the applicability of the Gaussian mixture modelling for damage identification in reinforced concrete structures using acoustic emission testing. J. Civ. Struct. Health Monit. 2018, 8, 395–415. [Google Scholar] [CrossRef]
  43. Ohno, J.K.; Ohtsu, M. Crack classification in concrete based on acoustic emission. Constr. Build. Mater. 2010, 24, 2339–2346. [Google Scholar] [CrossRef]
  44. Pashmforoush, F.; Khamedi, R.; Fotouhi, M.; Hajikhani, M.; Ahmadi, M. Damage Classification of Sandwich Composites Using Acoustic Emission Technique and k-means Genetic Algorithm. J. Non-Destr. Eval. 2014, 33, 481–492. [Google Scholar] [CrossRef]
  45. Zaki, A.; Jusman, Y.; Johari, M.A.M.; Hussin, W.M.A.W. Image Processing for Corrosion Quantification in Concrete Slabs using GPR data. J. Phys. Conf. Ser. 2020, 1471, 012049. [Google Scholar] [CrossRef]
  46. Majhi, S.; Mukherjee, A.; George, N.V.; Karaganov, V.; Uy, B. Corrosion monitoring in steel bars using Laser ultrasonic guided waves and advanced signal processing. Mech. Syst. Signal Process. 2021, 149, 107176. [Google Scholar] [CrossRef]
  47. Ramadan, S.; Gaillet, L.; Tessier, C.; Idrissi, H. Assessment of the stress corrosion cracking in a chloride medium of cables used in prestressed concrete structures by the acoustic emission technique. Meas. Sci. Technol. 2008, 19, 115702. [Google Scholar] [CrossRef]
  48. Xu, Y.; Wei, S.; Bao, Y.; Li, H. Automatic seismic damage identification of reinforced concrete columns from images by a region-based deep convolutional neural network. Struct. Control. Health Monit. 2019, 26, e2313. [Google Scholar] [CrossRef]
  49. Mata, J.; Schclar Leitao, N.; Tavares de Castro, A.; Sa da Costa, J. Construction of decision rules for early detection of a developing concrete arch dam failure scenario. A discriminant approach. Comput. Struct. 2014, 142, 45–53. [Google Scholar] [CrossRef] [Green Version]
  50. Medeiros Fatima, N.S.; Ramalho Geraldo, L.B.; Bento Mariana, P.; Medeiros Luiz, C.L. On the Evaluation of Texture and Color Features for Nondestructive Corrosion Detection. EURASIP J. Adv. Signal Process. 2010, 1, 817473. [Google Scholar] [CrossRef] [Green Version]
  51. Zaki, A.; Ibrahim, Z.; Jusman, Y. The Classification for Steel Corroded Reinforced Concrete Beams Using Linear Discriminant Analysis. In Proceedings of the 2nd Borobudur International Symposium on Humanities and Social Sciences, Magelang, Indonesia, 18 November 2020. [Google Scholar]
  52. IS 456-2000; Indian Standard Plain and Reinforced Concrete Code of Practice. Bureau of Indian Standards: New Delhi, India, 2020.
  53. IS 10262-2019; Indian Standard Concrete Mix Proportioning—Guidelines. Bureau of Indian Standards: New Delhi, India, 2019.
  54. Ganguli, A.; Rappaport, C.M.; Abramo, D.; Wadia-Fascetti, S. Synthetic aperture imaging for flaw detection in a concrete medium. NDT E Int. 2012, 45, 79–90. [Google Scholar] [CrossRef]
  55. Friedman, J.; Hastie, T.; Tibshirani, R. The Elements of Statistical Learning; Springer Series in Statistics; Springer: New York, NY, USA, 2001; Volume 1. [Google Scholar]
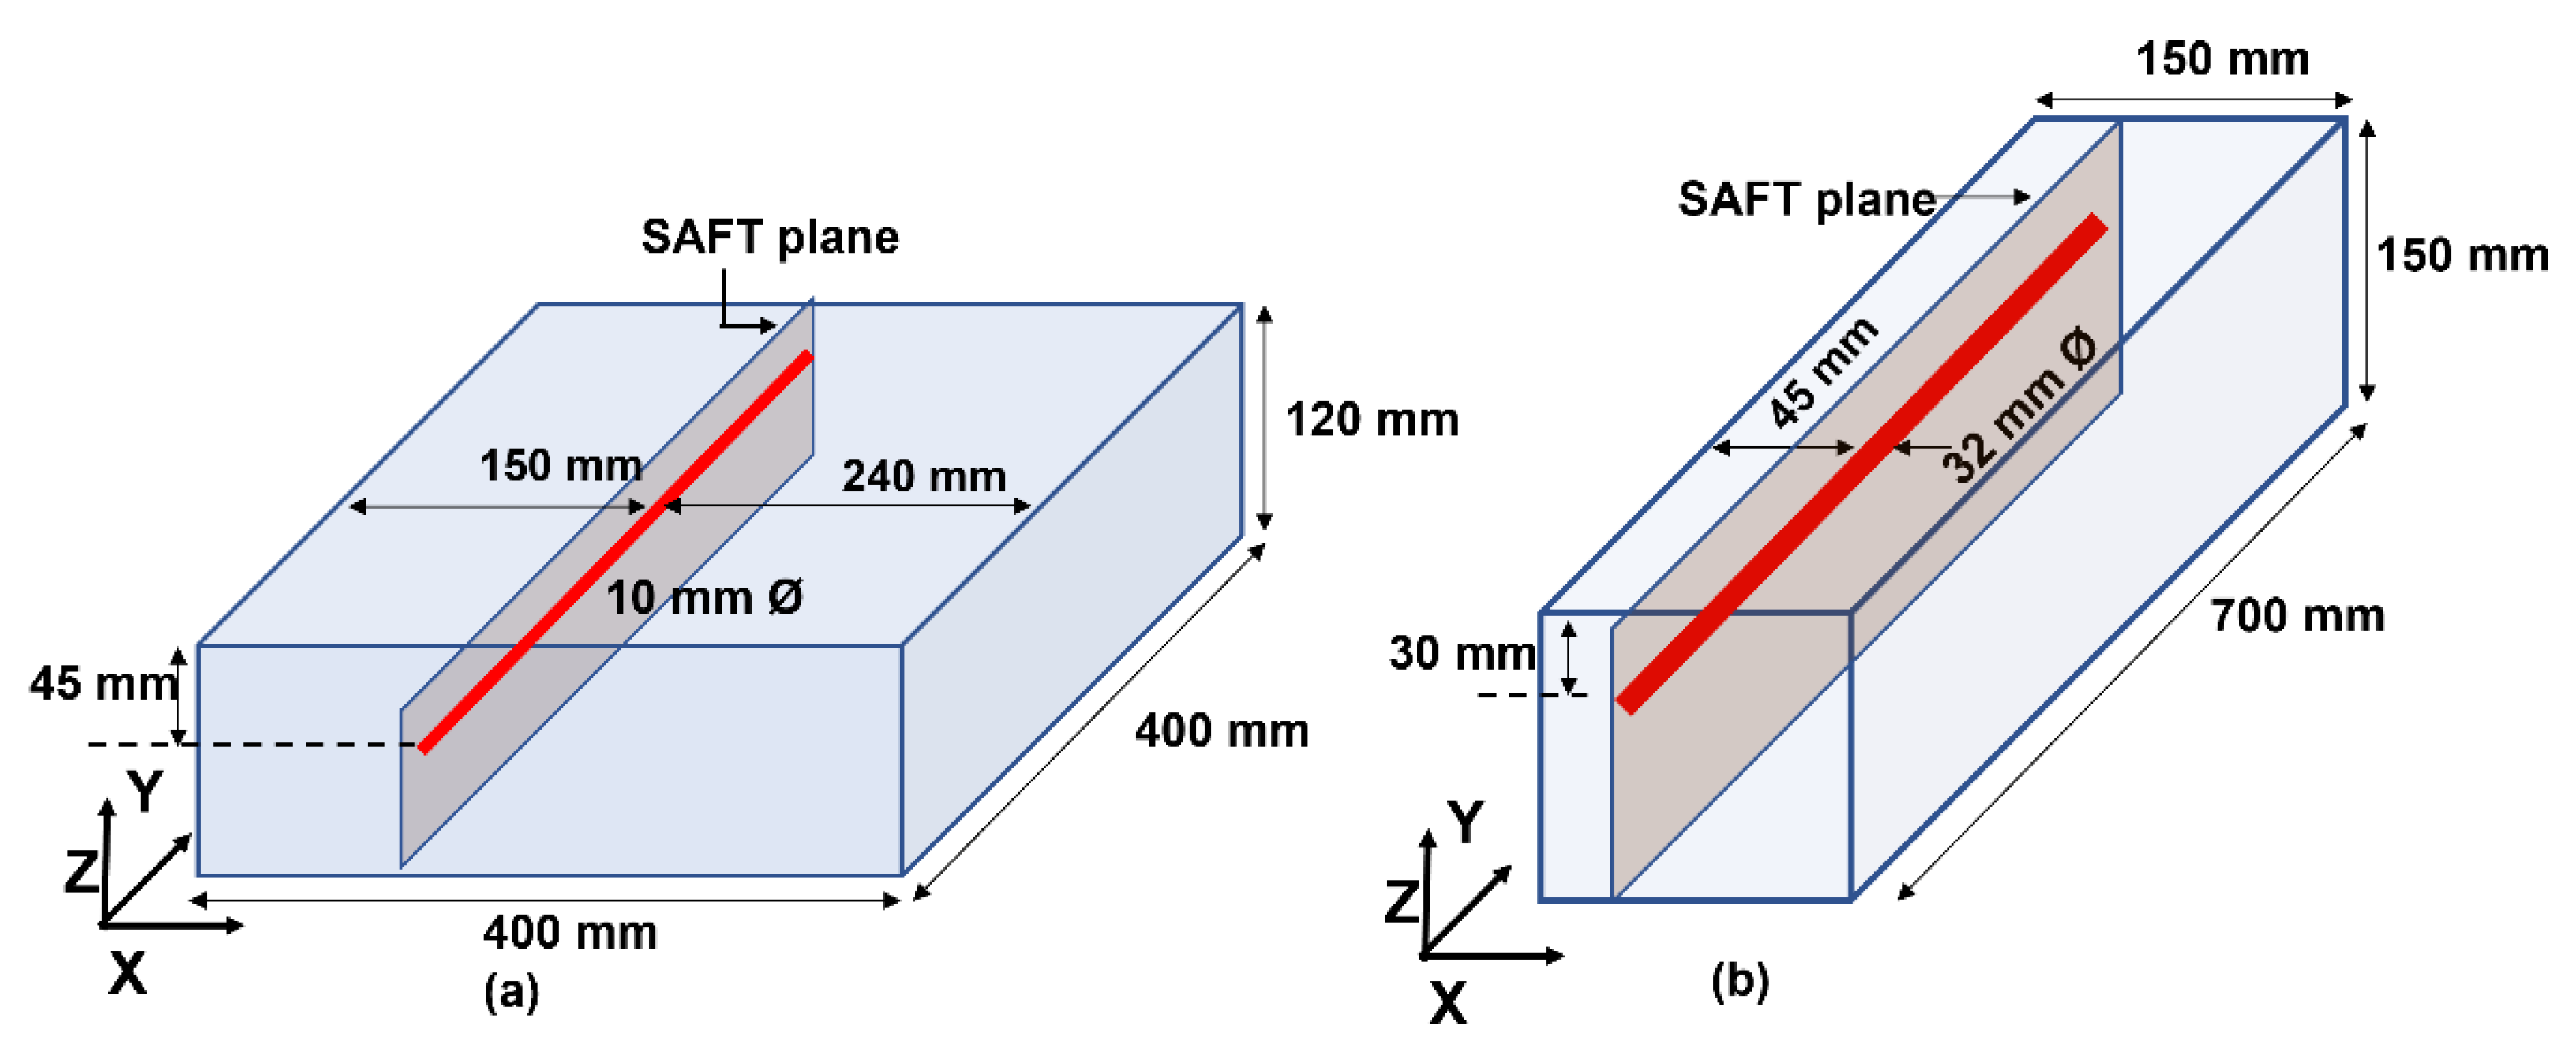
Figure 1. Schematic diagram of a cross section of (a) slabs 1 and 2; (b) beams 1, 2, and 3.
Sustainability 14 15768 g001
Figure 2. Setup of accelerated corrosion for (a) slabs and (b) beams.
Sustainability 14 15768 g002
Figure 3. (a) Slab 1 after cracking and during extraction of the rebar; (b) schematic diagram of crack propagation in slab 1; (c) extracted rebar from slab 1.
Sustainability 14 15768 g003
Figure 4. (a) Cores from slab 2 along the rebar; (b) extracted rebar 2.
Sustainability 14 15768 g004
Figure 5. Photographs of extracted 32 mm rebars from beams.
Sustainability 14 15768 g005
Figure 6. Cracked images of beam 1 after (a) 3 days of corrosion (Cracked stage I), (b) 4 days of corrosion (Cracked stage II), (c) 5 days of corrosion (Cracked stage III), and (d) 6 days of corrosion (Cracked stage IV). (e) Schematic representation of corrosion product, radial and surface breaking crack formation.
Sustainability 14 15768 g006aSustainability 14 15768 g006b
Figure 7. Cracked images of beam 2 after (a) 3 days of corrosion (Cracked stage I), (b) 4 days of corrosion (Cracked stage II), (c) 5 days of corrosion (Cracked stage III), and (d) 6 days of corrosion (Cracked stage IV).
Sustainability 14 15768 g007
Figure 8. Cracked images of beam 2 after (a) 3 days of corrosion (Cracked stage I), (b) 4 days of corrosion (Cracked stage II), (c) 5 days of corrosion (Cracked stage III), (d) 6 days of corrosion (Cracked stage IV); and (e) a schematic diagram of crack propagation in beams.
Sustainability 14 15768 g008
Figure 9. Ultrasonic scanning setup.
Sustainability 14 15768 g009
Figure 10. (a) The ultrasonic scanning approach; (b) cross-sectional SAFT imaging.
Sustainability 14 15768 g010
Figure 11. B-scan images of at (a) pre-cracking stage I, (b) pre-cracking stage III, and (c) cracked stage II; colour bar values are dimensionless.
Sustainability 14 15768 g011
Figure 12. SAFT image of slab1 at the cracked stage. Colour bar values are dimensionless.
Sustainability 14 15768 g012
Figure 13. SAFT images of slab 2 at (a) pre-cracking stage I, (b) pre-cracking stage II, and (c) cracked stage; colour bar values are dimensionless.
Sustainability 14 15768 g013
Figure 14. SAFT images of beams at (a) pre-cracking stage I, (b) pre-cracking stage II, (c) pre-cracking stage III, (d) cracked stage I, (e) cracked stage II, (f) cracked stage III, and (g) cracked stage IV. Rectangular boxes have been added to emphasise the rebar location. Colour bar values are dimensionless.
Sustainability 14 15768 g014aSustainability 14 15768 g014b
Figure 15. Schematic representation of feature extraction from SAFT images.
Sustainability 14 15768 g015
Figure 16. Mahalanobis distances between corrosion stages of slab 2 and slab 1.
Sustainability 14 15768 g016
Figure 17. Mahalanobis distances between corrosion stages in beams 1 and beam 2.
Sustainability 14 15768 g017
Figure 18. Mahalanobis distances between corrosion stages in beam 1 and beam 3.
Sustainability 14 15768 g018
Figure 19. A flowchart of the linear discriminant analysis algorithm.
Sustainability 14 15768 g019
Figure 20. (a) Linear discriminant boundaries for different classes; (b) confusion chart.
Sustainability 14 15768 g020
Figure 21. Classification of zone I features of slab 2 in (a) pre-cracking stage I; (b) pre-cracking stage II; (c) cracked stage; (d) confusion chart.
Sustainability 14 15768 g021
Figure 22. Classification of zone III features of slab 2 in (a) pre-cracking stage I; (b) pre-cracking stage II; (c) cracked stage; (d) confusion chart.
Sustainability 14 15768 g022
Figure 23. (a) Classification of rebar in slab 1; (b) confusion chart.
Sustainability 14 15768 g023
Figure 24. (a) Linear discriminant boundaries for different classes in beam 1; (b) confusion chart.
Sustainability 14 15768 g024
Figure 25. Corrosion classification of beam 2 in (a) pre-cracking stage I (PC-I); (b) pre-cracking stage II (PC-II); (c) pre-cracking stage III (PC-III); (d) cracked stage I (CS-I); (e) cracked stage II (CS-II); (f) cracked stage III (CS-III); (g) cracked stage IV(CS-IV); (h) confusion chart.
Sustainability 14 15768 g025
Figure 26. Corrosion classification of beam 3 in (a) pre-cracking stage I (PC-I); (b) pre-cracking stage II (PC-II); (c) pre-cracking stage III (PC-III); (d) cracked stage I (CS-I); (e) cracked stage II (CS-II); (f) cracked stage III (CS-III); (g) cracked stage IV(CS-IV); (h) confusion chart.
Sustainability 14 15768 g026
Table 1. Concrete mix design.
SpecimenCementCoarse AggregateSandWater
Slabs 1 and 212.81.70.45
Beams 1,2 and 313.02.10.45
Table 2. Accelerated corrosion program.
SpecimenCorrosion StagesCorrosion Period
Slab 1
  • Cracked stage
  • 11 days of corrosion
Slab 2
  • Pre-Cracking stage I
  • Pre-Cracking stage II
  • Cracked stage
  • Pristine
  • 8 days of corrosion
  • 11 days of corrosion
Beams 1, 2 and 3
  • Pre-Cracking stage I
  • Pre-Cracking stage II
  • Pre-Cracking stage III
  • Cracked stage I
  • Cracked stage II
  • Cracked stage III
  • Cracked stage IV
  • Pristine
  • 1 day corrosion
  • 2 days of corrosion
  • 3 days of corrosion
  • 4 days of corrosion
  • 5 days of corrosion
  • 6 days of corrosion
Publisher’s Note: MDPI stays neutral with regard to jurisdictional claims in published maps and institutional affiliations.