1. Introduction
The leap forward in the development of China’s expressway transportation industry [
1], on the one hand, has injected new impetus into the social economy while, on the other hand, the ensuing expressway traffic safety problems are also constantly highlighted [
2]. In 2017, a total of 8405 traffic accidents occurred on the expressway in China, accounting for 4.14% of the total number of road traffic accidents and resulting in a total of 5747 deaths, accounting for 9.01% of the total number of road traffic accidents [
3]. According to the classification of road accidents in China [
4,
5,
6] a major accident refers to a traffic accident that causes one to two deaths or seriously injures more than three people and less than ten people; an extra-serious accident is a traffic accident that causes more than three deaths, or seriously injures more than eleven people, or one death while seriously injuring more than eight people, or two deaths with a serious injury to more than five people [
7,
8]. Compared with other levels of accidents, the casualties of major and extra-serious traffic accidents are more serious, and the consequences are greater [
9,
10]. In recent years, the incidence and casualty rate of major and extra-serious traffic accidents on expressways have been maintained at a high level [
11]. Frequent traffic accidents not only damage life, health, and economic development but also directly affect social harmony and stability [
12]. Therefore, in order to reduce casualties and property loss, it is necessary to count the cases of major and extra serious traffic accidents on expressways in a certain period of time and analyze the causes and evolution rules of major traffic accidents on the expressway.
Although the current research on major and extra-serious traffic accidents has made a lot of achievements in accident statistics [
13] the analysis of influencing factors [
14], the evolution of causes [
15] and other aspects have been performed by researchers such as Xu et al. [
16], who conducted statistics and analysis of the data from major and extra serious accidents in Gansu Province from 2005 to 2010, and the results showed that human factors were the main cause of accidents. Liu et al. [
17] conducted a descriptive statistical analysis on the data of major and extra serious road traffic accidents in Yunnan Province for 10 years and proposed a method to strengthen the transformation of low-grade roads. Tian et al. [
18] obtained the risk factors and hidden events affecting urban road traffic in China by analyzing the research report of major road traffic accidents in 2016 and used the LEC evaluation method to calculate the risk value of the hidden events. Zhang et al. [
19] investigated 234 major road traffic accidents in 27 provinces of China from 1997 to 2014 and quantitatively analyzed the relationship between various influencing factors by an odds ratio. Han et al. [
20] used text mining technology to extract the characteristics of accident causes in the investigation report of major and extra serious road traffic accidents and analyzed the distribution and evolution of accident causes based on a social network. However, for special sections, such as expressways, there is an essential difference between traffic accidents on conventional roads and expressway traffic accidents, which must be effectively distinguished. In this regard, many scholars have carried out statistics on expressway traffic accidents. Gao et al. [
21] analyzed the current situation of expressway traffic safety in China based on the statistical data of expressway traffic accidents from 1994 to 2013, and put forward the management countermeasures of the expressway traffic safety system based on ‘6E’. Niu et al. [
22], based on the data of expressway traffic accidents in Zhejiang Province from 2012 to 2017, analyzed that death accidents caused by fatigue driving are most likely to occur in the early morning hours. Sun et al. [
23], based on the data of expressway traffic accidents in Shenzhen from 2017 to 2019, concluded that expressway traffic accidents have the characteristics of a high incidence of truck accidents, with a high proportion of rear-end accidents and a high incidence of secondary accidents. However, the current statistics of expressway traffic accidents are not comprehensive enough; a lack of timeliness, also affected by different provinces with regional limitations, results in a lack of comprehensive statistical results. At present, the research on expressway accident statistics focuses more on the transportation of hazardous chemicals [
24,
25], expressway tunnels [
26], and expressway construction [
27,
28]. For example, Cao et al. [
29] and Liu et al. [
30] have conducted statistical analysis on hazardous chemical transportation accidents from 2013 to 2018, but the former emphasizes the relationship between the length of emergency rescue time and the hazardous chemical category and expressway grade, and the latter focuses on the development trend of hazardous chemical accidents. Ren et al. [
31] and Shen et al. [
32] studied the law of expressway tunnel accidents over 17 years. The former mainly analyzed the expressway tunnel fire accidents, while the latter tended to evaluate the expressway tunnel casualties. Jiang et al. [
33] and Zhou et al. [
34] statistically analyzed the safety accidents of expressway construction. The former focused on the analysis of expressway tunnel construction accidents, and the latter studied a wider range, focusing on the analysis of all expressway construction accidents from 2007 to 2017. These studies have statistically analyzed the relevant cases with more typical accident characteristics, which can better find the causes and laws of expressway accidents. However, considering the particularity of expressway accidents, it was found that there were few statistical analysis studies on major and extra serious expressway traffic accidents based on accident samples in the recent 10 years, which need to be further updated and improved.
Therefore, this paper takes the major and extra serious traffic accidents of expressways in China from 2011 to 2021 as the research object, carries out statistical analysis on them, and deeply discusses the characteristics of major and extra serious traffic accidents on expressways in China from the perspectives of time distribution, spatial distribution, the accident form, and accident cause, and puts forward corresponding control measures so as to provide a reference for traffic safety and accident prevention on expressways.
2. Introduction to Accident Data
2.1. Sources of Accident Data
Based on the data information published by the government and various websites, the public literature, and domestic authoritative news media reports (such as Xinhua Net, China Daily Net, Sina Net, etc.), this paper collected a total of 802 domestic expressway major and extra serious traffic accidents from 2011 to 2021. Among them, the government information mainly came from the accident inquiry system of the Ministry of Emergency Management, the website of the Ministry of Transport of China, and the transportation departments of various provinces and cities in China. In addition, the China Road Traffic Safety Network, China Chemical Safety Association, Safety Management Network, and other websites also update with relevant information on expressway traffic accidents from time to time. The following lists the major traffic accidents of representative expressways with heavy casualties and the typical causes of accidents in China from 2011 to 2021, as shown in
Table 1.
2.2. Statistical Method of Accident Data
In this paper, the secondary development of Python software is used to collect the cases of major and extra serious traffic accidents on the expressways in China from 2011 to 2021. SPSS software is used to extract the basic characteristics of the accident types and causes, and then the grounded theory research method is used to further screen the causes of the accidents so as to better analyze these causes.
2.3. Overview of Accident Data
According to the specific circumstances of personal injury and property loss caused by accidents, traffic accidents can be divided into minor accidents, ordinary accidents, major accidents, and extra-serious accidents. (Liang et al., 2022; Wang et al., 2016; State, 1991). A major accident refers to a traffic accident that causes one to two deaths or seriously injures more than three people and less than ten people. An extra serious accident is a traffic accident that causes more than three deaths, or seriously injures more than eleven people, or 1 death with serious injuries to more than eight people, or two deaths with seriously injures to more than five people (Ministry, 1991; Wen et al., 2021). The data processed in this paper are strictly screened according to the classification criteria of traffic accidents, and the data are classified according to the actual casualties, major accidents, and extra serious accidents. The statistics of major and extra serious traffic accidents on national (excluding Hong Kong and Macao, the same below) expressways from 2011 to 2021 are shown in
Table 2.
From the perspective of the number of accidents, there are 802 major and extra serious traffic accidents on the expressway, of which 560 are major accidents, accounting for 69.80%, and 242 are extra serious accidents, accounting for 30.20%. The number of extra serious accidents is 2.31 times that of major accidents; from the perspective of the number of deaths and injuries, 3392 people died in extra serious accidents, 5473 people were injured, 241 people died in major accidents, and 419 people were injured. The number of casualties in extra-serious accidents is 13 times more than that in major accidents, indicating that extra-serious accidents not only account for a large proportion but also have heavy casualties and huge losses. It is necessary to attach great importance to them and take practical measures to control them.
3. Spatial-Temporal Characteristics and Analysis of Accidents
3.1. Time Characteristics and Analysis
3.1.1. Year Characteristics and Analysis
- (1)
Year statistical characteristics
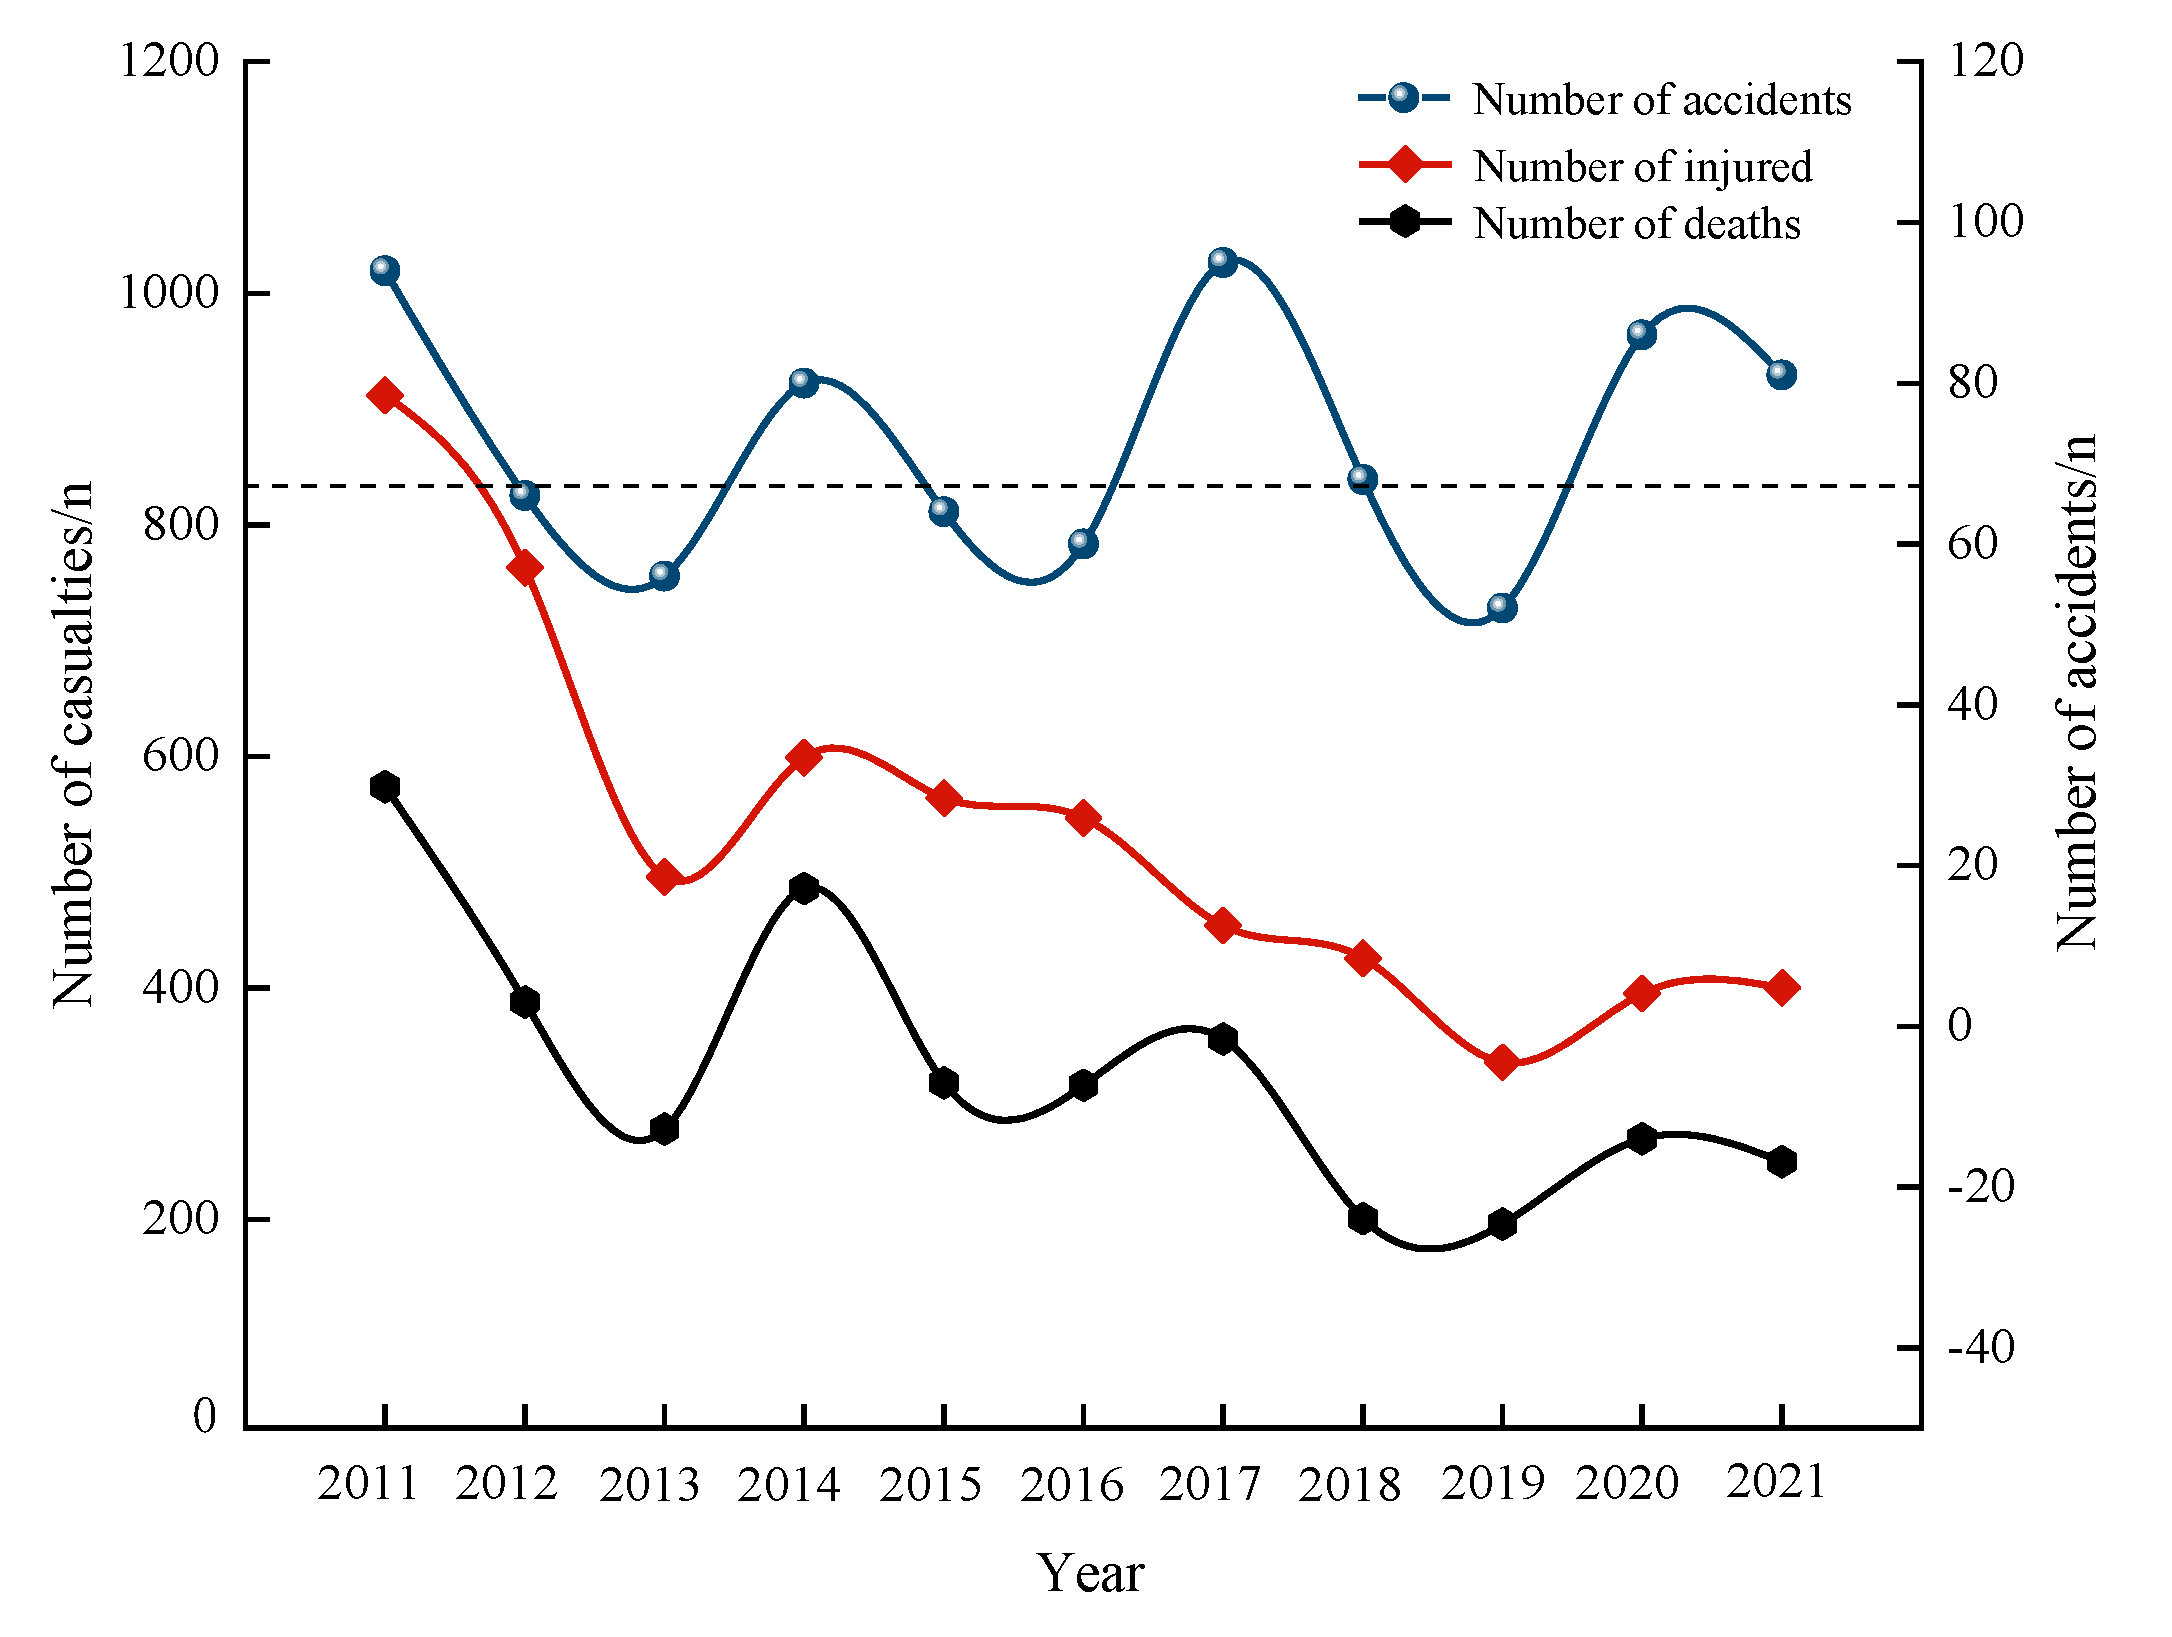
The number of accidents and casualties were counted by year, and the distribution of the number of accidents and casualties is shown in
Figure 1.
It can be seen from
Figure 1 that the curve of the number of accidents shows a fluctuating development as a whole. In 2013, 2016, and 2019, there were three low peaks in the number of major and extra-serious traffic accidents on China’s expressways. Whenever the low peak was reached, the number of accidents gradually increased and then slowly decreased, but the number of accidents per year fluctuated around 73. Therefore, 2011~2013, 2014~2016, and 2017~2019 can be regarded as three stages in which the number of accidents decreased significantly, with every three years as one stage. From the accident death and injury number curve, the overall performance saw a decline in volatility. The number of casualties in accidents decreased from the highest death toll of 574 and the highest injury toll of 912 in 2011 to the lowest death toll of 196 and the lowest injury toll of 336 in 2019. The number of casualties decreased rapidly from 2011 to 2013, but the number of casualties also increased gradually in the next year. The number of casualties decreased gradually from 2014 to 2019 and remained relatively stable until 2020. By observing the changes in the three curves, it was found that the trend of the number of accidents and the number of casualties in 2017 was slightly different. The number of casualties in this year was relatively low, but the number of accidents was as high as 95, and the number of major and extra serious traffic accidents in the rest of the year was almost the same as the trend of the number of casualties.
In addition, during the ‘Twelfth Five-Year’ period (2011~2016), a total of 360 major and extra serious accidents, resulting in 2044 deaths, 3334 injured and the ‘13th Five-Year’ (2016~2020), during which a total of 442 major and extra serious accidents resulted in 1589 deaths, 2558 injured, major accidents showed multiple trends.
- (2)
Year characteristics analysis
As can be seen from the characteristics of the year, ‘12th Five-Year’ to ‘13th Five-Year’, significant changes in the number of major and extra serious traffic accidents during the volatility and the number of accident casualties fluctuated in a downward trend until 2020 where it leveled off. Among them, the traffic casualties during the ‘13th Five-Year’ period improved significantly. Combined with national policies and expressway management regulations, it can be found that since the State Council issued the “Opinions on Strengthening Road Traffic Safety Work” (Guo Fa No.30) [
35], the number of accidents and casualties in China’s expressways has decreased significantly in the short term. However, in 2014, a number of expressway traffic accidents, such as the “3 · 1 Shanxi Jinji Expressway special major accident”, exposed more prominent hidden dangers in the transportation of hazardous chemicals. To this end, the State Council Security Committee issued an “Emergency Notice on Strengthening the Safety of Hazardous Chemicals Road Transportation and Expressway Tunnels ” [
36] stipulating that atmospheric tank-type and hazardous chemical transport vehicles without emergency cut-off devices before the end of 2014 would be canceled. From the perspective of casualties, China’s expressway emergency management department has implemented the ‘expressway traffic emergency management procedure regulations’ [
37] issued by the Ministry of Public Security, which since being in place, has effectively controlled the number of casualties. The emergency rescue work for emergencies is relatively efficient, but it is necessary to further improve the rescue linkage mechanism.
3.1.2. Monthly Characteristics and Analysis
- (1)
Monthly statistical characteristics
According to the accident month statistics, the number of accidents and casualties are shown in
Figure 2.
As can be seen from the number of accidents curve, the overall high degree of volatility correlation from January to March decreased significantly, and from April onwards, the trend showed three ‘^’ shapes, that is, the first three increased and then decreased, but the average number of 67 accidents fluctuated, and the number of accidents peaked in January, May, August, and November. It can be observed that the trend of the curve in terms of the number of deaths and the number of injuries is similar, and the overall trend is fluctuating, but the peak and low peak months are slightly different; the peak number of deaths was in February, August, and November while the peak number of injuries was in January, June, and November. In general, except when the number of accidents decreased but the number of injured people increased in June, which was inconsistent with the change in the number of accidents and the number of casualties, the trend of the three curves in the remaining months was basically the same.
- (2)
Month characteristics analysis
In terms of monthly characteristics, both the number of accidents and the number of casualties show significant seasonal differences. January and February are close to the Spring Festival, which is the peak time of traffic flow. In addition, the ambient temperature in winter is low, and it is easy to cause road icing and equipment to freeze and crack. From June to August, the number of accidents and casualties is relatively high, which is mainly related to the change in high-temperature weather in summer. Hot weather can easily lead to drowsiness and the burnout of staff, resulting in lax safety awareness and operational errors. In addition, the distribution of the holidays is also the key to affecting the overall trend, such as the Spring Festival, Qingming Festival, “May 1st Golden Week”, “National Day Holiday”, etc. With the increase in people’s travel volume, the accident rate on the expressways also increases. Especially in festivals with long holidays, the problem of long-distance travel, coupled with the influence of the weather, means that it is easy to cause people to be in a bad state and lead to accidents. Since 2012, the State Council has set 2 December as “National Traffic Safety Day”. At the end of each year, people will be reminded to pay attention to travel safety. Therefore, December is also the month with the lowest accident casualty rate in the year.
3.1.3. Time Period Characteristics and Analysis
- (1)
Time period statistical characteristics
According to every 2 h as a time period, the number of major and extra serious traffic accidents and casualties are shown in
Figure 3.
The results of
Figure 3 show that the three curves for the number of accidents and casualties fluctuate as a whole. It can be seen that there are three periods in a day when the number of traffic accidents and casualties is higher, which are 0:00~2:00, 6:00~8:00, and 14:00~16:00, respectively. The lesser time periods are 2:00~4:00 and 10:00~12:00. Whenever the peak value is reached, the number of accidents and casualties will gradually decrease over time in the next period; at 16:00~18:00, the number of accidents was in the mean interval, and there was a downward trend, but the number of injured people increased abnormally. During the period from 18:00 to 24:00, the trend in the number of accidents and casualties gradually stabilized.
- (2)
Time period characteristics analysis
According to the law of the biological clock, 23:00~5:00 is a period of rapid division in the human cells, which will promote the human body to enter a sleep state and deepen the degree of fatigue. At this time, it is easy to cause sleepiness, poor mental state, physical and mental slackness, etc., which requires sufficient rest time adjustment and transition. In this process, it is easy to cause safety accidents due to carelessness. Secondly, the low visibility during driving at night will greatly increase the probability of accidents, and the speed of driving at night is faster than that during the day, which is more likely to aggravate the consequences of accidents. Therefore, the number of accidents from 0:00 to 2:00 is the largest. China’s workday morning peak is 7:00~9:00, 6:00~8:00 when the expressway traffic flow increases and the number of accidents gradually increase; with the disappearance of the morning peak, the number of accidents and casualties gradually decreases. Between 14:00 and 16:00 is the strongest light of the day, meaning that drivers vulnerable to strong light may lead to accidents. In addition, according to Article 38 of the “Safety Management Code for Road Passenger Transportation Enterprises“ [
38] issued by the Ministry of Transportation in 2018, long-distance passenger vehicles stop running or implement feeder transportation from 2:00 to 5:00 in the morning. Therefore, there were no passenger vehicles on the expressway during this period, only small private cars and trucks, and in some areas, the travel time of larger vehicles, such as hazardous chemical transport vehicles and heavy trucks, is also limited so that the traffic flow is reduced and the accident rate is greatly reduced.
3.2. Spatial Characteristics and Analysis
3.2.1. Spatial Characteristics
According to the provinces where the accident occurred, the number of accidents and the distribution of casualties are shown in
Figure 4.
It can be seen from
Figure 4 that each province can be divided into three regions according to the trend in the number of major accidents. The first region is a high-incidence area of major accidents that needs key management, including Guangxi, Heilongjiang, Fujian, and Anhui, with 66, 61, 55 and 46 major and extra serious traffic accidents, respectively, accounting for 28.4%. The second region needs to be alert to the frequent occurrence of major and extra-serious accidents, including Guangdong, Sichuan, Hunan, Yunnan, Xinjiang, Gansu, Shaanxi, Hubei, Shandong, Henan, Jiangxi, Zhejiang, and Guizhou where the number of accidents is more than 20; the third region needs to maintain low accident rate areas, including Taiwan, Jiangsu, Beijing, Liaoning, and other provinces and cities where the number of accidents in about 10. It can be seen from the histogram of major accidents in
Figure 4 that the number of major accidents in Heilongjiang and Shaanxi is obviously larger than that of extra serious accidents, the number of extra serious accidents in Shandong is basically the same, and the number of major accidents in other provinces is smaller than that of extra serious accidents.
3.2.2. Spatial Characteristics Analysis
From the perspective of economic zoning combined with spatial characteristics, it can be clearly observed that South China is a high-incidence area of major and extra serious accidents, while the proportion of accidents in Central, Northwest, and Northeast China has increased to varying degrees. Among them, extra serious accidents show a trend of shifting from South China to Central and Northwest China. According to the number of major and extra serious accidents each year, the key areas with obvious accident development trends in each province can be controlled so as to facilitate the hierarchical control work.
4. Accident Form and Accident Cause Characteristics and Analysis
4.1. Accident form Characteristics and Analysis
4.1.1. Accident form Characteristics
Because the occurrence of expressway traffic accidents often involves more than one form of accident [
39], it also includes a variety of accident forms that have appeared successively, resulting in an escalation in the severity of the accident. From the original minor accident or general accident to a major or extra serious accident, such as serial rear-end collisions [
40] and leakage and fires [
41], different accident forms induced by various accident causes will greatly deepen the accident consequences and cause serious accident effects. Therefore, this paper divides the accident form into two categories: the single accident form and the multi-accident form, and carries out statistics and analysis. The specific analysis is as follows.
(1) Firstly, the single accident form statistics of 802 major and extra serious accidents were carried out, and the data of two accidents with unknown forms were removed. A total of 685 accidents were screened out, including 2948 deaths and 4710 injuries, as shown in
Table 3. The accidents in
Table 3 [
42,
43] are those resulting in loss of life or property on a road due to fault or accident. A vehicle collision [
44] refers to a collision between the vehicle and the vehicle, which mainly includes frontal collision and side collision; vehicle rear-ends collision [
45] means a collision between the front of one vehicle and the rear of another in the same direction; vehicle-fixtures collision refers to the vehicle and the expressway fixed objects (such as the middle of the isolation belt, crash barrier) that can be hit. Vehicle-human collision refers to the collision between vehicles and road personnel (such as road maintenance workers and accident detainees). A crash refers to the vehicle falling from a high place (such as a bridge or a hillside) without touching the ground.
According to
Table 3, from the number of accidents, the number of accidents caused by vehicle collisions is the largest, accounting for 43.8% of the total number of accidents in a single accident form, followed by vehicle rear-end collisions, rollovers, and vehicle-fixtures collisions. The number of accidents is 208, 72, and 55, accounting for 48.8%, and the number of explosions, vehicles on fire, vehicle crashes, and vehicle-human collisions is small. From the number of casualties, the deaths and injuries in vehicle collisions accounted for 43.6% and 40.6%, respectively, which was close to half of the total number of casualties in a single accident. The number of deaths caused by rollover accounted for 10.7%, and the injuries accounted for 18.9%. Compared with the vehicle-fixtures collision, the number of accidents and deaths were similar, but the proportion of injuries caused by rollover was far greater than that of vehicle-fixture collisions.
(2) The screening of the multiple accident forms of major and extra serious traffic accidents from 2011 to 2021 provided a total of 115 cases, 680 deaths, and 1178 injuries, among which the multiple accident forms existed in the order of occurrence of a single accident form, that is, the first and the second. Even the nth accident form was collectively referred to as the nth form, and the statistics of the first form are shown in
Table 4.
It can be seen from
Table 4 that the frequency of vehicle collision and vehicle-fixture collisions in the first form is the highest, which is 40 and 29, respectively. The evolution characteristics between the first and secondary forms of these two accident forms are emphatically analyzed. Therefore, three kinds of accident forms (rollover, fire, and crash) with high frequency in the secondary form are selected to compare and analyze the vehicle collision and vehicle-fixtures collision. The specific content is shown in
Figure 5.
It can be seen from
Figure 5 that the number of vehicle crashes in the two secondary forms is the same, both of which are three. The number of deaths in vehicle collisions is 57, and the injuries are 19, while the number of deaths in vehicle-fixture collisions is 38, and the injuries are 84. The number of fire accidents in vehicle collisions is similar to the number of rollovers in vehicle-fixture collisions, which are 18 and 20, respectively. The number of deaths is also relatively close, but the number of injuries caused by rollover is much larger than that caused by fire, indicating that the injury rate of rollover is higher, which is the same as the analysis results of rollover accidents in the above single accident form.
4.1.2. Analysis of Accident Form Characteristics
From the single and multi-accident form characteristics, it can be seen that the number of deaths in vehicle collisions is the largest, and the injury rate of rollover is the highest. It may be because the vehicle collision belongs to the category of the multi-vehicle accident form. When at least two vehicles are in the process of high-speed driving, if a collision accident occurs, the protection measures that can be taken are limited, and the fatality rate is greatly increased, so the number of vehicle collision deaths is the largest. Secondly, because the vehicle rolls out of control, there will be a continuous rolling phenomenon due to the influence of high-speed inertia. The occupants in the vehicle will also collide continuously with the hard objects in the vehicle due to inertia, which is likely to break the glass, and they are likely to be thrown out of the vehicle, aggravating the consequences of the accident. In addition, this may also be due to the occupants driving safety protection measures that are not in place and that do not meet the requirements of seat belts. Therefore, there should be a focus on strengthening the safety awareness of the occupant’s training to reduce the probability of accident injuries.
4.2. Characteristics and Analysis of Accident Causes
4.2.1. Accident Cause Characteristics
Through the statistics of 802 major and extra serious traffic accidents, it can be seen that there was more than one cause for the accident, and the occurrence of a single accident is often the result of a variety of factors. In this paper, the influencing factors of the high frequency of accidents caused in the system are selected as the main research objects. Considering a large number of causes of 802 major and extra serious traffic accidents, effective classification must be carried out. Therefore, according to the characteristics of large data volume and the broad content of traffic accident causes, this paper selects the grounded theory with an exploratory function [
46] to extract the concept of accident causes and uses the four steps of open coding, axial coding, selective coding, and saturation tests in this method to decompose and conceptualize them, extract the concept and category, and excavate the core concept of the accident causes to construct the theoretical framework [
47,
48,
49] and obtain the effective category of accident causes. Finally, 1058 effective accident causes and three main cause categories are obtained, which are human factors, vehicle factors, meteorological and road factors, and the three causes are statistically analyzed. The details are shown in
Table 5.
(1) Because the human factor accounts for the largest proportion of the cause of the accidents, which is 72.1%, the human factor is divided into two categories: bad state and bad behavior, to analyze the objective law of human-caused accidents. The number of bad state accidents is 301, and the number of bad behavior accidents is 462. The specific results are shown in
Figure 6 and
Figure 7. It can be seen that the top three accidents in the bad state of people driving are improper measures, failure to observe road conditions, and fatigue driving, accounting for 46.84%, 22.92%, and 21.59%, respectively. The factors that account for a large proportion of bad behavior in people are speeding, not driving safely according to the operating specifications, and not maintaining a safe distance, which are 27.49%, 26.41%, and 22.51%, respectively. These factors are all attributed to the category of human error.
(2) The distribution of vehicle factors is shown in
Figure 8. It can be seen that the vehicle does not meet the technical standards (33.04%), the vehicle braking performance is poor (21.43%), and the wheel tire has burst or locked (20.54%) are the three factors that account for the large proportion of vehicle factors. Among them, the cumulative proportion of accidents caused by vehicle braking and tire problems is as high as 41.97%.
(3) The distribution of meteorological and road factors is shown in
Figure 9. It can be seen from
Figure 9 that icy or slippery roads account for the largest proportion, 42.08%, followed by low visibility in rain and fog, accounting for 22.95%, followed by sudden mass fog, accounting for 14.21%. It can be seen that the impact of driving in bad weather (rain, snow, and fog) is quite serious.
4.2.2. Analysis of Accident Cause Characteristics
(1) From the perspective of human analysis, drivers with rich experience are relatively more confident about complex road conditions and can better predict the movement of vehicles. However, inexperienced drivers often make misjudgments due to psychological factors, such as tension and confusion, thus increasing the risk of accidents. In addition, in recent years, the transportation department has strengthened the supervision of expressway vehicle transportation. In some areas, the retention time of large trucks in high-speed service areas is limited, resulting in drivers’ fatigue driving, speeding, and other bad behaviors in order to accelerate the progress of transportation tasks. Especially in the case of overspeeding without maintaining a safe distance, drivers become prone to serial collisions and multi-vehicle rear-end accidents. Compared with small cars, the braking performance of trucks is poor, and the accident rate will be greatly increased if wet and slippery roads are encountered.
(2) Combined with the above analysis of human-caused accidents, from the perspective of vehicle factors, driving a vehicle that does not meet the technical standards, combined with improper measures in the case of emergency, may lead to poor braking performance or tire locking, thus inducing accidents or further aggravating the consequences of accidents. The accident rate caused by vehicle braking and tire problems is quite high, indicating that these two problems are important risk factors for accidents, which can be further studied. In addition, it is also very important to do a good job in vehicle inspection before driving, especially for the core systems such as power equipment and protective equipment; strict investigation and regular maintenance are needed to reduce the occurrence of accidents caused by vehicle faults.
(3) From the perspective of meteorology and the environment, the impact of bad weather (rain, snow, and fog) is mainly in two aspects. Firstly, the friction coefficient of the road surface is reduced, and the anti-skid ability of the vehicle is reduced due to wet or icy road surfaces. Therefore, the vehicle is often out of control, which leads to accidents. Secondly, bad weather has a great influence on on-road visibility. The action of raindrops, agglomerate fog, snow particles, and light will not only blur the driver’s line of sight but also greatly affect the driver’s ability to distinguish objects, thus reducing the driver’s judgment and inducing accidents.
5. Governance Measures
At present, the number and casualty rate of major and extra serious traffic accidents on expressways in China remains high, which reflects that there are some loopholes and deficiencies in the traffic safety of expressways by the government, relevant departments, and enterprises. Therefore, the corresponding control measures are put forward from four aspects: time, space, accident form, and accident cause.
(1) According to the trend of expressway major and extra serious traffic accidents in the year, it can be seen that after the government introduced the corresponding traffic policy, the accident rate and the number of casualties decreased in the short term, but the continuity was not strong, and there was a rebound, indicating that the current relevant traffic policy lacks long-term effective constraints and control, and has certain limitations. In this regard, the government and relevant departments should build a unified and efficient traffic legal supervision system as soon as possible, supplement and improve laws and regulations, and standardize and unify traffic management standards. In addition, it can be seen from the month that the number of accidents is greatly affected by the season, especially in summer and winter. From the time distribution, it can be seen that the morning peak and night accident rates are higher, which is closely related to the traffic flow and the state of people. Therefore, according to the seasonal changes, the traffic management department can make SMS reminders, an official website push, public number top, and other ways to remind people of the driving matters that should be paid attention to in their daily travel so as to improve the public’s safety awareness; at the same time, the control and protection of expressways should also be strengthened in the high-incidence season and the time period of accidents to reduce the risk of accidents.
(2) According to the distribution of major and extra serious accidents on expressways in various provinces, South China and Northeast China are the areas with a high incidence of accidents, which is related to their geographical environment, economic development, weather conditions, and other factors. In most of the mountainous areas in southern China, hills account for more than 70% of the land area [
50], so most of the expressways are shuttled between the mountains; the Northeast cold and long winter, the average temperature of about minus 20 °C [
51], perennial snow, and a cold and wet climate, are important causes of expressway accidents. Therefore, according to the terrain and climate characteristics, the relevant local transportation departments and expressway management departments should focus on the management of special sections such as long downhill, continuous turning, or snow-serious sections and actively take protective measures to increase safety warning equipment or signs. In case of special weather, the timely release of expressway traffic information and active undertaking of a good job of vehicle guidance should avoid traffic accidents caused by traffic jams.
(3) Vehicle collision is the most common form of traffic accident, with the highest number of accidents and casualties, but the injury rate of rollover on the expressway is more prominent than that of vehicle collisions. In this regard, according to the characteristics of a continuous rollover, vehicle protection equipment can be improved to increase the safety factor of the vehicle. For example, new technologies such as emergency braking induction devices, rear anti-collision alarms, and tire pressure explosion-proof emergency devices can be used to improve the reliability of vehicles. At the same time, the transportation department should also organize and carry out traffic safety publicity, warnings, and education activities, strengthen the safety protection awareness of travel personnel, and take protective measures to reduce the probability of accident injury.
(4) It can be seen from the cause of the accident that the safety problems of major and extra serious accidents on expressways can be discussed from three aspects: human causes, vehicle causes, and meteorological and environmental causes. Among them, improper measures and speeding are the two most frequent causes of accidents among human factors, therefore, indicating whether the professional skills of driving a vehicle are excellent and the driver’s law-abiding consciousness is very important. Therefore, it is necessary to strengthen the learning, and training of driving skills in China and improve the level of driving license examination. At the same time, local governments should also refine traffic regulations, especially increasing law enforcement and reconnaissance for vehicles driving on expressways, and strictly investigate illegal behaviors, such as speeding, overload, and fatigue driving, so as to curb the occurrence of traffic accidents. In addition, braking performance and tire problems in vehicle factors are also important factors leading to accidents, indicating that the safety inspection work before driving is not in place, resulting in hidden vehicle dangers that threaten driving safety. Therefore, it is necessary to pay attention to the maintenance of vehicles and the investigation of hidden dangers. In particular, transportation enterprises and passenger service companies should establish a system of investigation and the management of hidden dangers, conduct regular self-examination, sort out the internal hidden dangers in time, and establish a long-term mechanism for the management of hidden dangers according to the characteristics and laws of hidden dangers, so as to reduce the occurrence of accidents.
6. Conclusions and Prospect
Based on a total of 802 cases of major traffic accidents on expressways from 2011 to 2021, this paper makes a statistical analysis of the time distribution, spatial distribution, accident form, and accident cause and deeply discusses the characteristics of major traffic accidents on expressways in China. According to the statistical results, the number of major traffic accidents on expressways in the past 10 years has developed in a fluctuating state, with three peak values of accidents in 14, 18, and 21 years, respectively. The overall number of casualties showed a fluctuating downward trend, from the highest death toll of 574 and the highest number of injuries of 912 in 2011 to the lowest death toll of 196 and the lowest number of injuries of 336 in 2019. Compared with the accident number curve, the overall fluctuation of casualties decreased more significantly. The number of accidents decreased significantly from January to March, and the trend showed 3 ‘^’ shapes from April. The trend of the curve in the number of deaths and the number of injuries is similar, and the overall correlation is highly fluctuating, but there are differences in the months where the peaks appear. The number of major and extra-serious traffic accidents in January, May, August, and November was higher, while the number of deaths in February, August, and November was higher, with the peak number of injuries in January, June, and November. During the time period 6: 00~8: 00 every day is the highest accident rate and casualty time. In South China, including Guangxi, Guangdong, Fujian, and Yunnan, there are many serious traffic accidents on expressways. Affected by extreme weather, Heilongjiang, Xinjiang, and other provinces have frequent major and extra serious traffic accidents, which need to be controlled and vigilant. In the accident form, the number of vehicle collision deaths is the highest, and the rollover injury rate is the highest. Human factors account for 72.1% of the causes of accidents. Improper measures and speeding account for the largest proportion of people’s bad state and bad behavior. Vehicles that do not meet technical standards and icy or slippery roads account for the largest proportion of vehicle factors and meteorological and road factors.
Due to the limited channels of data collection, this paper failed to collect more information about the accident vehicle types, accident road, traffic flow, and so on. Next, we can negotiate and cooperate with the accident statistics platform, the transportation department, and the emergency management department to open up more comprehensive accident information and continuously improve the content of the traffic accident database to improve the quality of accident information. In addition, the accident statistical method can be further optimized, and the characteristics of the interaction between multiple factors can be further studied so as to better discover the mechanism and law of accident disaster and prevent the occurrence of similar accidents.


