Article

Design of Sustainable Asphalt Mixtures for Bike Lanes Using RAP and Ceramic Waste as Substitutes for Natural Aggregates

by
David Llopis-Castelló
1,*,
Carlos Alonso-Troyano
1,
Pablo Álvarez-Troncoso
2,
Aida Marzá-Beltrán
2 and
Alfredo García
1
1
Highway Engineering Research Group (HERG), Universitat Politècnica de València, Camino de Vera s/n, 46022 Valencia, Spain
2
BECSA S.A.U., Edificio Simetría, Paseo Buenavista s/n, 12100 Grao de Castellón, Spain
*
Author to whom correspondence should be addressed.
Sustainability 2022, 14(23), 15777; https://doi.org/10.3390/su142315777
Submission received: 7 November 2022 / Revised: 23 November 2022 / Accepted: 25 November 2022 / Published: 27 November 2022
(This article belongs to the Special Issue Road Safety and Better Mobility in Sustainable Urban Transport)

Abstract

:
The European Union is promoting a circular economy in which waste management plays an essential role. Although many studies focusing on the use of recycled materials in the manufacture of asphalt mixtures for roads have been developed, studies related to the use of recycled materials for the construction of bike lanes are scarce. In this context, the main objective of this research is to explore the behaviour of asphalt mixtures with high replacement rates of recycled materials—reclaimed asphalt pavement (RAP) and ceramic waste—by natural aggregates for the construction of bike lanes. A total of six types of asphalt mixtures were designed by combining the content of the recycled materials and natural aggregates, with replacement rates ranging from 50% to 100%. The asphalt mixtures were characterized by determining the bulk and maximum density; the void content in the mixture; and the aggregate, stability, and deformation. In conclusion, the mixture C50R50, which consists of a full replacement of natural fine and coarse aggregates by 50% ceramic waste aggregate and 50% RAP, is proposed as the most appropriate sustainable solution. In this way, the use of this asphalt mixture allows for boosting the use of recycled aggregates as well as minimizing the consumption of virgin bitumen due to its residual bitumen content. Compared to the reference asphalt mixture consisting of 100% of natural aggregates, C50R50 is a more open mixture, with higher void content and somewhat more brittleness. Even so, the mixture C50R50 could be good enough for use in low traffic roads.

1. Introduction

Transportation is responsible for a large part of the impacts on the environment, mainly due to its high energy consumption and greenhouse gas emission rates [1]. Within the transport sector, a large amount of greenhouse gases is associated with roads, especially during the operating phase, as a result of the emissions produced by the vehicles travelling on them. Although administrations have little room for manoeuvre in this area, they are heavily involved in the road construction and maintenance phases, which can produce up to one-fifth of total emissions during the service life of the road [2,3].
The European Union, through the European Green Deal, is committed to a circular economy, where waste management plays an essential role. Specifically, the way in which the waste generated by society is collected and managed can lead to high recycling rates and the return of valuable materials to the economy, or on the contrary, to an inefficient system, leading to negative effects on the environment and significant economic losses. Some of the priority areas in this field are plastics, and construction and demolition waste (CDW). In particular, CDW accounts for 27.6% and 35.9% of total waste in Spain and Europe, respectively, with many of these materials being reusable or recyclable [4].
In this context, the possibility of using the waste generated by society—ceramic waste, end-of-life tires, or plastics—arises as recycled materials for use in road construction. The Directive 2008/98/EC of the European Parliament and Council of November 2008 [5] indicates that, by 2020, the rate of reuse or recycling of waste should be at least 50% by weight. Additionally, in the case of CDW, a reuse and recycling rate of at least 70% by weight should have been achieved. In Spain, despite the fact that the data on reuse and recycling of waste for 2020 are not yet known, it was still far from these objectives in 2018 according to data from the National Institute of Statistics, when a rate of 38.7% was reported [6].
In the field of road construction, research has been carried out on the possibility of using different types of waste as substitutes for the natural aggregates used in the pavement and the subgrade, and even as a partial substitute for bitumen.
One of the most reused wastes in roads composed of bituminous layers is the asphalt pavement itself, better known as reclaimed asphalt pavement (RAP). In 2019, the average percentage of RAP used in hot mix asphalt (HMA) in the US was 35% [7]. The incorporation of RAP not only increases the structural capacity of the asphalt mixture but also reduces the required volume of the new binder, which results in greater sustainability benefits [8]. In environmental terms, the reuse of RAP as an alternative material in base and subbase layers favours the reduction in global warming (20%), energy consumption (16%), water consumption (11%), life cycle costs (21%), and hazardous waste generation (11%) [9]. However, special attention should be paid to the agglomeration of RAP particles in cold recycling. In this regard, Zhu et al. [10] proposed a general indicator of the degree of agglomeration to describe the agglomeration property of RAP and a classification method for RAP particles.
The current use of CDW as recycled material in road construction is focused on the lower layers—base, subbase, or subgrade—but in low-volume roads, these wastes can also be adopted for the surface or binder courses. CDW aggregates can be classified, in addition to as RAP, into the following categories: (i) recycled concrete aggregates (RCA), (ii) recycled masonry aggregates (RMA), (iii) mixed recycled aggregates (MRA), (iv) and construction and demolition recycled aggregates (CDRA) [11].
Concerning the use of ceramic wastes as substitutes of the fine and coarse aggregates in asphalt mixtures, several studies concluded that the permanent deformations of asphalt mixtures were reduced with respect to the control sample [12,13,14,15]. However, the use of a modified binder can face this issue of asphalt mixtures consisting of ceramic waste [16].
Silvestre et al. [14] also concluded that the use of recycled ceramic aggregate, up to replacement rates of 30%, increased the content of binder and filler as well as the void contents. Likewise, the indirect tensile strength rises, while moisture susceptibility worsened. The same authors evaluated porous asphalt mixtures manufactured with 30% ceramic waste by mass of total aggregates, obtaining a lower tensile strength than the control specimen [15].
Furthermore, Tavira et al. [17] studied the feasibility of using low-quality recycled mixed aggregates from CDW and the screened material obtained in this process as materials for the structural layers—base and subbase—of a paved bicycle lane that requires less demanding mechanical properties than roads. In view of the results obtained, new technical specifications for granular bases in the construction of bicycle lanes were proposed.
Blast furnace slag (BFS) has also been used as a substitute for the fine and coarse fraction of aggregates, being one of the best performing recycled materials [18]. Diverse studies concluded that by replacing 60% of natural aggregates by BFS, significant improvements were achieved in terms of plastic deformation, cracking at low temperatures, and moisture resistance [19,20,21,22]. However, the use of this type of waste requires a higher bitumen content, which reduces its environmental benefits and favours exudation, which reduces the skid resistance of the pavement [23].
In addition to the waste materials presented above, other studies have been carried out focusing on plastic [24], glass [25], and cellulose [26,27] waste. However, these wastes are better utilized in other industries, obtaining greater environmental and economic benefits.
Summarizing, the main waste materials used in road construction are CDW—mainly RAP, RAC, and ceramic waste—and BFS. Although a lot of research has been developed in this field, studies related to the use of recycled materials for the construction of bike lanes are scarce. In this context, many administrations and municipalities have designed a multitude of sustainable urban mobility plans that include, in many cases, cycling networks yet to be built in both urban and interurban areas. Unlike pavements designed for highways, bike lanes must withstand little or no traffic loads. However, due to the absence of design guidelines—with experimental basis—for the design of the bike infrastructure, the current pavement structure is over-dimensioned, which is linked to a higher construction cost and a greater environmental impact.
Thus, the main objective of this research is to explore the behaviour of asphalt mixtures with high replacement rates of recycled materials by natural aggregates—fine and coarse fractions—for the construction of bike lanes. Specifically, this study uses RAP and ceramic waste as recycled aggregates since the Valencian Region (Spain) is one of the main producers of ceramics worldwide. In this regard, the maximization of the content of ceramic waste is of great interest.
The rest of the paper is organized as follows: Section 2 presents a description of the recycled materials and the research method; Section 3 shows the results of the proposed asphalt mixtures; Section 4 is focused on the discussion of the findings of the study; and Section 5 includes the main conclusions of the study.

2. Materials and Methods

Figure 1 shows the proposed methodology to analyse the behaviour of asphalt mixtures containing RAP and ceramic waste for surface courses of bike lanes. First, the natural and recycled aggregates were characterized and prepared. Subsequently, the composition of the asphalt mixtures to be studied was defined, and the content of each material, by weight, was determined for a total of five bitumen contents. Regarding this, the selected mixture type was an asphalt concrete for dense surface course with 16 mm maximum aggregate size and standard grade bitumen 35/50 (AC16 surf 35/50 S). For each asphalt mixture, at least three specimens were manufactured. Then, the specimens were characterized according to the following test methods: (i) UNE-EN 12697-8 [28] standard for the determination of void content, (ii) UNE-EN 12697-6 [29] standard for the determination of bulk density, (iii) UNE-EN 12697-5 [30] standard for the determination of maximum density, and (iv) UNE-EN 12697-34 [31] standard for the determination of the stability and deformation of the mixture. As a result, the optimal bitumen content was determined for each asphalt mixture. Finally, a comparative analysis was carried out to identify those asphalt mixtures susceptible to be used in bike lanes.

2.1. Materials

This research uses three types of aggregates: (i) natural aggregates (NA), (ii) ceramic waste aggregates (CWA), and (iii) reclaimed asphalt pavement (RAP).
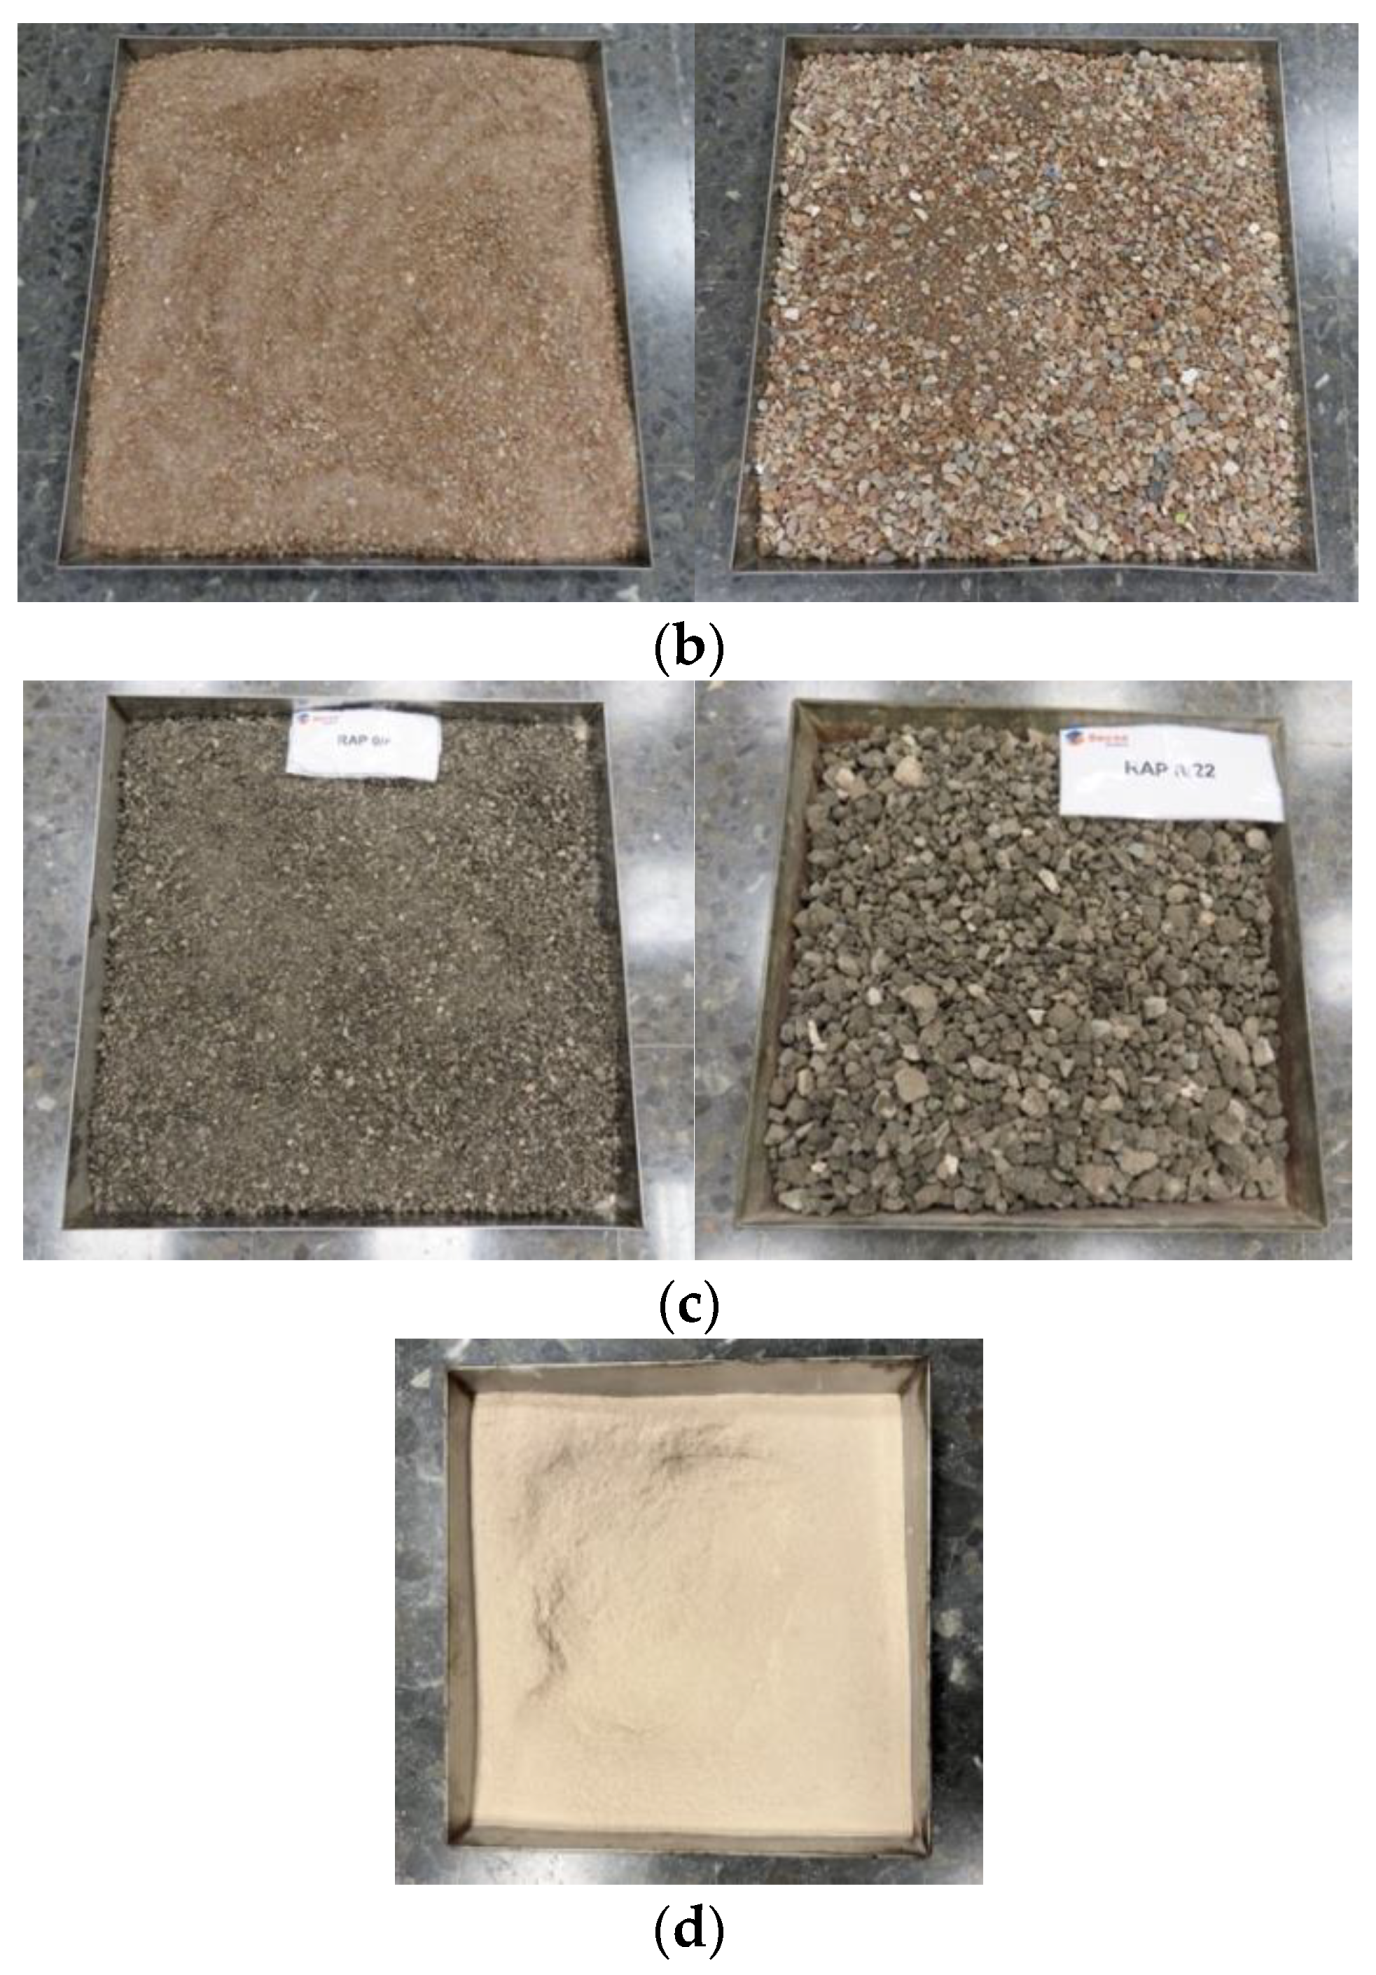
The natural aggregates (NAs) were crushed limestone from quarry (Figure 2a). The fine aggregate had maximum particle size of 4 mm, whereas the coarse aggregate presented a minimum size of 4 mm and a maximum size of 20 mm (Table 1). Likewise, the density and absorption of each fraction of this material are shown in Table 1.
The ceramic waste aggregates, consisting in stoneware and porcelain tiles, are available in two particle sizes: 0–4 mm fine fraction and 4–10 coarse fraction (Figure 2b). The granulometry of each fraction is included in Table 1. In addition, it should be noted that the density of this type of aggregate is lower than NA, while absorption is larger than NA (Table 1). Regarding the reclaimed asphalt pavement, two aggregates fractions were available: 0–8 mm and 8–22 mm (Figure 2c). The granulometry of each fraction and the bitumen content are included in Table 1.
The filler used in each asphalt mixture was recovered from the aggregate processing plant from the production of natural aggregates mix (Figure 2d). Likewise, conventional bitumen with standard penetration grade 35/50 and average properties—Superpave PG 70-22—was chosen (Table 2). This bitumen can be used under different traffic volumes and climates.

2.2. Design of Asphalt Mixtures

Table 3 presents the composition of the studied asphalt mixtures. Due to bike lanes requires a low structural capacity, asphalt mixtures with a high content of recycled materials are proposed. In this way, the replacement rate of recycled materials by natural aggregates—fine and coarse fractions—ranges from 50% to 100%, combining the content of the available materials. Additionally, a conventional asphalt mixture consisting of 100% of natural aggregates was designed to be considered as a reference mixture.
The design process was carried out according to Spanish standards and specifications (PG-3) [33]. The aggregate grading fit was carried out in hot conditions of aggregates mix production, according to granulometric spindles specified in the Spanish standards for the asphalt mixture type AC16 surf 35/50 S (Table 1). In this regard, a total of five different bitumen contents were considered.
The amount of each fraction of material to be used in each asphalt mixture was estimated by means of a script programmed in Python 3.8 based on the numpy and scipy libraries. Specifically, the scipy.optimize library contains the linprog function for solving linear programming problems.
The objective of this script is to solve a mathematical optimization problem immediately. The variables that define the problem are the proportions of each type of aggregate and fraction. Thus, the objective function of the optimization problem is defined by the sum of the content of the fractions of a given aggregate to be maximized or minimized. For example, the objective function for the asphalt mixture C100 is the sum of the proportions of the ceramic waste of its two fractions, since it is desired to maximize its content.
Compliance with the particle size spindles defined for an asphalt mixture type AC16 surf 35/50 S becomes a “less than” and “greater than” constraints. In addition, to meet the conditions related to bitumen content and filler/bitumen ratio, two “equal to” constraints are established. According to the recommendations for this type of asphalt mixture in wearing course, a filler/bitumen ratio equal to 1.2 was considered.
Additionally, a range of values for each of the variables—from 0% to 100%—was defined to help the problem to be solved more efficiently.
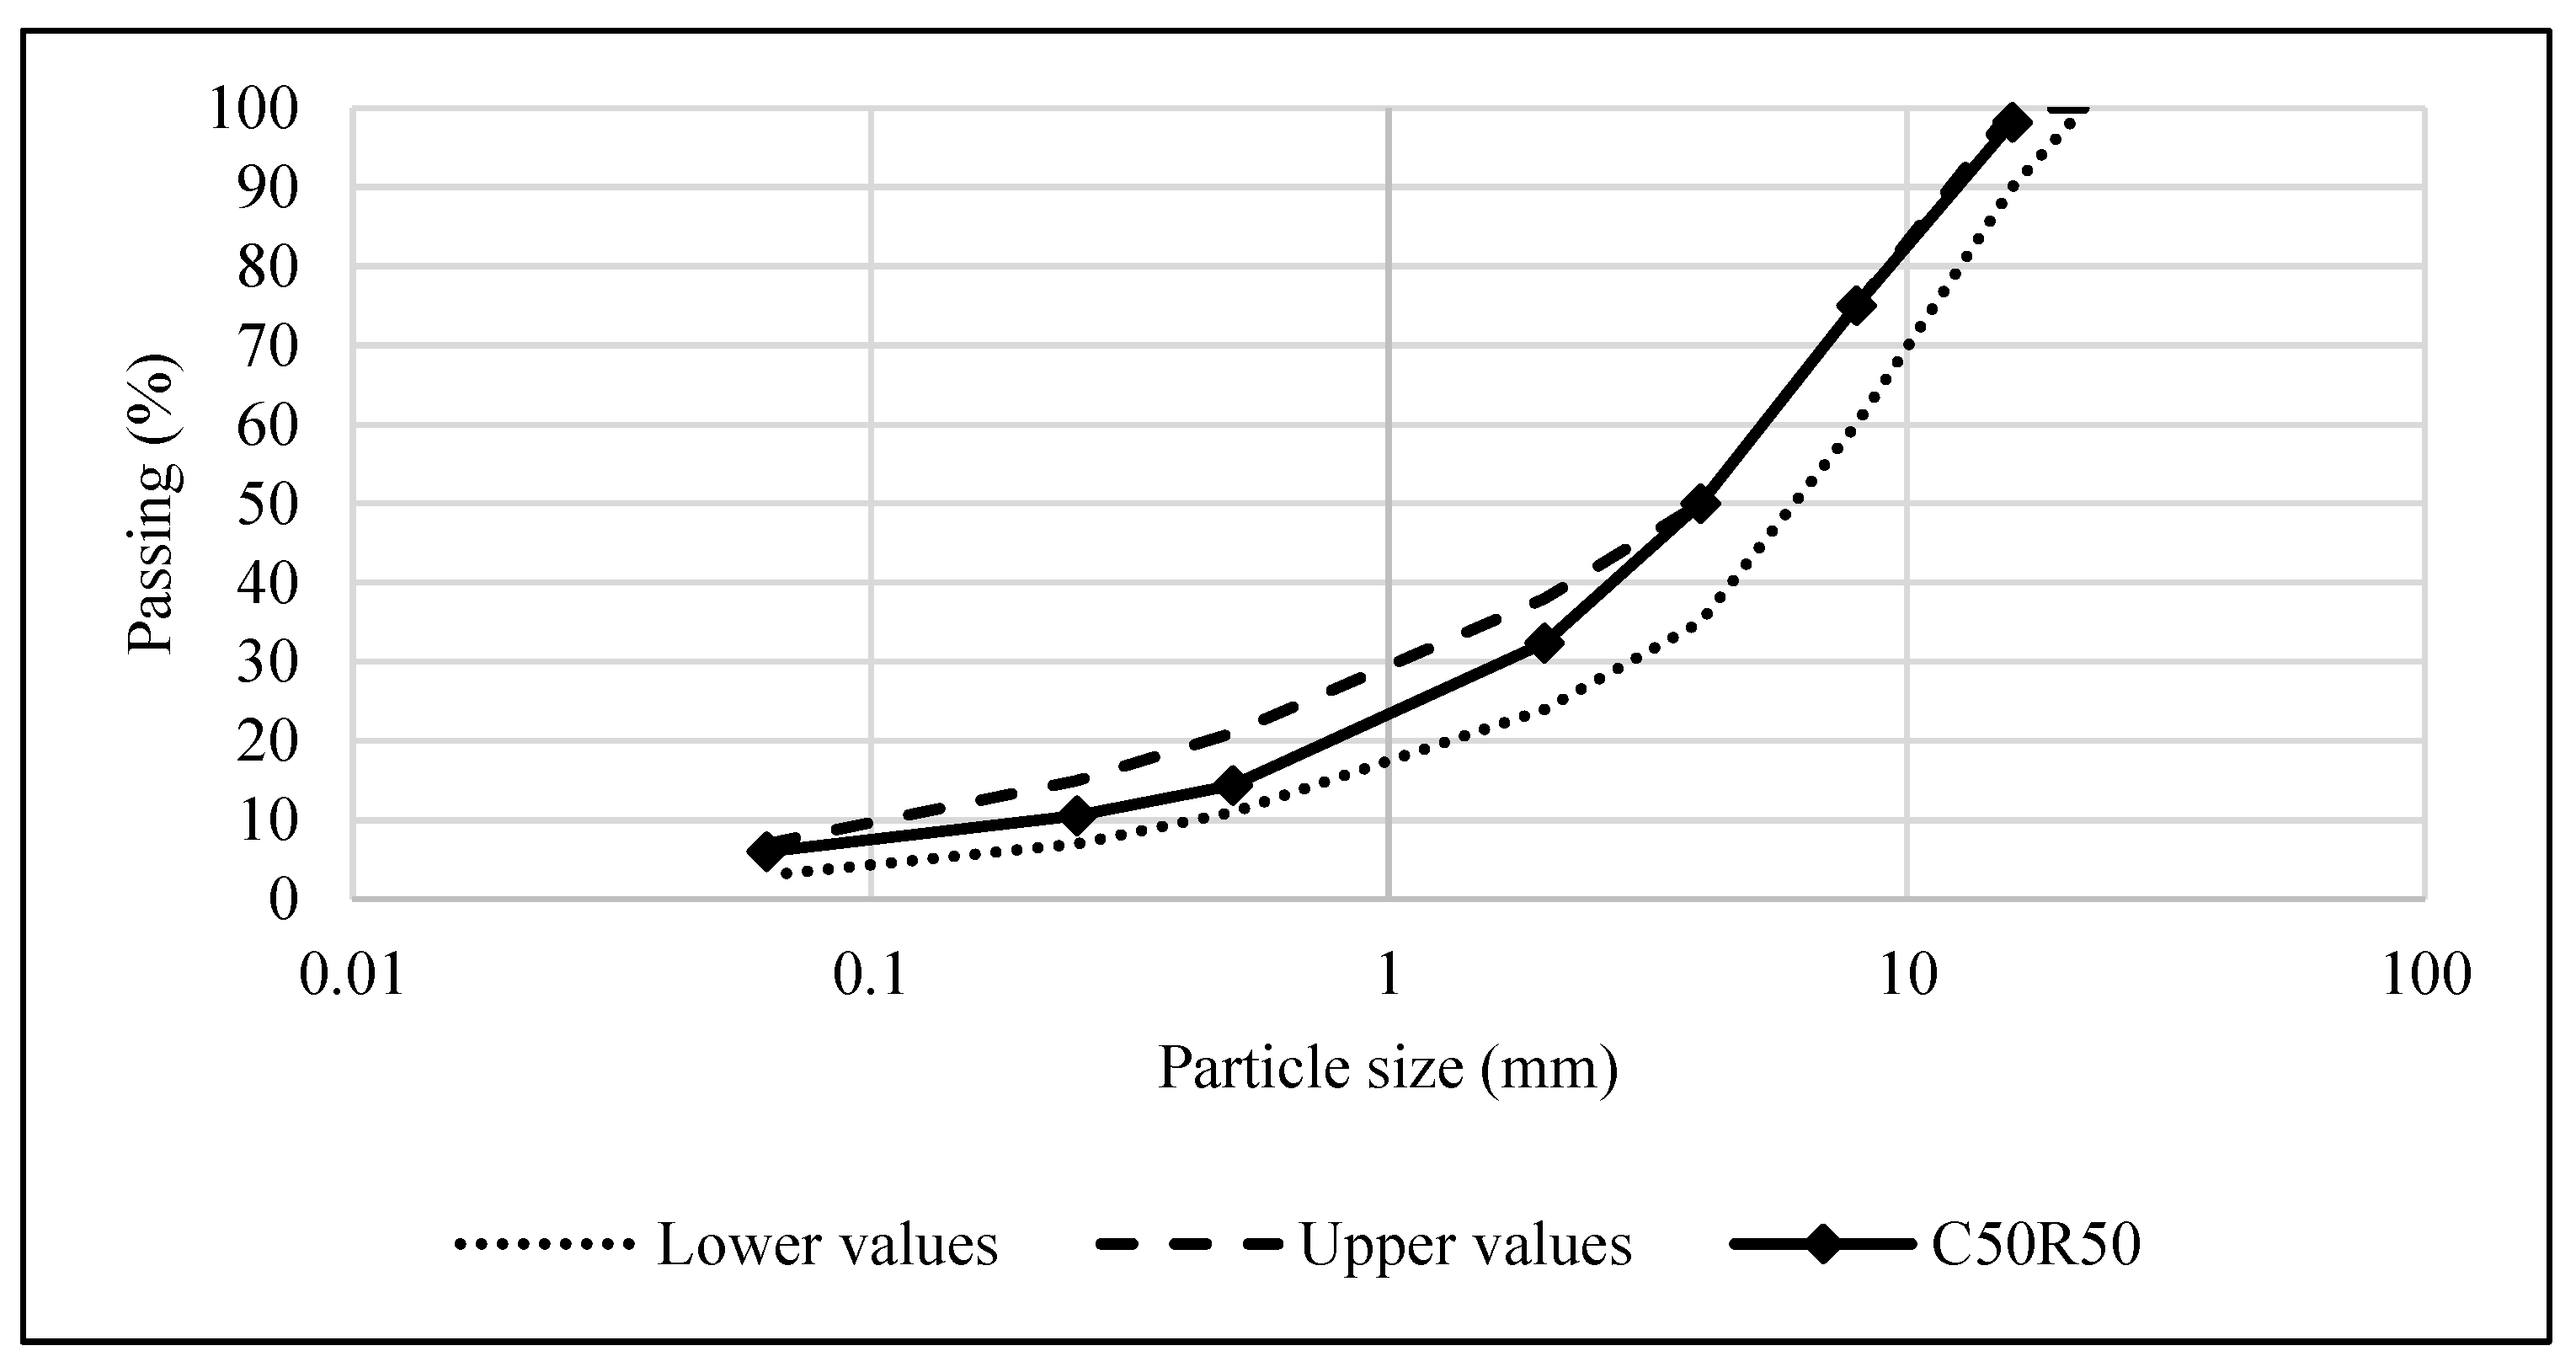
Table 4 shows the content of each NA, CWA, and RAP fraction, for each asphalt mixture to be studied. As an example, Figure 3 shows the particle size distribution for the asphalt mixture C50R50 with a dosage of bitumen of 5%.

2.3. Manufacturing of Asphalt Mixture Specimens

The manufacturing process begins with the pre-conditioning of the materials that compose the asphalt mixtures. Once the aggregates and bitumen reached mixing temperature (155 °C–165 °C), they were mixed together with the bitumen to obtain the asphalt mixture according to the UNE-EN 12697-35 [34]. The mixing time depended mainly on the bitumen content, so that for low bitumen contents, a longer mixing time was required than for high bitumen contents.
After mixing, at least three specimens were prepared according to the UNE-EN 12697-30 [35]. In this regard, the specimens were compacted by applying 75 blows per side to obtain specimens of Ø101.6 mm and 63.5 mm in height. Once compacted, the specimens were left to cool to laboratory temperature (20–25 °C) and then demoulded.
These specimens were then tested so as to identify the optimal bitumen content of each asphalt mixture included in Table 3.

3. Results

This section presents, for each asphalt mixture and bitumen content, the results of the following tests:
i.
Determination of void content (UNE-EN 12697-8) [28];
ii.
Determination of bulk density (UNE-EN 12697-6) [29];
iii.
Determination of maximum density (UNE-EN 12697-5) [30];
iv.
Determination of the stability and deformation of the mixture (UNE-EN 12697-34) [31].

3.1. Asphalt Mixture C100

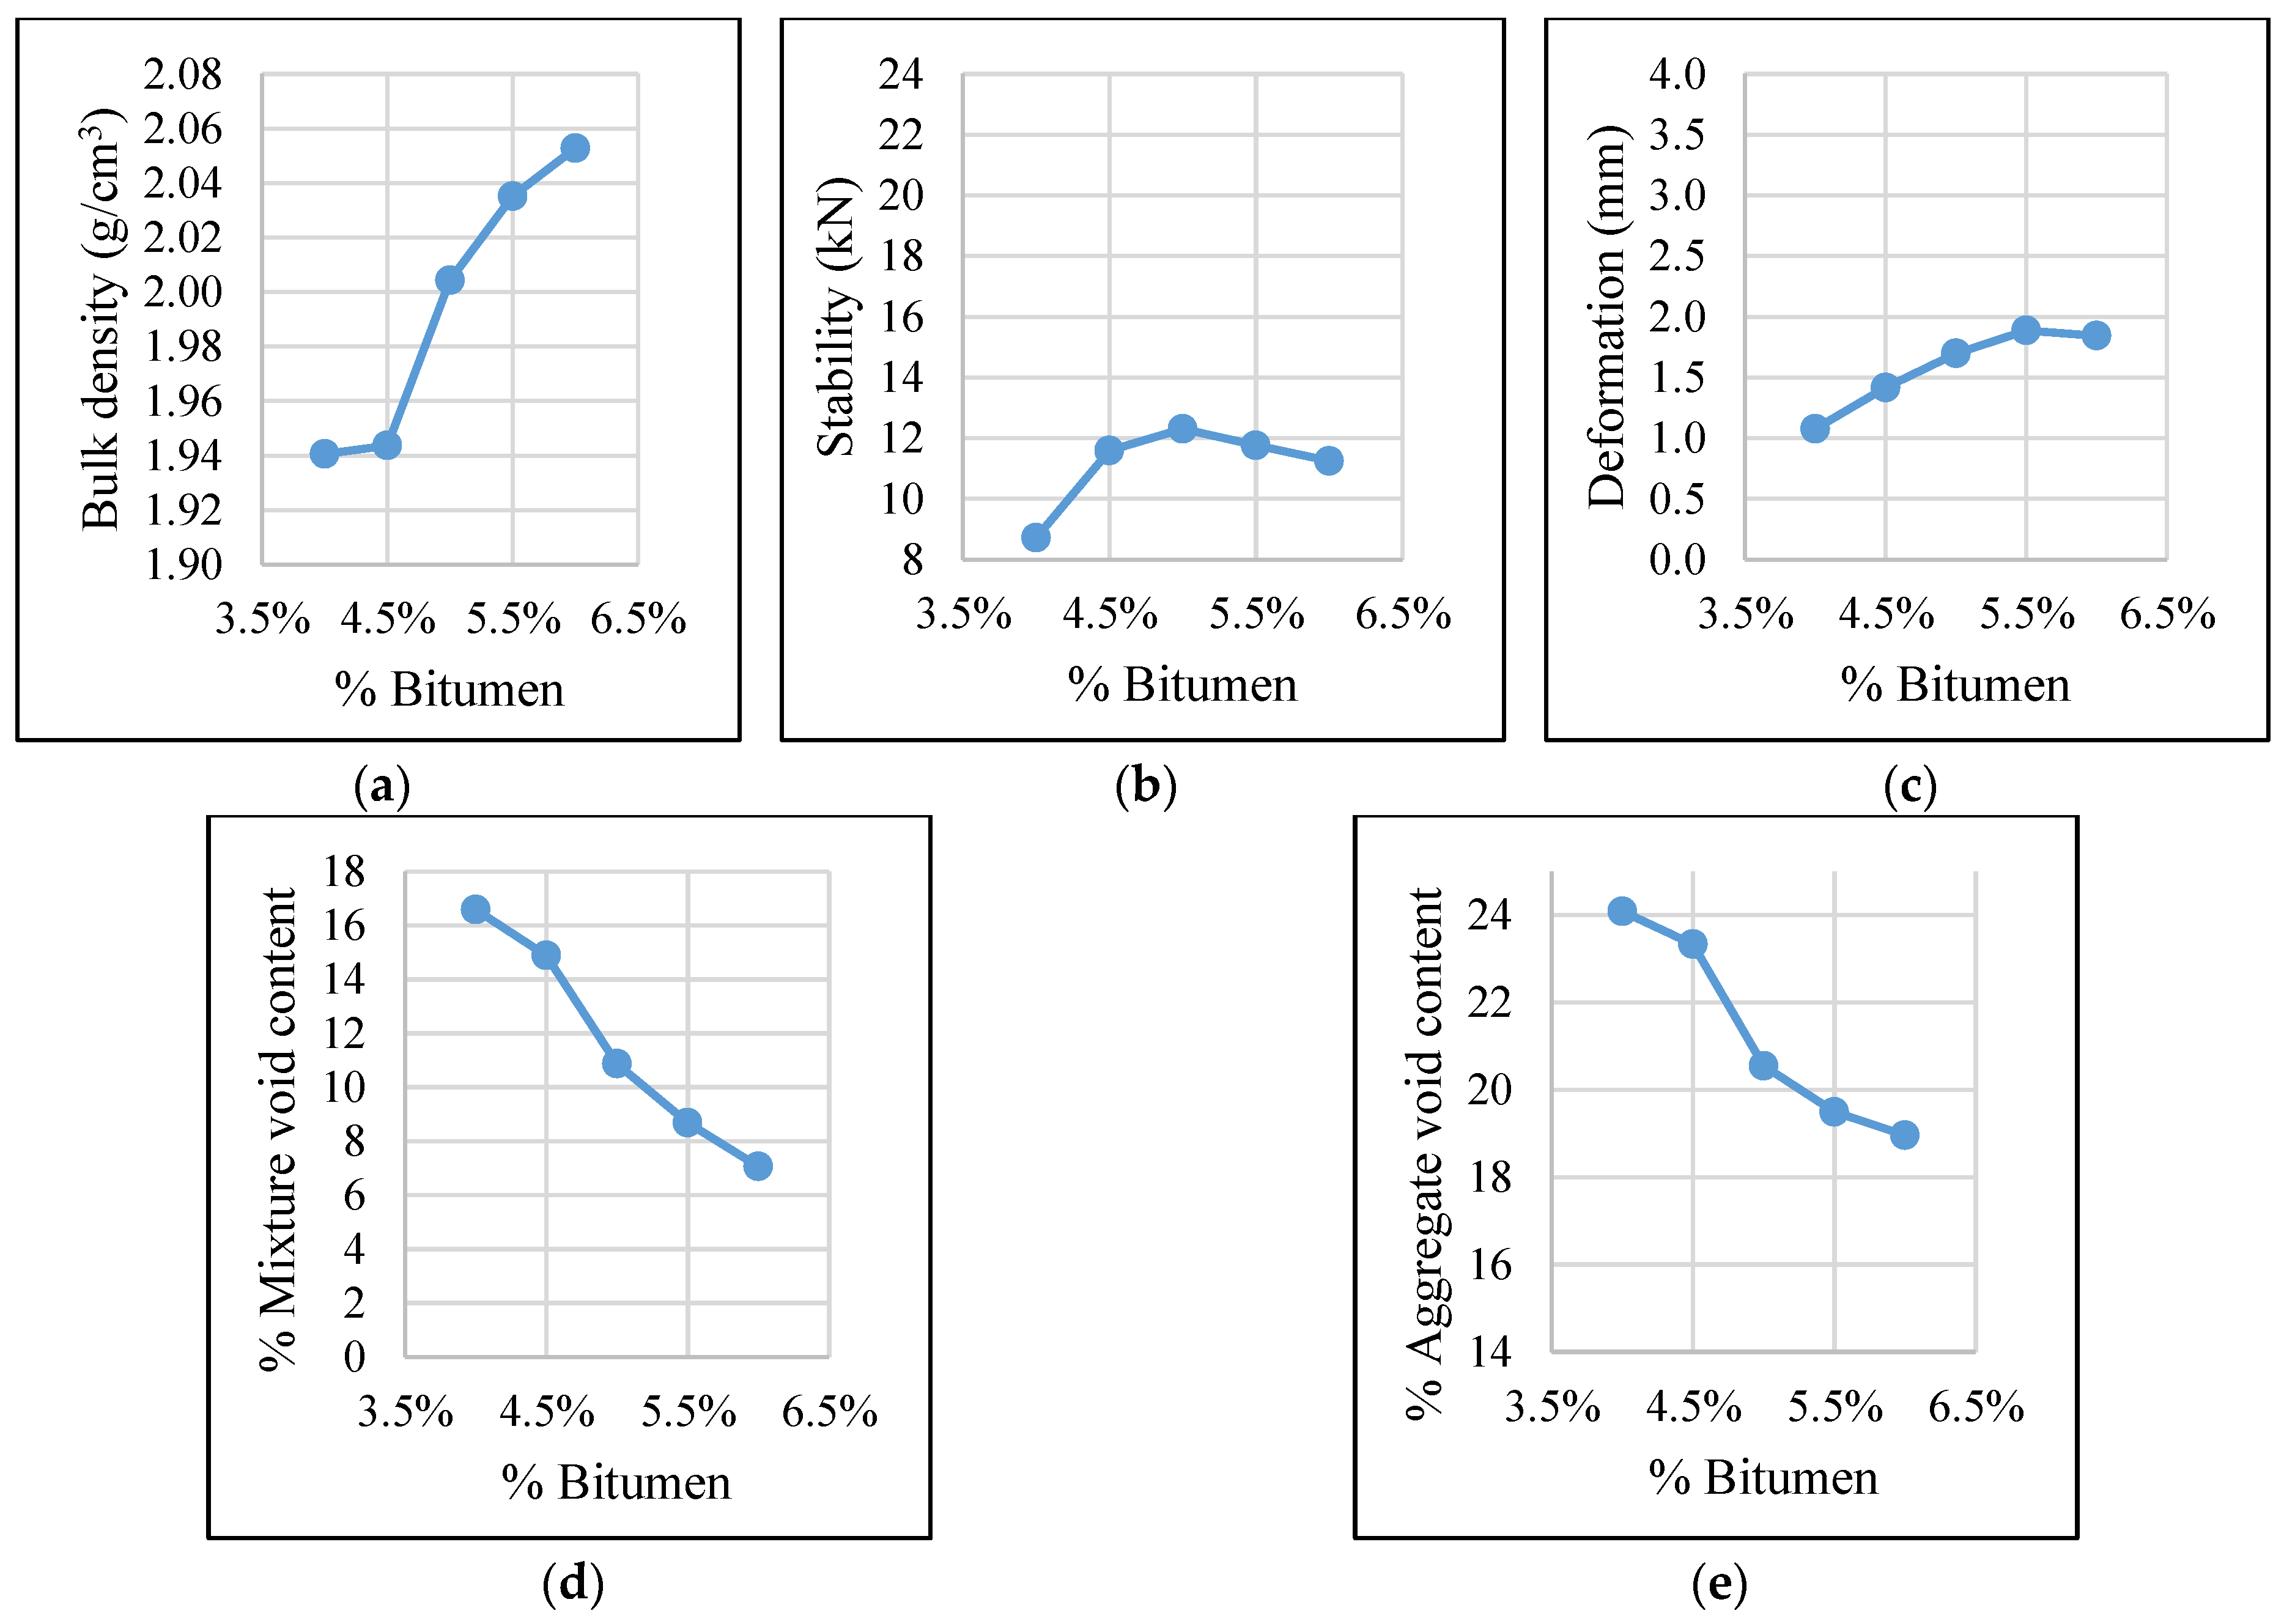
Figure 4 shows the results obtained for the asphalt mixture made of practically 100% of ceramic waste aggregates (CWA). Regarding this, only filler had to be used in proportions between 4% and 7% depending on the binder content (see Table 4).
The trends shown in Figure 4 follow the common behaviour of a hot mix asphalt. The density of the mixtures increases as the bitumen content increases to values slightly above 2 g/cm3 (Figure 4a), while the content of voids in the mixture declines to values above 7% (Figure 4d).
In addition, the diagrams associated with stability (Figure 4c) and void content in the aggregate (Figure 4e) allow for identifying the optimal bitumen content, which is chosen by seeking to maximize the first of these properties while minimizing the second one. Finally, the deformation rises as the bitumen content does, reaching values close to 1.8 mm (Figure 4c).
Considering stability, the optimal bitumen content is 5.0% when reaching a value above 12 kN. However, the void content in the aggregate continues to decrease even for the highest bitumen contents. Thus, since the stability does not undergo a large decrease for high bitumen contents, the optimum is considered to be 6.0%, for which the aggregate void content is 19%. A binder content of 6.5% could have been studied to check if the aggregate void content stabilizes or even increases, but since the objective of the study is to obtain more sustainable asphalt mixtures, reducing the binder content in the mixtures is a priority.

3.2. Asphalt Mixture C50R50

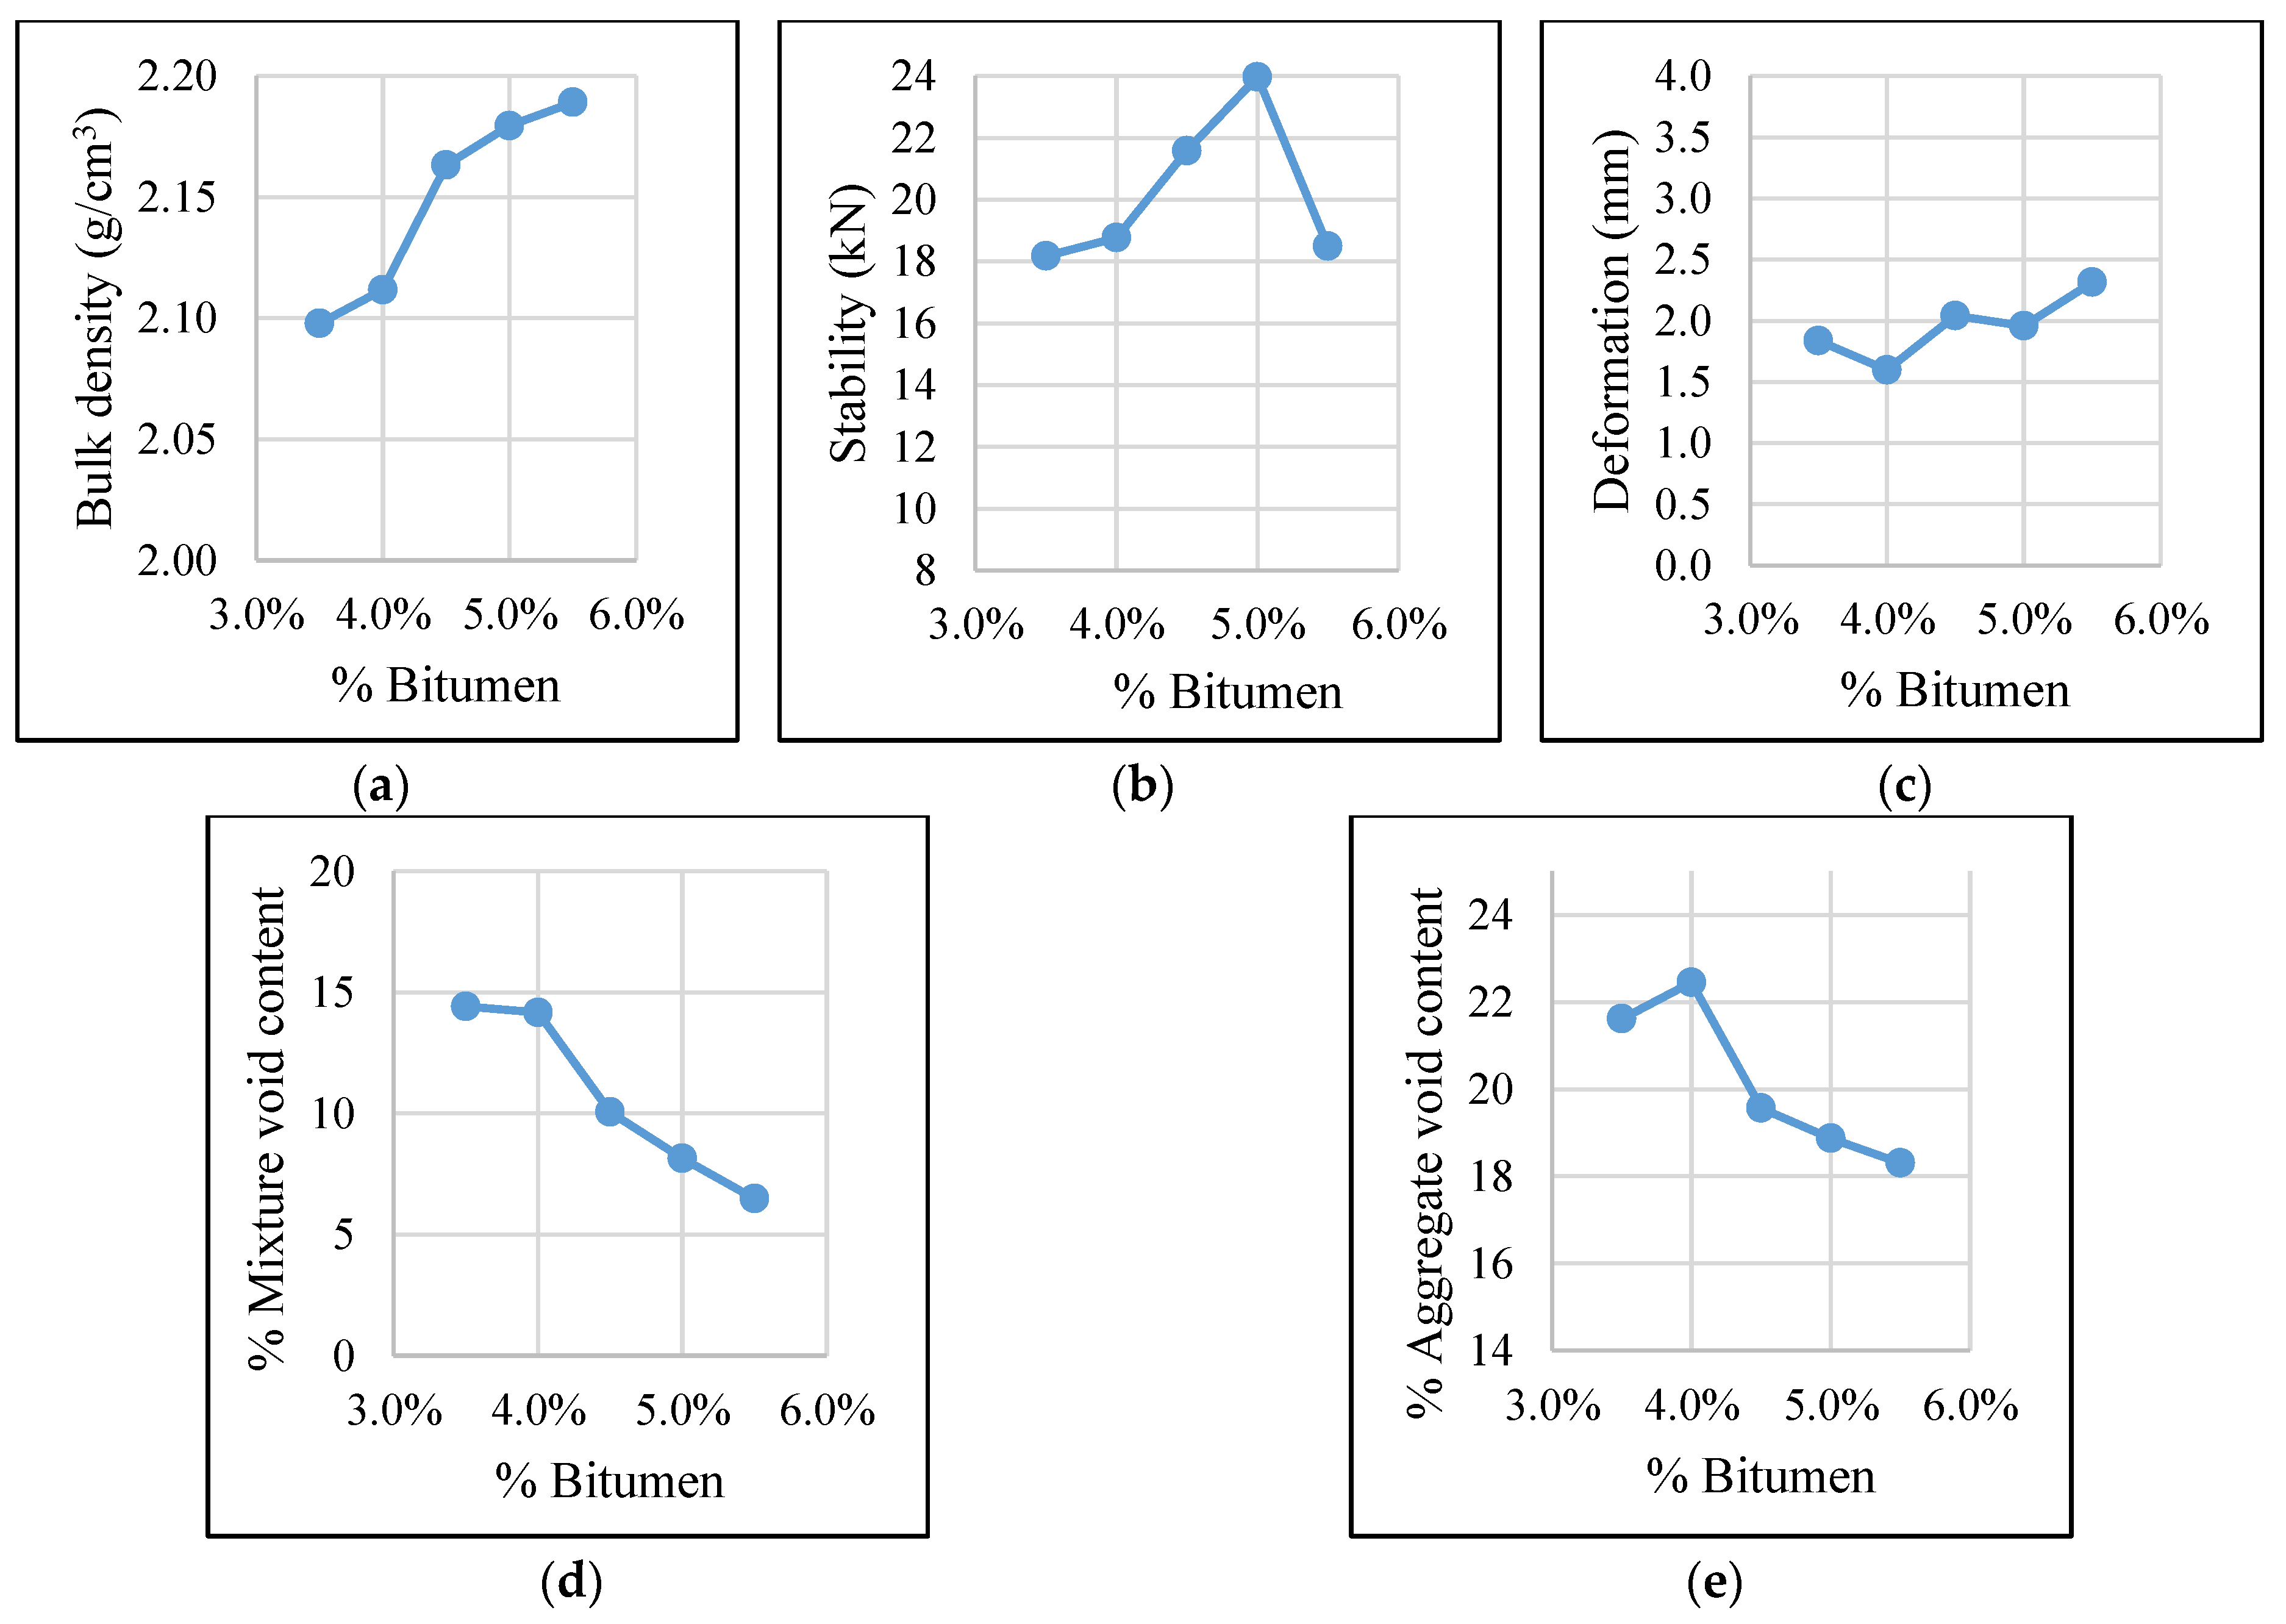
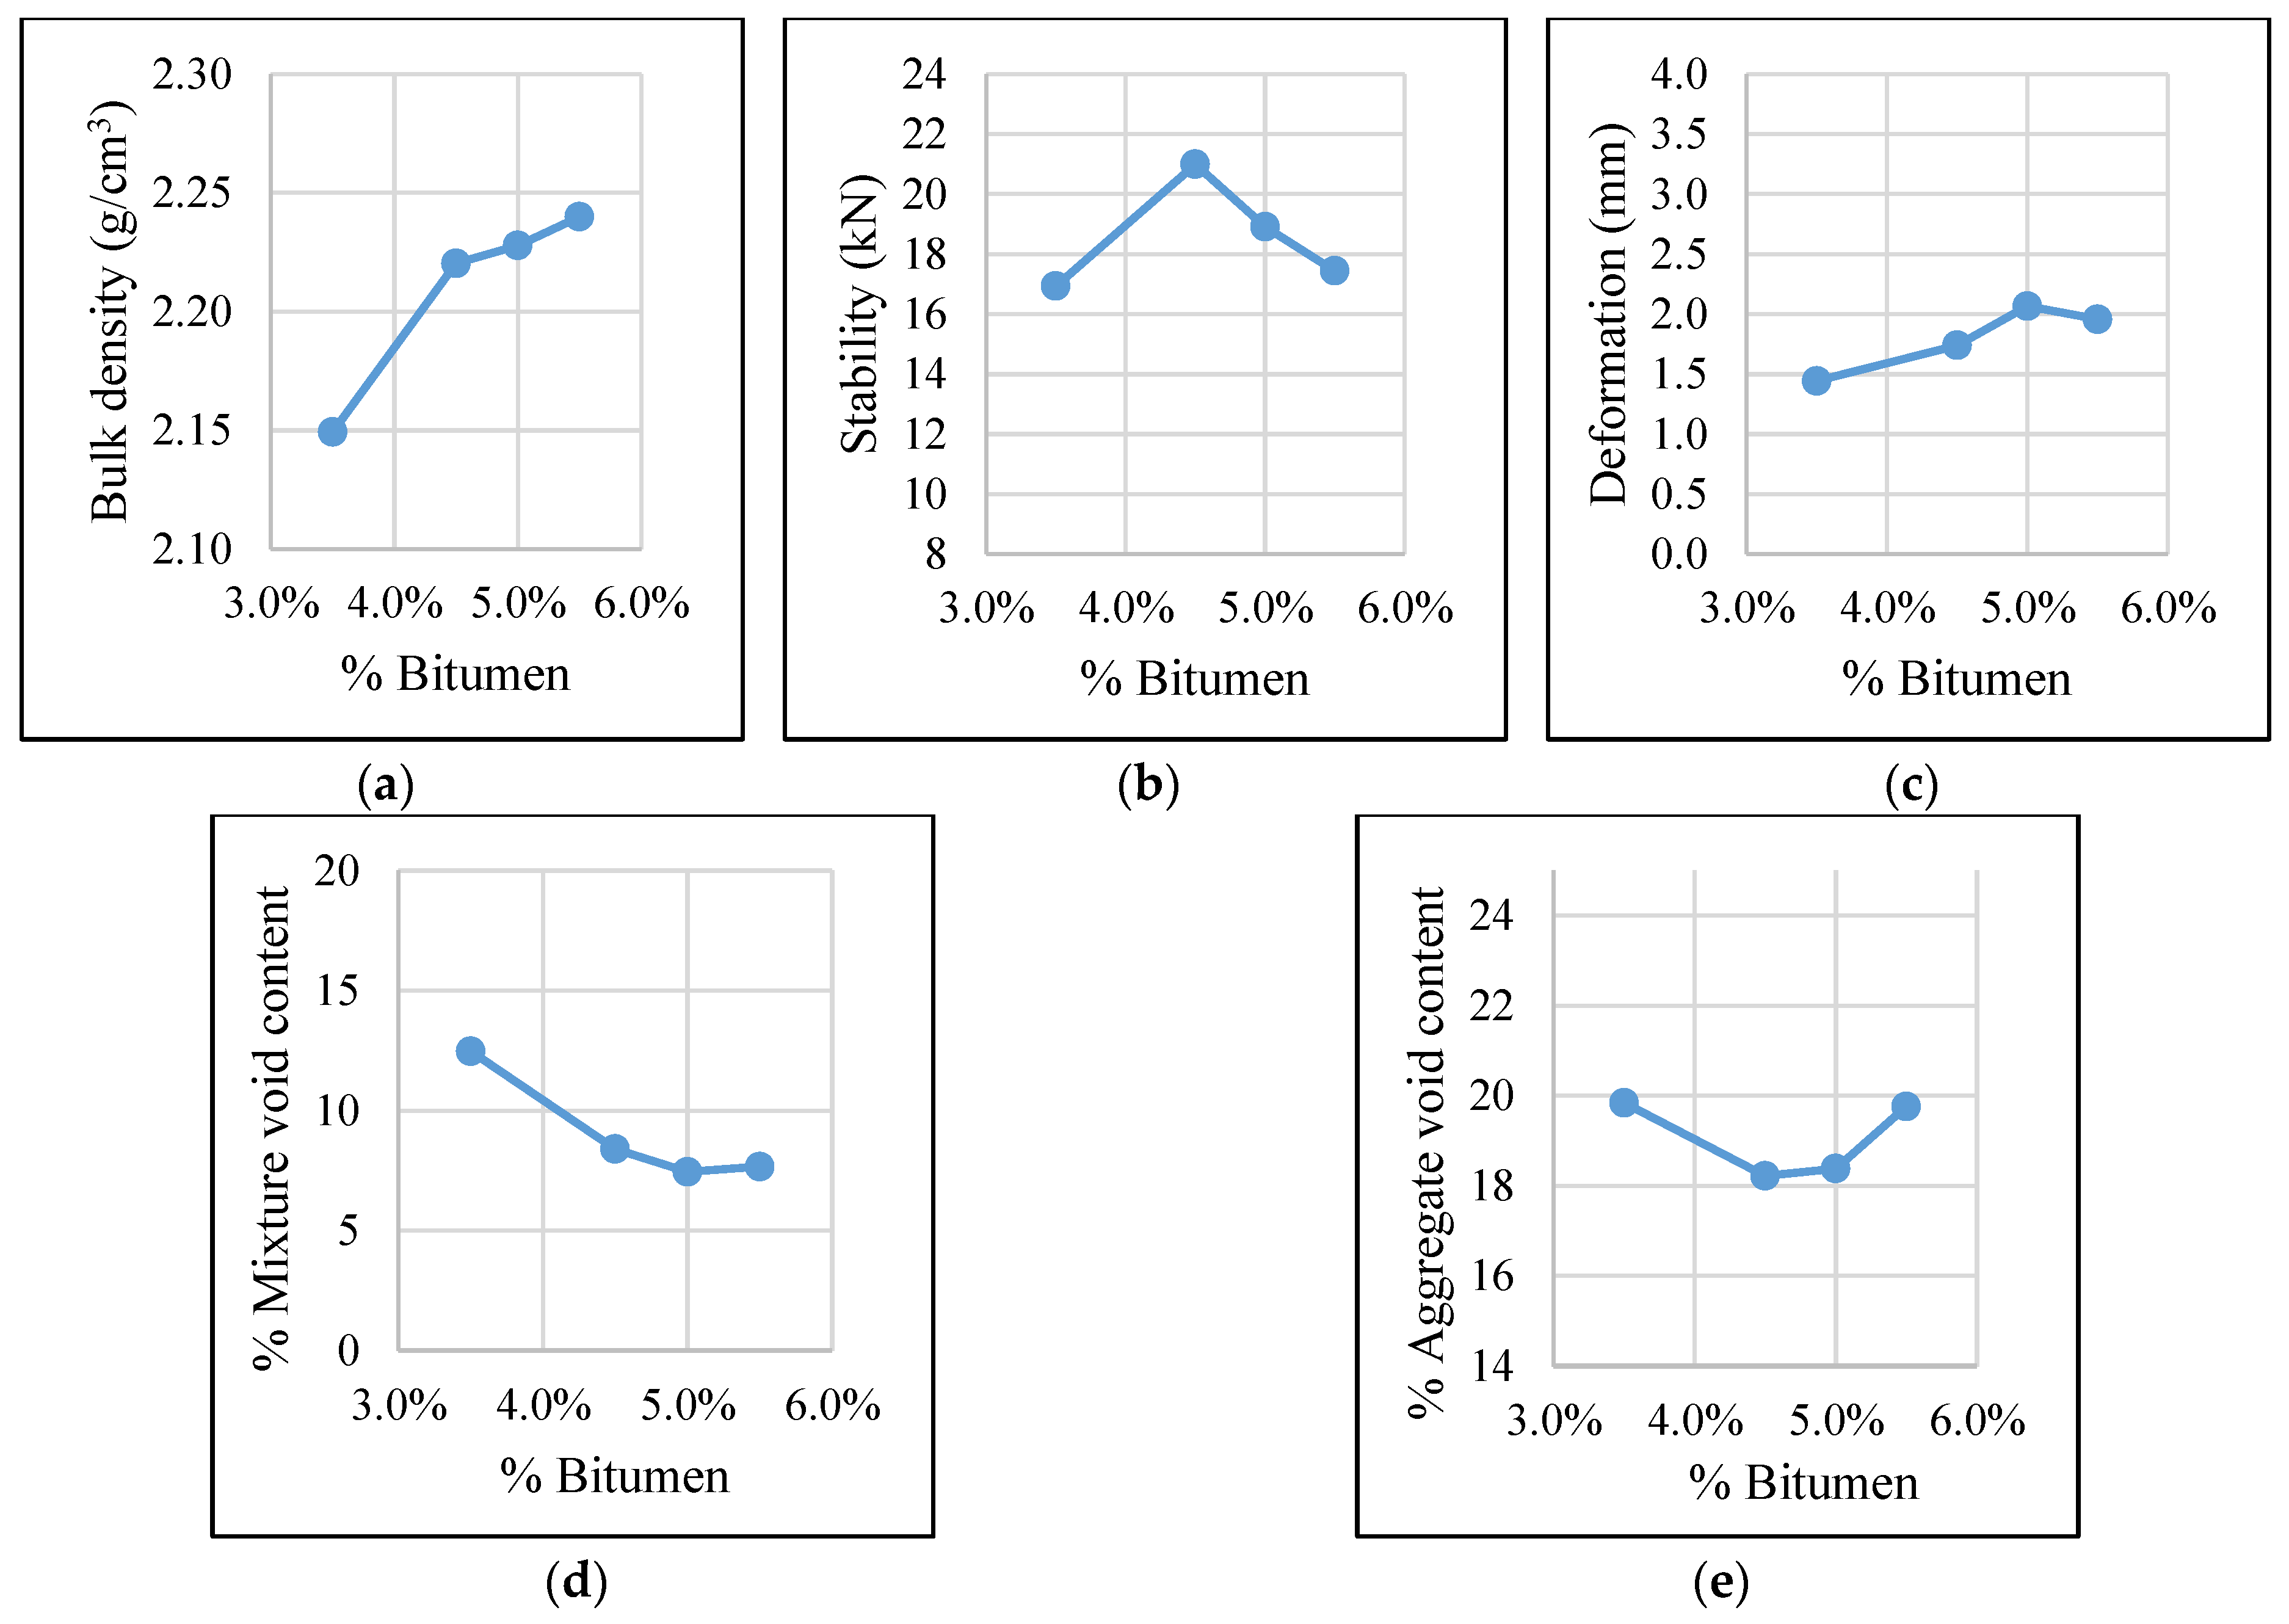
Figure 5 presents the results obtained for the asphalt mixture consisting of 50% CWA and 50% RAP. The trends described in Figure 5 follow, apart from a few isolated points, the usual behaviour of an asphalt mixture.
The density of the mixture increase with the bitumen content, reaching values between 2.1 and 2.2 g/cm3 (Figure 5a), while the content of voids in the mixture decreases to almost 6% (Figure 5d). While the maximum stability—slightly lower than 25 kN—is achieved for a binder content of 5.0% (Figure 5b), the aggregate void content does not show a minimum for the proposed binder contents (Figure 5e). However, this bitumen content can be considered as the optimum because the design of sustainable asphalt mixtures is associated with a reduced binder content.
Furthermore, it should be noted that the deformation shows an unstable trend, with values higher than 2 mm for binder contents between 4.5% and 5.5% (Figure 5c).

3.3. Asphalt Mixture C35R50A15

Figure 6 shows the results obtained for the asphalt mixture composed of 35% CWA, 50% RAP, and 15% of natural aggregates (NA). The trends shown in Figure 6 describe, in general, the common behaviour of asphalt mixtures. For this mixture, the results associated with a binder content of 4% were removed due to diverse issues during the manufacture process.
The density of the asphalt mixture increases as the bitumen content does, reaching values above 2.2 g/cm3 (Figure 6a), while the void content in the mixture decreases below 8% at high binder contents (Figure 6d). The maximum stability—above 20 kN—was reached for a binder content of 4.5% (Figure 6b), while the minimum void content in the aggregate—above 18%—occurs for the same binder content (Figure 6e). Therefore, the optimal bitumen content for this asphalt mixture was achieved for a binder content of 4.5%.
However, the deformation for that bitumen content is less than 2 mm (Figure 6c), so it would be desirable to increase the bitumen content to 5.0% to have a more deformable mixture while stability and void content in the aggregate are still adequate.

3.4. Asphalt Mixture C50R25A25

Figure 7 shows the results obtained for the asphalt mixture consisting of 50% CWA, 25% RAP, and 25% NA. For this asphalt mixture, the results associated with a binder content of 5.5% were removed due to diverse issues during the manufacture process.
As expected, the density increases with the bitumen content, reaching values of about 2.15 g/cm3 (Figure 7a), while the content of voids in the mixture declines to almost 8% at a binder content of 5.0% (Figure 7d). The stability is fairly uniform, taking values from 17 to 19 kN, not showing a clear maximum value (Figure 7b). Likewise, it seems the minimum void content in the aggregate has not been reached for the studied binder contents. In this way, the optimal bitumen content is defined at 5.0%, considering that from this point onwards there will no longer be a significant reduction in the aggregate void content. Deformation ranges from 1.5 to 2 mm, with a value of 1.75 mm for the selected optimal bitumen content (Figure 7c).

3.5. Asphalt Mixture C35R25A40

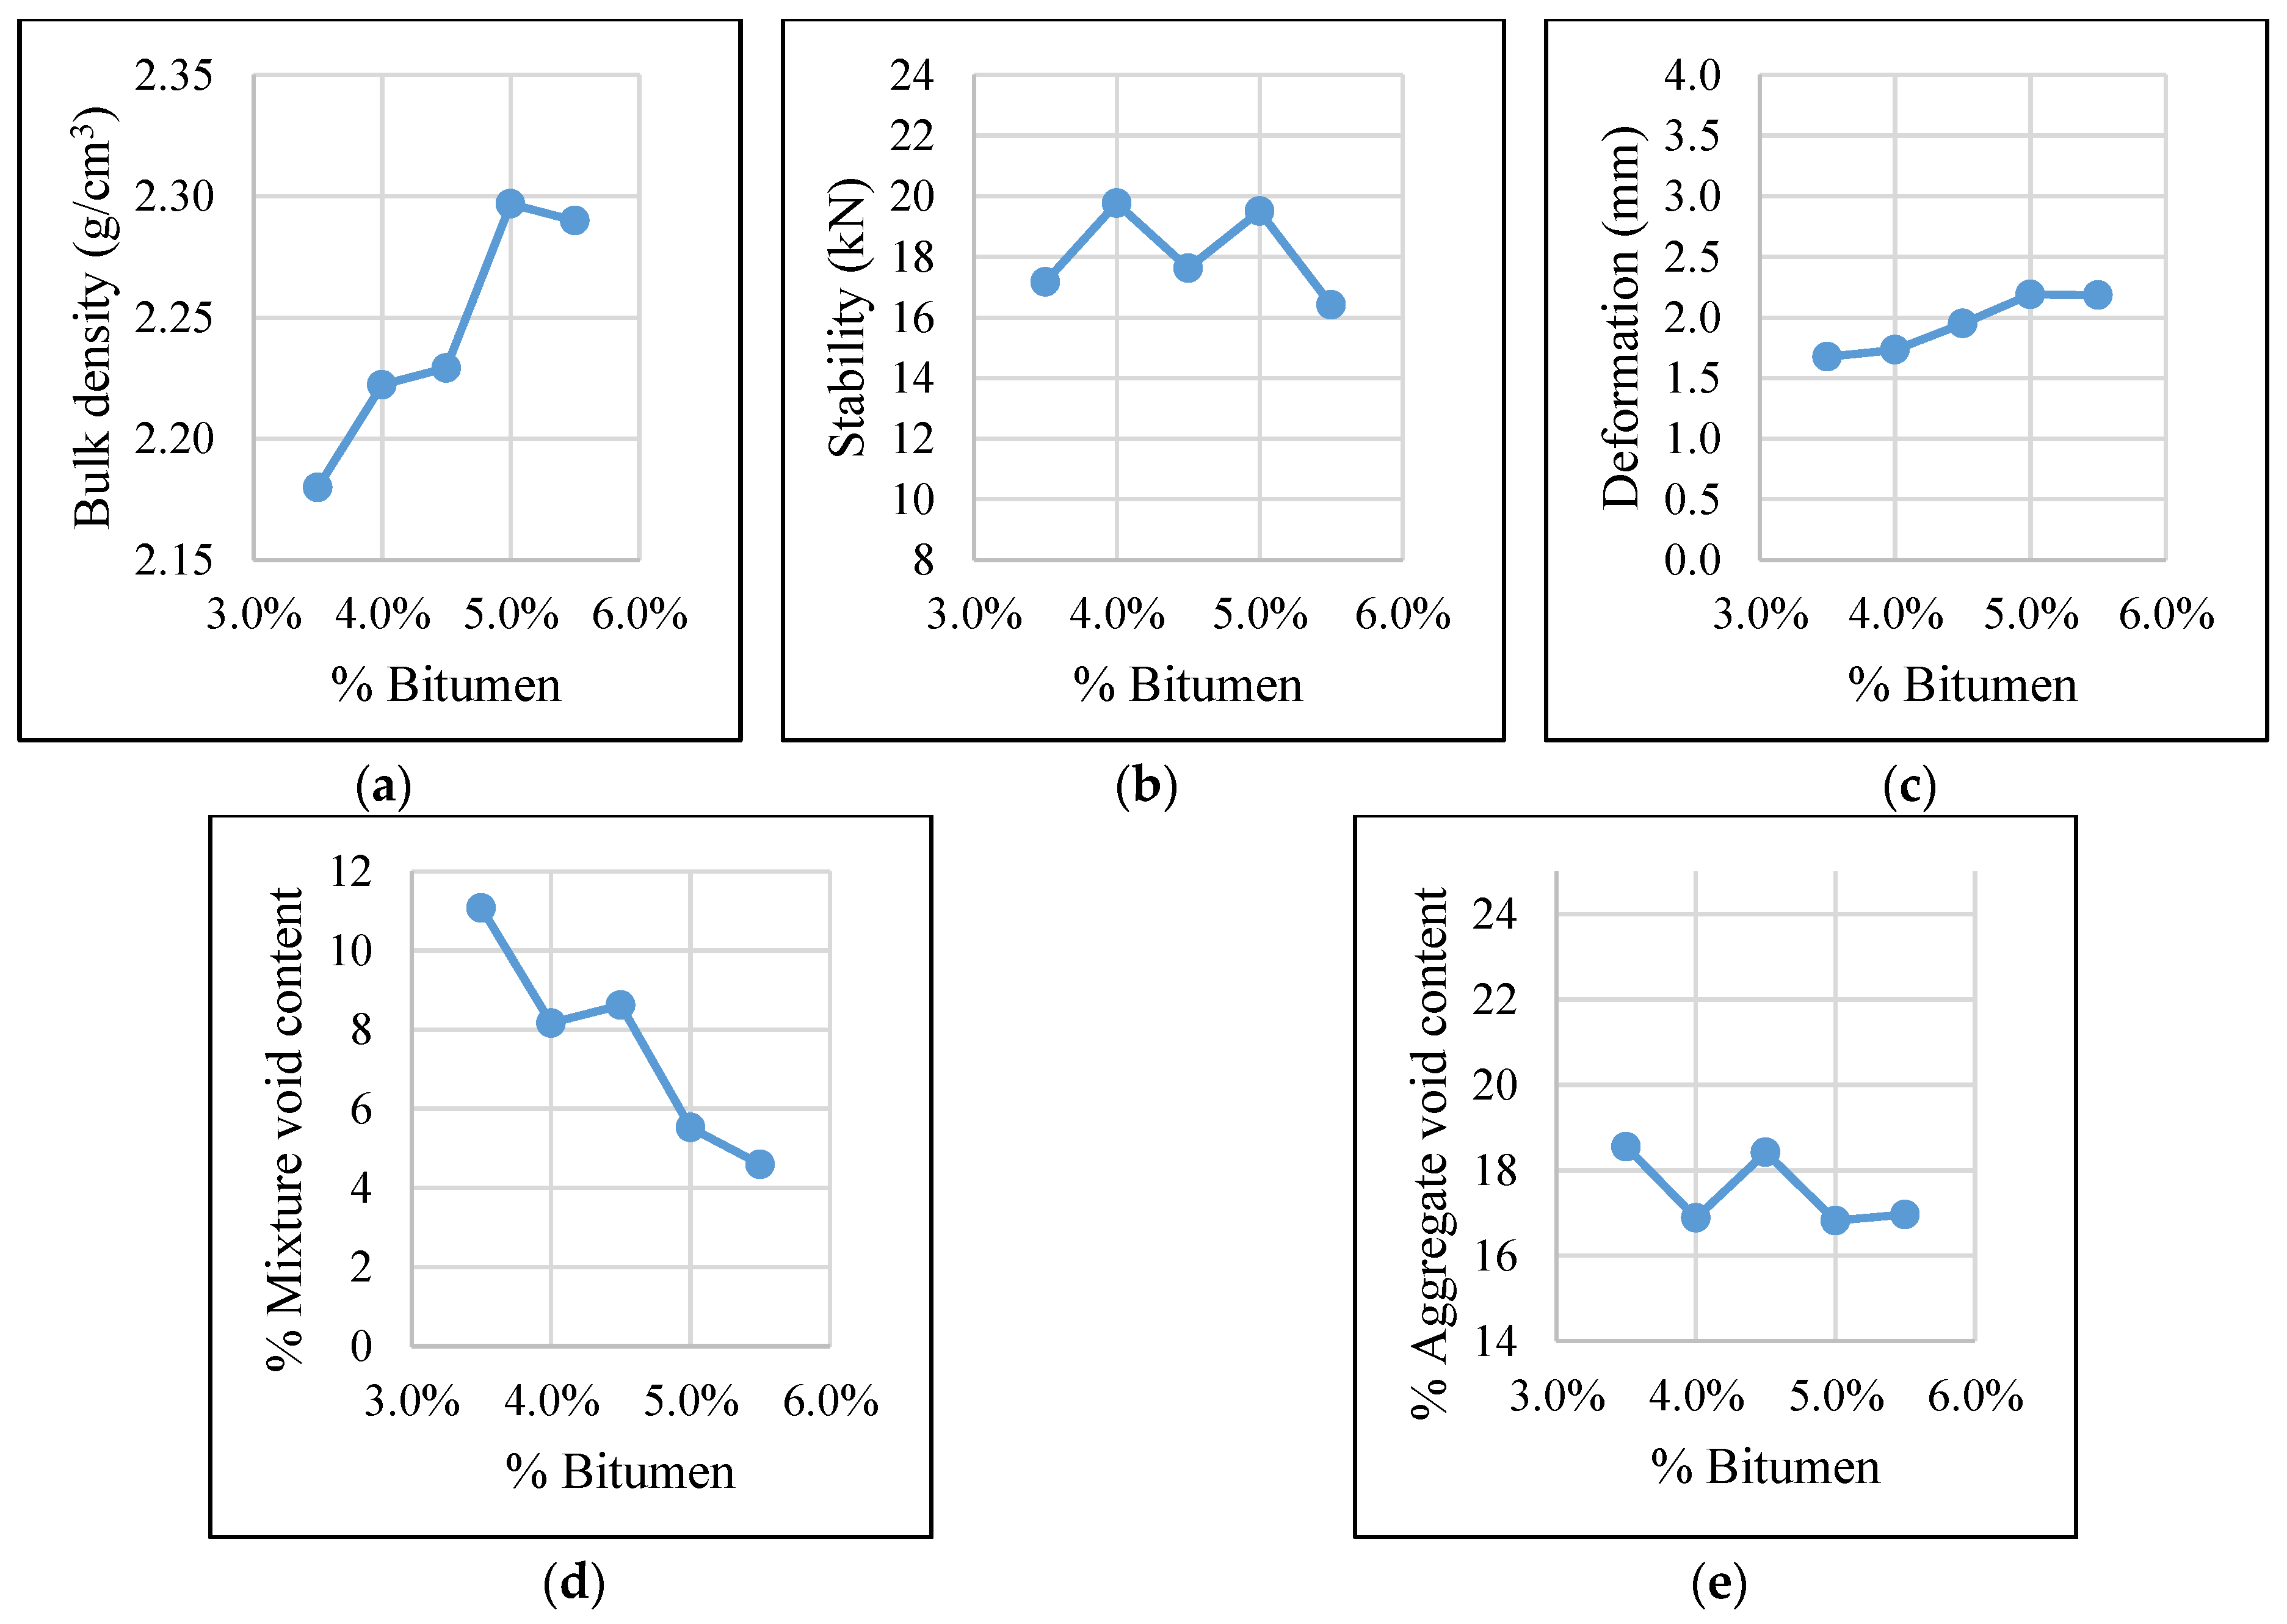
Figure 8 includes the results obtained for the asphalt mixture composed of 35% CWA, 25% RAP, and 40% NA. The trends shown in Figure 8 describe some variability that could be associated with the heterogeneity of the composition of the asphalt mixture since the content of each type of aggregate does not clearly predominate over the others.
The density of the asphalt mixture increases as the bitumen content does, reaching values close to 2.3 g/cm3 (Figure 8a), while the content of voids in the mixture declines below 6% with high binder contents (Figure 8d). The stability varies between 16.5 and 20 kN with an unstable trend (Figure 8b), while the minimum aggregate void content seems to be reached for a bitumen content of 5.0% (Figure 8e). Given that for this bitumen content the deformation is greater than 2 mm (Figure 8c) and the values of density and void content in the mixture are adequate, the optimal bitumen content can be considered 5%.

3.6. Asphalt Mixture C50A50

Figure 9 presents the results obtained for the asphalt mixture made of 50% CWA and 50% NA. The trends shown in Figure 9 are consistent, except for a few isolated points, with the common behaviour of an asphalt mixture. While the density of the mixture increases with the bitumen content (Figure 9a), the content of voids in the mixture decreases even below 6% (Figure 9d).
The graphs showing stability (Figure 9b) and void content in the aggregate (Figure 9e) indicate that the optimal bitumen content is 5.0%, for which the stability exceeds 16 kN and the aggregate void content is below 17%. Finally, it should be noted that the deformation for this bitumen point is very close to 2 mm (Figure 9c).

3.7. Asphalt Mixture A100

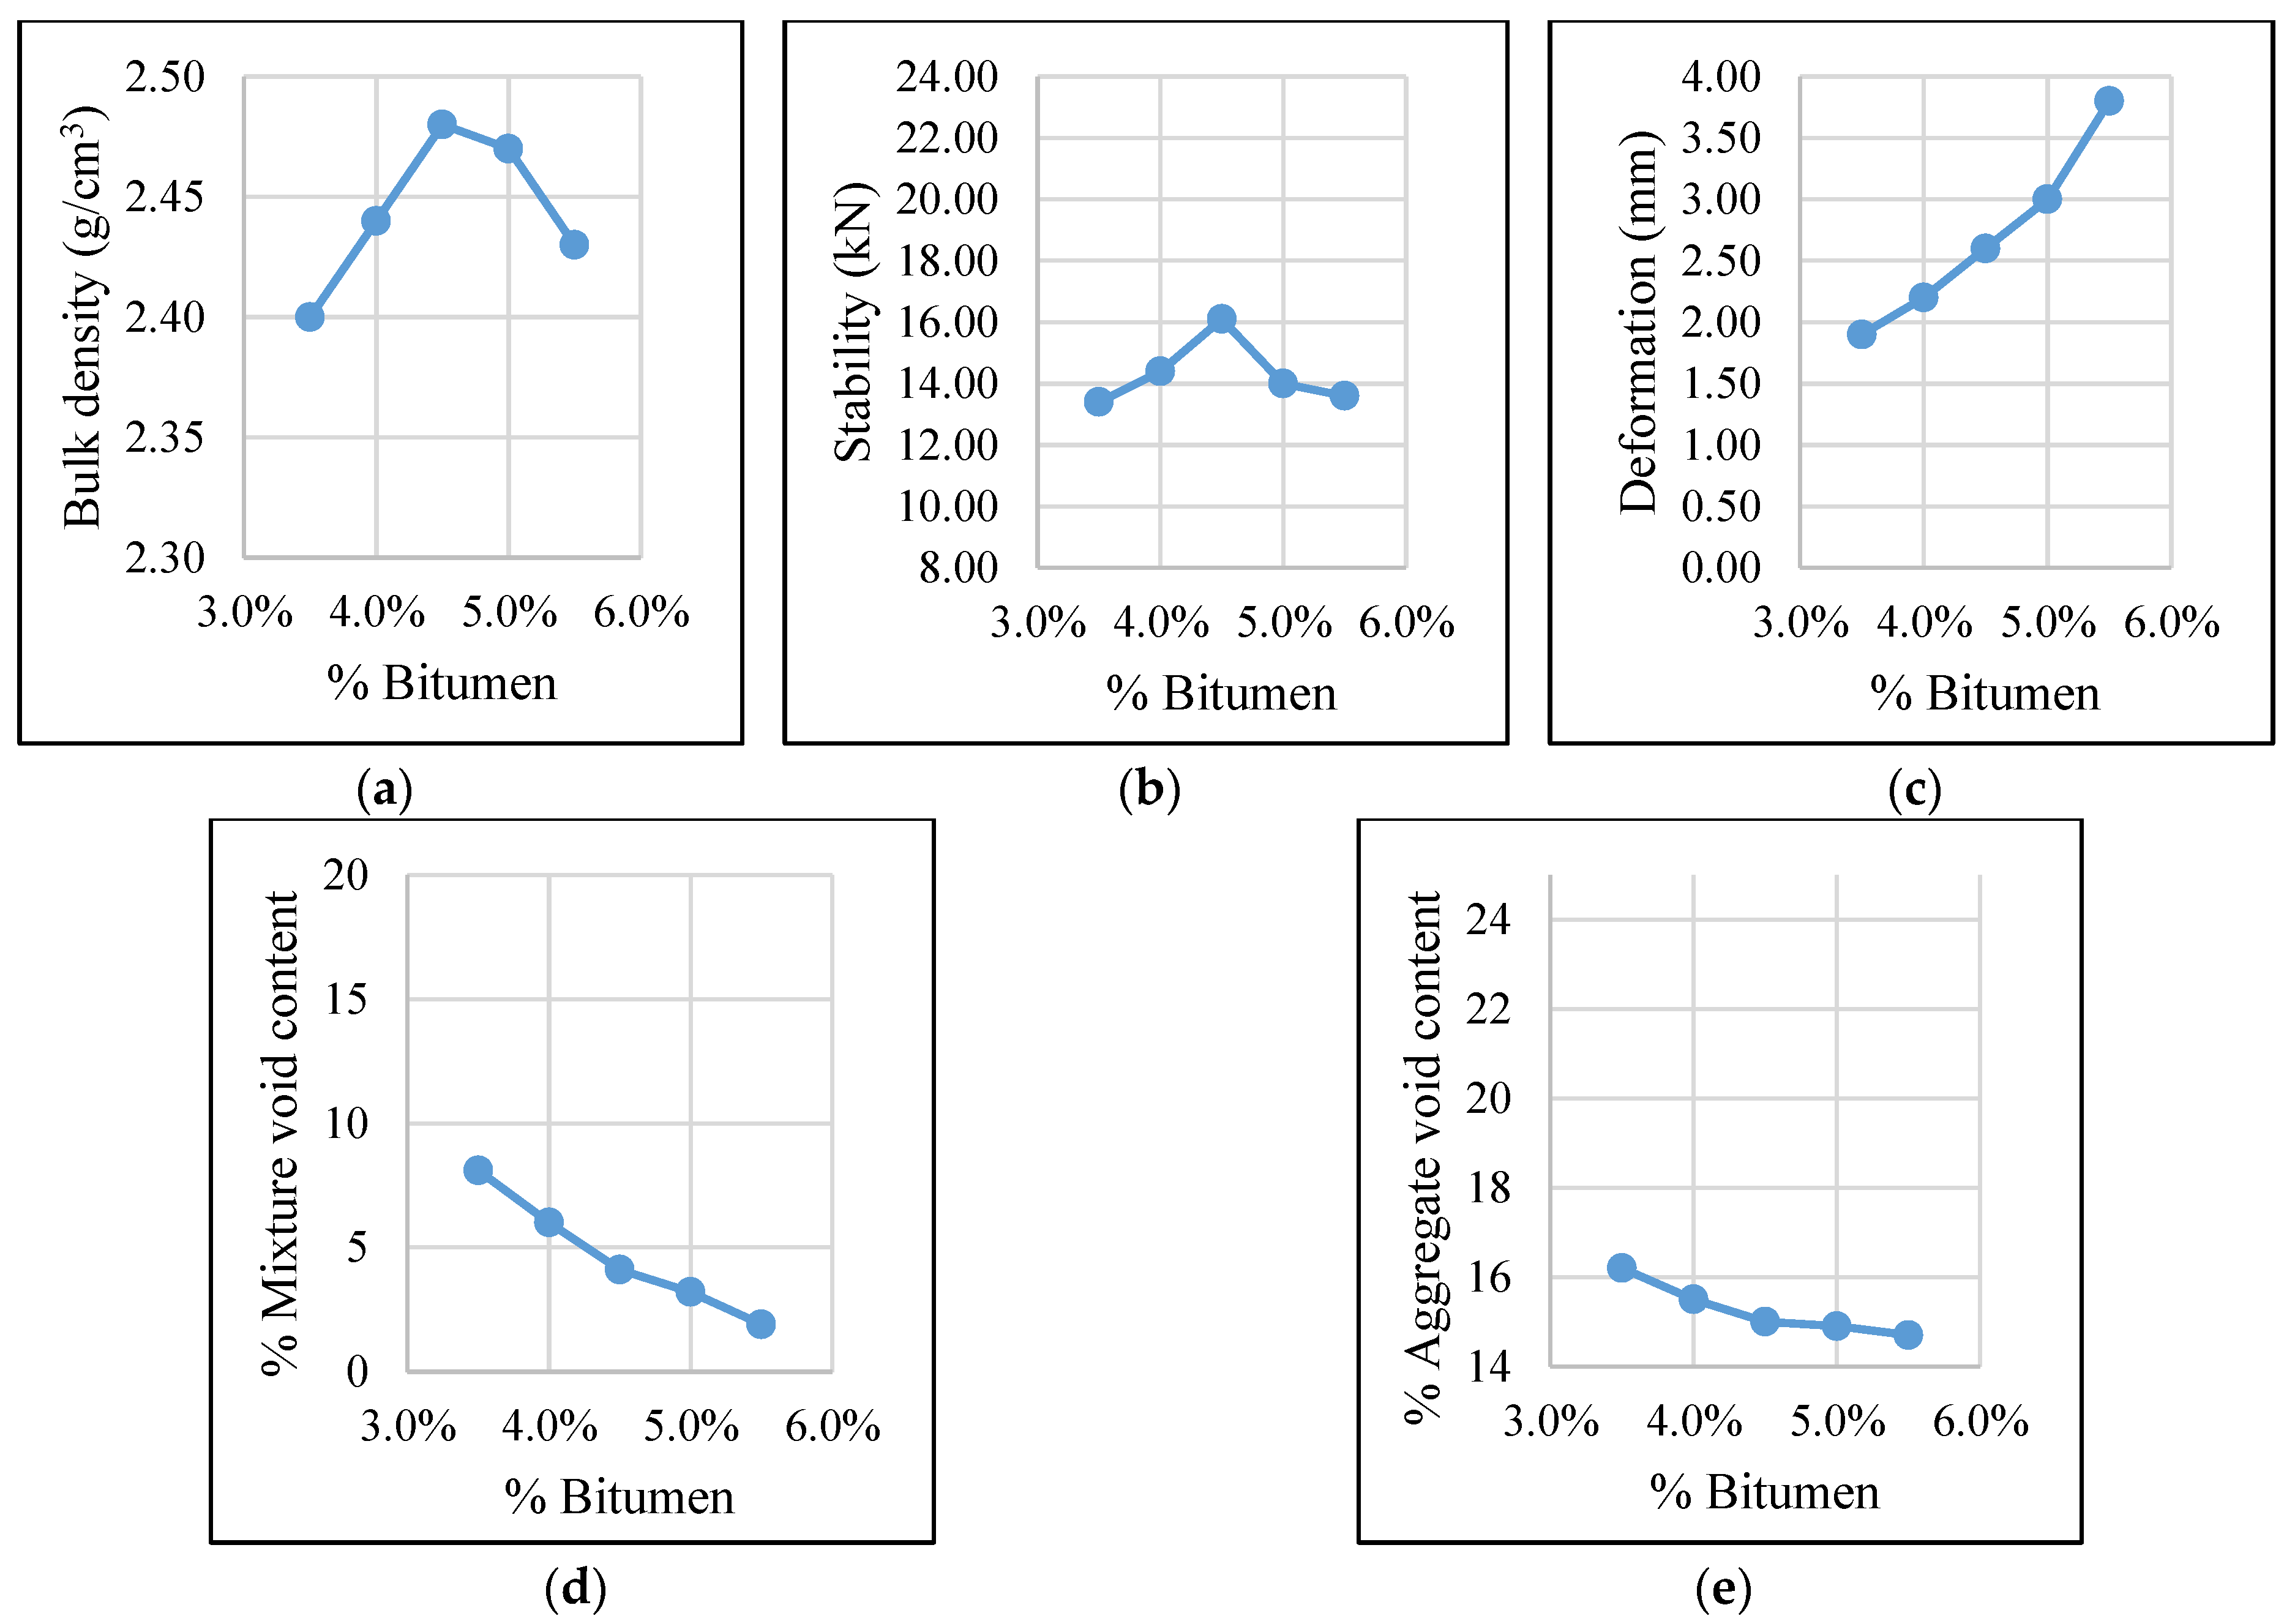
Figure 10 shows the results for the reference asphalt mixture, i.e., for the conventional asphalt mixture made of natural aggregates (NA). The maximum bulk density is reached for a bitumen content of 4.5% (Figure 10a), whereas the content of voids in the mixture is much lower than those obtained for the asphalt mixtures with recycled aggregates (Figure 10d). According to the bulk density and stability graphs (Figure 10a,b), the optimal bitumen content is 4.5%, for which the stability is 16 kN and the bulk density is slightly below 2.5 g/cm3. For this content of bitumen, the mixture void content (Figure 10d) and deformation (Figure 10c) meet the requirements defined by PG-3 [33] for low traffic roads (3–6% and 2.5 mm–3.5 mm, respectively).

4. Discussion

4.1. Comparative Analysis of Asphalt Mixtures

Table 5 summarizes the results of bulk and maximum density, void content in the mixture and the aggregate, stability, and deformation for the studied asphalt mixtures with their optimal bitumen content. As expected, the higher the ceramic waste aggregate, the higher the optimal bitumen content, since this type of aggregate has a high absorption.
Given that there are no specific standards for asphalt mixtures to be used in bike lanes, the comparative analysis was carried out considering the thresholds that the Spanish standards and specifications (PG-3) [33] established for the asphalt mixture type AC16 surf 35/50 S when used in roads, for the lowest heavy traffic loads.
In this regard, one of the most critical features is the void content in the mixture, which must be between 3% and 6%. Only the asphalt mixtures consisting of a large quantity of natural aggregates—C35R25A40 and C50A50—met this characteristic, but the asphalt mixtures with a 100% replacement rate—C100 and C50R50—presented values that could be considered as acceptable for their use in bike lanes. Nevertheless, all asphalt mixtures complied with the content of voids in the aggregate (>15%).
Regarding stability, the PG-3 establishes a minimum value of 8 kN for the Marshall test. Therefore, all asphalt mixtures fulfilled this characteristic. The mixture with the lowest stability was C100, while the mixtures with high content of RAP—C50R50 and C35R50A15—yielded very high stability values. It should be noted that the asphalt mixture C100 presented difficulties in its manufacture and compaction, i.e., a low workability.
All asphalt mixtures presented values of deformation below the PG-3 requirements—from 2.5 to 3.5 mm. The greater deformations were linked to asphalt mixtures with high proportions of natural aggregate—C35R25A40 and C50A50—, while a high content of ceramic waste aggregate resulted in brittle fractures with reduced deformations.
Although the density of an asphalt mixture when only one type of aggregate is used depends mainly on the bitumen content, it was identified that mixtures with high proportion of ceramic waste aggregate led to the lowest densities. This was due to the low density of this type of aggregate. In addition, under similar contents of ceramic waste aggregate, the greater the content of natural aggregate, the larger the bulk and maximum density.
As a conclusion, higher natural aggregate contents allowed compliance with the standards required by the PG-3. However, except for C100, all asphalt mixtures behaved in a similar manner. Moreover, asphalt mixtures with high content of recycled materials—C50R50 and C35R50A15—provided promising figures for both void content—in the mixture and the aggregate—and stability. Regarding deformation, it is suggested to study the behaviour of the mixtures with another type of softer bitumen to check whether the deformation increases up to at least 2.5 mm while the other properties are still fulfilled.

4.2. Proposal of Sustainable Asphalt Mixture

Since the main objective of this study is the design of sustainable asphalt mixtures, and taking into account the minimum traffic loads on bike lanes, two main criteria were considered for the selection of the most appropriate mixture: (i) maximize recycled aggregate content, and (ii) minimize binder content.
Thus, the selected asphalt mixture is C50R50, with a bitumen content of 5%. This type of asphalt mixture consists of a full replacement of natural fine and coarse aggregates by recycled materials, using 50% of ceramic waste aggregate and 50% of RAP. In addition, this mixture also allows for reducing the consumption of virgin bitumen because it contains a certain amount of residual bitumen. Specifically, this reduction is about one third. The asphalt mixture C50R50 did not meet all specifications of the PG-3, but these standards were defined for roads and, therefore, should only be considered as a guideline.
Unlike most previous studies that focused on the use of a single type of waste, this study shows promising findings of mixing two types of wastes achieving a full replacement of the natural aggregates in asphalt mixtures. However, further research is needed to explore the structural behaviour of the asphalt mixture C50R50. Although it seems to be adequate for bike lanes due to the low structural requirements of this type of infrastructure, the proposed asphalt mixture could be appropriate for low-volume roads as well.
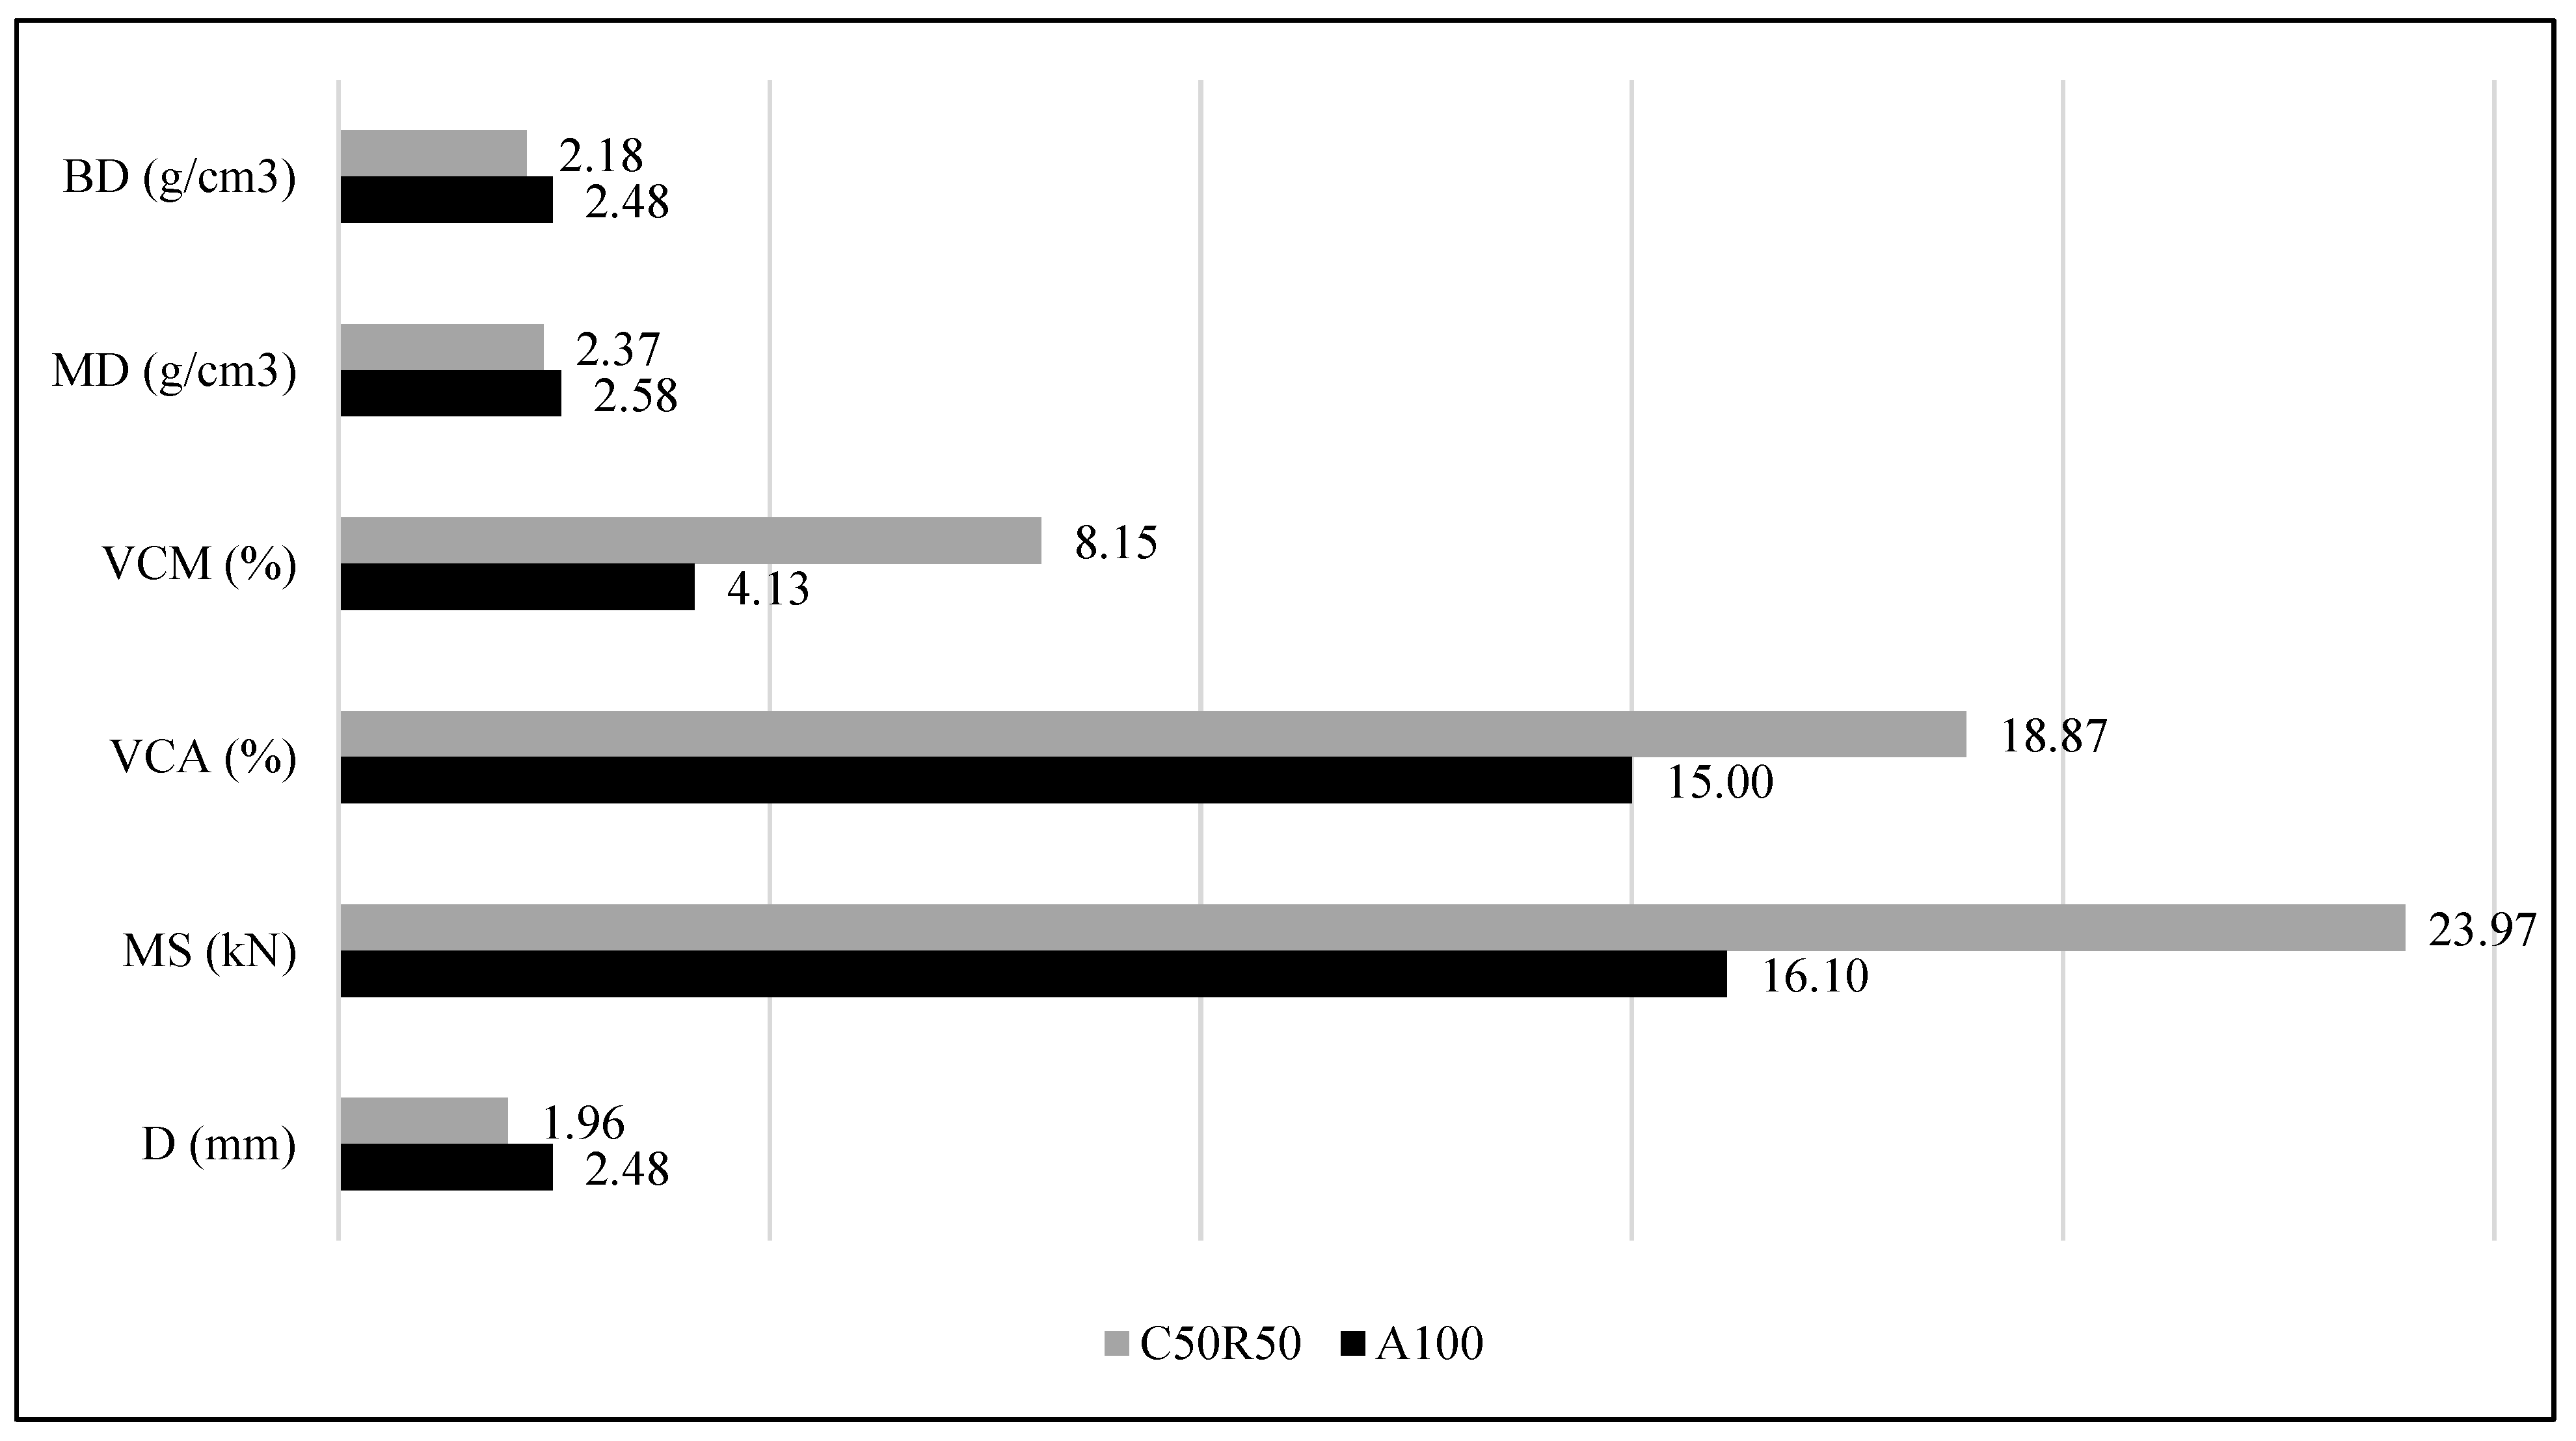
Regarding this, Figure 11 shows a comparison between the asphalt mixture C50R50 and the conventional asphalt mixture consisting of 100% of natural aggregates (A100). As expected, the bulk and maximum density of the asphalt mixture C50R50 were lower than those obtained for A100 due mainly to the lower density of the ceramic waste aggregates. Additionally, the conventional mixture A100 presented lower values of both aggregate and mixture void content. However, the void content of the C50R50 is considered adequate, in the absence of structural tests, for roads under low traffic loads. Additionally, the high content of RAP in the asphalt mixture C50R50 resulted in a significantly higher stability than that of the conventional mixture. Concerning deformation, although the asphalt mixture A100 seems to be more brittle than the C50R50, the difference in terms of deformation between both asphalt mixture is not so important.

4.3. Limitations of Use

It should be noted that the use of these wastes—RAP and ceramic waste aggregates—is subject to their availability. While the RAP is usually available in any country, Spain is one of the largest exporters of ceramics worldwide, with the Valencian Region being the most important producer. This fact makes the study of this type of asphalt mixture even more valuable, aiming to reduce the environmental costs of its manufacture and promote a circular economy.

5. Conclusions

Transportation is responsible for a large part of the impacts on the environment. Although most impacts are associated with vehicles’ operation, road administrations can encourage the use of more sustainable asphalt mixtures for road maintenance and construction, as well as for enhancing and extending current cycling networks.
Thus, this study analyses the use of RAP and ceramic waste as aggregates in asphalt mixtures for bike lanes. Specifically, a total of six types of asphalt mixtures with different contents of each type of aggregate were studied with the aim of achieving high replacement rates. For each type of asphalt mixture, considering a total of five bitumen content, the bulk and maximum density, void content in the mixture and the aggregate, and the stability and deformation were determined in a laboratory. This allowed for the estimation of the optimal bitumen content for every asphalt mixture.
As a result, a higher content of natural aggregates—C35R25A40 and C50A50—facilitated compliance with the standards required by the Spanish standards and specifications. However, these standards were defined for roads which must withstand much higher stresses than bike lanes. Regarding this, asphalt mixtures with high content of recycled materials—C50R50 and C35R50A15—performed adequately in terms of both void content—in the mixture and the aggregate—and stability.
The most appropriate asphalt mixture to be used for bike lanes was the mixture C50R50, with a bitumen content of 5%. This type of mixture consists of a full replacement of natural fine and coarse aggregates by 50% of ceramic waste aggregate and 50% of RAP. Furthermore, the use of this asphalt mixture also allows for minimizing the consumption of virgin bitumen due to its residual bitumen content.
Compared to the reference asphalt mixture (A100), C50R50 is a more open mixture, with higher void content and somewhat more brittleness. Even so, the characteristics of the asphalt mixture C50R50 could be good enough for use in low traffic roads.
Further research is needed to characterize the structural behaviour of the mixture C50R50 through water sensitivity, wheel tracking, stiffness, and fatigue tests. Furthermore, skid resistance and superficial macrotexture should be analysed because of their impact on the operation and safety of micromobility users. Finally, a softer bitumen could be explored to enhance the deformation of the mixture.

Author Contributions

Conceptualization, D.L.-C., P.Á.-T. and A.G.; methodology, D.L.-C., C.A.-T., P.Á.-T. and A.M.-B.; software, D.L.-C.; formal analysis, D.L.-C., C.A.-T., P.Á.-T. and A.M.-B.; writing—original draft preparation, D.L.-C.; writing—review and editing, D.L.-C., C.A.-T., A.M.-B. and A.G.; supervision, A.G.; project administration, D.L.-C.; funding acquisition, D.L.-C., P.Á.-T. and A.G. All authors have read and agreed to the published version of the manuscript.

Funding

This research was funded by the Valencian Innovation Agency (AVI) and the European Union through the Operational Program of the European Regional Development Fund (ERDF), grant number INNCAD/2021/140.

Institutional Review Board Statement

Not applicable.

Informed Consent Statement

Not applicable.

Data Availability Statement

The data presented in this study are available from the corresponding author on request. The data are not publicly available due to a Non-Disclosure Agreement.

Conflicts of Interest

The authors declare no conflict of interest.

References

  1. IPCC. Climate Change 2014: Mitigation of Climate Change. Contribution of Working Group III to the Fifth Assessment Report of the Intergovernmental Panel on Climate Change; Intergovernmental Panel on Climate Change 2014; Cambridge University Press: Cambridge, UK; New York, NY, USA, 2014. [Google Scholar]
  2. Chester, M.V.; Horvath, A. Environmental assessment of passenger transportation should include infrastructure and supply chains. Environ. Res. Lett. 2009, 4, 024008. [Google Scholar] [CrossRef]
  3. Noland, R.B.; Hanson, C.S. Life-cycle greenhouse gas emissions associated with a highway reconstruction: A New Jersey case study. J. Clean. Prod. 2015, 107, 731–740. [Google Scholar] [CrossRef]
  4. Statistical Office of the European Communities. EUROSTAT: Waste Statistics; Eurostat: Luxembourg, 2018; Available online: https://ec.europa.eu/eurostat/statistics-explained/index.php?title=Waste_statistics#Total_waste_generation (accessed on 30 September 2021).
  5. European Commission. Directive 2008/98/Ec of The European Parliament and of The Council of 19 November 2008 on Waste and Repealing Certain Directives. Off. J. Eur. Union 2008, 34, 99–126. [Google Scholar]
  6. INE. Estadísticas Sobre Generación de Residuos; Instituto Nacional de Estadística: Madrid, Spain, 2022; Available online: https://www.ine.es/dyngs/INEbase/es/categoria.htm?c=Estadistica_P&cid=1254735976612 (accessed on 17 September 2022).
  7. Williams, B.A.; Willis, J.R.; Shacat, J. Asphalt Pavement Industry Survey on Recycled Materials and Warm-Mix Asphalt Usage: 2019; NAPA: Greenbelt, MD, USA, 2020. [Google Scholar]
  8. Hajj, E.Y.; Sebaaly, P.E.; Kandiah, P. Use of Reclaimed Asphalt Pavements (RAP) in Airfields HMA Pavements; AAPTP Project 05–06; Department of Civil and Environmental Engineering College of Engineering, University of Nevada Reno: Reno, NV, USA, 2008; pp. 1–136. [Google Scholar]
  9. Jamshidi, A.; White, G. Evaluation of performance and challenges of use of waste materials in pavement construction: A critical review. Appl. Sci. 2019, 10, 226. [Google Scholar] [CrossRef] [Green Version]
  10. Zhu, J.; Ma, T.; Fang, Z. Characterization of agglomeration of reclaimed asphalt pavement for cold recycling. Constr. Build. Mater. 2020, 240, 117912. [Google Scholar] [CrossRef]
  11. Cardoso, R.; Silva, R.V.; de Brito, J.; Dhir, R. Use of recycled aggregates from construction and demolition waste in geotechnical applications: A literature review. Waste Manag. 2016, 49, 131–145. [Google Scholar] [CrossRef]
  12. Wang, J.; Zhang, Z.; Guo, D.; Xu, C.; Zhang, K. Study on cooling effect and pavement performance of thermal-resistant asphalt mixture. Adv. Mater. Sci. Eng. 2018, 2018, 6107656. [Google Scholar] [CrossRef] [Green Version]
  13. Che, T.; Pan, B.; Ouyang, J. The laboratory evaluation of incorporating ceramsite into HMA as fine aggregates. Constr. Build. Mater. 2018, 186, 1239–1246. [Google Scholar] [CrossRef]
  14. Silvestre, R.; Medel, E.; García, A.; Navas, J. Utilizing recycled ceramic aggregates obtained from tile industry in the design of open graded wearing course on both laboratory and in situ basis. Mater. Des. 2013, 50, 471–478. [Google Scholar] [CrossRef]
  15. Silvestre, R.; Medel, E.; García, A.; Navas, J. Using ceramic wastes from tile industry as a partial substitute of natural aggregates in hot mix asphalt binder courses. Constr. Build. Mater. 2013, 45, 115–122. [Google Scholar] [CrossRef] [Green Version]
  16. Feng, D.; Yi, J.; Wang, D. Performance and thermal evaluation of incorporating waste ceramic aggregates in wearing layer of asphalt pavement. J. Mater. Civ. Eng. 2013, 25, 857–863. [Google Scholar] [CrossRef]
  17. Tavira, J.; Jiménez, J.R.; Ayuso, J.; López-Uceda, A.; Ledesma, E.F. Recycling screening waste and recycled mixed aggregates from construction and demolition waste in paved bike lanes. J. Clean. Prod. 2018, 190, 211–220. [Google Scholar] [CrossRef]
  18. Ahmed, I. Use of Waste Materials in Highway Construction (FHWA/IN/JHRP-91/3); Department of Civil Engineering, Purdue University: West Lafayette, IN, USA, 1991; p. 299. [Google Scholar]
  19. Wu, S.; Xue, Y.; Ye, Q.; Chen, Y. Utilization of steel slag as aggregates for stone mastic asphalt (SMA) mixtures. Build. Environ. 2007, 42, 2580–2585. [Google Scholar] [CrossRef]
  20. Chen, J.S.; Wei, S.H. Engineering properties and performance of asphalt mixtures incorporating steel slag. Constr. Build. Mater. 2016, 128, 148–153. [Google Scholar] [CrossRef]
  21. Amelian, S.; Manian, M.; Abtahi, S.M.; Goli, A. Moisture sensitivity and mechanical performance assessment of warm mix asphalt containing by-product steel slag. J. Clean. Prod. 2018, 176, 329–337. [Google Scholar] [CrossRef]
  22. Pattanaik, M.L.; Choudhary, R.; Kumar, B.; Kumar, A. Mechanical properties of open graded friction course mixtures with different contents of electric arc furnace steel slag as an alternative aggregate from steel industries. Road Mater. Pavement Des. 2021, 22, 268–292. [Google Scholar] [CrossRef]
  23. Pattanaik, M.L.; Choudhary, R.; Kumar, B. Moisture susceptibility of open-graded friction course mixes with EAF steel slag and modified binders. Adv. Civ. Eng. Mater. 2019, 8, 248–266. [Google Scholar] [CrossRef]
  24. Lastra-González, P.; Calzada-Pérez, M.A.; Castro-Fresno, D.; Vega-Zamanillo, Á.; Indacoechea-Vega, I. Comparative analysis of the performance of asphalt concretes modified by dry way with polymeric waste. Constr. Build. Mater. 2016, 112, 1133–1140. [Google Scholar] [CrossRef] [Green Version]
  25. Jamshidi, A.; Kurumisawa, K.; Nawa, T.; Igarashi, T. Performance of pavements incorporating waste glass: The current state of the art. Renew. Sustain. Energy Rev. 2016, 64, 211–236. [Google Scholar] [CrossRef]
  26. Movilla-Quesada, D.; Raposeiras, A.C.; Muñoz, O.; Castro-Fresno, D. Reduction in the use of mineral aggregate by recycling cellulose ashes to decrease the aging of hot asphalt mixtures. Constr. Build. Mater. 2017, 143, 547–557. [Google Scholar] [CrossRef] [Green Version]
  27. Movilla-Quesada, D.; Raposeiras, A.C.; Lagos-Varas, M.; Muñoz-Cáceres, O.; Andrés-Valeri, V.C.; Troncoso, L. Study of the Optimal Dosage of Celullose Ash as a Contribution Filler in Asphalt Mixtures Based on Its Adhesiveness under Moisture Conditions. Sustainability 2021, 13, 854. [Google Scholar] [CrossRef]
  28. UNE-EN 12697-8; Bituminous Mixtures—Test Methods—Part 8: Determination of Void Characteristics of Bituminous Specimens. Asociación Española de Normalización: Madrid, Spain, 2020.
  29. UNE-EN 12697-6; Bituminous Mixtures—Test Methods for Hot Mix Asphalt—Part 6: Determination of Bulk Density of Bituminous Specimens. Asociación Española de Normalización: Madrid, Spain, 2012.
  30. UNE-EN 12697-5; Bituminous Mixtures—Test Methods—Part 5: Determination of the Maximum Density. Asociación Española de Normalización: Madrid, Spain, 2020.
  31. UNE-EN 12697-34; Bituminous Mixtures—Test Methods—Part 34: Marshall Test. Asociación Española de Normalización: Madrid, Spain, 2022.
  32. UNE-EN 933-2; Tests for Geometrical Properties of Aggregates—Part 2: Determination of Particle Size Distribution—Test Sieves, Nominal Size of Apertures. Asociación Española de Normalización: Madrid, Spain, 2022.
  33. Spanish Ministry of Public Works. Pliego de Prescripciones Técnicas Generales Para Obras de Carreteras Y Puentes de la Dirección General de Carreteras (PG-3); Ministerio de Fomento, Dirección General de Carreteras: Madrid, Spain, 2008. [Google Scholar]
  34. UNE-EN 12697-35; Bituminous Mixtures—Test Methods—Part 35: Laboratory Mixing. Asociación Española de Normalización: Madrid, Spain, 2017.
  35. UNE-EN 12697-30; Bituminous Mixtures—Test Methods—Part 30: Specimen Preparation by Impact Compactor. Asociación Española de Normalización: Madrid, Spain, 2019.
Figure 1. Methodology.
Sustainability 14 15777 g001
Figure 2. Materials: (a) natural aggregates, (b) ceramic waste aggregates, (c) reclaimed asphalt pavement, and (d) filler.
Sustainability 14 15777 g002aSustainability 14 15777 g002b
Figure 3. Particle size distribution.
Sustainability 14 15777 g003
Figure 4. Characterization of asphalt mixture C100: (a) bulk density, (b) stability, (c) deformation, (d) void content in the mixture, and (e) void content in the aggregate.
Sustainability 14 15777 g004
Figure 5. Characterization of asphalt mixture C50R50: (a) bulk density, (b) stability, (c) deformation, (d) void content in the mixture, and (e) void content in the aggregate.
Sustainability 14 15777 g005
Figure 6. Characterization of asphalt mixture C35R50A15: (a) bulk density, (b) stability, (c) deformation, (d) void content in the mixture, and (e) void content in the aggregate.
Sustainability 14 15777 g006
Figure 7. Characterization of asphalt mixture C50R25A25: (a) bulk density, (b) stability, (c) deformation, (d) void content in the mixture, and (e) void content in the aggregate.
Sustainability 14 15777 g007aSustainability 14 15777 g007b
Figure 8. Characterization of asphalt mixture C35R25A40: (a) bulk density, (b) stability, (c) deformation, (d) void content in the mixture, and (e) void content in the aggregate.
Sustainability 14 15777 g008
Figure 9. Characterization of asphalt mixture C50A50: (a) bulk density, (b) stability, (c) deformation, (d) void content in the mixture, and (e) void content in the aggregate.
Sustainability 14 15777 g009
Figure 10. Characterization of asphalt mixture A100: (a) bulk density, (b) stability, (c) deformation, (d) void content in the mixture, and (e) void content in the aggregate.
Sustainability 14 15777 g010
Figure 11. Comparison of C50R50 with A100: BD = Bulk density; MD = Maximum density; VCM = Void content in the mixture; VCA = Void content in the aggregate; MS = Marshall maximum stability; and D = Marshall deformation.
Sustainability 14 15777 g011
Table 1. Characteristics of the aggregates.
MaterialFractionTest Sieves for Aggregates UNE-EN 933-2 [32] (mm)D *WA *B *
22168420.50.250.063
Filler-10010010010010099.9399.4378.86---
NA0/410010099.6497.3764.3324.8117.163.022.7670.68-
4/1010010074.6918.632.791.500.510.482.7831.49-
10/2099.8075.531.350.280.140.140.120.112.7311.33-
CWA0/410010099.6077.0645.0513.808.644.802.5955.91-
4/1010010069.3927.7516.736.684.331.222.5196.31-
RAP0/810010097.6673.9050.1824.2918.1110.44--4.42
8/2299.8292.9436.0123.4217.4510.468.344.80--2.51
AC16 surf S **10090–10064–7944–5931–4616–2711–204–8-
* Note: D = Density (g/cm3); WA = Water absorption (%); B = Residual bitumen content; - = Data not available; ** Particle size and grading envelopes specifications (PG-3) [33].
Table 2. Characteristics of standard grade bitumen 35/50 (Source: CEPSA).
CharacteristicMethodUnitLimits
Min.Max.
Penetration (25 °C; 100 g; 5 s)EN 14260.1 mm3550
Softening pointEN 1427°C5058
Penetration indexEN 12591-−1.5+0.7
Fraass breaking pointEN 12593°C-−5
SolubilityEN 12592%99.0-
Flash pointEN 2592°C240-
-: Data not available.
Table 3. Definition of the content of asphalt mixtures.
Asphalt Mixture *Material ContentReplacement Rate **
Ceramic Waste Aggregates (CWA)RAPNatural Aggregates (NA)
C100100%--100%
C50R5050%50%-100%
C35R50A1535%50%15%85%
C50R25A2550%25%25%75%
C35R25A4035%25%40%60%
C50A5050%-50%50%
A100--100%0%
* C = CWA; R =RAP; A = NA; ** Without considering filler.
Table 4. Particle size and grading for each asphalt mixture, per content of bitumen.
Asphalt MixtureBitumen in Mixture (%)FillerNACWARAP
0/44/1010/200/44/100/88/22
C1006.06.91%---11.56%81.52%--
5.56.37%---12.12%81.51%--
5.05.56%---12.94%81.51%--
4.54.75%---13.76%81.49%--
4.03.94%---14.58%81.48%--
C50R505.51.67%---21.24%25.17%22.49%23.92%
5.00.87%---22.54%24.53%22.65%24.41%
4.50.60%---23.84%23.88%22.82%24.90%
4.00.00%---18.24%29.79%16.69%31.31%
3.50.00%---8.96%40.87%13.31%33.36%
C35R50A155.52.29%3.17%3.45%5.26%11.88%21.20%19.57%27.68%
5.01.57%3.97%3.23%5.48%11.07%22.18%20.07%27.43%
4.50.85%4.70%3.21%5.57%10.32%23.10%20.28%27.47%
4.00.23%5.46%3.21%5.51%9.05%24.55%19.32%28.68%
3.50.03%8.09%2.58%3.78%6.18%27.60%12.00%36.25%
C50R25A255.54.02%5.63%4.44%9.53%16.61%30.64%8.87%14.75%
5.03.31%6.88%3.99%9.56%15.69%31.81%9.07%14.68%
4.52.59%8.24%3.46%9.58%14.50%33.25%9.46%14.41%
4.01.85%9.32%3.30%9.53%12.97%35.03%10.41%13.59%
3.51.11%10.70%3.05%9.26%10.75%37.50%11.43%12.70%
C35R25A405.54.12%10.10%10.46%13.12%12.83%20.24%10.03%13.59%
5.03.42%11.63%9.97%12.98%11.81%21.44%10.02%13.73%
4.52.71%13.22%9.40%12.86%10.71%22.71%10.05%13.83%
4.01.98%14.64%8.81%12.98%9.68%23.92%10.43%13.57%
3.51.23%15.97%8.13%13.27%8.51%25.26%11.05%13.07%
C50A505.56.14%13.43%10.92%19.51%18.67%31.33%--
5.05.39%15.20%10.12%19.29%17.18%32.82%--
4.54.63%17.10%9.32%18.94%15.51%34.50%--
4.03.89%19.18%8.49%18.46%13.60%36.39%--
3.53.14%21.49%7.60%17.77%11.40%38.60%--
A1005.56.90%31.56%36.62%24.92%----
5.06.09%32.95%35.89%25.06%----
4.55.29%34.28%35.18%25.25%----
4.04.48%35.63%34.43%25.47%----
3.53.67%36.95%33.58%25.80%----
Table 5. Characteristics of asphalt mixtures.
Asphalt MixtureBIN (%)F/BBD (g/cm3)MD (g/cm3)VCM (%)VCA (%)MS (kN)D (mm)
C1006.01.172.0532.2107.05918.95911.761.84
C50R505.01.202.1792.3748.15218.87123.971.96
C35R50A154.51.202.2202.4258.39318.21820.991.74
C50R25A255.01.202.1902.4208.69919.27719.121.75
C35R25A405.01.202.2972.4335.52616.82219.512.19
C50A505.01.202.2182.3585.87916.59216.781.92
A1004.51.202.4802.5804.12515.00016.102.48
Note: BIN = bitumen content; F/B = filler/bitumen ratio; BD = bulk density; MD = maximum density; VCM = void content in the mixture; VCA = void content in the aggregate; MS = Marshall maximum stability; and D = Marshall deformation.
Publisher’s Note: MDPI stays neutral with regard to jurisdictional claims in published maps and institutional affiliations.