Article

Population Shrinkage, Public Service Levels, and Heterogeneity in Resource-Based Cities: Case Study of 112 Cities in China

1
College of Geographical Science, Harbin Normal University, Harbin 150025, China
2
School of Mining Engineering, Heilongjiang University of Science and Technology, Harbin 150022, China
*
Author to whom correspondence should be addressed.
Sustainability 2022, 14(23), 15910; https://doi.org/10.3390/su142315910
Submission received: 6 August 2022 / Revised: 3 November 2022 / Accepted: 11 November 2022 / Published: 29 November 2022
(This article belongs to the Special Issue Multi-Functional Urban Innovations)

Abstract

:
Resource-based cities (RBCs) have become an important part of shrinking cities, and their population shrinkage brings many challenges for RBCs. A lot of literature analyzes the effects of shrinkage in RBCs, but very few explore the impact of population shrinkage on changes in their public service levels (PSLs). How the population shrinkage affects public services in RBCs, whether it is heterogeneous concerning the degree of shrinkage, and what the policy implications are all need to be studied in this paper. We propose the criteria for defining population shrinkage grades in terms of population size, population proportion, and population reduction rate, and we define the shrinkage grades of 112 RBCs. We select 12 indicators to build an index system to measure the PSLs of China’s RBCs, define the shrinkage grades of 112 RBCs, measure their PSLs, and analyze the impact of population shrinkage on the public services in China’s RBCs. The results show that there is a positive correlation between the rate of population reduction (pr) and the increased range of PSLs (PSLIR). The population shrinkage generally contributes to the improvement of PSLs in RBCs, but the effect is heterogeneous among the different shrinkage grades. In cities with population growth, it inhibits the improvement of PSLs, while in cities with population shrinkage, it promotes the improvement of PSLs. This promotion effect is phased and can only occur in the early stages of population shrinkage. The results also reveal the effects of the control variables on the PSLs of all the RBCs, as well as the RBCs with different shrinkage grades. These results can provide a reference for the sustainable development of RBCs.

1. Introduction

The essence of public service is the lowest level of universalized goods and services provided by the government to guarantee the basic needs and rights of citizens. Public services are the key factor of economic development, the driving factor of social cohesion [1,2], and a fundamental condition for achieving equity and justice [3]; they are seen as the ‘main weapon’ [4] to address socio-spatial polarization. Improving public services plays an important role in achieving UN Sustainable Development Goal 4 (Quality education), Goal 10 (Reduce inequality within and among countries), and Goal 11 (Sustainable cities and communities) and in achieving the UN Millennium Development Goals. For resource-based cities (RBCs), public services are the important driver of their sustainable development and the key factor of urban economic transformation. Achieving the adaptation of public services to meet the needs of the population has become the focus of regional and urban development policies [5].
Urban shrinkage is increasingly becoming a common phenomenon [6,7], and the proportion of RBCs experiencing population shrinkage is significantly higher than the non-resource-based cities [8]. Many RBCs in the world are facing difficulties in economic development, financial constraints, increasing unemployment, accelerating aging [9], and so on. ‘Stagnant economic growth and shrinking population’ is a universal characteristic of many RBCs [9,10], and how to achieve sustainable development in RBCs has become an important issue in global development. Population shrinkage brings opportunities to many cities, especially RBCs, such as by reducing employment pressure, improving urban ecology, promoting urban transformation, and relieving urban congestion. Population shrinkage also poses challenges for RBCs, such as economic shrinkage [11], social disruption [12], abandoned construction environments [13], rising unemployment [14,15], accelerated aging, and urban planning [16]. Moreover, the adverse effects of urban shrinkage may lead to causality and form a circular chain [17], leading to further population shrinkage [18].
Among these opportunities and challenges, the impact of population shrinkage on public services is an important issue that needs to be further studied. Although many studies are addressing the effects of urban shrinkage [7,9,10,11,12], there is less literature specifically examining the effects of population shrinkage on public services, and the studies have mostly focused on one aspect of how population shrinkage affects public services. It is generally accepted that population shrinkage leads to a decline in the number of young workers and taxpayers [19], creating more financial difficulties in guaranteeing a high level of public services [20], and putting pressure on the development and maintenance of public health care, public infrastructure, and social security systems [21,22]. Population shrinkage leads to oversupply and the underutilization of facilities [14,23], and it increases the vacancy rate of public services facilities and housing [24,25]. Population shrinkage also reduces the accessibility of facilities [26], lowers the tax base of cities [27], increases the maintenance costs of public facilities [28], causes a spatial mismatch of ‘population-public service resources’ [14,22,29], and leads to unsustainable maintenance and services [30]. Housing demolition is seen as a response to vacancy, increasing public space and the building of a green infrastructure, but demolition causes the ‘structural perforation’ of urban land use, affecting the permanence and accessibility of facilities [26]. In addition, it is expensive to combat idle housing and contaminated land [13], and it is controversial whether compact shrinkage in response to shrinkage can provide greener opportunities for cities [31]. Empirical studies also support the idea that population shrinkage reduces public services, such as by lowering the total public service provision, although the decline in the PSLs in a per capita sense is not significant [32]. The above suggests that population shrinkage will dampen the increase in the PSLs [32].
Although the negative effects of population shrinkage dominate public discourse [20], population shrinkage also has catalytic effects on the improvement of public services, such as by improving the satisfaction of residents’ living [20], the living quality of residents [33], and social inclusion [24]. Population shrinkage provides vacant land for additional public spaces [34,35], urban green open spaces, parking lots, and other public facilities [35], improving the ecological environment [36,37] and relieving traffic congestion and public resource congestion [30]. Population shrinkage can ease up the pressure on housing markets and make it easier to access affordable housing in urban areas [21]. In addition, shrinking the concomitant aging can help to increase social security and employment and health care expenditures and to improve urban PSLs [38]. Population change is an important factor affecting carbon emissions [39], and there is a ‘scale’ relationship between the carbon emissions and the population [40], i.e., population shrinkage is beneficial for carbon reduction [39,41].
Due to the ‘resource curse’ and its ‘lock-in effect’, resource depletion, and the special development path, RBCs have led to various intertwined socio-economic and environmental problems. They may face more obstacles and challenges in sustainable development than other types of cities, and the impact of population shrinkage on urban development is more special and complex. Scholars have conducted numerous studies on transformational development [42], carbon emissions [43,44], green development [44,45], and population shrinkage and its effects [46,47], but these studies on the effects of population shrinkage on public services are mostly mentioned as problems or countermeasures, and there is a lack of specialized studies. The scholars have mostly argued that, in addition to a homogeneous industrial structure [46], deindustrialization [48], policy factors [49], and poor public services [46,49,50] have been identified as important causes of population shrinkage in RBCs, with the quality and livability of the amenities [51] and health services being important factors [52]. Those regions with higher levels of public service and better urban amenities have advantages in attracting migrants [50], while cities offering high wages but low livability might still fail to attract new residents [53]. Population shrinkage leads to a decrease in the labor productivity of RBCs [54] and affects public services [55]; subsequently, local inhabitants may move to other cities [49], potentially creating a cycle that eventually leads to a decline in public services. However, the shrinkage of RBCs contributes to a reduction in CO2 emissions [56], as well as to the fact that some RBCs have improved public services by demolishing vacant and abandoned buildings and rebuilding green spaces to make cities more environmentally friendly [57]. In improving the level of public services in RBCs, the scholars have argued that the living standards of residents in shrinking RBCs are directly related to changes in social welfare [33]. The primary governance principle, therefore, might be to satisfy the needs of the remaining residents and improve their quality of life [57,58], such as by introducing the concept of shrinkage in urban planning and going for smart shrinkage [59,60,61]. As the value of public services can be jointly destroyed in the interaction among public service organizations (PSO), users and third parties, a joint effort of many parties is needed to improve public services [62]. The results of some typical regions and resource-based shrinking cities in China, such as northeast China and Baishan city [63], show that the level of public services can be improved by adjusting the industrial structure, accelerating urban economic transformation, increasing social welfare investments, improving urban livability, and adopting differentiated policies and countermeasures [3,52,57,63].
In summary, most of the existing studies have focused on the impact of population shrinkage on one aspect of public services, and very few comprehensive studies have been conducted specifically on the impact of population shrinkage on public services in RBCs. The studies are more qualitative but less quantitative, and the differences in the degree of population shrinkage are less considered. Although there is general agreement that population shrinkage has important implications for public services in cities, especially RBCs, there is no consensus, and some studies even arrive at conflicting conclusions. What impact will the population shrinkage of RBCs have on public services? Will it be to promote or inhibit? Is there heterogeneity between different degrees of shrinkage? These problems are not only scientific problems to be studied but also related to the shrinkage of the governance of RBCs, especially with regard to the allocation of public service resources, which restricts the sustainable development of RBCs.
There are many RBCs in China, and they are important components of China’s energy and resource security base, and the stability of the national economy and social harmony depends on the sustainable transformation of these cities. Many cities have experienced population shrinkage since 2000, and the proportion of the shrinkage is significantly higher in the RBCs than in the non-resource-based cities [64]. According to the results of China’s 7th National Population Census, the population of 112 prefecture-level RBCs decreased by 2.79% compared to the 6th National Population Census in 2010, and the populations of 70 RBCs decreased. Therefore, the study of the impact of population shrinkage on the PSLs in China’s RBCs is also a reference for RBCs in developing and even developed countries.
The contributions of this paper are as follows: (i) this paper extends the study of the impact of population shrinkage by revealing the impact of population shrinkage on the level of public services in RBCs; and (ii) it considers public services as an endogenous variable that changes with the size of the population; the analysis of cities with different shrinkage grades identifies the heterogeneity of their impact, which can provide a basis for classified policy implementation.

2. Material and Methods
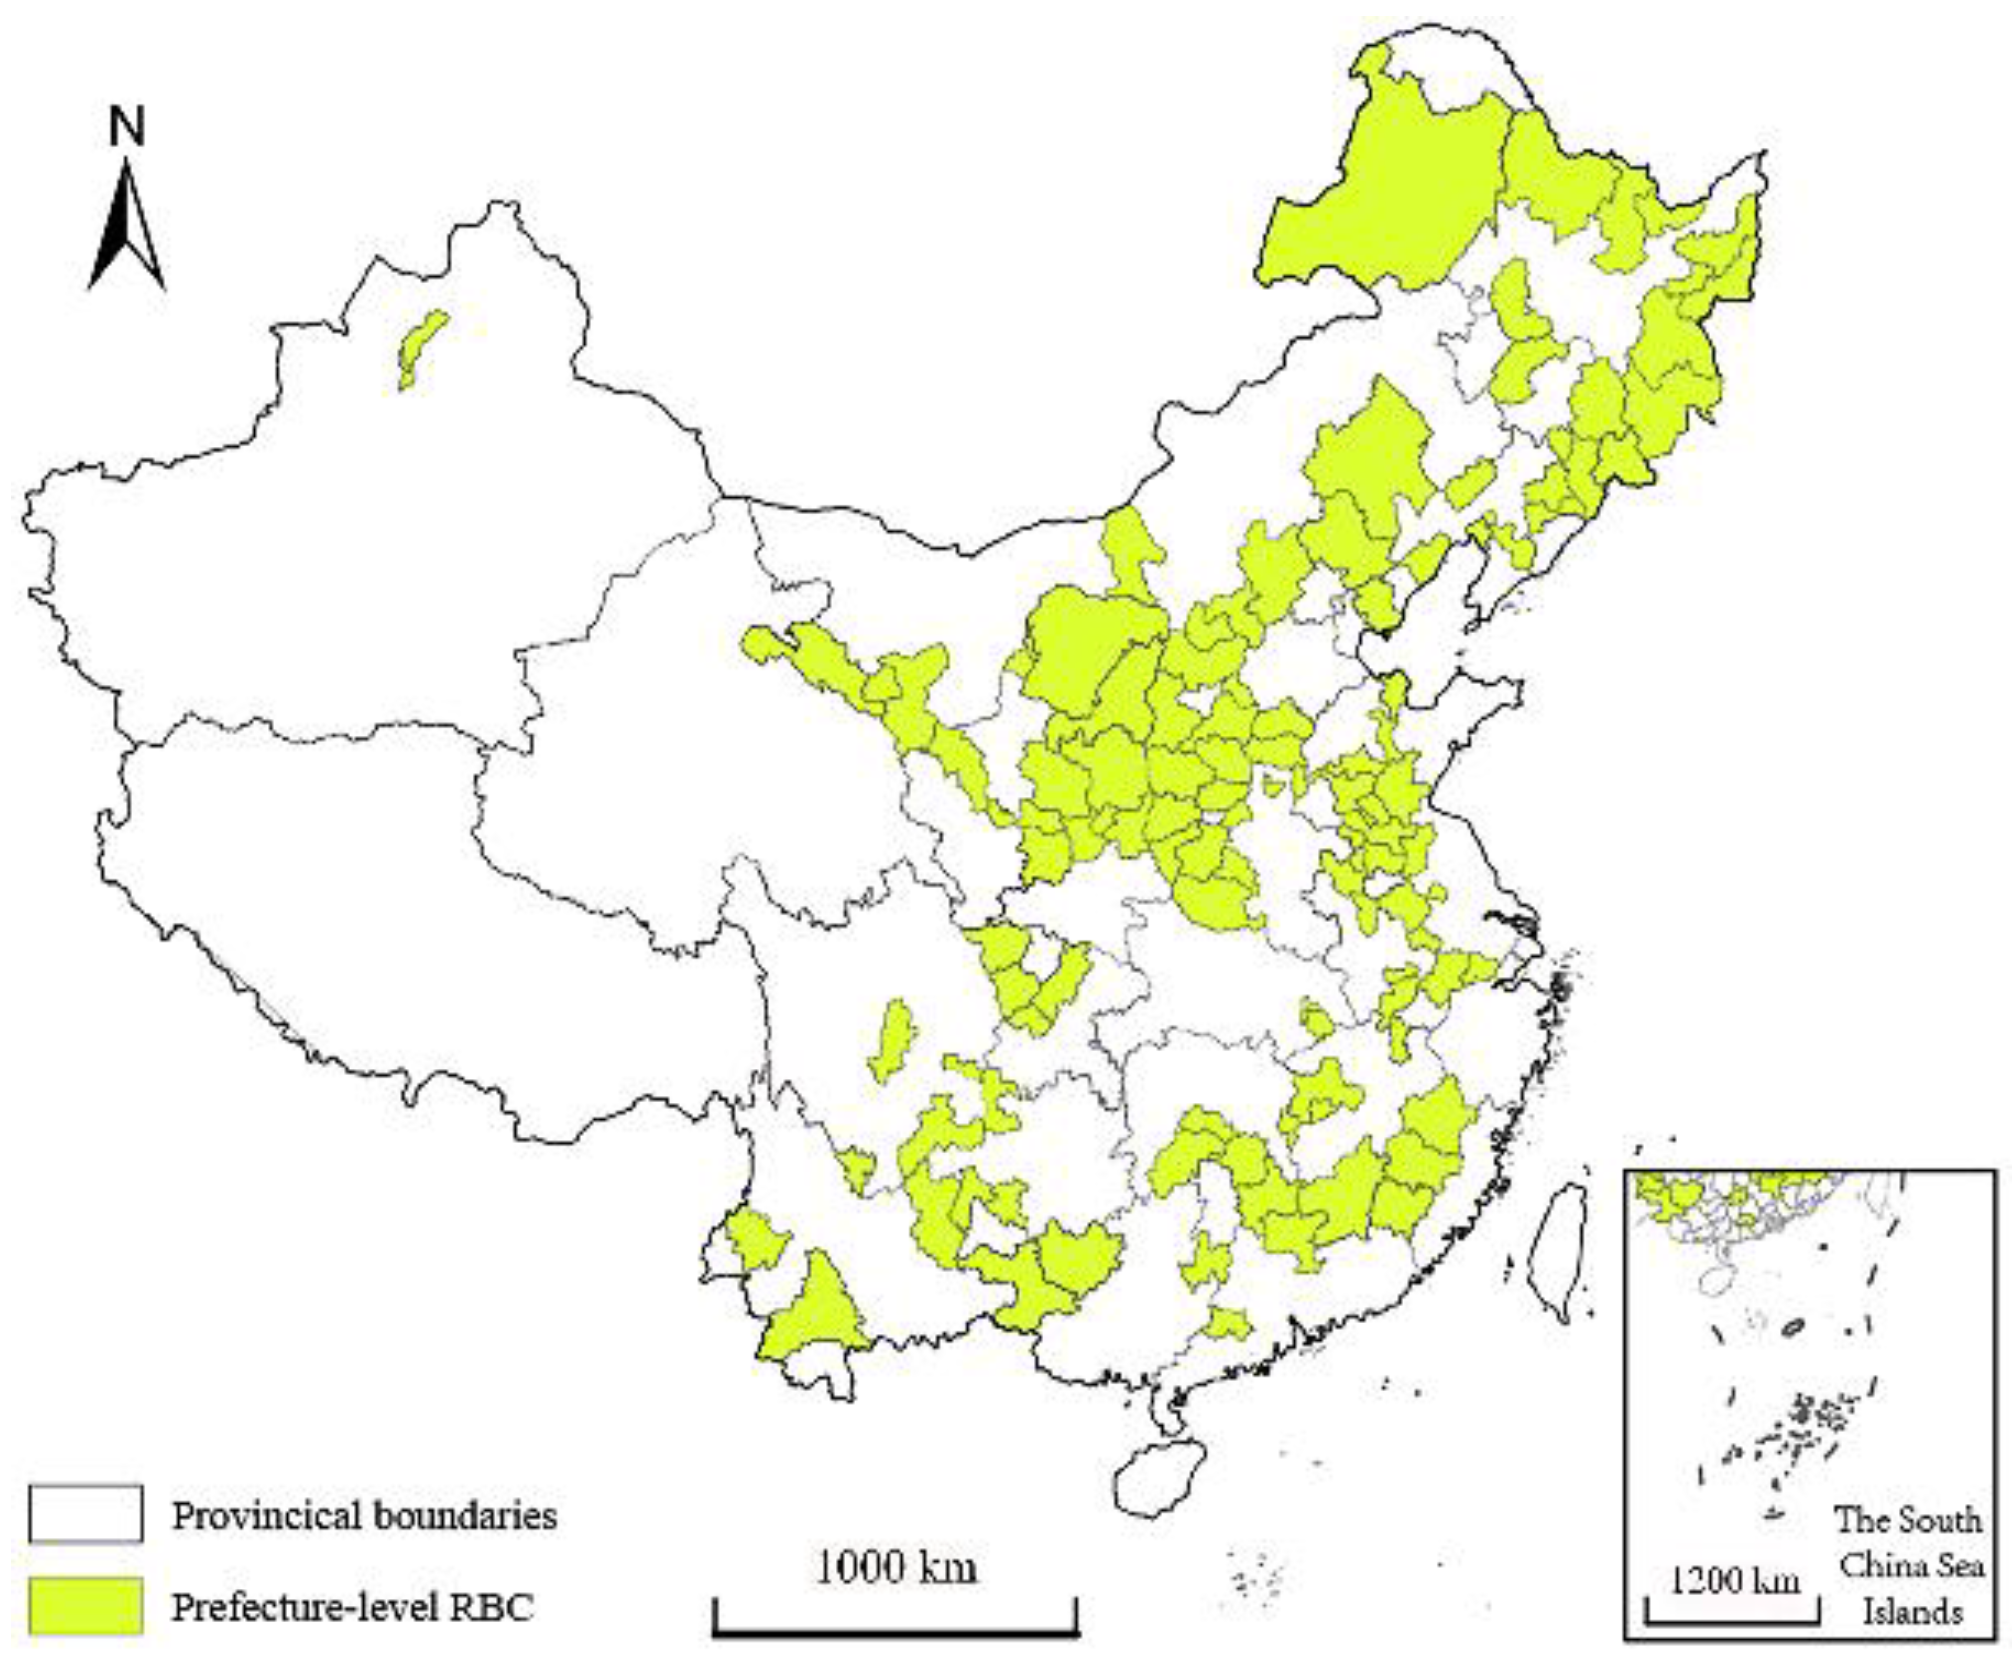
2.1. Study Area

According to the ‘National Sustainable Development Plan for Resource-based Cities 2013–2020’ issued by the State Council in 2013, there are 262 RBCs nationwide in China, including 126 prefecture-level administrative regions, 62 county-level cities, 62 counties, 58 counties (including autonomous counties, forest areas, etc.), and 16 municipal districts (development zones or management zones). The study takes 112 prefecture-level RBCs as the research area; these RBCs account for 88.88% of the total number of prefecture-level RBCs and are the main body of the RBCs in China. The study areas are shown in Figure 1.

2.2. Research Methods

2.2.1. Definition of RBC Shrinkage Grade

Urban shrinkage has significant manifestations in many aspects. Population decline is a typical characteristic of urban shrinkage [22], and population size reduction is the most reliable and comparable judgment indicator [52] and is taken as the main indicator for identifying urban shrinkage [65,66]. Lötscher defines urban shrinkage as a decline in population and the resulting decrease in average population density [67]; SCIRN, Alves, Bartholomae, et al. also take population decline as the main defining indicator [59,68,69] and determine the shrinkage grade based on the degree of population shrinkage [25,68]. In this paper, cities with a positive rate of permanent population reduction (pr, Equation (1)) are defined as shrinking cities.
p r = p t p t 1 p t 1 × 100 %
where pr is the population reduction rate, pt is the size of permanent population in year t, and pt−1 is the size of the permanent population in the last population census.
There are many RBCs in China where the size of the population grows but the proportion of the national population decreases. To make a distinction, such cities are defined as relative shrinkage cities, and the cities in which both the population and its proportion increase are defined as continuous growth cities. Considering the change in population number, the change in population proportion, and the population decrease rate, the shrinkage grade is classified into continuous growth, relative shrinkage, slight shrinkage, moderate shrinkage, and significant shrinkage, and the classification criteria are shown in Table 1. Based on the data from China’s National Population Censuses in 2000, 2010, and 2020, we determine the number of shrinking cities and the shrinkage grade of each city in two periods, 2000–2010 and 2010–2020, respectively.

2.2.2. Measurement of PSLs in RBCs

The connotation of public services is different in different countries and at different times, and the connotation has been expanded along with social development. Scholars mostly believe that it includes education, transportation, medical care, culture, etc. [70]. Green spaces become part of the public goods because of their positive impact on the residents’ physical and mental health [71], and the ecological environment is also considered to be a basic public good or service [72]. As population shrinkage is mostly accompanied by housing vacancies, the results of the PSLs would be exaggerated if the housing guarantee was included in the measurement of the PSLs. China’s subsidized housing, including urban low-cost housing, affordable housing, and public rental housing, was gradually introduced; for example, public rental housing was implemented in 2010. Therefore, the continuity of data and the comparability are also the reasons for not choosing the housing guarantee. Although China has established a social security system with wide coverage, the social security standards between rural residents and urban residents differ significantly, and the statistical caliber is not consistent. This paper also does not consider social security with the consideration of the operability of accurate data acquisition and the actual development of RBCs in China.
China is promoting the equalization of public services. The basic goal is that everyone can enjoy public services and the opportunity is equal. The population and economic development levels of the 112 RBCs in China are obviously different. The total supply of public services can not effectively reflect the equalization of public services, and the relative index is common practice. Therefore, the PSL measurement index system of RBCs based on the per capita sense is constructed. According to the literature [70,73,74], and taking into account the ‘14th Five-Year Plan for Public Services’ issued by the State Council, 12 indicators were selected to characterize the PSLs of 112 RBCs in China, which measured the PSLs in five aspects: public education, basic medical care, public environment, public transportation, and public culture (Table 2).
As the data on the indicators of the public environment, public transportation, and public culture vary greatly among the RBCs, this paper calculates the square root of these indicators for data dimensionality reduction first. The entropy value method is used to calculate the weights of the indicators in three years, 2000, 2010, and 2020, and the average value of the indicator weights in 2000, 2010, and 2020 is used as the final weight of the indicators. Then, the linear weighting sum method is used to calculate the PSL of each city in the three years.

2.2.3. Theoretical Analysis and Research Hypothesis

Population shrinkage can contribute to the improvement of public services in the following ways: (i) Under the conditions of the market economy, each city is an independent subject of interest, and the ‘GDP-only’ promotion mechanism of officials and fiscal decentralization in China has intensified economic competition. As a result, government investment prefers economic infrastructure investment and cuts spending on education and social administration [75]. All of these create a ‘crowding-out effect’ on public service investments [76]. Combined with the reality of the overall under-supply of public services in Chinese cities [77], population shrinkage can therefore increase the per capita level of the public services. (ii) The central government has been concerned about the difficulties of RBCs due to population shrinkage and has increased transfer payments and continuously optimized policies, ensuring that more transfer payments are invested in public services. The central government has also continued to increase policy support for RBCs and to establish a sustainable development assessment system that reinforces people’s livelihoods; this has helped to guide the government in shifting its focus to people’s livelihoods and thus to improve public services. (iii) The population shrinkage in RBCs is mostly accompanied by aging and a low birth rate. The loss of the working-age population, especially the high-quality population, brings about the change of the population structure, education structure [78], and consumption structure, and the growth of the residents’ income is slow. Thus, population shrinkage has reduced the scale of demand for basic urban public services [29], and this urges the government to increase spending on social security and employment, health care, public education, and employment training investment, and improving the urban living environment. In addition, the reducing pressure on public service demand helps the RBCs to invest more resources in economic development, promoting economic development and, ultimately, public services. Based on these, Hypothesis 1 is proposed.
Hypothesis 1.
Short-term population shrinkage in RBCs contributes to higher PSLs.
Public services in China’s RBCs have lacked stable funding for a long time [3], and the PSL is improving at a slower pace than that of the nation; public services are generally in short supply. Due to the obvious differences in the magnitude of population shrinkage in each shrinkage grade, the significant differences in population growth or decline will have different effects on the PSLs of the RBCs. Second, industry is crucial for RBCs, and its shrinkage is the main reason for the urban shrinkage in most RBCs [57], which is reflected in the degree of population shrinkage. Industry is more dependent on the level of public services than other sectors [78], and governments are more willing to increase the level of public services [32] to attract industrial firms. Specifically, in the continuous growth grade and relative shrinkage grade of population growth, population shrinkage is unfavorable to PSL increase, while the remaining three grades of population shrinkage are favorable to PSL increase. Based on this, Hypothesis 2 is proposed.
Hypothesis 2.
The effect of population shrinkage on PSLs in RBCs varies across shrinkage grades.

2.2.4. Model Setting

PSL changes in the RBCs are influenced by population changes and other factors, such as economic, fiscal, urbanization, industrialization factors, and the income of the residents. To test the effect of population shrinkage on PSLs in RBCs, the following model is constructed.
PSL i t = α i t + β s h r i n k i t 1 + δ X i t + ε i t
where i denotes the city, t denotes the year, PSL is the explanatory variable; and shrink is the key explanatory variable of the PSL, which denotes population shrinkage. X is the set of control variables; αi is the constant and, ε is the random disturbance term. β is the estimated coefficient, which is the focus of this paper.
(i)
If β > 0, this indicates that the population shrinkage can improve the PSL; the PSL will increase with the increasing population shrinkage, i.e., Hypothesis 1 is proved.
(ii)
If β acts in different directions at different shrinkage grades, it indicates that the population shrinkage has different effects among different shrinkage classes, i.e., Hypothesis 2 is proved.

2.2.5. Variable Selection

The core explains variables. Although ‘pr’ can reflect population shrinkage, the basis of comparison is different in different periods. In order to intuitively characterize whether a city is shrinking, referring to Murdoch’s research findings [79], the population shrinkage degree is used to characterize shrink. Formula (3) is used to measure shrink. If shrink is >0, the city is shrinking, and the larger the value, the more serious the shrinkage.
s h r i n k i t = ln ( P i t / P i 2000 )
where Pit is the resident population of city i in year t, and Pi2000 is the resident population of city i in the year 2000.
According to the analysis results of the existing literature, the following factors are set as control variables. (i) Economic development (pgdp): the economy plays a fundamental role in guaranteeing the supply of public services; this is characterized by per capita GDP. (ii) Urbanization (ur): urbanization and economic mutual development indirectly promote the PSL, and public services are important elements of urbanization; this is characterized by the urbanization rate. (iii) Industrial structure (eip): a resource-based economy dominates the economy of most RBCs, but over-reliance on it tends to form path dependence; this is characterized by the proportion of employees in extractive industries. (iv) Resident’s income (eaw): autonomous population mobility is mainly due to the differences in the residents’ income, which is caused by uneven economic development. Usually, higher incomes lead to higher demand and a larger scale for public services, which is also more conducive to people’s inflow; this is characterized by the average employee wage. (v) Aging (age): many studies have concluded that aging increases public service expenditures; this is characterized by the level of aging (age, the proportion of population over 65 years old). (vi) Fiscal (fsr): public service supply is directly affected by fiscal factors. Fiscal decentralization makes the government favor public service expenditures with economic effects [80,81] and cut expenditures on education and social administration [75]. Under high fiscal self-sufficiency, government expenditure preferences tend to move closer to public services [82]; this is characterized by fiscal self-sufficiency.

2.3. Data Source

The greening coverage rate of built-up areas, green park area per capita, physicians per 10,000 persons, hospital beds per 10,000 persons, buses per 10,000 persons, cabs per 10,000 persons, public library collection per 100 persons, and urban road area per capita were obtained from the China Urban Statistical Yearbook and the China Urban Construction Statistical Yearbook. The remaining indicators to measure the PSLs are mainly from the statistical yearbooks of the provinces and China Urban Statistical Yearbook. The indicator data of the control variables are mainly obtained from the statistical yearbooks of each province and the China Urban Statistical Yearbook; the population data are obtained from the Chinese Population Census; the individual missing data are filled in by linear interpolation. To reduce the heteroscedasticity and volatility caused by the non-uniform units of variables and different sizes of the values and to make the data regression smoother, all control variables are logarithmically processed.

3. Research Results

3.1. Population Shrinkage of China’s RBCs

Figure 2 reflects the distribution of the RBCs in each shrinkage grade in different periods with the following characteristics: (i) The number of RBCs with population shrinkage has increased significantly, from 34 in 2000–2010 to 70 in 2010–2020, and the proportion of shrinkage cities increased from 30.35% to 62.5%. Only 10 cities experienced a loss in 2000–2010 but growth in 2010–2020, while 47 cities shifted from growth to decline, and these indicate that China’s RBCs are in the early stages of shrinkage [56]. (ii) The shrinkage degree of the RBCs deepened significantly, with 71 cities showing an intensifying trend of shrinkage, including Qitaihe, Benxi, Heihe, Tonghua, Songyuan, Tongling, etc., which have turned from population growth to moderate shrinkage or significant shrinkage. The intensity of the shrinkage degree is also highlighted by a significant increase in cities with moderate shrinkage and significant shrinkage, with the number of cities of the above two levels increasing from 3 to 25. (iii) The distribution of the shrinkage cities has expanded to the west and south, but they are still mainly distributed in northeast China and northwest China [7]. (iv) Northeast China is the most serious region of significant shrinkage [50,83]. All the resource-based cities shrank between 2010 and 2020, and the region‘s moderately and severely shrunk cities accounted for 59.25% of the country‘s total, defined by some scholars as the Chinese Bust Belt [84]. (v) Over time, the relationship between pr and the population size changes from uncorrelated in the first stage to significant negative correlation in the second stage; that is, ‘the smaller the population, the higher the shrinkage level’, indicating that the RBCs with a small population size are more prone to shrinkage. It may be related to the low economic development level of small cities, a single industrial structure, and insignificant agglomeration benefits. The key driver factor of population shrinkage in the RBCs in China is de-industrialization [85,86]. China’s RBCs generally suffer from an imbalanced industrial structure, weak alternative industries, and a lack of industrial support [87], especially as the resources tend to be depleted and the effects of de-industrialization become more apparent. There are 24 cities that are identified as resource-depleted cities, and only one of these cities has achieved population growth. There are 85 mature cities and declining cities out of the 112 cities. Fifty-five of those have experienced population shrinkage since 2010, especially those cities in northeast China. The underdeveloped public services, such as education and medical care, urban livability [46], also contribute to population shrinkage [50]. Maladjustment to market-oriented reformation, aging and natural population decline, and poor urban environment have also been identified as important factors in the population shrinkage of the RBCs in China [87,88], especially in northeastern China.

3.2. Results of PSL Measurement

Compared to 2000, the PSLs of all the RBCs show an increase in 2020 (the PSLs of the RBCs are shown in Table S2), with the average PSL being 0.383 in 2000, 0.469 in 2010, and 0.575 in 2020, respectively. Compared with the national average, it led by 0.006 in 2000 and fell behind by 0.014 in 2010. The gap further widens to 0.018 in 2020, and the number of cities above the national average decreased from 57 in 2000 to 40 in 2020. The coefficient of variation on the PSLs in three years decreased from 0.159 to 0.099. The above analysis shows that the PSLs of the RBCs have increased significantly since 2000, but the growth rate of the PSLs has been slower than that of the nation, and the gap with the nation has gradually widened [29]. The PSL difference in the PSLs among the 112 cities decreased during 2000–2020, but the PSL difference among the cities is still at a high level. For example, the lowest PSL city in 2020 is only 58.96% of the highest city.
Figure 3 shows the PSL classification of RBCs by using Jenks’ Natural Breaks method. This method can group similar values most appropriately and maximize the differences between classes and can better represent the distribution characteristics of the 112 RBC PSLs. Although there are 39 cities with unchanged PSL grades, the overall grade structure does not change much. The PSL grades of the 32 cities were improved, of which 8 cities improved by 2 or more grades; these were mainly located in western China. There were 41 cities with a decline in grade, of which 7 cities with a decrease in 2 grades are all located in central China and 6 cities are mainly located in Shanxi Province. The northern cities are higher, such as those in northeast China and northwest China; the Southern cities are lower, such as those in southwest China, with an obvious spatial divergence of ‘high north and low south’.
Figure 4 shows the PSLs of different shrinkage grades in 2000, 2010, 2020. The PSL of the continuous growth grade is highest in 2000 and 2010, while it dropped to the third place in 2020, and the significant shrinkage grade replaced the continuous growth grade as the highest PSL grade. The slight shrink grade PSL is the lowest in 2000 and 2010, while the relative shrinkage grade PSL is the lowest in 2020. The above shows that there is an enormous difference in the improvement of the PSLs for cities with different shrinkage levels. The internal differences of the PSLs in each shrinkage grade generally show a decreasing trend, with only a slight increase in slight shrinkage class during 2000–2020, but the decreasing trend slowed down significantly during 2010–2020.
Figure 5 shows the increase range of the PSLs (PSLIR) of the cities during 2000–2010, 2010–2020, and 2000–2020. The average annual PSLIRs of the two periods were 2.25 and 2.51 percentage points, respectively, and there were 70 cities with a higher average annual increase range in the PSLs in the latter period compared to 2000–2010. Of the 70 cities, 15 cities in northeast China and 26 cities in west China, accounting for 75% and 72.22% of the total number of respective RBCs, respectively, were also the regions with the most pronounced population shrinkage. It shows a trend of accelerated increase as the population shrinkage accelerates.

3.3. Correlations between pr and PSLIR

During the period between 2000 and 2020, the PSLIRs in the continuous growth grade and the relative shrinkage grade were 47.75% and 49.70%, respectively, while the PSLIRs in the slight shrinkage grade, the moderate shrinkage grade, and the significant shrinkage grade were 54.44%, 57.21%, and 61.74%, respectively. The pr and the PSLIR in the five shrinkage grades show an obvious positive correlation (Figure 6c), and the change trends of the two phases are generally consistent with the trends of 2000–2020 (Figure 6a,b). The correlation coefficients between the pr and the PSLIR for the five grades in the two phases and 2000–2020 were 0.88, 0.92, and 0.99, respectively, and were significant at a 0.05 level. This is a positive correlation between pr and PSLIR.
The analysis of the shrinkage grade may mask individual differences, and the individual differences need to be analyzed at the city scale. The correlation coefficients between the pr and the PSLIR of the 112 cities during 2000–2010 and 2000–2020 were 0.284 and 0.227, respectively (Figure 7a,c), and were significant at a 0.05 level. The insignificant correlation coefficient in 2010–2020 was caused by three cities, Guang’an, Anshun, and Liupanshui; the correlation coefficient after excluding the above three cities was 0.216 (Figure 7b), which is similarly significant at a 0.05 level. There is a positive correlation between the pr and the PSLIR at both the shrinkage grade and the individual city scale.

3.4. Model Regression Results

3.4.1. Regression Results for All RBCs

Multiple regressions are prone to multicollinearity, which affects the accuracy of the regression results, and the variance inflation factor (VIF) is often used to check the multicollinearity. The covariance diagnosis showed that the VIF was less than 10, indicating that there was no significant multicollinearity. The F-test and Hausman’s test were conducted for choosing the estimation strategy, which shows that the fixed-effects regression result is optimal, combined with the fact that the panel is a short panel, and the number of cities is 112. Therefore, a fixed effects model is used for regression. As the main variables are PSL and shrink, robustness tests are performed by adding the control variables one by one. Table 3 shows the estimation results, whereas models 2–7 show the estimation results after the stepwise addition of the control variables. Model 1 shows that the effect of shrink on the PSL without the control variables is significantly positive at the 0.01 level, i.e., population shrinkage can help to increase the PSLs of China’s RBCs. The robustness tests show that shrink is significant at the level of 0.05 or above when the control variables are added one by one. The estimated coefficients are in the same direction of action as when no control variables are added, which indicates that the positive relationship between shrink and PSL is stable; that is, the positive relationship between shrink and PSL is stable, verifying Hypothesis 1 that population shrinkage helps to raise the PSL.
After adding the control variables, all the control variables passed the significance test of 0.05 or were above the level in the other models, indicating that these factors also have an impact on China’s PSLs, apart from eaw and fsr, which were insignificant, and ur, which had a low significance level in model 7. (i) The significant positive pgdp and eaw can be attributed to the rapid industrialization in China since 2000, which led to the huge demand for energy and raw materials and then promoted the economic development of the RBCs. Industrialization also contributed to a significant increase in income and prompted the government to increase the provision of public services. Obviously, shrink and eaw contribute to the PSLs of the RBCs with economic support and resident demand, respectively. (ii) China is promoting human-centered urbanization, which is named new urbanization, through the collaborative promotion of household registration system reform and public services equalization. The agglomeration benefits of urbanization also improve the efficiency and reduce the cost of public service provision. Therefore, the ur has contributed to the improvement of the PSLs. The promotion of urbanization has boosted land-related revenues in RBCs and is a mechanism that explains the positive effect of urbanization [89]. (iii) The aging level in the 112 cities has increased from 6.78% to 14.37% since 2000; thus, the government has been expanding the investment in pensions and healthcare, promoting the public services related to aging. Therefore, age is significantly positive for the PSLs. (iv) The eip is significantly negative, indicating that the development of the resource-based economy instead inhibits the increase in the PSLs. This may be related to the fact that the development of resource-based economies is not conducive to their economic transformation [43], which in turn constrains economic development and constraints spending on public services. (v) The significant decline in the financial self-sufficiency rate of 112 RBCs since 2000, from 60.49% to 36.04%, has led to an increasingly pronounced lack of local finance; so, fsr is not significant.

3.4.2. Regression Results for RBCs with Different Shrinkage Grades

The cointegration test is carried out first, and the equations with a VIF value over 10 are analyzed. The control variables that cause multicollinearity are eliminated, and then, the model estimation is carried out, and the F-test and Hausman test are carried out. Table 4 shows the estimation results according to the population shrinkage grade for the whole study period. Among these models, models 1, 3, 5, 7, and 9 are estimated without control variables, while models 2, 4, 6, 8, and 10 are estimated including the control variables. The estimation results show that, without adding control variables, except for the relative shrinkage grade (but the regression coefficient is negative), the shrink is significant at the 0.01 level in the other four shrinkage grades. There is a positive effect in the three grades of population decrease but an inhibitory effect in two grades of the population increase, which reflects the overall under-supply of public services in China’s RBCs.
After adding the control variables, except for the severe shrinkage grade, the shrink is significant at the level of 0.1 or above, and the direction of action is the same as that without the control variables. That is, the relationship is stable in that population shrinkage has a positive effect in those cities of population decline and a negative effect in those cities of population growth. Consequently, Hypothesis 2 is verified.
Among the control variables, (i) the eip has a facilitating effect in the cities of the relative shrinkage grade, and it can be attributed to the large share of the resource-based economy. The average share of 40 cities in 2010 was 15.49%, including Huaibei and Yangquan; Jincheng and Datong were over 30%, but the average share of the 112 cities was only 12.7%. (ii) The effect of eaw in the relative shrinkage grade is not significant, mainly because higher resident income promotes population increase, and the population increase, in turn, weakens the promotion of the PSLs. Slow income increase and low income are the main reasons for the insignificance in the significant shrinkage grade; thus, the eap is not significant. (iii) The effects of pgdp, ur, and age on the PSLs are consistent with the national-scale estimates. Therefore, no further description is given. (iv) The fsr is insignificant in five shrinkage grades, which fully illustrates the reality of over-reliance on transfer payments for public service in China’s RBCs.

4. Discussions

4.1. Discussion on Population Shrinkage

The shrinkage of the cities is foreseeable [90]. China’s economic development has entered a new normal, and as time goes on, more RBCs will join the ranks of the shrinking population and the degree of shrinkage will deepen [83]. Although urban shrinkage is not a short-term interruption of growth [7], the fact is that the smaller the population the more pronounced the shrinkage [91], and this may cause the RBCs in China to face the cycle of ‘population shrinkage-city shrinkage-population further shrinkage’ which was named as a ‘vicious cycle’ by Haase et al. [18]. At the same time, population shrinkage is a serious challenge for RBCs, especially those with a small population size coping with urban transformation, resource depletion, and carbon emission reduction, as well as population shrinkage. The RBCs need more policy and financial support from higher levels of government, especially the central government, to cope with the phase war than other cities, especially those experiencing severe population shrinkages, such as Yichun, Baishan, Fushun, and Heihe, which should be given priority by policy makers [83].
The view that the number of shrinking RBCs in China has increased significantly is consistent with Long et al. [92] but may not be inconsistent with the findings of some scholars, such as Liu et al., Wang et al. [83,91], due to the study sample, the period of the study, and the data used; the use of different characterization metrics is important [34], and the comparison itself is not rigorous.

4.2. Discussion on Impact of Population Shrinkage on PSL

The results of this study show that population shrinkage has a positive effect on the PSLs of the RBCs in China, thereby improving the quality of urban life [18]. This is different from the research conclusions of Liu et al. [29] and Deng et al. [32], mainly due to the different research objects. The latter two are based on all shrinking cities. Although the RBCs studied in this paper have the general characteristics of shrinking cities, they also have their particularity, such as insufficient supply of public services, the continuous government support for economic transformation [57], the dividends of China’s rapid industrialization, etc.; thus the results will promote public services.
The fact that population shrinkage can promote the PSLs in cities with decreasing populations and inhibit the increase in the PSLs in cities with increasing populations reflects the overall inadequate supply of public services in the RBCs in China [77]. As an important determinant for the migration and settlement of migrants [93], inadequate public service provision in RBCs in turn affects population migration [77], triggering population movement to areas with high PSLs [94] and accelerating the population shrinkage in RBCs. Therefore, it is important to accelerate the construction of public service systems in RBCs, improve their PSLs and narrow the gap around the nation to slow down its population shrinkage and promote the sustainable development of RBCs. As RBCs may experience more severe social problems during boom periods [95], those cities that are still growing in population likewise need to take early steps to circumvent population shrinkage. After the control variables were gradually added, the estimated coefficients of the shrink were significantly reduced in the regression models for 112 cities as well as for the five shrinkage grades, which is consistent with Jarzebski et al. [21]. This requires the RBCs to adopt a combination of measures from multiple dimensions to improve PSLs, rather than a single measure. The boost to PSLs from the population shrinkage is short-term and will likely only occur in the early stages of the shrinkage. (i) With the intensification of shrinkage, the adverse effects of the shrinkage will lead to causality and form a circular chain [17], bring about a multidimensional chain response, and lead to a lack of endogenous economic growth momentum in the city [29]. In particular, the development of resource-based industries usually follows a ‘boom and bust’ cycle, with urban economies declining or even experiencing negative growth as resources tend to be depleted [57], leaving public services without economic support. (ii) The supply of public services has economies of scale, and prolonged shrinkage will obviously reduce the return on the investment in public services, making them unsustainable. (iii) The ‘resource curse’ effect and urban shrinkage, as well as the synergistic constraint effects of both, lead to a lack of stability and durability of public services. Moreover, RBCs are generally ‘path-dependent’ and have a crowding-out effect on other economic activities, especially the tertiary industries, which are indispensable for the improvement of public services. (iv) Industries dependent on natural resources with high energy consumption and high pollution are prone to environmental and ecological crises [96], making the cities less attractive to talent [97], and leading to the loss of highly qualified labor, especially highly qualified management and technical personnel. High-quality public services need to be supported by quality educational and medical resources, higher accessibility, superior habitat, and highly qualified management personnel, which are difficult to provide in chronically shrinking RBCs [29,32,45]. Therefore, RBCs should pay attention to population shrinkage management instead of allowing the population to decrease.

4.3. Discussion on Control Variables

The findings suggest that the factors affecting the PSLs in RBCs are multiple, and some may even be fundamental [3,32], such as economic development. Instead of meeting the needs of the remaining residents through contraction programs [58], the guiding philosophy of China’s RBCs is economic growth. Therefore, efforts should be made to adjust industrial structure diversification and reduce dependence on resource-based economies and to avoid local government-oriented evaluation of the economic growth performance, which impedes the coordinated development of local economies and public services [89]. Age has a significant positive effect on public services, which is consistent with Sanz and Kotera’s view [38]. Thus, it is of positive significance for RBCs to pay attention to the contributions of the aging to public services; to adapt to changes in public service demand preferences brought about by demographic changes; to strengthen the construction of aging-related medical and elderly service facilities; to promote well-being; and to enable healthy active living to reduce chronic illness and health care costs [19] and improve the local labor market as soon as possible. Unlike many European and American countries, public service expenditures in most RBCs in China are mainly based on transfer payments, and the institutional design effectively expanded the scale of local public service spending [96]. However this institutional setup not only increases the financial burden of the central government but also tends to create development inertia in RBCs, and it is clearly unsustainable. Incentive mechanisms should be constructed to stimulate the endogenous development momentum of RBCs and increase the role of local finance in public service investment. In addition, fsr had no significant effect, contrary to the findings of Tian et al. [76] based on national provincial and regional data, which precisely illustrated the special characteristics of RBCs.

5. Conclusions

This paper proposes the criteria for defining the shrinkage grade of RBCs and measures the shrinkage grades and the PSLs of 112 RBCs. This paper constructs a static analysis model of PSLs and population shrinkage in RBCs and discusses the impact of population shrinkage on PSLs. The results show a positive correlation between the pr and PSLIR and that population shrinkage at the national level contributes to the level of public services. However, this contribution is phased and only occurs in the early stage of population shrinkage. There is heterogeneity among the different shrinkage grades, which is promoted in the three shrinkage grades of population decline but is inhibited in the two shrinkage grades of population growth. Each control variable also has the heterogeneity of the PSLs.
This paper has some limitations: although we construct a system of PSL indicators from five aspects, it still cannot cover all the aspects of the public services. It also focuses on supply per capita, without considering the quality, accessibility, and demand for public services. Using only the total population to identify shrinking cities may also be inaccurate and affect the identification of population shrinkage grades. We suggest that the government expand the statistics of the indicators of the public services, especially in social security, housing security, and urban–rural employment, and make them as much as possible connected to the scope of statistics, such as municipalities, municipal districts, and urban physical territories. In addition, exploring the impact of population shrinkage on the different areas and regions of public services may yield some interesting findings. The threshold for the population shrinkage at which to promote higher PSLs in RBCs is also worth exploring.

Supplementary Materials

The following supporting information can be downloaded at: https://www.mdpi.com/article/10.3390/su142315910/s1, Table S1. The pr and percent change. Table S2. The PSL of China’s RBC in 2000, 2010 and 2020. Table S3. Number of shrinking RBC in China. Table S4. Descriptive statistics of variables. Table S5. Distribution of PSL in RBC in China.

Author Contributions

Conceptualization, S.Z. and X.W.; data curation, S.Z. and L.W.; formal analysis, S.Z. and X.W.; methodology, S.Z.; writing—original draft, S.Z. and L.W.; writing—review and editing, S.Z., L.W. and X.W. All authors have read and agreed to the published version of the manuscript.

Funding

This research is funded by the National Social Science Foundation of China (16BJY039), the Natural Science Foundation of Heilongjiang Province (D2018003), and the Harbin Normal University Graduate Student Innovation Project (HSDBSCX2021-07).

Institutional Review Board Statement

Not applicable.

Informed Consent Statement

Not applicable.

Data Availability Statement

The data presented in this study are available on request from the corresponding author.

Conflicts of Interest

The authors declare no conflict of interest.

References

  1. Ludlow, D.; Rauhut, D. Services of General Interest: Policy Challenges and Policy Options. Europa XXI 2013, 23, 69–84. [Google Scholar] [CrossRef] [Green Version]
  2. An, S.; Ravallion, M. Human development in poor countries: On the role of private incomes and public services. J. Econ. Perspect. 1993, 7, 133–150. [Google Scholar]
  3. Yin, P.; Liu, J.; Chen, C. Efficiency of basic public service for resource-based cities in Northeast China. China Popul. Resour. Environ. 2015, 25, 66–74. (In Chinese) [Google Scholar]
  4. Hastings, A. Territorial justice and neighbourhood environmental services: A comparison of provision to deprived and better-off neighbourhoods in the UK. Environ. Plan. C Gov. Policy 2007, 25, 896–917. [Google Scholar] [CrossRef]
  5. Wiśniewski, R.; Stępniak, M.; Szejgiec-Kolenda, B. Accessibility of public services in the age of ageing and shrinking population: Are regions following trends. Geogr. Ann. Ser. B Hum. Geogr. 2021, 103, 55–74. [Google Scholar] [CrossRef]
  6. Wolff, M.; Wiechmann, T. Urban growth and decline: Europe’s shrinking cities in a comparative perspective 1990–2010. Eur. Urban. Reg. Stud. 2017, 25, 122–139. [Google Scholar] [CrossRef]
  7. Wiechmann, T.; Bontje, M. Responding to tough times: Policy and planning strategies in shrinking cities. Eur. Plan. Stud. 2015, 23, 1–11. [Google Scholar] [CrossRef]
  8. Hu, Y.; Liu, Y.; Sun, H. Process and factors of urban growth and shrinkage: A case study of mining cities in Heilongjiang Province. Sci. Geogr. Sin. 2020, 40, 1450–1459. (In Chinese) [Google Scholar]
  9. Wu, K.; Sun, D. Progress in urban shrinkage research. Econ. Geogr. 2017, 37, 59–67. (In Chinese) [Google Scholar]
  10. Hudson, R. Rethinking change in old industrial regions: Reflecting on the experiences of North East England. Environ. Plan. 2005, 37, 581–596. [Google Scholar] [CrossRef] [Green Version]
  11. Mallach, A. What we talk about when we talk about shrinking cities: The ambiguity of discourse and policy response in the United States. Cities 2017, 69, 109–115. [Google Scholar] [CrossRef]
  12. Frazier, A.E.; Bagchi-Sen, S.; Knight, J. The spatio-temporal impacts of demolition land use policy and crime in a shrinking city. Appl. Geogr. 2013, 41, 55–64. [Google Scholar] [CrossRef]
  13. Blanco, H.; Alberti, M.; Olshansky, R.; Chang, S.; Wheeler, S.M.; Randolph, J.; London, J.B.; Hollander, J.B.; Pallagst, K.M.; Schwarz, T.; et al. Shaken, shrinking, hot, impoverished and informal: Emerging research agendas in planning. Prog. Plan. 2009, 72, 195–250. [Google Scholar] [CrossRef]
  14. Reckien, D.; Martinez-Fernandez, C. Why do cities shrink? Eur. Plan. Stud. 2011, 19, 1375–1397. [Google Scholar] [CrossRef]
  15. Hou, Y.; Long, R.; Zhang, L.; Wu, M. Dynamic analysis of the sustainable development capability of coal cities. Resour. Pol. 2020, 66, 101607. [Google Scholar] [CrossRef]
  16. Ryan, B.D.; Gao, S. Plan implementation challenges in a shrinking city. J. Am. Plan. Assoc. 2019, 85, 424–444. [Google Scholar] [CrossRef]
  17. Kim, S. Design strategies to respond to the challenges of shrinking city. J. Urban Des. 2019, 24, 49–64. [Google Scholar] [CrossRef]
  18. Haase, D. Shrinking cities, biodiversity and ecosystem services. Chall. Oppor. 2013, 253–274. [Google Scholar]
  19. Harper, S. Economic and social implications of aging societies. Science 2014, 346, 587–591. [Google Scholar] [CrossRef]
  20. Delken, E. Happiness in shrinking cities in Germany. J. Happiness Stud. 2008, 9, 213–218. [Google Scholar] [CrossRef] [Green Version]
  21. Jarzebski, M.P.; Elmqvist, T.; Gasparatos, A.; Fukushi, K.; Eckersten, S.; Haase, D.; Goodness, J.; Khoshkar, S.; Saito, O.; Takeuchi, K.; et al. Ageing and population shrinking: Implications for sustainability in the urban century. Npj Urban Sustain. 2021, 1, 17. [Google Scholar] [CrossRef]
  22. Martinez-Fernandez, C.; Audirac, I.; Fol, S.; Cunningham-Sabot, E. Shrinking cities: Urban challenges of globalization. Int. J. Urban Reg. Res. 2012, 36, 213–225. [Google Scholar] [CrossRef] [PubMed]
  23. Haase, A.; Rink, D.; Grossmann, K.; Bernt, M.; Mykhnenko, V. Conceptualizing urban shrinkage. Environ. Plan. A 2014, 46, 1519–1534. [Google Scholar] [CrossRef] [Green Version]
  24. Martinez-Fernandez, C.; Weyman, T.; Fol, S.; Audirac, I.; Cunningham-Sabot, E.; Wiechmann, T.; Yahagi, H. Shrinking cities in Australia, Japan, Europe, and the USA: From a global process to local policy responses. Prog. Plan. 2016, 105, 1–48. [Google Scholar] [CrossRef]
  25. Couch, C.; Cocks, M. Housing vacancy and the shrinking city: Trends and policies in the UK and the city of Liverpool. Hous. Stud. 2013, 28, 499–519. [Google Scholar] [CrossRef]
  26. Schetke, S.; Haase, D. Multi-criteria assessment of socio-environmental aspects in shrinking cities. Experiences from eastern Germany. Environ. Impact Assess. Rev. 2008, 28, 483–503. [Google Scholar] [CrossRef]
  27. Bontje, M. Facing the challenge of shrinking cities in East Germany: The case of Leipzig. Geojournal 2004, 61, 13–21. [Google Scholar] [CrossRef]
  28. Hoekveld, J.J. Spatial differentiation of population development in a declining region: The case of Saarland. Geogr. Ann. Ser. B Hum. Geogr. 2015, 97, 47–68. [Google Scholar] [CrossRef]
  29. Liu, Y.; Li, J.; Xiao, S. How does urban shrinkage affect the supply of local public services? Urban Dev. Stud. 2020, 27, 11–18. (In Chinese) [Google Scholar]
  30. Zhou, K.; Qian, F.F. Shrinking city: On searching for urban development in Nor-Growing scenarios. Mod. Urban Res. 2015, 30, 2–13. (In Chinese) [Google Scholar]
  31. Häußermann, H.; Haila, A. The European city: A conceptual framework and normative project. In Cities of Europe: Changing Contexts, Local Arrangements, and the Challenge to Urban Cohesion; Kazepov, Y., Ed.; Blackwell Publishing Ltd.: Oxford, UK, 2005; pp. 43–63. [Google Scholar]
  32. Deng, Y.; Zhang, M. Heterogeneous city shrinkage and urban public service level—Also on the regulatory role of economic development level. Soft Sci. 2020, 4, 96–103. (In Chinese) [Google Scholar]
  33. Foster, J.; Taylor, A. In the shadows: Exploring the notion of ‘Community’ for temporary foreign workers in a boomtown. Can. J. Sociol. 2013, 38, 167–190. [Google Scholar] [CrossRef] [Green Version]
  34. Wu, K.; Li, Y. Research progress of urban land use and its ecosystem services in the context of urban shrinkage. J. Nat. Resour. 2019, 34, 1121–1134. (In Chinese) [Google Scholar] [CrossRef]
  35. Frazier, A.E.; Bagchi-Sen, S. Developing open space networks in shrinking cities. Appl. Geogr. 2015, 59, 1–9. [Google Scholar] [CrossRef]
  36. Hasse, D.; Hasse, A.; Rink, D. Conceptualizing the nexus between urban shrinkage and ecosystem services. Landsc. Urban Plan. 2014, 132, 159–169. [Google Scholar] [CrossRef]
  37. Fritsche, M.; Langner, M.; Köhler, H. Shrinking cities: A new challenge for research in urban ecology. In Shrinking Cities Effects on Urban Ecology and Challenges for Urban Development; Langner, M., Endlicher, M., Eds.; Peter Lang: Bern, Switzerland, 2007; pp. 17–33. [Google Scholar]
  38. Sanz, I.; Velázquez, F. The role of aging in the growth of government and social welfare spending in the OECD. Eur. J. Political Econ. 2007, 23, 917–931. [Google Scholar] [CrossRef]
  39. O’Neill, B.C.; Liddle, B.; Jiang, L.; Smith, K.R.; Pachauri, S.; Dalton, M.; Fuchs, R. Demographic change and carbon dioxide emissions. Lancet 2012, 380, 157–220. [Google Scholar] [CrossRef]
  40. Liu, X.; Wang, M.; Qiang, W. Urban form, shrinking cities, and residential carbon emissions: Evidence from Chinese city-regions. Appl. Energy 2020, 261, 114409. [Google Scholar] [CrossRef]
  41. Grossmann, K.; Bontje, M.; Haase, A. Shrinking cities: Notes for the further research agenda. Cities 2013, 35, 221–225. [Google Scholar] [CrossRef]
  42. Apergis, N.; Payne, J.E. The oil curse, institutional quality, and growth in MENA countries: Evidence from time-varying cointegration. Energy Econ. 2014, 46, 1–9. [Google Scholar] [CrossRef]
  43. Hou, Y.; Long, R.; Chen, H.; Zhang, L. Research on the sustainable development of China’s coal cities based on lock-in effect. Resour. Pol. 2018, 59, 479–486. [Google Scholar] [CrossRef]
  44. Hossain, M.E.; Islam, M.S.; Bandyopadhyay, A.; Awan, A.; Hossain, M.R.; Rej, S. Mexico at the crossroads of natural resource dependence and COP26 pledge: Does technological innovation help? Resour. Pol. 2022, 77, 102710. [Google Scholar] [CrossRef]
  45. Long, R.; Li, H.; Wu, M. Dynamic evaluation of the green development level of China’s coal-resource-based cities using the TOPSIS method. Resour. Policy 2021, 74, 102415. [Google Scholar] [CrossRef]
  46. He, S.Y.; Sun, K.K.; Guo, Y. Liveability and migration intention in Chinese resource-based economies: Findings from seven cities with potential for population shrinkage. Cities 2022, 131, 103961. [Google Scholar] [CrossRef]
  47. Chapman, R.; Plummer, P.; Tonts, M. The resource boom and socio-economic well-being in Australian resource towns: A temporal and spatial analysis. Urban Geogr. 2015, 36, 629–653. [Google Scholar] [CrossRef]
  48. Sá Marques, T.; Saraiva, M.; Ribeiro, D. Accessibility to services of general interest in polycentric urban system planning: The case of Portugal. Eur. Plan. Stud. 2020, 28, 1068–1094. [Google Scholar] [CrossRef]
  49. Chang, Y.; de Jong, M.; Cheng, B. Getting depleted resource-based cities back on their feet again—The example of Yichun in China. J. Clean. Prod. 2016, 134, 42–50. [Google Scholar]
  50. Ma, Z.; Li, C.; Zhang, J. Understanding urban shrinkage from a regional perspective: Case study of Northeast China. J. Urban Plan. Dev. 2020, 146, 5020025. [Google Scholar] [CrossRef]
  51. Chi, G.; Marcouiller, D.W. Natural amenities and their effects on migration along the urban–rural continuum. Ann. Reg. Sci. 2013, 50, 861–883. [Google Scholar] [CrossRef]
  52. Chen, Y.; Mei, L. Basic public service evaluation of resource-based cities in Northeast China. World Reg. Stud. 2018, 27, 55–64. [Google Scholar]
  53. Jaren, C.; Mundy, B. Environmental valuation: Interregional and intraregional perspectives. J. Reg. Sci. 2008, 48, 1029–1032. [Google Scholar]
  54. Yang, Z.; Zhu, Y.; Zhang, Y. Does urban shrinkage lower labor productivity? The role of spatial expansion. Reg. Sci. Policy Pract. 2020, 12, 1–12. [Google Scholar] [CrossRef]
  55. Schilling, J.; Logan, J. Greening the rust belt: A green infrastructure model for right sizing America’s shrinking cities. J. Am. Plan. Assoc. 2008, 74, 451–466. [Google Scholar] [CrossRef]
  56. Xiao, H.; Duan, Z.; Zhou, Y. CO2 emission patterns in shrinking and growing cities: A case study of Northeast China and the Yangtze River Delta. Appl. Energy 2019, 251, 113384. [Google Scholar] [CrossRef]
  57. He, S.Y.; Lee, J.; Zhou, T.; Wu, D. Shrinking cities and resource-based economy: The economic restructuring in China’s mining cities. Cities 2017, 60, 75–83. [Google Scholar] [CrossRef]
  58. Hospers, G. Policy responses to urban shrinkage: From growth thinking to civic engagement. Eur. Plan. Stud. 2014, 22, 1507–1523. [Google Scholar] [CrossRef]
  59. Wiechmann, T.; Pallagst, K. Urban shrinkage in Germany and the USA: A comparison of transformation patterns and local strategies. Int. J. Urban Reg. Res. 2012, 36, 261–280. [Google Scholar] [CrossRef] [PubMed]
  60. Rhodes, J.; Russo, J. Shrinking ‘smart’?: Urban redevelopment and shrinkage in Youngstown, Ohio. Urban Geogr. 2013, 34, 305–326. [Google Scholar] [CrossRef]
  61. Hollander, J.B.; NéMETH, J. The bounds of smart decline: A foundational theory for planning shrinking cities. Hous. Policy Debate 2011, 21, 349–367. [Google Scholar] [CrossRef]
  62. Engen, M.; Fransson, M.; Quist, J. Continuing the development of the public service logic: A study of value co-destruction in public services. Public Manag. Rev. 2020, 23, 886–905. [Google Scholar] [CrossRef] [Green Version]
  63. Liang, S.; Jin, Z. Development models of resource-dependent cities’ transformations and its experience and lessons-take Baishan city’s development of transformations as an example. Energy Procedia 2011, 5, 1626–1630. [Google Scholar]
  64. Wen, J.; Song, Y.; Ren, G. Evaluation on China’s shrinking cities: A calculation based on the prefectural and above cities’ data. Urban Probl. 2019, 38, 4–10. (In Chinese) [Google Scholar]
  65. Gurrutxaga, M. Incorporating the life-course approach into shrinking cities assessment: The uneven geographies of urban population decline. Eur. Plan. Stud. 2020, 28, 732–748. [Google Scholar] [CrossRef]
  66. Wiechmann, T. Errors expected-aligning urban strategy with demographic uncertainty in shrinking cities. Int. Plan. Stud. 2008, 13, 431–446. [Google Scholar] [CrossRef]
  67. Lötscher, L. Shrinking East German cities? Geogr. Pol. 2005, 78, 79–98. [Google Scholar]
  68. Alves, D.; Barreira, A.P.; Guimarães, M.H.; Panagopoulos, T. Historical trajectories of currently shrinking Portuguese cities: A typology of urban shrinkage. Cities 2016, 52, 20–29. [Google Scholar] [CrossRef] [Green Version]
  69. Bartholomae, F.; Nam, C.W.; Schoenberg, A. Urban shrinkage and resurgence in Germany. Urban Stud. 2016, 54, 2701–2718. [Google Scholar] [CrossRef]
  70. Ouyang, W.; Wang, B.; Tian, L. Spatial deprivation of urban public services in migrant enclaves under the context of a rapidly urbanizing China: An evaluation based on suburban Shanghai. Cities 2017, 60, 436–445. [Google Scholar] [CrossRef]
  71. Gascon, M.; Triguero-Mas, M.; Martínez, D. Residential green spaces and mortality: A systematic review. Environ. Int. 2016, 86, 60–67. [Google Scholar] [CrossRef] [Green Version]
  72. Magnani, E. The environmental kuznets curve, environmental protection policy and income distribution. Ecol. Econ. 2000, 32, 431–443. [Google Scholar] [CrossRef]
  73. Tong, Y.; Liu, W.; Li, C. Understanding patterns and multilevel influencing factors of small-town shrinkage in Northeast China. Sustain. Cities Soc. 2021, 68, 102811. [Google Scholar] [CrossRef]
  74. Lu, J.; Li, B.; Li, H. The influence of land finance and public service supply on peri-urbanization: Evidence from the counties in China. Habitat Int. 2019, 92, 102039. [Google Scholar] [CrossRef]
  75. Jia, J.; Guo, Q.; Zhang, J. Fiscal decentralization, and local expenditure policy in China. China Econ. Rev. 2014, 28, 107–122. [Google Scholar] [CrossRef]
  76. Tian, M.; Luo, M.; Wu, Q. Population aging, financial pressure, and expenditure bias of basic public services. Northwest Popul. J. 2021, 42, 103–113. (In Chinese) [Google Scholar]
  77. Li, B.; Li, T.; Yu, M.; Chen, B. Can equalization of public services narrow the regional disparities in China? A spatial econometrics approach. China Econ. Rev. 2017, 44, 67–78. [Google Scholar] [CrossRef]
  78. Tsekeris, T.; Vogiatzoglou, K. Public infrastructure investments and regional specialization: Empirical evidence from Greece. Reg. Sci. Policy Pract. 2014, 45, 265–298. [Google Scholar] [CrossRef]
  79. Murdoch, I.J. Specialized vs. diversified: The role of neighbourhood economies in shrinkage cities. Cities 2018, 75, 30–37. [Google Scholar] [CrossRef]
  80. Kappeler, A.; Välilä, T. Fiscal federalism and the composition of public investment in Europe. Eur. J. Polit. Econ. 2008, 24, 562–570. [Google Scholar] [CrossRef]
  81. Grisorio, M.J.; Prota, F. The short and the long run relationship between fiscal decentralization and public expenditure composition in Italy. Econ. Lett. 2015, 130, 113–116. [Google Scholar] [CrossRef]
  82. Zheng, Z.; Sun, Y. Transfer payments, local financial self-sufficiency, and basic public service provision: Analysis of threshold effects based on provincial panel data. Inq. Into Econ. Issues 2018, 39, 18–27. (In Chinese) [Google Scholar]
  83. Liu, Z.; Liu, S. Urban shrinkage in a developing context: Rethinking China’s present and future trends. Sustain. Cities Soc. 2022, 80, 103779. [Google Scholar] [CrossRef]
  84. Li, H.; Liang, X. Responses of housing price under different directions of population change: Evidence from China’s Rust Belt. Chin. Geogr. Sci. 2022, 32, 405–417. [Google Scholar] [CrossRef]
  85. Wang, Z.; Cao, C.; Chen, J.; Wang, H. Does land finance contraction accelerate urban shrinkage? A study based on 84 key cities in China. J. Urban Plan. Dev. 2020, 146, 4020038. [Google Scholar] [CrossRef]
  86. Zhang, Y.; Fu, Y.; Kong, X.; Zhang, F. Prefecture-level city shrinkage on the regional dimension in China: Spatiotemporal change and internal relations. Sustain. Cities Soc. 2019, 47, 101490. [Google Scholar] [CrossRef]
  87. Li, H.; KevinL, O.; Zhang, P. Population shrinkage in resource-dependent cities in China: Processes, patterns and drivers. Chin. Geogra. Sci. 2020, 30, 1–15. [Google Scholar] [CrossRef] [Green Version]
  88. Yang, Z.; Dunford, M. City shrinkage in China: Scalar processes of urban and hukou population losses. Reg. Stud. 2018, 52, 1111–1121. [Google Scholar] [CrossRef]
  89. Zhao, Z.; Pan, Y.; Zhu, J.; Wu, J.; Zhu, R. The impact of urbanization on the delivery of public Service–Related SDGs in China. Sustain. Cities Soc. 2022, 80, 103776. [Google Scholar] [CrossRef]
  90. Martinez-Fernandez, C.; Wu, C.; Schatz, L.K.; Taira, N.; Vargas-Hernández, J.G. The shrinking mining city: Urban dynamics and contested territory. Int. J. Urban Reg. Res. 2012, 36, 245–260. [Google Scholar] [CrossRef]
  91. Wang, R.; Wang, C.; Zhang, S.; Ding, X. A study on the spatial and temporal evolution of urban shrinkage and its influencing factors from a multidimensional perspective: A case study of resource-based cities in China. PLoS ONE 2021, 16, e0258524. [Google Scholar] [CrossRef]
  92. Long, Y.; Wu, K. Shrinking cities in a rapidly urbanizing China. Environ. Plan. A 2016, 48, 220–222. [Google Scholar] [CrossRef] [Green Version]
  93. Liu, T.; Wang, J. Bringing city size in understanding the permanent settlement intention of rural–urban migrants in China. Popul. Space Place 2020, 26, e2295. [Google Scholar] [CrossRef]
  94. Rodriguez-Pose, A.; Ketterer, T.D. Do local amenities affect the appeal of regions in Europe for migrants? J. Reg. Sci. 2012, 52, 535–561. [Google Scholar] [CrossRef]
  95. Parkins, J.R.; Angell, A.C. Linking social structure, fragmentation, and substance abuse in a resource-based community. Community Work Fam. 2011, 14, 39–55. [Google Scholar] [CrossRef]
  96. Li, W.W.; Yi, P.T.; Zhang, D.N.; Zhou, Y. Assessment of coordinated development between social economy and ecological environment: Case study of resource-based cities in northeastern China. Sustain. Cities Soc. 2020, 59, 102208. [Google Scholar] [CrossRef]
  97. Wang, S.; Jia, M.Y.; Zhou, Y.H.; Fan, F. Impacts of changing urban form on ecological efficiency in China: A comparison between urban agglomerations and administrative areas. J. Environ. Plan. Manag. 2020, 63, 1834–1856. [Google Scholar] [CrossRef]
Figure 1. Study area. Note: produced based on the standard map service website of the Ministry of Natural Resources of China GS (2019) 1822, with no modification of the base map boundary (the same as below).
Sustainability 14 15910 g001
Figure 2. Distribution of shrinking RBCs and changes in shrinkage grade in China: (a) 2000–2010; (b) 2010–2020; (c) 2000–2020.
Sustainability 14 15910 g002
Figure 3. Spatial differentiation of PSL in RBCs in China: (a) 2000; (b) 2010; (c) 2020.
Sustainability 14 15910 g003
Figure 4. The PSLs by different shrinkage grades in 2000, 2010, 2020.
Sustainability 14 15910 g004
Figure 5. The PSLIR in RBCs in China: (a) 2000–2010; (b) 2010–2020; (c) 2000–2020.
Sustainability 14 15910 g005
Figure 6. The pr and PSLIR of different grades in RBCs in China: (a) 2000–2010; (b) 2010–2020; (c) 2000–2020.
Sustainability 14 15910 g006
Figure 7. Scatterplot of pr and PSLIR in RBCs in China: (a) 2000–2010; (b) 2010–2020; (c) 2000–2020.
Sustainability 14 15910 g007
Table 1. Criteria for defining the shrinkage grades in RBCs in China.
Continuous GrowthRelative ShrinkageSlight ShrinkageModerate ShrinkageSignificant Shrinkage
population size
population percent
pr (%)<0<0(0, 10)(10, 20)(20, 30)
Note: the ‘↑’ indicate an increase in the number, the ‘↓’ indicate a decrease in the number.
Table 2. PSL measurement index system in RBCs in China.
Level IndicatorsSecondary IndicatorsWeightProperties
public educationper pupil education expenditure0.1160+
high school student division ratio0.0341
primary student division ratio0.0780
basic medical carehealth technicians per 10,000 persons 0.0868+
physicians per 10,000 persons0.0944+
hospital beds per 10,000 persons 0.1004+
public environmentgreen space per capita 0.0570+
greening coverage rate of urban built-up areas0.0344+
public transportationurban road area per capita 0.0936+
buses per 10,000 persons0.0855+
cabs per 10,000 persons0.1125+
public culturepublic library collections per 100 persons 0.1073+
Table 3. Regression results of factors influencing the PSLs in 112 RBCs.
VariablesModel 1Model 2Model 3Model 4Model 5Model 6Model 7
core variablesShrink0.4806 ***
(0.0849)
0.2202 ***
(0.0363)
0.2134 ***
(0.0356)
0.2061 ***
(0.0342)
0.1841 ***
(0.0328)
0.1652 ***
(0.0356)
0.0906 **
(0.0394)
control variableslnpgdp 0.1231 ***
(0.0052)
0.0948 ***
(0.0125)
0.0848 ***
(0.0123)
0.0554 ***
(0.014)
0.0589 ***
(0.0142)
0.0507 ***
(0.0137)
lnur 0.080 ***
(0.032)
0.0828 ***
(0.0307)
0.0663 **
(0.0293)
0.0661 **
(0.0292)
0.0509 *
(0.028)
lneip −0.0108 ***
(0.0033)
−0.0081 **
(0.0032)
−0.0079 **
(0.0032)
−0.0069 **
(0.003)
lneaw 0.0359 ***
(0.0096)
0.0309 ***
(0.0102)
lnfsr
lnage 0.0693 ***
(0.019)
constantC0.526 ***−0.763 ***−0.783 ***−0.673 ***−0.69 ***−0.61 ***−0.462 ***
adjust R2 0.2030.8680.8740.8840.8960.8970.908
Note: ‘*’, ‘**’, ‘***’ are significant at 0.1, 0.05, and 0.01 levels, respectively; standard errors are in parentheses.
Table 4. Regression results of factors influencing PSL in RBCs with different shrinkage degrees.
VariablesAbsolute GrowthRelative GrowthSlight ShrinkageModerate ShrinkageSignificant Shrinkage
Model1Model 2Model 3Model 4Model 5Model 6Model 7Model 8Model 9Model 10
core variablesshrink−0.8681 ***
(0.1927)
−0.2399 **
(0.1027)
−0.0585−0.1703 *
(0.0899)
1.0505 ***
(0.2268)
0.2302 *
(0.1291)
0.6448 ***
(0.0729)
0.3656 **
(0.1639)
0.5535 ***
(0.106)
control variableslnpgdp 0.081 ***
(0.0178)
0.1441 *
(0.0592)
lnur 0.0926 ***
(0.0261)
0.1902 ***
(0.0347)
lneaw 0.0735 **
(0.0349)
0.0627 *
(0.0344)
lnage 0.1404 ***
(0.037)
lneip 0.015 ***
(0.0233)
−0.0143 **
(0.0064)
−0.0224 *
(0.0081)
lnfsr
constantC0.408 ***−0.2510.501−0.757 ***0.4758 ***−0.583 ***0.498 ***−0.778 ***0.459 ***−0.762 **
adjust R20.6440.787 0.9590.2570.8760.7910.8900.6540.925
Note: ‘*’, ‘**’, ‘***’ are significant at 0.1, 0.05, and 0.01 levels, respectively; standard errors are in parentheses. ‘—’ indicates no participation in the return.
Publisher’s Note: MDPI stays neutral with regard to jurisdictional claims in published maps and institutional affiliations.

