Article

Spatial Structure Evolution and Economic Benefits of Rapidly Expanding the High-Speed Rail Network in Developing Regions: A Case Study in Western China

1
State Key Laboratory of Resources and Environmental Information Systems, Institute of Geographic Sciences and Natural Resources Research, Chinese Academy of Sciences, Beijing 100101, China
2
Jiangsu Center for Collaborative Innovation in Geographical Information Resource Development and Application, Nanjing 225006, China
*
Author to whom correspondence should be addressed.
Sustainability 2022, 14(23), 15914; https://doi.org/10.3390/su142315914
Submission received: 28 October 2022 / Revised: 22 November 2022 / Accepted: 27 November 2022 / Published: 29 November 2022

Abstract

:
High-speed rail (HSR) is an important form of transportation that affects the economic development of the regional spatial structure. However, there is less discussion about the impact of economically underdeveloped regions and the rapid construction of HSR on the region. This study uses a spatial econometric model to explore whether a rapidly formed high-speed rail network with changes in the network structure can bring economic effects based on the spatio-temporal panel data on high-speed rail construction and economic development in western China from 2015 to 2020. First, data of the daily departures between high-speed rail cities were used to analyze the western high-speed rail network’s spatial and temporal evolution characteristics. Second, we analyzed the changes in the centrality, external and internal connectivity, and transfer potential of the economic gap of the western HSR network. Finally, we analyzed the different economic effects of the HSR network structure by combining the Cobb–Douglas production function with the spatial econometric model. The conclusions are as follows: (1) The HSR network in western China is dense at the intra-provincial HSR network; then it expands along the cross-provincial region; and is gradually embedded in the national HSR network, forming a figure-8-shaped spatial structure. (2) In the rapid expansion and densification of the HSR network in western China, connectivity takes precedence, and dominance and control are then increased. The external connectivity of the western HSR city network develops first and shows fluctuating growth, while the internal connectivity improves relatively slowly. (3) The connectivity, convenience of transit, transshipment capacity, and internal and external connection structure of the HSR network all contribute to the economic development of western cities. The transfer potential of economic gaps is detrimental to their economic development but has a positive effect on adjacent cities.

1. Introduction

In 2021, the UIC (the worldwide railway organization) published “Design a better future: Vision of Rail 2030”, which identified railways as the backbone of a sustainable mobility system and noted that high-speed rail traffic will double from its current levels globally, indicating that high-speed rail is still in a high-growth phase [1] and showing that HSR is one of the key modes of regional transport profoundly affecting geographic space and socio-economic activities. The relationship between rapidly expanding high-speed rail and regional development remains the focus of attention in China as a powerhouse in HSR construction and shows significant regional spatial differences in development.
With different development stages and economic bases, HSR has different impacts on regional development [2], and some cities may benefit from it, while others may become impaired [3,4,5]. The spatial evolution of “connecting points into lines” and “connecting lines into networks” between regions along high-speed rail lines has accelerated the transformation of city system structures from hierarchical to a network [6], and the new network pattern has also become an important factor affecting regional economic development.
As a major country in HSR construction, China has built a high density HSR city network in regional city clusters and has completed HSR interconnection between the four major regions of the eastern, central, western, and northeastern regions. Especially under national strategies such as “One Belt and One Road” and “Western Development”, the construction of high-speed rail in western China is gradually gaining attention, thus becoming the core force driving regional development. The position of western cities in the nation’s city network is rising, and this may lead to additional values for some structural functions and network locations and may create a new relationship between HSR and economic development.
In the existing studies of China’s HSR network, scholars have treated city networks as closure networks, mostly focusing on national HSR networks or local city cluster HSR networks. However, little attention has been paid to regional-type HSR networks, and the arrangement of regional networks and the network as a whole has been ignored. Therefore, this study analyzes the development characteristics of the HSR network arrangement and its relationship with economic development from three perspectives: the centrality of HSR cities, the regional internal–external network structure, and economic gap, by focusing on two issues.
(1) How has the structure of the HSR city network evolved during the rapid development of HSR systems in economically underdeveloped regions?
(2) Do the structural attributes of the HSR network have an impact on city economies?
On the one hand, the study analyzes the spatial and temporal evolution characteristics of the development of the provincial network in 2015–2020 in western China in terms of HSR city pairs, provincial connections, and relationships with the national network. On the other hand, the study uses spatial panel data to establish a spatial econometric model to discuss the impact of various network structures on economic development. The main contribution of this paper is to treat the HSR network in western China as a secondary network, emphasize the impact of internal and external connectivity and economic differences between regional networks on the economy, pay attention to the role of the network structure in the study of complex mechanisms of regional development, and provide an important scientific basis for the planning of future regional-type transportation networks.
This study is divided into five parts. Section 2 reviews the relevant literature on the impact of high-speed rail networks on regional economic development. Section 3 presents the current status of HSR network development in western China, the spatial econometric model, the structural indicators in social network analysis (SNA), and the data collection. Section 4 analyzes the spatial and temporal evolution characteristics of the HSR network structure and the results of econometric regressions. Section 5 presents the conclusions and suggestions of this study.

2. Literature Review

In the study of transportation systems, the study of HSR operations is often associated with sustainable development [7]. High-speed rail has been shown to play an important role in environmental, social, and economic sustainability studies. First, HSR has been shown to contribute to social sustainability studies by expanding employment, accelerating population mobility [8] and eliminating social disparities [9], and changing land prices [10]. Secondly, in studies of the ecological environment [11,12], it is mainly reflected as a method of low-carbon travel, and HSR can reduce the pressure on ecological environment and improve the overall quality of the ecological environment. There are also some studies that confirm the effectiveness of HSR in reducing air pollution [13]. Finally, studies on the role of HSR in economic sustainability are focused on two aspects, one is whether it can lead to regional economic growth, and the other is the alleviation of economic spatial disparities. In the theory of sustainable development, economic sustainability is the most comprehensive and important manifestation, so this study focuses on examining the impact of HSR on sustainable economic development.
First, there is controversy about whether the construction of high-speed rail systems will bring economic benefits, with some scholars arguing that high-speed rail will help regional economic development, and others arguing that it will not. Studies have shown that the opening of high-speed rail systems also changes the spatial patterns of the region, generating locational advantages and enhancing the competitiveness and economic growth of cities with high-speed rail systems [14]. It is believed that high-speed rail systems change accessibility and connectivity, accelerating factor mobility between cities, compressing transportation costs, and thus generating economic effects [15,16,17,18]; however, it is still controversial in academia whether the economic effects of opening a high-speed rail system are positive. Most studies emphasize that HSR construction can promote economic growth [19,20]. By examining the economic effects of HSR systems in Italy [21] and German high-speed rail systems [22], quantitative analysis confirmed that HSR operations also contribute to the economic development of the cities or counties where they stop. Some studies suggest that HSR systems have a disincentive effect, arguing that the region between two HSR cities has relatively low gains and a negative geographical cohesion impact [23]. These different findings are not only influenced by the agglomeration or dispersion effects of HSR systems but also stem from the different HSR construction stages. It often takes 10 years or more for HSR cities to go through the stages of planning, construction, and operation. In different stages of development, the spatial and economic benefits of high-speed rail cities are also different [24]. In the review of HSR-related studies, it is emphasized that the impact of HSR systems on regional development must pay attention to both short-term and long-term effects. Therefore, most of the studies on the effects of HSR have undertaken long-term dynamic tests, confirming that HSR cities gain different benefits in regional development, services, and tourism at different stages of HSR construction projects [25,26,27,28].
Second, established studies have confirmed that HSR systems have a positive economic effect at the national or large regional levels and that the opening of HSR systems has a positive economic benefit for cities [29,30]. In studies of regional economic integration, high-speed rail systems are able to generate the decentralization of economic geographic distribution by changing accessibility, which, in turn, leads to a polarized scenario of regional development [31,32,33]. Economic activities are clustered from distant areas to the core through changes in accessibility and are dispersed, from the core to the periphery [34,35]. Most studies confirm that HSR systems only bring more lucrative economic benefits to economically prosperous regions [36,37,38,39]. In an analysis of the HSR systems running through China and Northwest Europe, it was confirmed that regions or metropolitan areas in the core city clusters gain higher economic benefits from the HSR network, while other regions do not benefit significantly. The difference in the study population is the reason for the contradictory findings in studies on the effects of HSR systems on city economic development of cities [40].
Thirdly, the number of cities with HSR stations is gradually increasing, and the HSR network is gradually developing from a single line to a mature network. The structure of the HSR network is considered to be a factor that is conducive to attracting economic activities [41,42,43,44]. However, its positive impact may be reduced according to the law of diminishing marginal returns [45,46,47,48]. The network structure characteristics of HSR city networks have become a factor to change the location conditions of cities, including the topological structure, hierarchical structure, and spatial structure of HSR network [49,50,51,52,53]. In recent years, China has formed a large-scale HSR network, and the network structure characteristics such as network density [54], accessibility, and connectivity [55] have changed significantly, which has greatly affected the economic development of cities and neighboring cities [56,57]. In addition to centrality, Xie et al. [58] explored the social network analysis model in depth and analyzed the hierarchical location of HSR cities using the non-Markov high-order model and multi-layer network analysis method.
Finally, in addition to the impact of HSR operations on sustainable economic development, areas with a new HSR station also have a role to play in sustainable development. There are three different ways of conceptualizing HSR station area projects: “property capitalization”, “urban mega-projects”, and “transit-oriented development”.
The cases of London’s St. Pancras and Paris’ Gare du Nord stations are symbolic. These two stations have been the arenas for large-scale operations: St. Pancras’ transformation boosted the renewal of the entire King’s Crossroad area; in Paris, the dismantling of a parking lot near Gare du Nord was the first phase for the entire area redevelopment of the entire area [59]. These buildings were renovated and given a central role in their countries as developers of the high-speed railway systems in Europe [60]. Many authors have identified the impact of stations on cities from an economic perspective and as an attractive location for service industries. On the other hand, the transfer of industrial activities away from stations and towards other locations freed up space for urban development, which represented one of the negative changes brought by such redevelopments.
The fact that many railway lands have been demolished to create quality spatial areas for competitive economic claims should also be noted. An example of this is the case of Bilbao’s Ametzola ancient railway station urban regeneration project [61], which was characterized by the complete privatization of the 11 hectares of railway facilities to be transformed into housing and commercial services, with the aim of obtaining a first capital serving as a trigger mechanism to continue intervening in that territory with similar operations. By creating segregation, all of these new areas of centrality have been drivers of injustice and urban inequality. This clear prevalence of interest in the real estate system for the need for urban development can be found in many other projects in Europe, especially when they concern railway stations.
Existing studies have confirmed the correlation between high-speed rail systems and regional economic development, which are mostly concentrated in economically developed areas, and do not pay enough attention to areas with relatively small economic scales. The mechanism of economic impact of high-speed rail systems is of great significance to the construction of HSR networks in economically underdeveloped areas. In addition, previous studies on HSR city networks mostly focused on the national network or a specific urban agglomeration, with few studies on the economic impact of large regional network structure. Therefore, this paper regards the HSR network in western China as the study area and analyzes the changing trend of the HSR network structure from 2015 to 2020. At the same time, the network status of node cities, the structure of internal and external connections, and the poor economic potential of external networks are incorporated into the analytical framework of this study, and a spatial econometric model is used to explore the relationship between the HSR network structure and economic development in western China.

3. Methodology and Data

3.1. Study Area

In China, high-speed railroads include D-series, G-series, and C-series trains. The fastest speed of C-series and G-series high-speed rail systems is 400 km/h and the average speed is around 300 km/h, while the fastest speed of D-series trains is 250 km/h and the average operating speed is around 150 km/h. According to the “High-speed Railway Design Code” document issued by the State Railway Administration of China, a speed of 250 km/h (inclusive) to 350 km/h (inclusive) is the standard for high-speed rail lines. Therefore, this study considers the G- and C-series of high-speed trains as HSR flows.
The construction of G-series and C-series trains initially focused on the central and eastern coastal areas, while the construction of high-speed railways in western China started later. After 2015, the focus of China’s high-speed rail construction gradually shifted to the west, and the western high-speed railways established effective connections with the main axis and channels of the national HSR network, so this paper takes 2015 as the initial year of the study.
The study area is northwestern and southwestern China, and the high-speed railway lines and cities with high-speed railway stations in the region are used as samples for the study. The high-speed rail lines cover eight provinces and 98 prefecture-level cities (or autonomous prefectures) in the region, of which 55 of the prefecture-level cities (or autonomous prefectures) have high-speed rail stations, with a high-speed railway coverage rate of 56%. It should be noted that Tibet and Qinghai have no G-series or C-series high-speed rail lines, while Xinjiang and Ningxia are connected to other western provinces through high-speed railways, with G-series and C-series high-speed railways only existing within the provincial boundaries during the study time. The spatial distribution of the high-speed railway lines and the 55 high-speed railway station cities is shown in Figure 1.

3.2. Methods

3.2.1. Spatial Econometric Methods

Existing studies embed spatial econometric ideas into economic regression models to constitute spatial econometric models to study regional economic growth [62,63,64,65]. This study uses spatial econometric models to determine the spillover effects of HSR. Commonly used spatial econometric models include the spatial autoregressive model (SAR), the spatial error model (SEM), and the spatial Durbin model (SDM). Among them, the SAR model considers the spatial autocorrelation of the dependent variable, SEM considers the spatial correlation of the error term, and SDM is more general in spatial econometrics. SDM and SAR models take into account direct and indirect impacts, which can analyze the relationship between high-speed rail operation and economic development more accurately. This study uses the econometric orders and spatial econometric models (SDM, SAR) provided by Stata software to estimate spatial econometric principles and practices [66].
The SDM model can be expressed as follows:
Y i t = r j = 1 n W i j y j t + α + β l n X i t + θ j = 1 n W i j X j t + λ i + μ i + ε i t
The SAR model can be expressed as follows:
Y i t = r j = 1 n W i j y j t + α + β X i t + λ i + μ i + ε i t
where Y i t is gross domestic product (GDP) of city i in period t ; r is the spatial effect coefficient, and W i j is the spatial weight matrix; α is the constant term; β is the parameter of X i t ; θ is the coefficient of the spatial spillover effect of the variables; and λ i and μ i are the time fixed effects and individual fixed effects; and ε i t is the residuals.
The elements of W i j are shown in the equation below:
W i j = { 1 , i j 0 , i = j
If a high-speed rail line exists between city i and city j, then Wij is 1, otherwise, it is 0.
The Cobb–Douglas production function [67] is an economic and mathematical model used to predict the production of countries and regions and to analyze methods of developing production and is one of the most widely used forms of production functions in economics [68,69,70]. Based on the Cobb–Douglas production function, the spatial econometric model was constructed by adding the structural element (H) of the HSR network, which can be expressed as
Y t = H t K t β 1 L t β 2 R D t β 3
The model is simplified after taking logarithms of both sides simultaneously as
l n Y t = β 1 l n H t + β 2 l n K t + β 3 l n L t + β 4 l n R D t + ε
where Y t is gross domestic product (GDP) in period t . H t represents the structural factors for the HSR network in period t . K t is the capital stock in period t. L t is the amount of labor input in period t. R D t is the research and development expenditure; β 1 ~ β 4 denote the corresponding parameters of each variable.
The production functions were brought into the SDM model and SAR model, and the expressions are as follows:
S D M : l n Y i t = r j = 1 n W i j l n y j t + α + ( β 1 H t + β 2 l n K t + β 3 l n L t + β 4 l n R D t ) + θ 1 j = 1 n W i j H t + θ 2 j = 1 n W i j l n K t + θ 3 j = 1 n W i j l n L t + θ 4 j = 1 n W i j l n R D t + λ i + μ i + ε i t
S A R : l n Y i t = r j = 1 n W i j l n y j t + α + ( β 1 H t + β 2 l n K t + β 3 l n L A t + β 4 l n R D t ) + λ i + μ i + ε i t
where Y i t is gross domestic product (GDP) of city i in period t; r represents the effects of neighboring cities’ economic growth, W i j is the spatial weight matrix; and α is the constant term. θ is the corresponding coefficient of spatial spillover effect, coefficient θ 1 measures the spatial spillover effect of the structural factor of the HSR network on the economic growth. θ 2 ~ θ 4 are the spatial spillover effect of other control variables (e.g., capital, technology, labor) on economic growth. β 1 ~ β 4 are the corresponding parameters of each variable. λ i and μ i are time and individual fixed effects, and ε i t is the residuals.

3.2.2. Social Network Analysis

Social network analysis is an important method for regional spatial structure analysis. Therefore, this paper analyzes the spatial evolution of western HSR city networks by using the HSR flows to denote the social relationships between cities. The study measures the structure of HSR city network with centrality and the connection structure in social networks as important indicators.
  • Weight degree centrality
Weight degree centrality is used to measure the possibility of links between cities and other cities in the network [49], and this paper uses weight degree centrality to measure the connectivity. The formula is as follows:
D i = j n a i j
S i = j n w i j
W D C i = D i α * ( s i D i ) ( 1 α )
where: D i is the degree value of city i; aij indicates whether the cities are directly connected with each other by HSR, with a value is 1 if they are, and 0 if they are not; Si indicates the value of the HSR operation level of city i; wij indicates the number of trains operating between cities; α is the assignment parameter, and a value of 0.5 is used in the study. WDCi indicates the weighted degree centrality of city i, and the larger the value, the stronger the city’s interaction ability, and its influence in the HSR network.
  • Closeness centrality
Closeness centrality directly relates to the geodesic distance or the cardinality of the shortest path between two actors. Although many studies have used proximity centrality as a measure of accessibility [71], this paper argues that for node cities in a network, closeness centrality is a measure of the convenience of transit between cities, and explains the ability of cities to transport elements in the network to some extent using the following formula:
C C i = n 1 j 1 n d ( i , j )
where C C i is the closeness centrality of city i; d(i,j) is the frequency of high speed rail between city i and j; and n is the number of HSR cities in the network. In the HSR network, greater closeness centrality means that the city is more convenient to other cities, and that the convenience of transit is stronger.
  • Betweeness centrality
Betweeness centrality depicts the position of an actor in the network, and it can control the other two actors that do not have a direct connection between them. This study uses betweeness centrality to measure the transshipment capacity of HSR cities [72], which is the ability to control the flow of high-speed rail. The formula is as follows:
B C i = j < k P j k ( i ) P j k
where B C i is the betweeness centrality of city i. P j k is the number of direct high-speed trains between city j and city k, and P j k ( i ) denotes the number of HSR connections between city j and city k, which pass through city i. The greater the betweeness centrality of high-speed rail cities, the higher the status of HSR cities in the network, and the stronger the hub role of cities.
  • External and internal connectivity
Both the location of a city in the regional network and the structure of connections outside the region can determine its development. It was only after the formation of a more mature network of HSR cities in eastern and central China that the HSR network in western China began to expand and participate in the national HSR network. Therefore, the participation of western HSR cities in the national HSR city network also affects the development of western HSR cities. The product of the daily traffic volume of western HSR cities and non-western HSR cities is used to measure the embeddedness of western HSR cities in the national HSR network. The formula is as follows:
E C i = l n j = 1 n H S R i j × j = 1 n δ i j
I C i = l n j = 1 n H S R i j × j = 1 n σ i j
where E C i represents the sum of connections between city i and non-western HSR cities. I C i represents the sum of connections between city i and HSR cities in the western region. H S R i j is the daily frequency of high-speed rail connection between city i and city j. δ i j and σ i j are both binary variables. If city i is the HSR city in the west, city j is a city in the west, and there is a high-speed rail between city i and city j, then δ i j   = 1, otherwise δ i j   = 0. If city i and city j are both HSR cities in the west, and there is a high-speed rail between city i and city j, then σ i j   = 1, otherwise σ i j   = 0. The larger the value of E C i , the deeper the embedding in the national HSR network, and vice versa. This means that the city does not participate in the national HSR network. The larger the value of I C i , the deeper the degree of embedding into the intra-regional HSR network.
  • Transfer potential of economic gap
The economic gap between western and non-western HSR cities in relation to HSR flows is also a potential source of economic vitality. For cities in economically underdeveloped areas, establishing a reasonable-scale connection with the target city can promote the city to benefit from economic development. Therefore, this study takes the connections between HSR cities in western China and the HSR networks of other economically developed regions as an independent variable and discusses the impact of the regional association structure on city economic development of the city.
T P i = j = 1 n ( M j M i ) H S R i j
where T P i represents the transfer potential of the economic gap between the HSR city pairs of city i; Mj is the per capita GDP of city j; city j is the city with direct high-speed rail access to city i; Mi is the per capita GDP of city i; and HSRij is the number of daily HSR trains between city i and city j.

3.3. Data Description

The socioeconomic variables in the study, such as the city’s GDP, employed population, fixed asset investment, and research and development (R&D), were obtained from the China Regional Economic Statistical Yearbook (2016–2021), the China Urban Statistical Yearbook (2016–2021), and the corresponding provincial statistical yearbooks.
Basic geographical data such as high-speed rail lines and administrative division vector maps were mainly taken from the National Earth System Science Data Center (http://www.geodata.cn/) (accessed on 29 October 2021). The number of daily high-speed trains from the HSR city and the number of high-speed trains between city pairs were calculated according to the national railway passenger train timetable provided by China Railway (http://www.12306.cn) (accessed on 15 April 2020). The annotations of dependent variables, mechanism variables, control variables, and the related panel statistics are summarized in Table 1.

4. Result

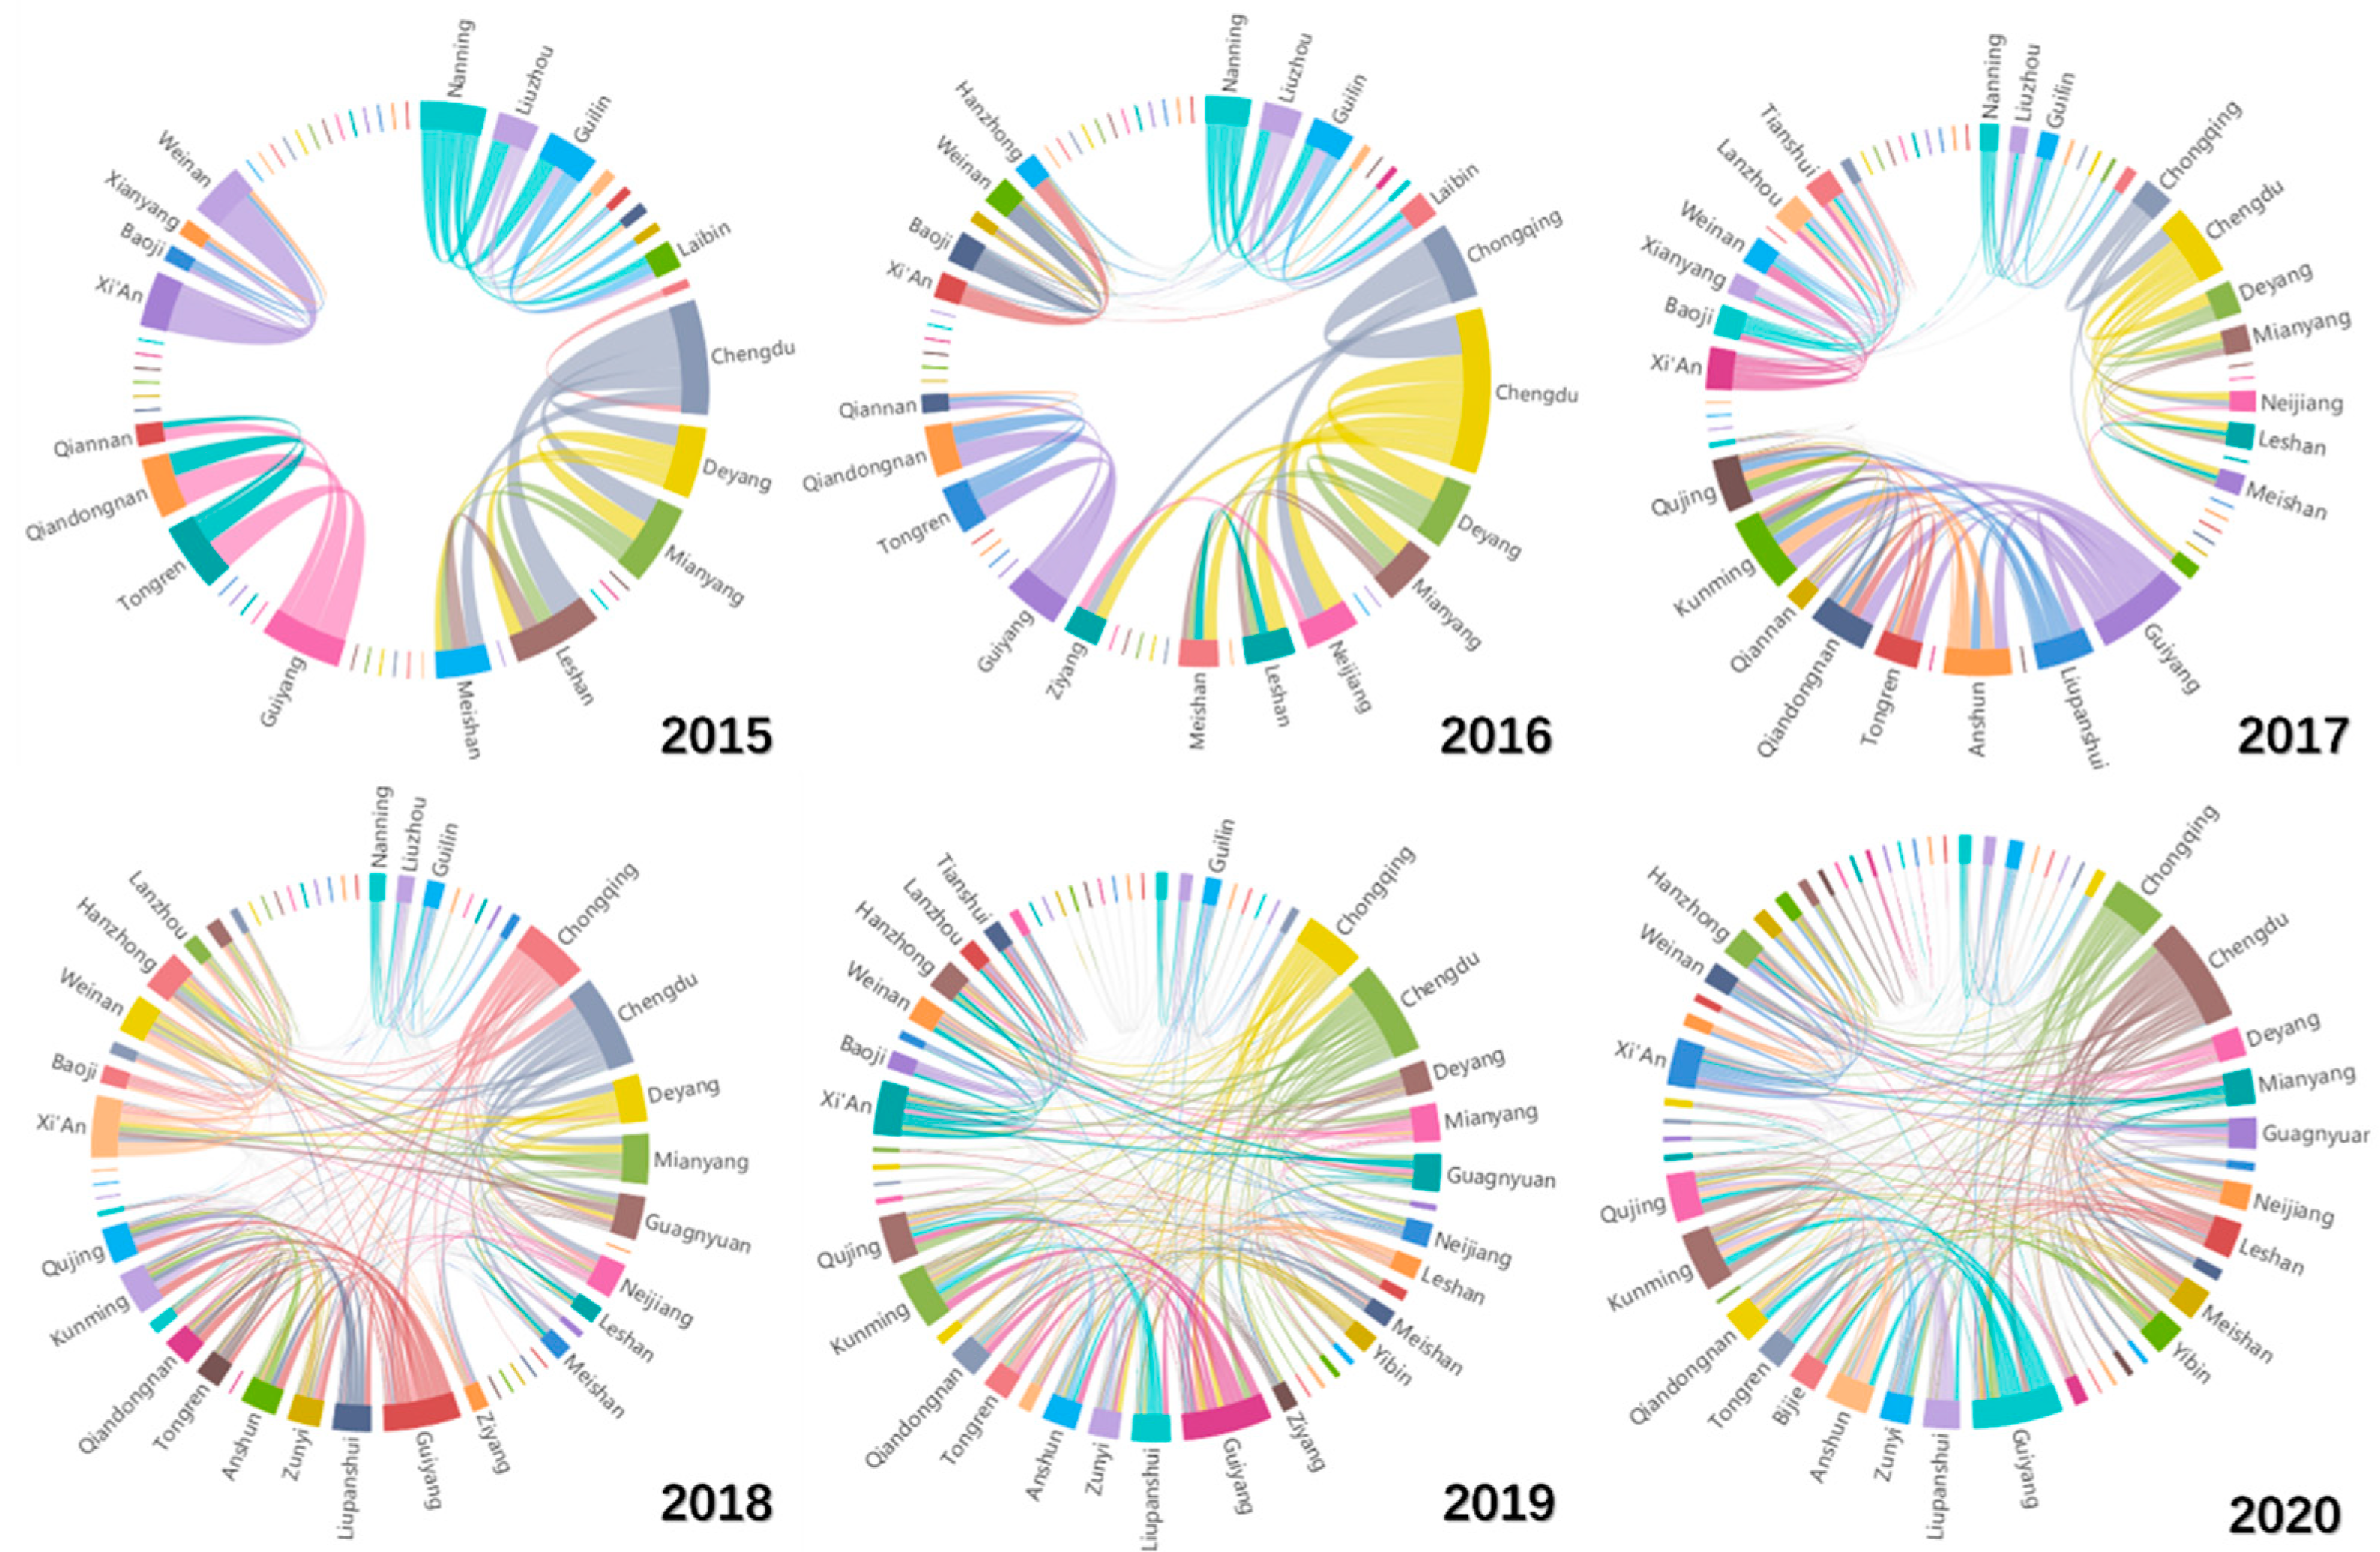
4.1. Spatial and Temporal Evolution of HSR Network in Western China

The spatial and temporal evolution characteristics of the daily frequency of high-speed rail travel in western China are shown in Figure 2. The size of each circle represents the highest daily frequency of high-speed rail connection in cities, and the different colors represent the proportion of the current year’s daily frequency of high-speed rail connection to the highest frequency of daily high-speed rail connection during the study period. In 2015, the daily frequency of HSR cities in western China were all less than 50 trains per day, and the city pairs with high-speed rail frequencies of more than 10 trips per day only existed between provincial capital cities and surrounding cities. The daily high-speed rail frequency of the rest of the western HSR cities was relatively low. In 2020, there was a breakthrough in these figures. In 2020, there were more than 400 high-speed trains in western cities, representing the highest daily frequency (e.g., Chengdu), and there were more than 50 daily trains between city pairs. The level of high-speed rail operation in western cities has improved significantly, the western HSR network has gradually improved, important node cities in the west are open to traffic, and the frequency of traffic has increased significantly.
The establishment of an HSR network mainly relies on the daily frequency of high-speed rail travel between city pairs, so the spatio-temporal evolution characteristics of city pair connections are the basis for studying HSR city networks. Figure 3 depicts the changes in the HSR network in western China from 2015 to 2020. Specifically, in 2015, the number of HSR cities in the western region was small, with few inter-provincial connections, and almost no cross-provincial high-speed rail service was open to traffic. In 2016, the number of HSR cities increased, and an increase in HSR connections within the provinces, and the barriers between the high-speed rail network in the northwest region and the southwest region were broken for the first time. In 2017, the number of HSR cities continued to increase, and the inter-provincial HSR network developed intensively. At the same time, high-speed rail lines across provinces began to develop, mainly connecting adjacent provinces in the northwest and southwest. In 2018, the number of HSR cities in the west stabilized, the trend of HSR network densification became more pronounced, and connections between provinces were established. There are differences in the operation of high-speed rail systems within the inter-provincial regions. Southwest region, such as Sichuan, Chongqing, and other regions, have higher connections than other regions. In 2019 and 2020, the number of HSR cities and the HSR network within the inter-provincial region both stabilized, and the difference in the internal network of the province itself narrowed. The expansion of the HSR network in the northwest region, especially in Xinjiang and Ningxia, is limited to its provincial network.
As a regional network, the connectivity structure of the western HSR city network with the rest of the network is also one of the most important factors affecting the development of the network. Figure 4 shows the spatial evolution characteristics of HSR flows between western and non-western regions from the provincial level. From 2015 to 2016, the construction of high-speed rail systems in the western region was in the initial stage of development. The regional network has few external connections, mainly relying on the two hubs of Xi’an and Guiyang to establish connections with neighboring provinces, and has not been integrated into the national HSR network. From 2017 to 2018, more western cities joined the national HSR network to strengthen connections with central hub provinces. From 2019 to 2020, the east–west and north–south connections of the western HSR network were strengthened. During this period, the external connections of the western cities broke the limitation of spatial proximity, and the cross-regional connections increased. As of 2020, the HSR network in the west has been integrated into the national HSR network and has close connections with most of the eastern, northern, and central provinces. The external connections will eventually take the shape of a number 8.

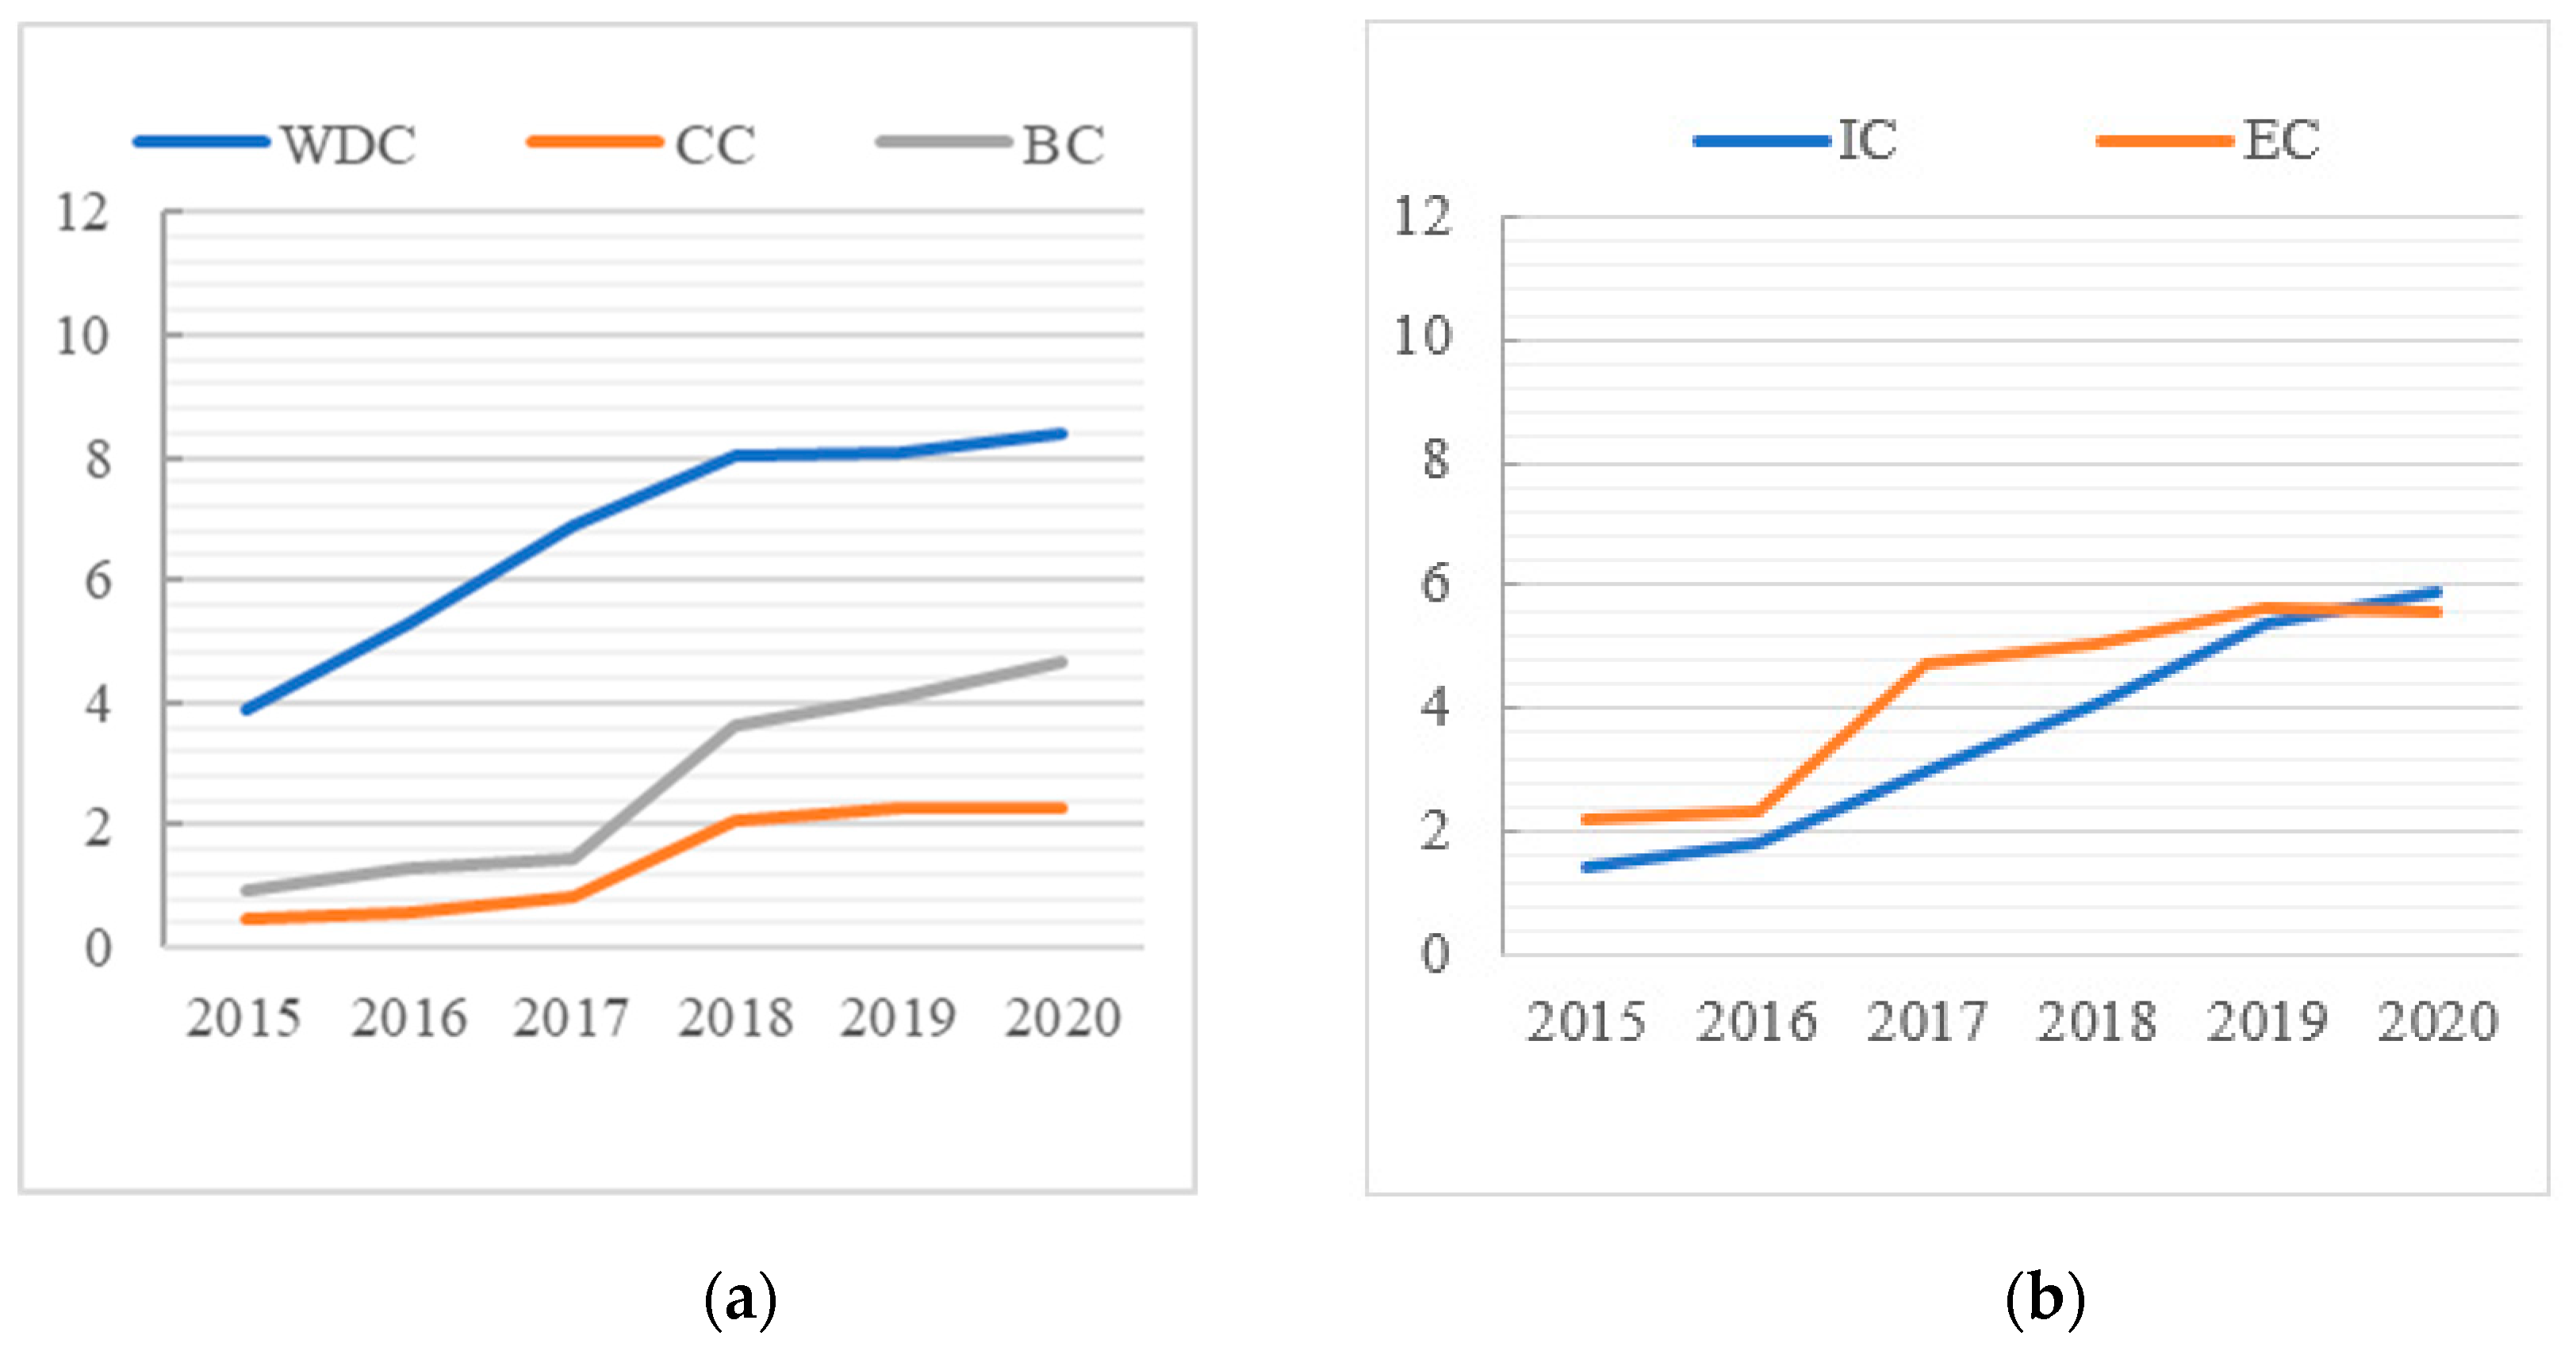
4.2. Structural Characteristics of the HSR Network in Western China

The previous section analyzed the spatio-temporal evolution characteristics of the western HSR network based on the HSR flows between city pairs. This section analyzes the evolutionary characteristics of the network structure variables from a regional network perspective, as shown in Figure 5. Figure 5 shows the mean values of each variable for all HSR cities in the west during the year.
Figure 5a depicts the change in the average centrality of the western HSR city network. The WDC has risen, indicating that the HSR flows between cities in the west are becoming closer, and more cities are participating in the construction of the HSR network in the west. BC and CC showed similar trends, and the development of the HSR network improved the convenience of transit in the city as well as the transshipment capacity of the HSR system. Comparing the trends of WDC, BC, and CC, the growth rate of WDC first accelerated and then slowed down, while the growth rates of BC and CC were low at first and then accelerated. The connectivity of the western transport network is given priority over the development of transit convenience and transshipment capacity. This shows that after the traffic network is densely connected, the network’s ability to control the flow of elements becomes prominent.
Simultaneously, this study compares the trends of internal and external connectivity in the western HSR network, as shown in Figure 5b. Both internal and external connectivity have increased, with the value of external connectivity is consistently greater than that of internal connectivity until 2019, and with internal connectivity exceeding external connectivity after 2019. The volatile growth of external connectivity is influenced by the development of high-speed rail lines in the target cities. In the pre-development of the western HSR network, the HSR cities in the west are located along the extension of the national HSR lines. Their development is more influenced by external target cities, with internal network connectivity starting to develop after the external connectivity stabilizes.
As shown in Figure 6, before 2018, the value of the transfer potential of the economic gap was higher than that of the economic gap. As mentioned in Section 4.1, during the early stages of construction on the western high-speed rail network, the provincial division in the internal network is obvious, and the western high-speed rail cities are located along the edges of the national high-speed rail network. Therefore, the economic gap between the western cities and target cities will be expanded during the initial stages of high-speed rail operation.

4.3. Economic Effect of the HSR Network Structure

In this section, network structural factors are used as mechanism variables and economic and social development factors are used as control variables in a spatial econometric model to discuss the impact of the network structure on regional economic development.
First, we included the network structure factors into the spatial econometric model of economic growth separately and performed LM tests with Moran’s I, Lagrange multipliers, and robust Lagrange multipliers to determine whether to use the spatial econometric estimation model or not, and the test results are shown in Table 2. All of the model hypotheses are rejected, indicating that the relationship between the structural factors of the HSR network and the city economy can be analyzed using the spatial econometric model.
Secondly, the HSR network’s structural factors were incorporated into the economic growth model one by one and a suitable spatial econometric model was selected for estimation. The likelihood ratio (LR) and Wald test were applied to determine the choice of SDM, SLM, or SEM, and the Hausman test was used to determine whether the model uses fixed effects or random effects. The test results are shown in Table 3. It should be noted here that, limited by the size of the sample size, the LR test and Wald test results are inconsistent when different structural factors are included in the model [73]. The basis of selection when the Wald test and LR test are inconsistent is discussed. Despite the rapid development of HSR in the west in recent years, the overall number of cities is not large, and this study only includes a small sample size, and the LR test and LM test can be used to select the model of the spatial influence mechanism.
The results in Table 3 show that LR_spatial_lag for the WDC, CC, BC, and IC structural indicators did not pass the test and could not reject the original hypothesis, and that the LR_spatial_error passed the test and rejected the original hypothesis. Both were estimated using the SAR model. The LR_spatial_lag and LR_spatial_error of EC and TP both reject the original hypothesis, so the SDM model is used for estimation. The last column of Table 4 shows the results using the Hausman test with all factors using fixed effects.
Table 4 shows the results of estimating the different network structure factors by incorporating them into the appropriate spatial econometric models separately, as well as the spatial and temporal fixed effects. The results show that only EC and TP passed the SDM model test, and WDC, CC, BC, and IC passed the SAR model test. All R-sq values above 0.8 indicate that the model can explain the relationship between the mechanism variable and the dependent variable. All of the network structure factors passed the significance test after being included in the appropriate models separately, indicating that all of the network structure factors are significantly correlated with GDP. The main coefficient indicates the main effect of the independent variable on the GDP. The Wx coefficient is only present in the SDM model and indicates the spatial spillover effect of the independent variable on the dependent variable.
In addition, Table 4 presents the direct, indirect, and total effects of structural factors on economic growth. The direct effect refers to the effect of changing the explanatory variables of a spatial unit on the dependent variable of that spatial unit. Indirect effects can also be understood as spillover effects, i.e., the effect of changing the explanatory variables in one spatial cell and the effect of changes in the dependent variables in other spatial cells.
The results show that the trends of the specific effects of network centrality on city economies are consistent for WDC, CC, and BC, with all of the direct effects being positive and all of the indirect effects being negative, and all are significant. In a fast-growing network, the connection structure of the city itself is beneficial to economic growth, while the improvement of the network structure of adjacent cities has an adverse impact on economic development.
The direct effects of WDC, CC, and BC are positive, indicating that the centrality of the network can promote economic growth. Their indirect effects are negative, indicating that HSR cities have a negative impact on the economic development of neighboring cities. In the economically underdeveloped western region, the influence of the city network structure can enhance its control over resources and industries, which will lead to competition between neighboring HSR cities and neighboring cities, which is detrimental to the development of neighboring regions. A comparison of the three types of centralities shows that each coefficient of BC is the largest, indicating that when the network grows rapidly in a short period of time, the value of betweeness centrality is the largest, and the transit capacity of the city has the strongest effect on economic development.
Comparing IC and EC, their main coefficients and direct effects are positive and indirect effects are negative. Whether the target city is inside or outside the west, the impact on the adjacent cities is detrimental to their economic development. EC is more suitable for the SDM model, indicating that there is a spatial spillover effect of EC on economic growth, and it is negative, indicating that the external connection structure does not lead to the common prosperity of the rest of the adjacent cities through spatial spillover.
Unlike other variables, the direct effect of TP is negative and the indirect effect is positive. This indicates that the effect of the transfer potential of the economic gap on adjacent cities cannot result in economic growth, but instead has positive effects on the economic development of adjacent cities. In addition, TP, similar to the EC variable, fits into the SDM model in terms of spatial spillover effects but has a different trend than EC. In addition, TP is consistent with the spatial spillover effect of the SDM model, similar to the EC variable, but its trend is different from EC. The Wx coefficient of TP is positive. This indicates that although the economic effect of the spatial spillover of the external connection structure is negative, the establishment of a reasonable transfer potential for the economic gap with the target city will produce a positive spatial spillover effect.
To sum up, this study analyzes the rapid development of the HSR network in western China from 2015 to 2020. The three types of centralities of the HSR network and the internal and external network structure of the HSR network in the west all promote economic development. Among them, the influence of betweeness centrality and regional external connection structure is relatively strong. The transfer potential of the economic gap is not conducive to economic development but has a positive impact on adjacent cities.

5. Conclusions

In this paper, we measured the frequency of HSR city access, the evolutionary characteristics of network centrality, and the structure of the connections within and outside the region. It also focuses on the economic impact of the gradual improvement of the western high-speed rail network on the less economically developed regions, allowing us to draw the following conclusions, which can provide insights into the economic development of cities and high-speed rail planning.
(1) The rapidly formed HSR network first developed from provincial scale densification and then cross-provincial regional expansion before gradually being embedded into the national HSR network, and the development of the transportation network is still influenced by spatial proximity and administrative unit setting.
(2) Different network centralities of HSR networks have different growth trends in the process of rapid expansion and densification, in which connectivity takes priority and dominance and control are subsequently enhanced. All three types of centrality contribute to the economic development of western cities.
(3) From the national level, the role of high-speed rail connections between economically underdeveloped regions and external regions is more obvious for the economic development of cities in underdeveloped regions, and there is profound economic complementarity between economically underdeveloped regions and other regions, and this economic gap can negatively affect the development of less economically developed regions, but can positively affect the surrounding areas.

6. Discussion and Suggestion

6.1. Discussion

First, Rafael Boix et al. [74] confirmed that city network structure and agglomeration economies are equally important factors for sustainable economic development and argued that agglomeration effects are more important for sustainable urban development and did not discuss city network structure in depth. This study argues that in the research paradigm of city networks, cities are not isolated points, but are connected to other cities. The competitive and cooperative relationships between cities can generate advantages in inter-city communication, and more attention should be paid to the discussion of network structure. This study distinguishes the functions of centrality of urban networks and discusses the differences in their development trends, arguing that the connectivity of urban networks plays a priority role in sustainable economic development over control and dominance.
Second, the main contribution of this paper is to not only confirm the benefits of the HSR network structure and the network status of cities to cities, but also to explore the mechanisms of intra-regional connectivity and participation in the global network connectivity structure for sustainable economic development. Most studies have focused on the national level or on a specific city agglomeration, and there is a lack of studies that address HSR networks that include multiple provincial regions [35,37,43]. Liu et al. [75] discuss the impact of network structure on sustainable economic development at the national level and confirm in their study that different regional network structures have different effects on economic development, but are limited to cross-sectional comparisons between individual regions. This study confirms that as secondary networks, regional transportation networks as secondary networks differ in their internal and external structures for the sustainable development of their own regional economies, arguing that the external linkage tightness makes a positive and significant contribution to economically underdeveloped regions.
Finally, the answer to the relationship between HSR systems and the economy is complex and depends on the scale of the studied region and its economic conditions. Previous studies have concluded that most of the cities benefiting most from HSR systems in China are located in the eastern coastal regions and in the core city cluster area [37]. This study focuses on the central and western regional HSR networks and argues that the formation of HSR networks in economically underdeveloped regions can still promote the economic effect of developing regions. Other studies have suggested that HSR can boost the economies of cities or regions with higher levels of economic development while widening the regional economic gap [76,77]. Building on previous studies, this study confirms that economic disparities between regions coupled with a close HSR connection can have a negative impact on the development of less economically developed regions, but a positive impact on neighboring regions.
Although the above findings are innovative in analyzing the impact of the HSR city network structure on economic development, there are certain limitations in future studies. In this paper, only GDP is considered as a proxy variable for economic sustainability, from which the comprehensive indicators to measure urban sustainable development are ignored. Regional sustainable development should include the ecological environment and social development, which will be discussed in depth in future studies.

6.2. Suggestion

Based on the findings of the present study, the recommendations for HSR planning in western HSR cities are as follows:
First, the network structure of HSR cities is one of the elements to promote regional development. Therefore, in new HSR cities, the network layout should pay attention to the functionality of the network structure and should reasonably arrange the inter-city HSR schedules to promote the network location advantages for all the cities within the region and to thus promote development.
Second, according to the analysis of the impact of the internal and external connection structure on economic development, the external connection structure has a greater role in promoting regional development. Therefore, based on the dense development of the western HSR network, emphasis is placed on establishing wider connectivity with the central and eastern regions of the region to gain more resources for redevelopment.
Third, since the transfer potential of the economic gap with non-western cities can negatively affect their economic development, the planning of high-speed rail connections should balance the economic impact of the HSR network structure on itself and the surrounding region.

Author Contributions

Conceptualization and methodology, B.Y. and Y.Y.; software, B.Y.; validation and formal analysis, B.Y.; investigation and resources, B.Y. and Y.L.; data curation, B.Y. writing—original draft preparation, B.Y.; writing—review and editing, B.Y., Y.L. and X.Y.; visualization, B.Y.; supervision, Y.Y. and X.Y.; project administration, Y.Y. and X.Y.; funding acquisition, Y.Y. All authors have read and agreed to the published version of the manuscript.

Funding

This research was funded by “Special Program of Network Security and Informatization of the Chinese Academy of Sciences”, grant number (CAS-WX2021SF-0106-03); “Second Tibetan Plateau Scientific Expedition and Research Program”, grant number (2019QZKK09); “National Natural Science Foundation of China under Grant”, grant number (42101475), “Geographic Resources and Ecology Knowledge Service System of the China Knowledge Center for Engineering Sciences and Technology”, grant number (CKCEST-2022-1-33), “National Earth System Science Data Center”, grant site (http://www.geodata.cn/, accessed on 26 June 2022).

Institutional Review Board Statement

Not applicable.

Informed Consent Statement

Not applicable.

Data Availability Statement

The processed data required to reproduce these findings cannot be shared at this time as the data also forms part of an ongoing study.

Acknowledgments

We are grateful to Wang Jiao’e and Postdoctoral Fellow Xia Bing for their constructive comments, which greatly improved this study.

Conflicts of Interest

The authors declare no conflict of interest.

References

  1. UIC Design a Better Future: Vision of Rail 2030. Available online: https://uic.org/IMG/pdf/uic-design-a-better-future-vision-of-rail-2030.pdf (accessed on 26 June 2022).
  2. Chen, C.-L.; Hall, P. The wider spatial-economic impacts of high-speed trains: A comparative case study of Manchester and Lille sub-regions. J. Transp. Geogr. 2012, 24, 89–110. [Google Scholar] [CrossRef]
  3. Jiao, J.; Wang, J.; Jin, F. Impacts of high-speed rail lines on the city network in China. J. Transp. Geogr. 2017, 60, 257–266. [Google Scholar] [CrossRef]
  4. Moyano, A.; Martínez, H.S.; Coronado, J.M. From network to services: A comparative accessibility analysis of the Spanish high-speed rail system. Transp. Policy 2018, 63, 51–60. [Google Scholar] [CrossRef]
  5. Wang, L.; Duan, X. High-speed rail network development and winner and loser cities in megaregions: The case study of Yangtze River Delta, China. Cities 2018, 83, 71–82. [Google Scholar] [CrossRef] [Green Version]
  6. Sun, N.; Zhang, M. Network structure and evolution characteristics of cities in China based on high-speed railway transport flow. Prog. Geogr. 2020, 39, 727–737. [Google Scholar] [CrossRef]
  7. Schiller, P.L.; Kenworthy, J.R. An Introduction to Sustainable Transportation: Policy, Planning and Implementation; Routledge: London, UK, 2017. [Google Scholar]
  8. Wang, F.; Wei, X.; Liu, J.; He, L.; Gao, M. Impact of high-speed rail on population mobility and urbanisation: A case study on Yangtze River Delta urban agglomeration, China. Transp. Res. Part A Policy Pract. 2019, 127, 99–114. [Google Scholar] [CrossRef]
  9. Ren, X.; Chen, Z.; Wang, F.; Dan, T.; Wang, W.; Guo, X.; Liu, C. Impact of high-speed rail on social equity in China: Evidence from a mode choice survey. Transp. Res. Part A Policy Pract. 2020, 138, 422–441. [Google Scholar] [CrossRef]
  10. Wang, Y.; Ruan, H.; Tian, C. Access to high-speed rail and land prices in China’s peripheral regions. Cities 2022, 130, 103877. [Google Scholar] [CrossRef]
  11. Chang, Y.; Lei, S.; Teng, J.; Zhang, J.; Zhang, L.; Xu, X. The energy use and environmental emissions of high-speed rail transportation in China: A bottom-up modeling. Energy 2019, 182, 1193–1201. [Google Scholar] [CrossRef]
  12. Tsai, W.-T. Implementation status of Taiwan carbon footprint (CFP) system and a case study of the Taiwan High Speed Rail Corporation. Sust. Cities Soc. 2017, 35, 331–335. [Google Scholar] [CrossRef]
  13. Lin, Y.; Qin, Y.; Wu, J.; Xu, M. Impact of high-speed rail on road traffic and greenhouse gas emissions. Nat. Clim. Chang. 2021, 11, 952–957. [Google Scholar] [CrossRef]
  14. Monzón, A.; Ortega, E.; López, E. Efficiency and spatial equity impacts of high-speed rail extensions in urban areas. Cities 2013, 30, 18–30. [Google Scholar] [CrossRef] [Green Version]
  15. Masson, S.; Petiot, R. Can the high speed rail reinforce tourism attractiveness? The case of the high speed rail between Perpignan (France) and Barcelona (Spain). Technovation 2009, 29, 611–617. [Google Scholar] [CrossRef]
  16. Graham, D.J.; Melo, P.C. Assessment of Wider Economic Impacts of High-Speed Rail for Great Britain. Transp. Res. Rec. 2011, 2261, 15–24. [Google Scholar] [CrossRef]
  17. Hensher, D.A.; Ellison, R.B.; Mulley, C. Assessing the employment agglomeration and social accessibility impacts of high speed rail in Eastern Australia. Transportation 2013, 41, 463–493. [Google Scholar] [CrossRef]
  18. Castanho, R.A.; Vulevic, A.; Cabezas Fernández, J.; Fernández-Pozo, L.; Naranjo Gómez, J.M.; Loures, L.C. Accessibility and connectivity—Movement between cities, as a critical factor to achieve success on cross-border cooperation (CBC) projects. A European analysis. Sust. Cities Soc. 2017, 32, 181–190. [Google Scholar] [CrossRef]
  19. Zhenhua, C.; Kingsley, E.H.; Yulong, Z.; Zhaoxin, D. High Speed Rail and China’s New Economic Geography; Edward Elgar Publishing: Cheltenham, UK, 2019. [Google Scholar]
  20. Chen, G.; e Silva, J.D.A. Estimating the Provincial Economic Impacts of High-speed Rail in Spain: An Application of Structural Equation Modeling. Procedia—Soc. Behav. Sci. 2014, 111, 157–165. [Google Scholar] [CrossRef] [Green Version]
  21. Cascetta, E.; Carteni, A.; Henke, I.; Pagliara, F. Economic growth, transport accessibility and regional equity impacts of high-speed railways in Italy: Ten years ex post evaluation and future perspectives. Transp. Res. Part A Policy Pract. 2020, 139, 412–428. [Google Scholar] [CrossRef]
  22. Ahlfeldt, G.M.; Feddersen, A. From periphery to core: Measuring agglomeration effects using high-speed rail. J. Econ. Geogr. 2018, 18, 355–390. [Google Scholar] [CrossRef]
  23. Ortega, E.; López, E.; Monzón, A. Territorial cohesion impacts of high-speed rail at different planning levels. J. Transp. Geogr. 2012, 24, 130–141. [Google Scholar] [CrossRef]
  24. Chen, C.-L.; Loukaitou-Sideris, A.; de Ureña, J.M.; Vickerman, R. Introduction: Spatial short and long-term implications and planning challenges of high-speed rail: A literature review framework. In Spatial Implications and Planning Criteria for High-Speed Rail Cities and Regions; Routledge: London, UK, 2021; pp. 1–19. [Google Scholar]
  25. Chen, C.-L.; Hall, P. The impacts of high-speed trains on British economic geography: A study of the UK’s InterCity 125/225 and its effects. J. Transp. Geogr. 2011, 19, 689–704. [Google Scholar] [CrossRef]
  26. Cheng, Y.-s.; Loo, B.P.Y.; Vickerman, R. High-speed rail networks, economic integration and regional specialisation in China and Europe. Travel Behav. Soc. 2015, 2, 1–14. [Google Scholar] [CrossRef] [Green Version]
  27. Albalate, D.; Fageda, X. High speed rail and tourism: Empirical evidence from Spain. Transp. Res. Pt. A-Policy Pract. 2016, 85, 174–185. [Google Scholar] [CrossRef] [Green Version]
  28. Li, Y.; Yang, J.; Zhang, W.; Zhou, Z.; Cong, J. Does High-Speed Railway Promote High-Quality Development of Enterprises? Evidence from China’s Listed Companies. Sustainability 2022, 14, 11330. [Google Scholar] [CrossRef]
  29. Jia, S.; Zhou, C.; Qin, C. No difference in effect of high-speed rail on regional economic growth based on match effect perspective? Transp. Res. Part A Policy Pract. 2017, 106, 144–157. [Google Scholar] [CrossRef]
  30. Liu, L.; Zhang, M. High-speed rail impacts on travel times, accessibility, and economic productivity: A benchmarking analysis in city-cluster regions of China. J. Transp. Geogr. 2018, 73, 25–40. [Google Scholar] [CrossRef]
  31. Bruinsma, F.; Rietveld, P. Urban Agglomerations in European Infrastructure Networks. Urban Stud. 1993, 30, 919–934. [Google Scholar] [CrossRef]
  32. Jiao, J.; Wang, J.; Jin, F.; Dunford, M. Impacts on accessibility of China’s present and future HSR network. J. Transp. Geogr. 2014, 40, 123–132. [Google Scholar] [CrossRef]
  33. Wang, L. High-speed rail services development and regional accessibility restructuring in megaregions: A case of the Yangtze River Delta, China. Transp. Policy 2018, 72, 34–44. [Google Scholar] [CrossRef]
  34. Li, Z.; Xu, H. High-speed railroads and economic geography: Evidence from Japan. J. Reg. Sci. 2018, 58, 705–727. [Google Scholar] [CrossRef]
  35. Zhang, H.; Chai, Y.; Yang, X.; Zhao, W. High-Speed Rail and Urban Growth Disparity: Evidence from China. Sustainability 2022, 14, 8170. [Google Scholar] [CrossRef]
  36. Diao, M. Does growth follow the rail? The potential impact of high-speed rail on the economic geography of China. Transp. Res. Part A Policy Pract. 2018, 113, 279–290. [Google Scholar] [CrossRef]
  37. Ke, X.; Chen, H.; Hong, Y.; Hsiao, C. Do China’s high-speed-rail projects promote local economy?—New evidence from a panel data approach. China Econ. Rev. 2017, 44, 203–226. [Google Scholar] [CrossRef]
  38. Loukaitou-Sideris, A.; Higgins, H.; Piven, M.; Wei, W. Tracks to Change or Mixed Signals? A Review of the Anglo-Saxon Literature on the Economic and Spatial Impacts of High-Speed Rail. Transp. Rev. 2013, 33, 617–633. [Google Scholar] [CrossRef]
  39. Vickerman, R. High-speed rail and regional development: The case of intermediate stations. J. Transp. Geogr. 2015, 42, 157–165. [Google Scholar] [CrossRef]
  40. Kim, H.; Sultana, S.; Weber, J. A geographic assessment of the economic development impact of Korean high-speed rail stations. Transp. Policy 2018, 66, 127–137. [Google Scholar] [CrossRef]
  41. Willigers, J.; van Wee, B. High-speed rail and office location choices. A stated choice experiment for the Netherlands. J. Transp. Geogr. 2011, 19, 745–754. [Google Scholar] [CrossRef]
  42. Wang, D.-G.; Niu, Y.; Qian, J. Evolution and optimization of China’s urban tourism spatial structure: A high speed rail perspective. Tour. Manag. 2018, 64, 218–232. [Google Scholar] [CrossRef]
  43. Jiao, J.; Wang, J.; Zhang, F.; Jin, F.; Liu, W. Roles of accessibility, connectivity and spatial interdependence in realizing the economic impact of high-speed rail: Evidence from China. Transp. Policy 2020, 91, 1–15. [Google Scholar] [CrossRef]
  44. Liu, X.; Jiang, C.; Wang, F.; Yao, S. The impact of high-speed railway on urban housing prices in China: A network accessibility perspective. Transp. Res. Part A Policy Pract. 2021, 152, 84–99. [Google Scholar] [CrossRef]
  45. Fernald, J.G. Roads to Prosperity? Assessing the Link between Public Capital and Productivity. Am. Econ. Rev. 1999, 89, 619–638. [Google Scholar] [CrossRef] [Green Version]
  46. Roberts, M.; Deichmann, U.; Fingleton, B.; Shi, T. Evaluating China’s road to prosperity: A new economic geography approach. Reg. Sci. Urban Econ. 2012, 42, 580–594. [Google Scholar] [CrossRef]
  47. Deng, T. Impacts of Transport Infrastructure on Productivity and Economic Growth: Recent Advances and Research Challenges. Transp. Rev. 2013, 33, 686–699. [Google Scholar] [CrossRef]
  48. Coronado, J.M.; de Ureña, J.M.; Miralles, J.L. Short- and long-term population and project implications of high-speed rail for served cities: Analysis of all served Spanish cities and re-evaluation of Ciudad Real and Puertollano. Eur. Plan. Stud. 2019, 27, 434–460. [Google Scholar] [CrossRef]
  49. Jiao, J.; Wang, J.; Jin, F.; Wang, H. Impact of high-speed rail on inter-city network based on the passenger train network in China, 2003–2013. Acta Geogr Sin. 2016, 71, 265–280. [Google Scholar]
  50. Lv, Y.; Chen, Y. Research on the Evolution Characteristics and Synergistic Relationship between HSR Network and Economic Network in Hubei Province. Sustainability 2022, 14, 9076. [Google Scholar] [CrossRef]
  51. Wei, S.; Jiao, J.; Wang, L.; Xu, J. Evolving Characteristics of High-Speed Railway Network Structure in Yangtze River Delta, China: The Perspective of Passenger Flows. Appl. Spat. Anal. Policy 2020, 13, 925–943. [Google Scholar] [CrossRef]
  52. Xu, Y.; Ou, G. Does High-Speed Railway Promote the Level of Human Capital? An Empirical Analysis Based on Three Urban Agglomerations in China. Sustainability 2022, 14, 12631. [Google Scholar] [CrossRef]
  53. Zhang, P.; Zhao, Y.; Zhu, X.; Cai, Z.; Xu, J.; Shi, S. Spatial structure of urban agglomeration under the impact of high-speed railway construction: Based on the social network analysis. Sust. Cities Soc. 2020, 62, 102404. [Google Scholar] [CrossRef]
  54. Chen, Z.; Haynes, K.E. Impact of high-speed rail on regional economic disparity in China. J. Transp. Geogr. 2017, 65, 80–91. [Google Scholar] [CrossRef]
  55. Xu, W.; Zhou, J.; Yang, L.; Li, L. The implications of high-speed rail for Chinese cities: Connectivity and accessibility. Transp. Res. Part A Policy Pract. 2018, 116, 308–326. [Google Scholar]
  56. Ma, J.T.; Liu, T.Y. Does the high-speed rail network improve economic growth? Pap. Reg. Sci. 2021, 101, 183–208. [Google Scholar] [CrossRef]
  57. Sun, W.; Wang, C.; Liu, C.; Wang, L. High-Speed Rail Network Expansion and Its Impact on Regional Economic Sustainability in the Yangtze River Delta, China, 2009–2018. Sustainability 2021, 14, 155. [Google Scholar] [CrossRef]
  58. Xie, F.; Ma, M.; Ren, C. Research on multilayer network structure characteristics from a higher-order model: The case of a Chinese high-speed railway system. Phys. A Stat. Mech. Its Appl. 2022, 586, 126473. [Google Scholar] [CrossRef]
  59. Riot, E. A European perspective on the planning of major railway stations: Considering the cases of St Pancras Station and Paris Gare du Nord. Town Plan. Rev. 2014, 85, 191–202. [Google Scholar] [CrossRef]
  60. Mazzoni, C. Gares: Architecture 1990–2010; Actes Sud: Arles, France, 2001. [Google Scholar]
  61. Federico Camerin, A.Á.M. Regenerating Bilbao: From “productive industries” to “productive services”. Territorio 2019, 89, 145–154. [Google Scholar] [CrossRef]
  62. Ertur, C.; Koch, W. Growth, technological interdependence and spatial externalities: Theory and evidence. J. Appl. Econom. 2007, 22, 1033–1062. [Google Scholar] [CrossRef] [Green Version]
  63. Lesage, J.P.; Fischer, M.M. Spatial Growth Regressions: Model Specification, Estimation and Interpretation. Spat. Econ. Anal. 2008, 3, 275–304. [Google Scholar] [CrossRef] [Green Version]
  64. Elhorst, J.P. Applied Spatial Econometrics: Raising the Bar. Spat. Econ. Anal. 2010, 5, 9–28. [Google Scholar] [CrossRef]
  65. Pijnenburg, K.; Kholodilin, K.A. Do Regions with Entrepreneurial Neighbours Perform Better? A Spatial Econometric Approach for German Regions. Reg. Stud. 2012, 48, 866–882. [Google Scholar] [CrossRef]
  66. Belotti, F.; Hughes, G.; Piano Mortari, A. XSMLE: Stata Module for Spatial Panel Data Models Estimation; Boston College Department of Economics: Boston, MA, USA, 2017. [Google Scholar]
  67. Cobb, C.W.; Douglas, P.H. A Theory of Production. Am. Econ. Rev. 1928, 18, 139–165. [Google Scholar]
  68. Tarasyev, A.A.; Jabbar, J.B. Dynamic Modeling of Labor Migration Impact on the Economic System Development. IFAC-Pap. 2018, 51, 407–412. [Google Scholar] [CrossRef]
  69. Koengkan, M.; Fuinhas, J.A.; Kazemzadeh, E.; Osmani, F.; Alavijeh, N.K.; Auza, A.; Teixeira, M. Measuring the economic efficiency performance in Latin American and Caribbean countries: An empirical evidence from stochastic production frontier and data envelopment analysis. Int. Econ. 2022, 169, 43–54. [Google Scholar] [CrossRef]
  70. Urbano, D.; Aparicio, S. Entrepreneurship capital types and economic growth: International evidence. Technol. Forecast. Soc. Chang. 2016, 102, 34–44. [Google Scholar] [CrossRef] [Green Version]
  71. Mehmood, M.S.; Li, G.; Jin, A.; Rehman, A.; Wijeratne, V.; Zafar, Z.; Khan, A.R.; Khan, F.A. The spatial coupling effect between urban street network’s centrality and collection & delivery points: A spatial design network analysis-based study. PLoS ONE 2021, 16, e0251093. [Google Scholar]
  72. Luo, N.S.; Tian, M.; Yang, J.; Jian-Ming, L.I.; Wang, Y.Z. Impact of high-speed rail network on urban eco-efficiency: Based on the spatial measurement of 277 prefecture-level cities nationwide. China Popul. Resour. Environ. 2019, 29, 1–10. [Google Scholar]
  73. Xinming, H. Selection of Wald‚ LR and LM When Tests Are Inconsistent. J. Quant. Technol. Econ. 2010, 27, 153–161. [Google Scholar]
  74. Boix, R.; Trullén, J. Knowledge, networks of cities and growth in regional urban systems. Pap. Reg. Sci. 2007, 86, 551–574. [Google Scholar] [CrossRef] [Green Version]
  75. Liu, S.; Wan, Y.; Zhang, A. Does China’s high-speed rail development lead to regional disparities? A network perspective. Transp Res Part A Policy Pract. 2020, 138, 299–321. [Google Scholar] [CrossRef] [PubMed]
  76. Ureña, J.M.; Menerault, P.; Garmendia, M. The high-speed rail challenge for big intermediate cities: A national, regional and local perspective. Cities 2009, 26, 266–279. [Google Scholar] [CrossRef]
  77. Vickerman, R. Can high-speed rail have a transformative effect on the economy? Transp. Policy 2018, 62, 31–37. [Google Scholar] [CrossRef]
Figure 1. Geographical location of HSR cities in western China and their HSR network.
Sustainability 14 15914 g001
Figure 2. Evolution of daily frequency of HSR cities in western China from 2015 to 2020.
Sustainability 14 15914 g002
Figure 3. Chord diagram of the changing relationship between HSR cities in western China (2015–2020).
Sustainability 14 15914 g003
Figure 4. Spatial evolution of HSR flows between western and non-western provinces (2015–2020).
Sustainability 14 15914 g004
Figure 5. The evolution of the structural factors of the western HSR city network (2015–2020).They should be listed as (a) descriptions of the average centrality of the western HSR city network; (b) descriptions of internal and external connectivity.
Sustainability 14 15914 g005
Figure 6. The evolutionary characteristics of the economic gap and the transfer potential of the economic gap.
Sustainability 14 15914 g006
Table 1. Variable definitions and descriptive statistics.
TypeVariableDefinitionDescription
Dependent variableGDPGross Domestic ProductThe level of economic development
Control variablesLAPersons employed in city units at year-endLabor force size
IFAFixed asset investmentThe amount of capital accumulation
RDR&D expenditureInputs of science, technology, and innovative knowledge
Mechanism variableWDCWeighted degree centralityConnectivity
CCCloseness centralityConvenience of transit
BCBetweeness centralityTransshipment capacity
ICInternal ConnectivityConnectivity structure between HSR cities in the intra-western region
ECExternal ConnectivityConnectivity structure between western HSR cities and non-western HSR cities
TPTransfer Potential of economic gapThe potential for cities to change economic gaps through high-speed rail links
Table 2. Results of the spatial autocorrelation and LM tests.
Spatial Autocorrelation TestLM-Error TestLM-Lag Test
Moran’s ILagrange MultiplierRobust Lagrange MultiplierLagrange MultiplierRobust Lagrange Multiplier
WDC8.222 ***62.956 ***19.501 ***63.246 ***19.791 ***
CC8.374 ***65.201 ***20.531 ***65.667 ***20.997 ***
BC9.526 ***85.550 ***33.161 ***73.437 ***21.047 ***
IC8.725 ***71.385 ***23.561 ***68.475 ***20.651 ***
EC8.564 ***68.423 ***21.792 ***69.203 ***22.572 ***
TP7.695 ***55.014 ***28.043 ***39.037 ***12.066 ***
In the table, values in parentheses are standard deviations; *** indicate significance at the 1% statistical levels, respectively. The above results were calculated using Stata13.1.
Table 3. Results of the LR and Wald tests.
LR TestWald TestFixed and Random Effects Test
LR_
spatial_lag
LR_
spatial_error
Wald_
spatial_lag
Wald_
spatial_error
Hausman
WDC3.189.14 *5.816.4070.29 ***
CC2.9813.30 ***3.297.7452.67 ***
BC3.187.94 *2.693.5934.44 ***
IC4.0812.53 ***4.014.2311.24 **
EC8.43 **16.51 ***8.73 *8.35 *60.44 ***
TP26.28 ***24.81 ***34.26 ***25.68 ***62.46 ***
In the table, values in parentheses are standard deviations; *, **, and *** indicate significance at the 10%, 5%, and 1% statistical levels, respectively. The above results were calculated using Stata13.1.
Table 4. Estimation of mechanism variable impacts on economic growth using SDM or SAR.
VariableWDCCCBCICECTP
ModelSARSARSARSARSDMSDM
City feYesYesYesYesYesYes
Time fe NoYesYesYesYesYes
Main0.043 ***0.082 ***0.126 ***0.096 ***0.154 ***−0.240 ***
Wx−0.073 ***0.101 ***
Direct Effect0.043 ***0.084 ***0.127 ***0.097 ***0.157 ***−0.236 ***
Indirect Effect−0.005 *−0.017 ***−0.016 *−0.016 ***−0.083 ***0.086 ***
Total Effect0.039 ***0.066 ***0.111 ***0.081 ***0.074 ***−0.151 ***
R-sq0.84190.8250.84190.8250.8300.888
Data source: obtained by collating the results from the model estimation. In the table, values in parentheses are standard deviations; * and *** indicate significance at the 10% and 1% statistical levels, respectively. The above results were calculated using Stata13.1.
Publisher’s Note: MDPI stays neutral with regard to jurisdictional claims in published maps and institutional affiliations.

