Abstract
The research on land transfer has essential theoretical and practical significance in ensuring food security and curbing the land de-graining. Based on the characteristics of large-scale and mechanized land in the H region of China, we constructed a prediction index for the willingness to transfer land in. The random forest (RF) algorithm was used to evaluate the importance of the factors affecting the land transfer-in willingness and the main factors were analyzed. The results show that: (1) The overall prediction accuracy of the RF model was 86.98% and the out-of-bag prediction error was 13.02%. (2) The factors that had an essential impact on the willingness to transfer to land were land area, the proportion of agricultural income, and crop type. The less influential factors were the size of the labor force, identity, and gender. (3) We found that 68% of the interviewed farmers wanted to increase land to expand the scale of production; this proportion was much higher than that in other parts of the country. The farmers were more willing to increase land to plant economic crops, which has a negative impact on the stability of food production. (4) Alleviating the negative impact of the Russian–Ukrainian conflict and stabilizing the production of economic crops, ensuring the safety of food production, and promoting the balanced development of food production and economic crops are topics that need to be continuously explored. This study can provide a useful reference for the development of the moderate-scale management of agriculture in China.
1. Introduction
The decentralized management and the fragmentation of agriculture characterize the current situation of agricultural production in China. Large-scale production is of great significance to food security. Russia and Ukraine are two of the world’s most important food producers and exporters [1], accounting for one third of the world’s wheat export market. Since the outbreak of the Russia–Ukraine conflict in February 2022, Ukraine’s food exports have been blocked, Russia announced a ban on food exports to unfriendly countries, and world food prices have skyrocketed. With the continuation of the conflict, the prices of oil, natural gas, fertilizer, and other agricultural prices have soared and uncertainty has caused agricultural production costs to increase significantly [2,3,4]. The uncertainty related to agricultural production and the substantial increase in agricultural production costs have further affected food production. In this case, ensuring food security has become a more important issue for all countries. Since the 18th National Congress of the Communist Party of China, China has put forward a new concept of food security, established a national food security strategy, and embarked on the road toward food security. The key to ensuring food security is to implement the strategy of storing grain in the land and using technology. Technology is fundamental to solve problems related to food security.
Strengthening the application of science and technology and improving labor productivity are important ways to ensure food security and curb the decline in grain production. However, the small scale of production and the fragmentation of land have affected the application of agricultural technology, affected land investment, and increased production costs [5]. To ensure food security, providing full play to the advantages of large-scale grain production is an important strategy. In 2019, China’s agricultural land circulation area accounted for more than 33% of the national cultivated land area [6]. In Henan, the main grain-producing province in China, the land circulation area accounts for 34.8% of the contracted operation area. After the development of land circulation, a new operation mode has formed, which has increased grain output and improved agricultural production efficiency [7]. Therefore, it is essential to formulate policies to help farmers solve the problems affecting land circulation, so as to promote land circulation. On the one hand, we need to focus on fostering large-scale grain farming and, on the other hand, we need to further explore the willingness of small farmers to expand their scale of agricultural production. The latter is studied through field visits. It is of great theoretical value and practical significance to ensure national food security and curb the de-graining of cultivated land by carrying out research on the prediction of the willingness to increase land and providing targeted technical support and policy support for agricultural production.
The development of the farmland transfer market has attracted the attention of development economists and agricultural economic researchers and has spawned a large number of theoretical and empirical analyses. In the previous analysis of the factors influencing land transfer, studies have been conducted based on the macro perspective or by examining farmers’ willingness to transfer land. Researchers have studied the macro environment, such as the stability of land rights [8,9,10,11,12,13,14], and micro factors, such as the characteristics of farmers themselves, the characteristics of farmers’ families, the perceptions of farmers’ lives, the knowledge pertaining to rural social security, and the knowledge regarding farmland policy formulation [15,16,17,18]. The existing research is mainly based on small-scale farmers and fragmented land [15,19,20,21]. There are some shortcomings in the existing research: the research focuses on the discussion and analysis of the influencing factors of land transfer and lacks predictions of the willingness to transfer land. In terms of research methods, Logit regression analysis has been most frequently used and the application of machine learning has been insufficient. Furthermore, the existing research in China focuses on the scenario of fragmented land and there is a lack of research on large-scale land. Farmers with a certain scale of land may encounter problems different from those of small farmers in the process of further expanding their land area. With a focus on large-scale and mechanized land, in this study we attempted to construct a prediction index system for the willingness to transfer land. The machine learning random forest algorithm (RF) was used to establish a prediction model for the willingness and to evaluate the importance of factors affecting the transfer of land.
Region H in China has already provided a basis for moderate-scale production. The popularization of agricultural technology and socialized service organizations has provided conditions for the full realization of large-scale agricultural production. In addition, the popularization of the overall mechanization of grain production has laid the foundation for the large-scale transfer of land. This region can provide a reference for the moderate-scale transfer of land that has been gradually carried out in the country and has strong forward-looking and theoretical value.
2. Data Source and Model Construction
2.1. Data Source
The data came from the field questionnaire survey in the H area in November 2021. The area under investigation is the main grain producing area and the economic crop producing area. Most of the interviewed farmers have achieved moderate scale production and full mechanization. The respondents completed the questionnaire on the premise of randomness, autonomy, and voluntariness and a total of 2075 valid questionnaires were obtained.
2.2. Model Construction
2.2.1. Model Algorithm
We used R language as a platform and used an RF algorithm to evaluate the main factors of transfer-in land willingness. The main statistics and the chart were completed under the R language platform. RF is a supervised machine learning algorithm based on a decision tree. It has been widely used in medicine, biology, finance, and other fields. Compared to other machine learning algorithms, RF improves classification accuracy by generating multiple prediction models and aggregating them, often with higher accuracy. It is insensitive to outliers, has good tolerance for missing values, and can also handle high-dimensional data. In addition, RF uses multiple decision trees rather than a single decision tree, so overfitting is less likely to occur and the model is more robust [22]. The algorithm can also calculate the out-of-bag prediction error (OOB error) of the model and measure the importance of variables. Therefore, the use of an RF algorithm can simultaneously realize the prediction of transfer-in willingness and the evaluation of influencing factors, which is more advantageous than other algorithms.
2.2.2. Model Variables
The transfer-in intention of large-scale land is affected by many factors and the main influencing factors are different between regions. A total of nine items in three categories of demographic characteristics of farmers, operating characteristics, and risk perception were selected as variables to be included in the model. The specific variables are shown in Table 1.

Table 1.
Variable definition.
In terms of farmers’ demographic characteristics, we selected six indicators: gender, age, identity, years of education, number of students, and number of labor force. The existing research shows that the age of farmers has an important impact on the willingness to transfer land. Older farmers may be more conservative and tend to maintain the original state, so they are unwilling to transfer the land out or in [23] and large-scale farming farmers usually require more capital investment, efficient management, and farming technology, which are not easy to obtain for older farmers [21,24].
As for personal identity, on the one hand, village cadres have a high level of education and stable non-agricultural income. They may not participate in land transfer too much. On the other hand, village cadres may use their influence or privilege to expand the agriculture scale. At least, considering their knowledge and influence, they have easier access to other farmers’ land [21].
For the education level, due to the low industrialization level and limited occupations, people with low education levels can only choose land planting in region H.
Some papers examine the impact of children on labor force participation or non-farm employment and the evidence is inconsistent [24,25,26,27,28,29]. In the context of large-scale land production, the more students in the family, the heavier the burden, and the land can provide a relatively stable source of income. Therefore, the more students, the more likely they may increase land and form a large-scale operation.
The greater the number of labor force owned by households, the more significant the role of organization, coordination, and management under moderate scale operation. The more capable they are of large-scale operation, the more willing they are to increase land [18].
In terms of farmers’ operating characteristics, we selected three indicators: land area, crop planting type, and agricultural income proportion. As for land area, with the increase in planting income of cotton, grain, and other crops in recent years, farmers’ dependence on land has increased and the income gap caused by the scale effect is prominent. In this context, considering the expected income of farmers, the larger the operating area of farmers, the more willing they are to increase land [30]. The more income increases after land transfer, the more satisfied with land transfer [31].
Different planting crops have different effects on land transfer and reflect the average output per mu.
The proportion of non-agricultural income has a negative impact on the land transfer. The higher the non-agricultural income, the lower the family’s dependence on land and the more inclined to transfer out rather than transfer in the land [32].
Regarding farmers’ concept perception, we selected risk perception degree. It is estimated that the higher the risk perception, the lower the willingness to increase land. The farmers who believe that there are risks in increasing land will not transfer land in, which is in line with the principle of risk aversion [33].
3. Model Results and Evaluation
3.1. Model Results
The overall prediction accuracy of the model is 86.98% and the OOB error is 13.02%. The results show that the top three factors affecting land transfer-in willingness are Land Area, Proportion of Agricultural Income, and Crop Type, all of which belong to Operating Characteristic. The average reduction accuracy of the three are 134.87, 121.85, and 110.24 and the average reduction Gini coefficient are 216.79, 74.26, and 71.99, respectively. The last three variables are the Number of Labor Force, Identity, and Gender, which belong to the farmers’ Demographic Characteristic. The average reduction accuracy of the three are 67.99, 74.49, and 81.79, respectively, and the average reduction Gini coefficient are 56.02, 37.27, and 36.02, respectively. The importance of each variable is shown in Table 2.
Table 2.
Variable importance.
3.2. Model Evaluation
Accuracy is an overall indicator to evaluate the percentage of correctly divided sample units. Generally, more than 75% indicates that the model classification effect is qualified and more than 95% is very good [22]. The RF model prediction accuracy reached 87% in this study (Table 3). The information contained in Accuracy is general and broad. It is necessary to further evaluate the effect of the model by Sensitivity, Specificity, Positive Predictive Value, Negative Predictive Value, and other indicators. The Sensitivity of the model is 0.95, that is, the probability of successful prediction in the “willing to increase land” farmer sample unit is 95%. From the perspective of judging farmers “willing to increase land”, this indicator is particularly essential and has a high success rate. The Specificity is 0.63, i.e., the probability of being successfully predicted in the “unwilling to increase the land” farmer sample unit is 63%. The Positive Predictive Value is 0.87, that is, the farmer sample is predicted to be “willing to increase the land” and the correct prediction ratio is 87%. The Negative Predictive Value is 0.84, i.e., 84% are correctly predicted in the units where the farmer sample is predicted to be “unwilling to increase land”. Overall, the results are good.
Table 3.
RF model evaluation.
The relationship between the specificity and sensitivity is further observed by the Receiver Operating Characteristic (ROC) curve, as shown in Figure 1. The Area Under the Curve (AUC) value is the area under the ROC curve that intuitively reflects the performance of the model classification. The larger the AUC value, the larger the area, the better the classification effect. In general, an AUC value greater than 0.80 indicates that the model classification is better. The AUC value is 0.95 > 0.80, indicating that the RF model has ideal classification performance. The normalized confusion matrix is shown in Figure 2.
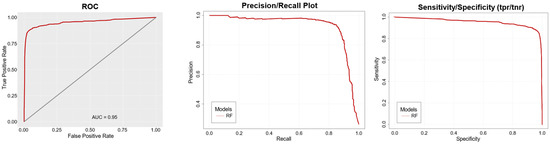
Figure 1.
ROC curve (left), Precision curve (middle), and Sensitivity/Specificity curve (right) of RF model.
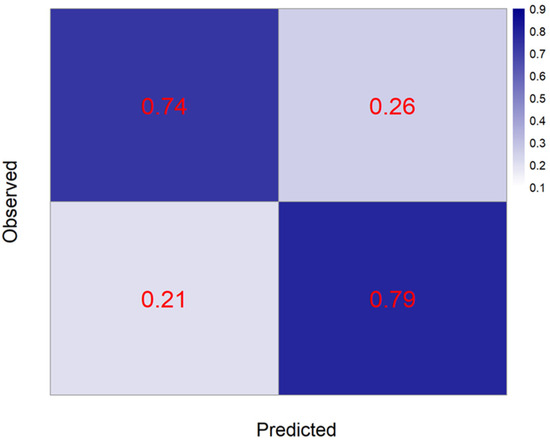
Figure 2.
Normalized confusion matrix.
4. Statistical Analysis
4.1. Analysis of Influencing Factors
The statistics show that 74% of the interviewed farmers expressed their desire to expand the agricultural production scale, which is much higher than that in other regions of China. According to crop types, the willingness of land transfer-in is 81% of economic crops, followed by 71% of forest fruits, 68% of grain crops, and about 57% of vegetables and other (Figure 3). In general, the willingness of farmers to increase the land is high, especially that of economic crop is very strong, and the willingness of grain crop farmers is lower than the average level. The willingness direction of farmers with different crop types is shown in Figure 4; 19% of farmers growing cash crops do not want to increase land, accounting for 35% of farmers who do not want to increase land; 32% of food farmers do not want to increase land, accounting for 38% of farmers who do not want to increase land. The proportion of grain farmers willing to increase land accounts for 28% of the total farmers willing to increase land and the proportion of cash crop farmers willing to increase land accounts for more than 53% of the total farmers willing to increase land.
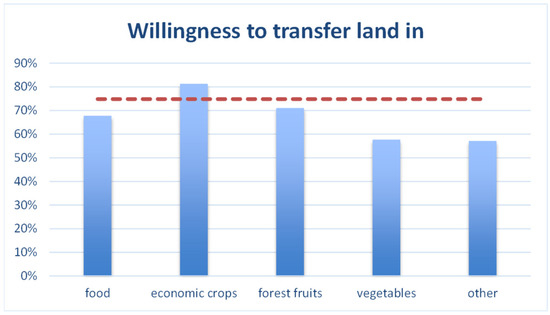
Figure 3.
Transfer-in willingness of different types of farmers. The red dotted line represents the weighted average of the transfer-in willingness.
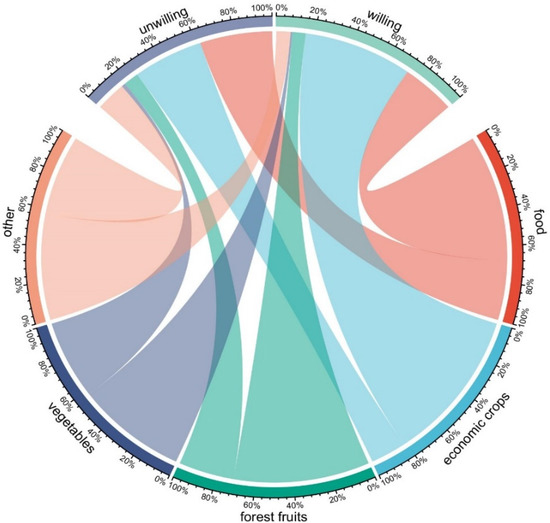
Figure 4.
Chord diagram of land transfer-in willingness of agricultural producers with different crop types.
From the perspective of agricultural income ratio-land area relationship (Figure 5), the difference between the ≥81% group and ≤30% group is analyzed. The rank sum test results show that p = 0.000 < 0.05, indicating that there is a significant difference in the land area distribution between the two groups. The land area distribution of farmers whose planting income accounts for more than 81% presents a violin pattern. The farmers are mainly concentrated in two regions: near 50 mu and 100 mu and above and the number of farmers near the average is significantly narrowed. The distribution of 31–50% and 51–80% groups are similar to the more than 81% group, but the narrowing phenomenon is not obvious near the mean. The farmers whose planting income is less than 30% are mainly concentrated in the vicinity of the average land and the overall land area of farmers is smaller than other groups. Obviously, larger land operators are more willing to expand their business than small farmers and the willingness to increase land is stronger. Compared with the less than 30% group, the farmers whose planting income accounts for more than 81% occupy more land and gather around 100 mu.
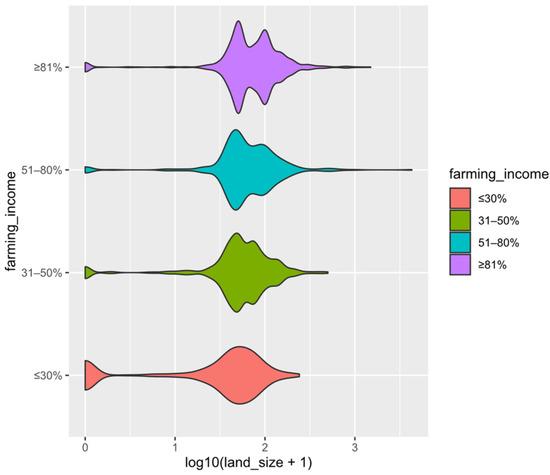
Figure 5.
Income-land area relationship.
From the perspective of the crop type-agricultural income ratio (Figure 6), more than 35% of the grain crop farmers have planting income rations greater than 81% and there is little difference between different income groups (about 20%), which is relatively balanced. The economic crops show obvious aggregation. More than 50% of farmers’ agricultural income accounts for more than 81% and about 30% of farmers’ agricultural income accounts for between 50% and 80%, which means that the main income source of most economic crop farmers is agricultural planting.
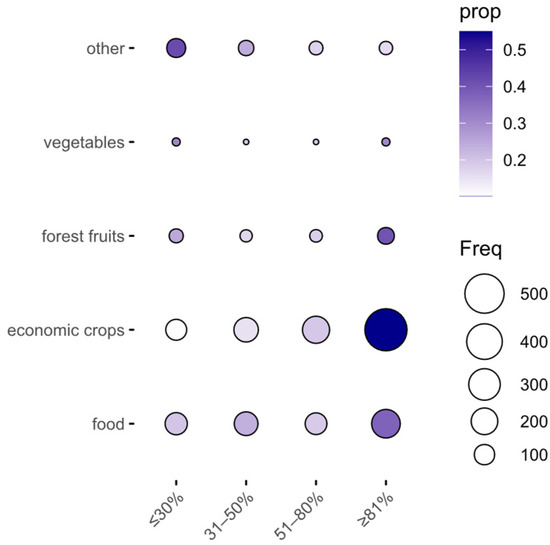
Figure 6.
Relationship between crop type and agricultural income proportion.
From the perspective of the crop type-land area relationship (Figure 7), the land area of grain crops and economic crops is significantly different. The rank sum test result shows that p = 0.007 < 0.05, indicating that there is a significant difference in the land area distribution of the two groups. The land area of grain crop farmers are concentrated slightly below the average. The land area of economic crop farmers is mainly concentrated in 50 mu and 100 mu, showing a clear violin type. The vast majority of grain crop farmers do not increase land.
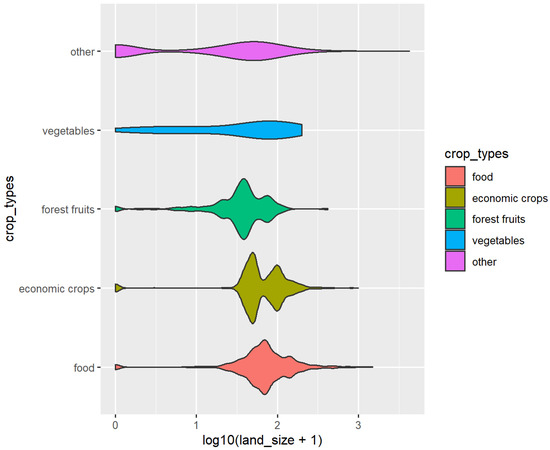
Figure 7.
Crop type-land area relationship.
From the perspective of the risk perception-land area relationship (Figure 8), the risk perception is divided into four groups. The land area distribution is similar in the four groups. There is an obvious aggregation near the mean value and it decreases rapidly with the increase in land area. The rank sum test shows that p = 0.839 > 0.05, indicating that there was no significant difference between the high risk-perception group and the low risk-perception group. The importance of the variable “Risk Perception” in the main variables decreased significantly.
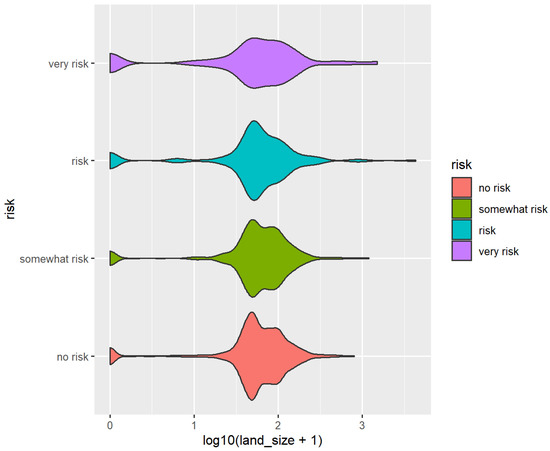
Figure 8.
Relationship between risk perception and land area.
Identity has little impact on farmers’ willingness. The survey of farmers who have increased land found that the median of land area with different identities is highly consistent and there is no significant difference by rank sum test.
It can be seen that the Operating Characteristic is the main driving force for farmers to transfer land in and its importance is far greater than the Demographic Characteristic. The Land Area, Proportion of Agricultural Income, and Crop Type are important variables affecting the willingness. The Number of Labor Force, Gender, and other factors that have a greater impact on small-scale land have less of an impact on increasing the willingness of large-scale land. Under the background of large-scale and highly mechanized production, the impact of Gender is not obvious and Number of Labor Force and physical strength are no longer a determinant. Identity has a low impact on farmers’ transfer-in willingness.
4.2. Willingness Transformation Analysis
The transformation from transfer-in willingness to transfer behavior is affected by multiple factors such as transfer price, lease term, input, and income (see Figure 9). According to the survey, the reasons why farmers do not increase land mainly include the following aspects. Up to 48% of farmers said the transfer price was high; 34% indicated that the pre-investment in the land was unaffordable and lacked sufficient funds; 22% worried that the income was not guaranteed; 20% indicated limited labor; and 16% said the lease term is short. In the case of low willingness to transfer land out and the limited scale of transferable land in the survey area, a farmer’s financial situation is the dominant factor affecting land transfer. Compared with other crop types, economic crop farmers have an advantage in the circulation market with relatively high incomes, while crops such as forest fruits and essential oils are often at a disadvantage due to the limitations of requiring large upfront investment, being labor-intensive, and having long lease periods.
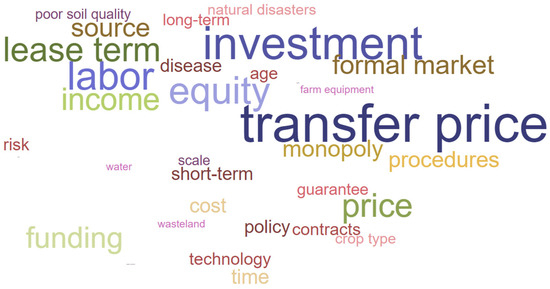
Figure 9.
Vocabulary cloud picture.
5. Discussion
The high land transfer-in willingness of food farmers is important for food security. However, the willingness of economic crop farmers is much stronger. The two types of farmers are in a competitive opposition in the land transfer market and the economic crop farmers are often in a dominant position by virtue of their stronger economic strength. In this case, the willingness of grain farmers to increase land is high, but the conversion rate is low.
Different from small farmers, the income per mu of crops has a greater impact on the household income under large-scale planting and the land is more likely to concentrate on high-yield crops. According to the data of farmers’ fixed-point observations in 2020, the average net income of cotton per mu is about CNY 1200. The average output value of cotton per mu is high and the planting area is the largest. The proportion of grain crops in the total sown area in the survey area decreased from 22.1% in 2013 to 18.4% in 2020, with a decrease of 21.3% in eight years. The proportion of cash crops in the total sown area rose from 52.6% to 61.1%, with a growth rate of 16.7%. With the continuation of the epidemic, food production has been focused on and the area proportion will return to 20.7% in 2021. However, we should still be alert to the de-graining tendency.
The involvement of village collectives and other grassroots organizations can help achieve centralized and contiguous operation [34], reduce the risk of non-standard land transfer, improve farmers’ psychological security, and promote land transfer. Therefore, it is necessary to play the role of grassroots organizations in regulating land transfer on the basis of respecting the willingness of farmers, so as to promote land transfer. By expanding the income sources of farmers and reducing their dependence on land, we can improve land supply and increase financing channels, which is of great significance for promoting land circulation.
The prices of agricultural materials such as oil, natural gas, and pesticides also soared. Ensuring food security needs to boost farmers’ confidence in growing grain. In March 2022, China’s government issued a total of CNY 20 billion of direct subsidies for grain farmers nationwide, focusing on supporting summer harvest and autumn sowing to alleviate the cost of rising agricultural materials prices. Secondly, ensuring food security needs the support of agricultural science and technology. China emphasizes the development of agricultural science and technology in a more prominent position. Therefore, China needs to strengthen the basic research of agriculture and increase the investment. Using seed, intelligence, biosafety, agricultural machinery, and other fields as the core key breakthroughs, it provides strong scientific and technological support for food security and high-quality development. In the case of large-scale planting, technology is easier to popularize, which is also more conducive to the improvement of grain yield per unit area. In 2021, the grain yield per mu in the survey area will be 624 kg, with an increase of 40.9 kg over 2017 and 117 kg over 2013. The increase in unit output will alleviate the adverse impact of the reduction in grain area to some extent.
6. Conclusions
This paper studied the factors affecting the land transfer-in willingness in large-scale production and established a prediction model. The factors that have an essential impact on the willingness are land area, proportion of agricultural income, and crop type. While the factors that have a smaller impact are the number of labor force, identity, and gender. Furthermore, 68% of grain farmers in the surveyed areas want to transfer land in to expand production scale, which is much higher than that in other Chinese regions and is of great significance to ensure food security. Develop regional economy, increase non-agricultural employment, and promote some farmers to transfer land out, so that more land resources will be concentrated to willing farmers, to promote the improvement of agricultural productivity. Provide play to the role of village collective organizations, standardize the land transfer behavior, reduce the risk of land transfer, and then help farmers achieve concentrated production to solve the constraints of land fragmentation on agricultural production. The accuracy of the RF model in predicting farmers’ land transfer-in willingness is 87% and the OOB error is 13%. Resolving the sanctions crisis, mitigating the negative impact of the Russia-Ukraine conflict, ensuring the safety of grain production on the basis of stabilizing the production of economic crops, preventing the de-graining, and promoting the balanced development of grain production and economic crops are topics that need to be explored in depth.
Author Contributions
Conceptualization, H.L. and W.Z.; methodology, H.L.; software, H.L.; validation, H.L., W.Z. and Z.H.; formal analysis, H.L. and W.Z.; investigation, H.L. and Z.H.; resources, H.L.; data curation, H.L.; writing—original draft preparation, H.L.; writing—review and editing, W.Z.; visualization, H.L.; supervision, Z.H. All authors have read and agreed to the published version of the manuscript.
Funding
This research received no external funding.
Institutional Review Board Statement
Not applicable.
Informed Consent Statement
Not applicable.
Data Availability Statement
The data presented in this study are available on request from the corresponding author. The data are not publicly available due to restrictions privacy.
Conflicts of Interest
The authors declare no conflict of interest.
References
- Yi, X.Z.; Yang, H.W.; Cao, B.M.; Xu, P.L. Impact of Russia-Ukraine Conflict on International Economic and Trade Landscape. Int. Econ. Rev. 2022, 3, 9–37+34. [Google Scholar]
- Li, C.; Li, J. Global food security challenges more acute. World Aff. 2022, 19–21. [Google Scholar]
- Lu, Q. Russia-Ukraine Conflict, International Agricultural Cooperation and China’s Food Security—A Summary of the Seminar on Global Agriculture and Food Security under the Changing Situation of Russia-Ukraine. World Agric. 2022, 128–132. [Google Scholar]
- Tang, W. The Global Supply Chain Crisis in the Ukraine Crisis. Foreign Investig. China 2022, 36–37. [Google Scholar]
- Liu, Y.; Ma, X.; Shi, X. The Effect of Agricultural Machinery Services on the “Involution” of small holders. Land Rent. 2022, 2, 146–157. [Google Scholar]
- Yang, R.; Zhang, Y.; Lu, Y. Collective Action, Risk Sharing, and Land Transfer. Econ. Manag. 2022, 36, 7–18. [Google Scholar]
- Liu, Q. Effect analysis and path selection of resource allocation of land circulation in Henan Province. Agric. Econ. 2022, 3, 120–121. [Google Scholar]
- Deininger, K.; Zegarra, E.; Lavadenz, I. Determinants and Impacts of Rural Land Market Activity: Evidence from Nicaragua. World Dev. 2003, 31, 1385–1404. [Google Scholar] [CrossRef]
- Huy, H.T.; Lyne, M.; Ratna, N.; Nuthall, P. Drivers of transaction costs affecting participation in the rental market for cropland in Vietnam. Aust. J. Agric. Resour. Econ. 2016, 60, 476–492. [Google Scholar] [CrossRef]
- Liu, Y.; Xu, H. Influence of farmland right to rural land circulation: Based on the perspective of farmers differentiation. J. Arid. Land Resour. Environ. 2016, 30, 25–29. [Google Scholar]
- Macmillan, D.C. An economic case for land reform. Land Use Policy 2000, 17, 49–57. [Google Scholar] [CrossRef][Green Version]
- Qiu, T.; Shi, X.; Ma, X. The impact of farmland transfer experience and tenure security cognition on the potential demand of land rental market: Evidence from the hilly area of Jiangxi. Resour. Sci. 2015, 37, 645–653. [Google Scholar]
- Van Dijk, T. Scenarios of Central European land fragmentation. Land Use Policy 2003, 20, 149–158. [Google Scholar] [CrossRef]
- Wang, H.; Riedinger, J.; Jin, S. Land documents, tenure security and land rental development: Panel evidence from China. China Econ. Rev. 2015, 36, 220–235. [Google Scholar] [CrossRef]
- Teng, Y.; Meng, J.; Wang, J.; Meng, Y. Analysis on influential factors of farmer land management right transfer in Henan. J. South. Agric. 2020, 51, 975–982. [Google Scholar]
- Gao, W.; Zhang, S.; Wang, J. Land transfer, income expectation and participation willingness of Rural Higher Education. Manag. Sci. 2013, 234, 82–95. [Google Scholar]
- He, X.; Jiang, T.; Guo, L.Y.; Gan, L. Research on the development of China’s farmland transfer market and farmers’ land transfer behavior: Based on the farmer survey data of 29 provinces from 2013 to 2015. Manag. World 2016, 6, 79–89. [Google Scholar]
- Lin, H.; Zhang, W.; Huang, Z. What are the Determinants of Willingness to Transfer Out Large-Scale Land in Region X of China. Asian Econ. Financ. Rev. 2022, 12, 368–379. [Google Scholar] [CrossRef]
- Wan, G.H.; Cheng, E.J. Effects of land fragmentation and returns to scale in the Chinese farming sector. Appl. Econ. 2001, 33, 183–194. [Google Scholar] [CrossRef]
- Wu, Z.P.; Liu, M.Q.; Davis, J. Land consolidation and productivity in Chinese household crop production. China Econ. Rev. 2005, 16, 28–49. [Google Scholar] [CrossRef]
- Xia, X.; Xin, X.; Ma, L. What are the Determinants of Large-scale Farming in China? China World Econ. 2017, 25, 93–108. [Google Scholar] [CrossRef]
- Kabacoff, R.I. R in Action: Data Analysis and Graphics with R; Simon and Schuster: New York, NY, USA, 2015. [Google Scholar]
- Li, T.; Zhao, Y.; Xin, X. Analysis of the basic characteristics and influencing factors of current agricultural land transfer. Chin. Rural. Econ. 2009, 10, 4–11. [Google Scholar]
- Qiao, F.; Rozelle, S.; Zhang, L.; Yao, Y.; Zhang, J. Impact of childcare and eldercare on off-farm activities in rural China. China World Econ. 2015, 23, 100–120. [Google Scholar] [CrossRef]
- Kalb, G. Children, labour supply and child care: Challenges for empirical analysis. Aust. Econ. Rev. 2009, 42, 276–299. [Google Scholar] [CrossRef]
- Li, H.; Zahniser, S. The determinants of temporary rural-to-urban migration in China. Urban Stud. 2002, 39, 2219–2235. [Google Scholar] [CrossRef]
- Song, Y.; Zheng, J.; Qian, W. To Be, or Not to Be: Rural Women’s Migration Decisions: A Case Study of the Yangtze River Delta. Chin. Econ. 2009, 42, 63–74. [Google Scholar] [CrossRef]
- Zhao, Y. Labor migration and returns to rural education in China. Am. J. Agric. Econ. 1997, 79, 1278–1287. [Google Scholar] [CrossRef]
- Zhao, Y. Labor migration and earnings differences: The case of rural China. Econ. Dev. Cult. Chang. 1999, 47, 767–782. [Google Scholar] [CrossRef]
- Duan, J.; Guo, Y.; Zhu, J. Property Security, Property Rights Cognition and the Inconsistent of Land Transfer Intention and Behavior. J. Huazhong Agric. Univ. Soc. Sci. Ed. 2021, 1, 156–164. [Google Scholar]
- Niu, X.; Wang, C.; Wu, G. Transfer Characteristics, Risk Perception and Land Transfer Satisfaction Degree—Based on a Survey of 1 008 Farmers in the Yangtze River Delta Region. Agric. Econ. Manag. 2020, 2, 45–55. [Google Scholar]
- Xu, M.; Lu, C.; Chen, G. A Study on the Farmers’ Wishes About Rural Land Circulation in Jiangsu Province. Res. Econ. Manag. 2012, 7, 66–74. [Google Scholar]
- Yang, W. The Impacts of Risk Perception and Risk Attitude on Rural Land Management Rights Transfer: An Empirical Example of Rural Land Management Rights Transfer in Jiaxing City, Zhejiang Province. China Land Sci. 2018, 32, 35–42. [Google Scholar]
- Song, H.; Jiang, H.; Zhang, S.; Luan, J. Does organization intervention in land transfer promote land plot consolidation? Based on micro data of large-scale farmers in Anhui and Shandong provinces. J. Hunan Agric. Univ. Soc. Sci. 2022, 23, 41–50. [Google Scholar]


Publisher’s Note: MDPI stays neutral with regard to jurisdictional claims in published maps and institutional affiliations. |
© 2022 by the authors. Licensee MDPI, Basel, Switzerland. This article is an open access article distributed under the terms and conditions of the Creative Commons Attribution (CC BY) license (https://creativecommons.org/licenses/by/4.0/).