Article

Co-Creating Climate Adaptation Pathways in Coastal Cities: A Practical Guide for Engaged Scholars and Urban Designers

by
Oswald Jenewein
1,* and
Michelle A. Hummel
2
1
School of Architecture, University of Texas at Arlington, Arlington, TX 76019, USA
2
Department of Civil Engineering, University of Texas at Arlington, Arlington, TX 76019, USA
*
Author to whom correspondence should be addressed.
Sustainability 2022, 14(23), 16046; https://doi.org/10.3390/su142316046
Submission received: 16 October 2022 / Revised: 17 November 2022 / Accepted: 28 November 2022 / Published: 1 December 2022
(This article belongs to the Section Sustainable Urban and Rural Development)

Abstract

:
As the repercussions of climate change materialize, coastal cities are often at the forefront of experiencing environmental impacts like flooding and storm events. In addition, anthropogenic vulnerability drivers, like industrial activity in the near-shore environment, may accelerate shoreline erosion or nuisance flooding through the loss of natural shoreline buffers and increased ship traffic. This interdisciplinary study applied a participatory mixed-methods approach, co-creating climate change adaptation pathways with community and stakeholder input as a bottom-up task. The aims were to engage in a community dialogue (1) identifying assets and challenges within the natural and built environment based on community input, (2) utilizing a participatory mixed-methods approach to model and quantify selected hazards, and (3) transforming them into adaptation pathways visualized in a comprehensive master plan. The small-town of Ingleside on the Bay, Texas, served as a case study for this project, highlighting how sea-level rise and industrial activity challenge the community, its natural and cultural environment, and the infrastructure within. The outcomes identify anthropogenic vulnerability drivers and propose a concrete list of seven adaptation pathways based on community input. This study helps engaged scholars and decision-makers to activate community members and their knowledge as an integral component of their work, from identifying a problem to developing tangible solutions.

1. Introduction

Climate adaptation of the built environment is an interdisciplinary task that involves architects, planners, engineers, the natural and social sciences. When assisting cities that aim to respond to environmental change, four primary adaptation options are described by the Intergovernmental Panel on Climate Change: (1) protect, (2) accommodate, and (3) retreat. Later, (4) avoid was added, completing this approach known as PARA [1]. In the process of identifying which one of these strategies fits best to respond to the manifold impacts of the climate crisis, adaptation pathways can be a tool to prepare research-based scenarios evaluating how a mix of these four options could provide tangible solutions for urban environments [2,3]. Furthermore, adaptation pathways are a diagnostic and analytical method aiming to develop adaptive strategies that address future risk scenarios and can be utilized to support design, planning, and decision-making processes [4,5]. As adaptation pathways consider changing conditions over time, these design, planning, and decision-making phases come with considerable uncertainty and often bear significant socio-economic impacts [6,7,8]. In order to develop adaptation pathways in urban environments holistically and build adaptive capacity within a community, both uncertainty and socio-economic impacts need to be considered [9,10]. Therefore, the involvement of residents, community groups, private and public stakeholders, industry and government representatives becomes a crucial component of the process itself [11].
Haasnoot et al. [12] argue that adaptation pathways are based on uncertainties and therefore need to be designed as “dynamic adaptive plans”. Similarly, Werners et al. [2] describe adaptation pathways as a “flexibility approach to sustainable urban development”, addressing uncertainty. In addition, Hallegatte [13] suggests that the decisions and strategies developed to tackle climate change are vulnerable to the uncertain impacts they aim to accommodate. Summarizing these approaches, Moser et al. [14] stress the need for effective engagement and communication processes when developing adaptation options in cities and communities. Therefore, this study approaches climate adaptation as an engaged scholarly activity, involving communities and stakeholders every step along the way. The literature already suggests that stakeholder involvement is a critical tool to address uncertainty and build acceptance around physical and socio-economic impacts [15]. However, it lacks to provide a generic framework on how to combine research-based approaches by proactively involving community members as an integral component of the research method.
This study proposes climate adaptation as a bottom-up task, starting at the community level. This approach makes community and stakeholder engagement less an analytical tool to measure impacts but rather a generative tool to develop adaptation pathways as a co-creative project. Involving residents as active players in the process of adapting cities to the challenges associated with the climate crisis is an opportunity for both the community itself and the experts, designers, and researchers involved [16]. The qualitatively collected community and stakeholder input informs objectives, methods, and outcomes, and therfore, shapes the entire study. With unfolding problems impacting coastal infrastructure, engaged scholarly activity may significantly benefit vulnerable communities in the process of identifying and understanding problems [17]. Building consensus within a community on the issues at stake, from acknowledging a problem to developing adaptation pathways, is as essential for the participatory process as it is for developing and assessing adaptation options [18].
The developed procedures in this study bring together a series of mixed methods as part of a Participatory Action Research (PAR) approach that aims to deliver adaptation pathways as tangible strategies and their associated actions [19]. This research provides a practical framework for engaged scholars addressing environmental topics in the built environment, decision-makers, and community members in the initial phase of developing adaptation pathways as a co-creative and bottom-up task. The Texas coastal town of Ingleside on the Bay is utilized as a case study to show a specific application of the proposed method as it is crucial to ground and apply engaged scholarly activities in specific places working with communities.

2. Materials and Methods

This study utilized a participatory mixed-methods research (MMR) and community-based participatory research (CBPR) approach to co-create climate adaptation pathways [20]. Tashakkori & Creswell [21] identify MMR as “research in which the investigator collects and analyses data, integrates the findings and draws inferences using both qualitative and quantitative approaches or methods in a single study”. Israel et al. [22] describe CBPR as a framework for community-research partnerships addressing local issues in distinct contexts. These approaches can be combined in mixed methods community-based participatory research (MMCBPR) as described by DeJonckheere et al. [20]. PAR was chosen as a general framework for this study, as defined by Reason and Bradbury [23], who describe PAR as a democratic framework targeting the development of practical knowledge. It is context-specific and focuses on a group’s particular needs [19]. Within this framework, community members and stakeholders become active players, directly impacting the study itself, as the topics most relevant to a specific community are addressed first. This study synthesized CBPR, MMR, and PAR. The goals of combining these approaches were to (1) collect qualitative data based on community and stakeholder input, (2) co-create adaptation options and pathways, and (3) utilize data visualization to inform the dialogue between the research team and the community members. As climate models describe multi-decadal timeframes and come with considerable uncertainty, they often are difficult to comprehend on the community level [24]. Therefore, proper visualization and explanation of findings and outcomes was crucial for a continued dialogue between the researchers and the community members involved in the study [18].

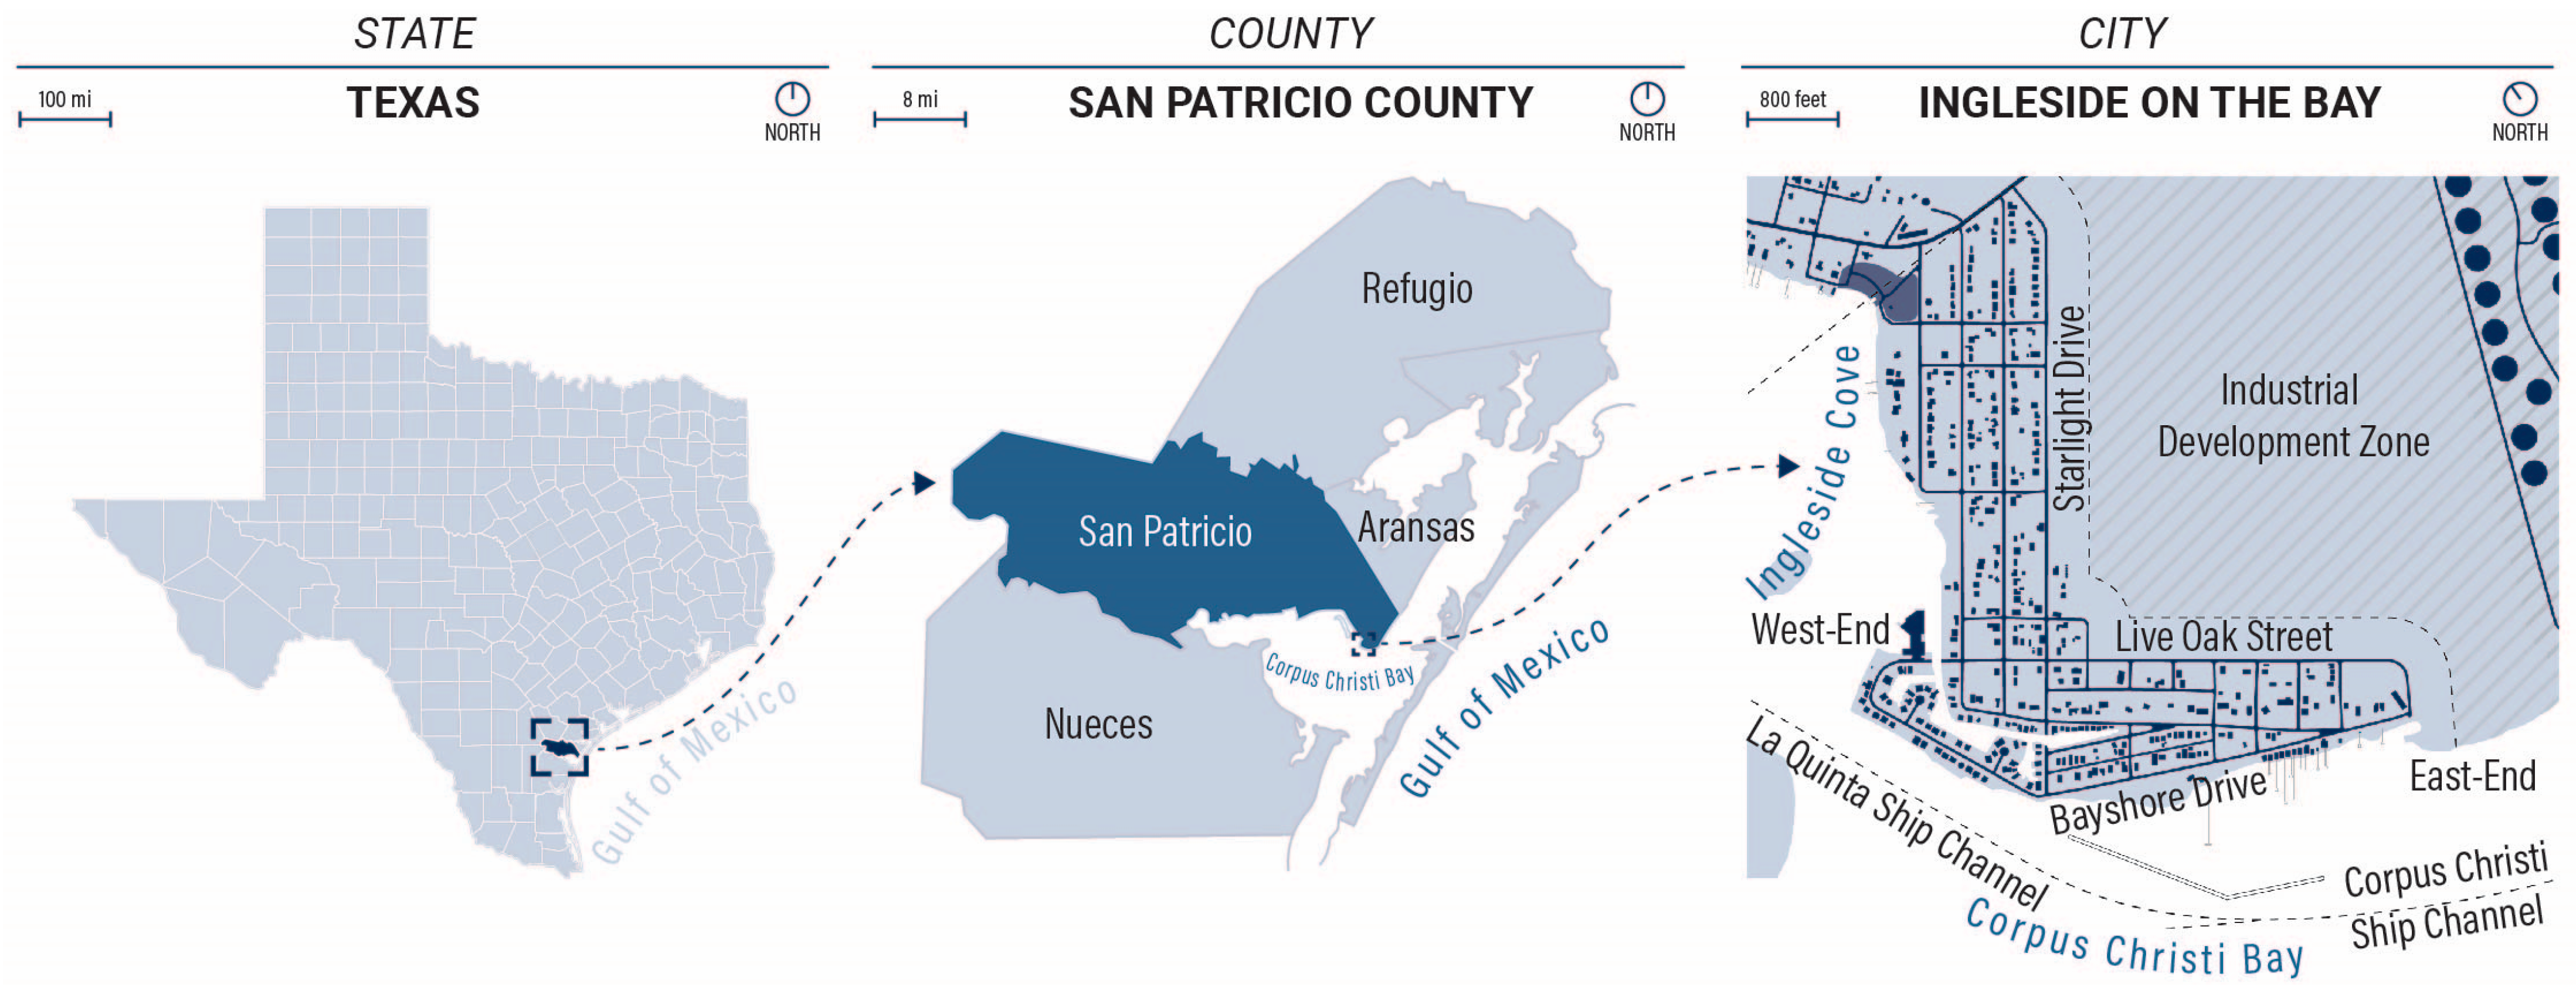
2.1. Case Study Area: Ingleside on the Bay, Texas Coast, Gulf of Mexico

This study is framed by two significant vulnerability drivers threatening the natural and built environment in coastal regions: (1) sea-level rise and (2) industrial growth. Historically, the Texas Coast has been prone to major storm events, including Hurricanes Ike in 2008 and Harvey in 2017. Most recently, Hurricane Hanna caused storm surge exceeding 4 ft (~1.20 m) in the Corpus Christi Bay region in July 2020 [25]. Alongside major storm events, cities along the Texas Gulf Coast have also experienced considerable rates of sea-level rise over the past two decades. While the highest relative sea-level rise along the Texas Coast was measured in Harris County with 6.55 ± 0.22 mm per year, Corpus Christi Bay saw 5.11 ± 1.06 mm of sea-level rise per year measured over the same time period [26]. Rising seas, more frequent and/or more intense storms, and the associated threats of flooding and storm surges will put communities, their natural and cultural environment, and their infrastructure even more at risk [27]. Besides the impacts of anthropogenic climate change, Texas’ petrochemical hubs along the Gulf of Mexico have been growing rapidly over the past six years and while the COVID-19 Pandemic decelerated global oil demand in 2020, the Ukraine Crisis led to increased petrochemical production in 2022 [28]. Texas’ seaports had almost doubled their export volume since December 2015, when new legislation lifted a forty-year ban on oil exports [29]. With the increased industrial activity, a variety of infrastructural projects are currently underway. These projects include pipeline construction, the deepening and widening of ship channels, and new industrial facilities in close proximity to residential areas [30].
Figure 1 shows the location of the city of Ingleside on the Bay (IOB), located in San Patricio County at Corpus Christi Bay. IOB serves as the specific case study for this project, as its unique location within Corpus Christi Bay makes it one of the most vulnerable cities in the region, experiencing both natural and human-caused impacts.
The impacts of anthropogenic climate change and human-caused vulnerability drivers contribute to nuisance and tidal flooding, accelerating challenges like shoreline erosion. Increased industrial ship traffic, larger vessels, and ship speed are factors impacting wake heights. These ship-wakes may be seen as additional impact factors contributing to more frequent nuisance flooding during high tide events [31]. Therefore, a mix of naturogenic and anthropogenic drivers need to be investigated to allow for a holistic risk assessment of communities, neighborhoods, and cities. Thus, the aims of choosing this case-study are to present the development process for the co-created adaptation pathways, discuss the results of community engagement and feedback efforts, and provide recommendations for additional research and design related to community-scale climate adaptation.

2.2. Participatory Research Design

The applied methods CBPR and PAR aim to connect places and communities through qualitative research. PAR provides an overarching framework during the engagement phase of a study. It is a commitment between the research team, collaborators, and community members to continuously engage in a dialogue and reflect upon each step of the process [32]. As a qualitative method, PAR allows the active involvement of the project team within a community and vice versa. In the initial research phase, community-generated information allows for a broad understanding of the problems residents see in their everyday life [33]. This information forms the basis for the research components of the work, which is informed by but not limited to community input. This study proposes a specific framework utilizing a PAR approach to structure the community dialogue, relating environmental topics to the community level.
This framework builds on a seven-step research design (Figure 2), aiming to (1) understand initial problems, define overall goals, and form a team, (2) engage local stakeholders and gather information, (3) analyze, verify, and structure information, (4) quantify climate change impacts and develop adaptation options, (5) define adaptation pathways and design future scenarios, (6) visualize and communicate findings and outcomes, and (7) reflect upon, present, and publish outcomes. While point two summarizes the engagement efforts, keeping stakeholders updated and informed throughout the study is critical.
The core element of engagement is the community workshop as it initiates the community dialogue and becomes the first point of contact between the research team and a broad range of stakeholders. Depending on the topics, population size, and scope of the study, one or several workshops can be conducted.

2.2.1. Community Workshop

A carefully planned workshop structure is important for successful engagement processes. The duration of the workshop needs to be chosen based on the scope of study, the expected number of participants, and the meeting date and time in alignment with overall goals. In this study, the workshop duration was set to 1.5 h given the community’s small size and to be respectful to the participant’s time as the community headed into additional engagement events hosted by other groups. Once the actual workshop begins, introductions, schedule, background, and goals are explained clearly. In this study, the four proposed discussion topics to identify assets and challenges were introduced. After four 20 min sessions, each participant had the opportunity to be part of each discussion topic. The discussion hosts helped to structure the comments and assemble synthesis boards using post-it notes or digital whiteboards.
Given the wide range of environmental challenges a community might face, the workshop structure needs to accommodate an equally wide range of potential comments. As concerned with impacts on the community, neighborhood, or city scale, the discussion topics were divided into Blue, Green, Gray, and Brown Infrastructure, as shown in Figure 3. Blue infrastructure focuses on the marine environment, including storms, resources, water quality, and water supply. Green infrastructure summarizes topics related to the natural environment, including landscape, ecology, fauna and flora, agriculture, and tourism. Gray infrastructure dives into the built environment, including infrastructure, transportation, and other human-made components. Brown infrastructure targets topics within the industrial environment, including industrial facilities, logistics and processes, contamination, and environmental impacts.
After the discussion groups are completed, a list of most-discussed assets and challenges is presented to the entire audience. This list serves as a basis for a collective discussion on potential strategies and actions. In the end, the team and participants agree on the most pressing issues discussed during the workshop and how they could be addressed through the study. While this form of qualitative data collection is an excellent tool to engage communities and stakeholders and to form an initial connection, the workshop can also serve as a quantitative data collection opportunity. An exit survey helps to quantify opinions on predefined topics, secure information to stay connected to participants, and measure the diversity of the engaged audience. It is crucial that the workshop participants feel that their voices are heard during the first meeting as it sets the trajectory for the following steps. Collecting email addresses ensures that regular updates can be sent to workshop participants. These updates inform the community on progress, allow for additional feedback, and can be utilized to make announcements about future meetings.
This study included two community workshops held in February 2020 and May 2021. Identifying community partners and involving their constituents is critical at the beginning of the participatory process, as the research team relies on such partnerships during the entire engagement phase [34,35]. Both workshops were conducted in collaboration with a local community-based organization, the Ingleside on the Bay Coastal Watch Association (IOBCWA), a non-profit organization run by concerned residents of IOB that the research team had already formed a relationship with through another project [36]. This collaboration was crucial to ensure a diverse representation of community members and stakeholders in this study. The initial community workshop included a mix of about 30 residents, representatives of community-based organizations (CBOs), and members of governmental entities in the 90-min-long event. After the introductions, participants were divided into four groups to discuss the proposed color-coded topics (Figure 3). Each of the four concurring discussions was facilitated by two team members who summarized and categorized the comments of approximately 6–8 people per table. The most-frequently mentioned items were presented in a closing discussion that allowed all participants to add significant assets and challenges within each category. In addition to the focus groups, individual interviews were conducted to gather in-depth information.
Several workshops might be necessary depending on the respective study. Towards the end of the study, a final workshop presents outcomes and invites participants to provide additional feedback.

2.2.2. Community Workshop Analysis and Reflection

After conducting the initial workshop, the team must carefully structure, evaluate, analyze, and reflect upon the gathered information. First, this information needs to be transcribed and then put into the major categories, following the initial questions of what are the (1) assets, (2) challenges, (3) strategies, and (4) actions associated with the respective topics. The focus group discussions aim to understand significant assets and challenges of the community, neighborhood, or city. Even though a frequency analysis is helpful to weigh each comment, the most critical comments of concern need to be agreed upon in the workshop itself, so participants have the opportunity to raise their voices as part of the discussion. While the closing discussion might already include some strategies and actions, these are mainly developed in the research phase after the workshop.
In the weeks after the community workshop, the team transcribed and digitalized the information to analyze and reflect upon the gathered data. Each of the mentioned items has been thoroughly evaluated and visualized, summarizing the most frequently mentioned comments on a chart. The goal of this analysis was to label participants’ comments as assets, challenges, or, if applicable, as strategies and actions in the respective field of blue, green, gray, and brown infrastructure. The outcome of this analysis provided a broad understanding of what the workshop participants identified as assets and challenges in their town and formed the basis for the research phase of the project (discussed in the following section). It is an important component of community-engaged work to keep the workshop participants informed on progress throughout the process, especially during the socially distanced time of the COVID-19 Pandemic. While in-person workshops were not possible and the community had limited access and knowledge about online meeting platforms at the time, regular email updates were sent to keep workshop participants informed on project progress and give opportunities for input. Additionally, online meetings with community leaders, representatives of community-based organizations, and local governments allowed for two-way communication on the project’s progress. Preliminary findings and outcomes were presented in a second community workshop in May 2021, after many COVID restrictions had been lifted, to give community members the opportunity to provide additional feedback and identify potential revisions and next steps. This second workshop was not presented as a final outcome but as the next step in the continued dialogue between the community and the research team. The final revisions of the project report have been shared with the community, the city-council and the mayor to form a basis for the city’s comprehensive development plan.

2.3. Mixed-Methods Research Design

To inform the development of climate adaptation pathways as a co-creative task, the participatory process becomes an integrated component of MMR. Given that the initial engagement phase guides the study’s objectives, the tools to inform the outcomes vary. Pacione, 1990 [37] describes urban analysis as a broad method utilizing multidisciplinary skills and knowledge to solve urban problems [38,39]. This assessment of a city’s urban and regional context and the historical, socio-economic, and cultural aspects, frames the current state of the respective urban area and provides the research-based background information needed to inform the community dialogue.

2.3.1. Geospatial and Statistical Data Analysis

Geospatial data and population statistics frame a neighborhood’s current and historical context by providing demographic and socio-economic information. Census data, open-source satellite images, and GIS data serve as a basis for this step and provide an initial overview of the urban morphology, land-use, and zoning. QGIS Hannover 3.16 [40] was used to retrieve land-use and zoning information locating residential, commercial, agricultural, or industrial zones and their proximity to each other and to understand the spatial relationships between the respective neighborhood and polluting sites. The gathered information is crucial in the process of identifying current and future development zones. Satellite images also provide data on the historical formation, development, growth and shrinking patterns. In coastal cities, historical satellite imagery unveils the formation of human-made canals, dredge islands, or shoreline protection infrastructure depicting the decade when specific projects were built and allowing for estimations of aging infrastructure without detailed network information.

2.3.2. Flood Hazard Mapping

The development of robust climate adaptation strategies and pathways requires an understanding of the potential hazards that the community may face in the future. While these predictions come with uncertainty, they can be used as initial indicators for adaptation. Digital elevation models show the topographical characteristics of the respective neighborhood or city. Such models provide basic topographical information as climate change impacts in coastal cities often are topographical challenges. Therefore, elevation models help to identify topographic vulnerability zones, such as low-lying areas prone to flooding [41].
In this study, water level exceedance probability data and regional sea-level rise scenarios for Rockport, Texas [42] were overlaid with tidal datums from the USS Lexington in Corpus Christi [43] to generate water surface elevations for mean higher high water (MHHW) and annual high water in 2020, 2040, 2060, 2080, and 2100. An intermediate rate of sea-level rise was assumed for the purpose of this study [44]. These water levels were overlaid with a 1-meter horizontal resolution digital elevation model (DEM) derived from LiDAR data collected in 2018 to map areas that would experience flooding under each sea-level rise scenario.
In addition to mapping sea-level rise flood hazards, an assessment of the potential magnitude of ship wakes in the area was also performed. Although not directly incorporated into the flood maps, this information was used to assess the likelihood of overtopping of shoreline infrastructure. More information on the ship wake study can be found in Jenewein & Hummel [31].

2.3.3. Developing Adaptation Options and Pathways

The previously described PAR and MMR approaches inform the process of co-creating adaptation pathways. The information gathered in the community workshops identifies a list of assets and challenges. To develop adaptation pathways, these assets and challenges need to be addressed through strategies and actions within a predefined future timeframe. A series of adaptation options can be considered based on these timeframes and the associated predictions for sea-level rise, Annual High Water (AHW), Mean Higher High Water (MHHW), and ship wake. In order to transform options into pathways, the relationship between each option needs to be investigated over time. In this study, the pathways were overlaid with the predicted flood hazard impacts, spanning from 2020, 2040, 2060, 2080, to 2100.

2.3.4. Visualizing Objectives, Methods, and Outcomes

Visualizing project goals, methods, and outcomes when conducting engaged scholarly studies is critical to keep communities and stakeholders informed and updated. This approach also helps to break complex topics down into a generally understandable visual language. Depending on the specific content of a study, a variety of tools can be utilized to visualize information [45].
In this study, Rhinoceros 7.0 [46] was utilized as a modeling software to build a topographical model based on Open Streetmaps [47] files. Similarly, existing buildings and infrastructure were modeled to provide a comprehensive digital model of specific parts of the city. These models were then exported to Adobe Illustrator [48] for post-editing, highlighting important information and adding descriptions. Lumion Pro [49], Adobe Premier and AfterEffects [48] were utilized for animation and postproduction of video footage. The aim of visualizing objectives, methods, and outcomes underlines the significants of workshop participants as a part of the study. It highlights how the participatory process impacts the research design itself.

3. Results & Discussion

3.1. Participatory Research Outcomes

Following the participatory process outlined in the methods section, an initial set of assets and challenges was defined in response to the first community workshop (Figure 4). The most frequently mentioned assets included (1) the natural beauty of IOB, (2) the location on Corpus Christi Bay offering unique sunset views, and (3) the independence from any major city and the ability to self-organize within the community. Likewise, a list of challenges was defined in the workshop. This list included challenges associated with (1) increased ship traffic on the La Quinta and Corpus Christi ship channels, causing increased wake, (2) beach and shoreline erosion in response to the increased speed of ship traffic, and (3) dredging activities for the deepening of the channel.
Assets and challenges combined provided the foundation for the adaptation options and pathways. The variety of topics mentioned in this list shows the importance of an open-ended discussion in a community dialogue.

3.2. Mixed-Methods Research Outcomes

3.2.1. Geospatial and Statistical Data

The urban analysis shows a series of significant findings to better contextualize the case-study area, highlighting some significant differences to the other cities in the region and state. At a median age of 51.1, about 45 percent of IOB’s 802 residents are 55 years or older, and 94.3 percent are white, including 25.6 percent Hispanic or Latino and 72.6 percent white alone [50]. These numbers demonstrate that IOB has a significantly older population compared to the State of Texas with an overall median age of 35.1 and only about 24 percent of the population being 55 years or older. Texas also has a more diverse demographic distribution of about 73 percent white, 12.3 percent Black or African American, and a 5 percent Asian population, looking at the three largest demographic groups [51]. The median household income was $85,469 as compared to the state median household income of $66,963 in 2020, while a total of 3.5 percent of the population lived below the poverty line as compared to the state average of 14.3 percent [52].
As one of several small cities around Corpus Christi Bay, IOB is part of the San Patricio County Municipal Water District and depends on the City of Ingleside for sanitary sewers. Electricity, gas, roadwork, and other utilities are supplied by third parties. The public infrastructure of the city is limited to Cove Park in the northwest and city hall and the volunteer fire department located centrally along Starlight Drive. A private Marina and a restaurant mark the west end of IOB along Bayshore Drive. An additional restaurant marks the west-end, and the IOB Beach Club, a membership-based organization, is located right in the center of the city’s southern shoreline.
In 1954, the Army Corps of Engineers dredged the La Quinta Ship Channel (LQSC), branching off from the Corpus Christi Ship Channel (CCSC). With the construction of these two channels, the landmass that is now Ingleside on the Bay had been formed in 1958. Ever since, the LQSC and CCSC have provided deepwater access to several industrial facilities west of IOB and east of Port Ingleside, and connect the Inner Harbor of the Port of Corpus Christi (POCC) to the Gulf Intercoastal Waterway (GIWW) and the Gulf of Mexico [53].
Currently, dredging processes aim to increase the channel depth of the CCSC from −47 feet Mean Lower Low Water (MLLW) to −54 feet MLLW and to widen the channel to 530 feet with a 400-foot wider barge shelf [54,55]. While the CCSC is located about 2500 feet off the southeast shore of IOB, the LQSC cuts directly along the southwest shoreline in immediate proximity to residential properties. To combat ship wake impacts several types of shoreline protection infrastructure have been installed over the past decades. In the 1960s and 70s, a number of bulkheads were installed on individual lots along Bayshore Drive. Given that these bulkheads are privately owned and maintained, it is up to the respective homeowner to renew or replace them. Given the age and environmental impacts like overtopping due to high water levels, several bulkheads have failed or are deteriorating. Neither increased ship traffic nor sea-level rise was taken into account for the design of the original bulkheads. Several measures have been taken along Bayshore Drive to mitigate flood impacts in recent years, including revetments near the Beach Club installed in 2014 by the POCC. Over the past years, the POCC has also constructed a 700-meter-long breakwater for habitat mitigation. With an elevation of 1.3 m above NAVD88, this fully completed breakwater now reduces wave action in response to ship wakes along the central segment of Bayshore Drive yet does not provide protection for the entire shoreline.

3.2.2. Flood Hazards Assessment

The results of the participatory engagement phase in this project show challenges related to ship-wake impacts, shoreline erosion, flooded streets and properties to be most significant to residents. Therefore, a flood hazard assessment provided crucial data informing the project outcomes. As this project’s primary goal was to develop climate adaptation pathways, the flood hazard assessment investigated current and future scenarios at twenty-year intervals from 2020 to 2100 and included sea-level rise projections (Figure 5).
Table 1 shows areas flooded at MHHW in purple, based on an intermediate sea-level rise scenario. These areas are estimated to experience flooding at high tide during the majority of the year, significantly impacting urban infrastructures like roads, yards, or parking lots. Areas flooded less frequently, approximately once per year, are shown in yellow. The maps not only show flood risks along IOB’s shoreline but also highlight the flood risk progression over time. Assessing and visualizing flood hazards in a timeline is critical when developing adaptation pathways to provide an overview of expected flood impacts for decades to come.
The results locate particularly vulnerable zones within the city. In particular, the area around the Beach Club will be impacted by flooding at annual high tide events under current conditions, a trend that IOB residents reported in the community workshop, and flooding in this area is projected to become more frequent in the future. Overtopping of existing bulkheads along Bayshore Drive is another problem likely to increase in the future. Both high tide events and ship wakes are major contributors to overtopping bulkheads. Projections for 2040–2060 suggest flooding of most areas along Bayshore Drive and the properties along IOB’s canal during a daily tidal cycle. Chronic disruptions within the urban infrastructure would therefore impact the everyday life of IOB’s residents if no actions are taken. The flooding of roads would also disrupt the accessibility of IOB’s east-end and west-end. By the end of the century, most areas along Bayshore Drive, Sandpiper Street, and around Cove Park are projected to experience flooding during the daily tidal cycle. Besides the impact on waterfront properties along the shore and canal, the boat ramp at Cove Park would be inaccessible, limiting public bay access for residents and visitors.

3.2.3. Adaptation Options and Pathways

Prior to the development of adaptation pathways, a series of adaptation options need to be considered. This step allows the design/research team to address both research and community-based challenges separately before several options may be combined, put in sequence, or identified as unnecessary in addition to another option. The following adaptation options aim to address major challenges associated with industrial growth and sea-level rise and respond to both research findings and community and stakeholder input. The locations of each option are shown in Figure 6.
  • Breakwater to reduce ship-wake impacts
    • IOB’s existing breakwater protects the central shoreline of Bayshore Drive. Adding another breakwater towards the city’s east-end would mitigate ship-wake impacts along most of Bayshore Drive facing the CCSC. The construction of additional breakwaters towards IOB’s west-end is not possible given the proximity to the LQSC.
  • Shoreline protection to reduce erosion
    • Both engineered and natural structures could provide shoreline protection for IOB’s waterfront. However, limited space along most of Bayshore Drive requires compactly engineered structures like the existing bulkheads. Around the Beach Club, wetland restoration efforts could be implemented, given the available space. In addition, this area is already protected by the existing breakwater and, therefore, not exposed to intense wake activity. Nature-based shoreline protection strategies to raise elevation include wetland restoration, mangrove habitat or beach nourishment. These strategies help create buffer zones between the residential zones of IOB and the industrial neighbors.
  • Install tide gate to prevent flooding of the canal
    • In addition to the low-lying areas along Bayshore Drive, flooding in IOB can also occur from the canal. To prevent the flooding of canal front properties, a tide gate at the mouth of the canal could provide substantial flood reduction benefits. Deploying the proposed flood gate during high-tide events could then prevent excess water from entering the canal.
  • Elevate buildings and infrastructure to prevent flooding
    • The concept of elevating structures in flood-prone coastal zones can be applied to the individual building scale or on the infrastructural scale. The Federal Emergency Management Agency (FEMA) provides a series of strategies to protect buildings [56]. In IOB, a variety of flood protection measures have already been taken, including raising existing structures and elevating new buildings. Ground elevation of roads and driveways can be raised with fill to prevent flooding and to ensure property access.
  • Improve road networks to enhance evacuation processes
    • Currently, IOB’s east and west end areas are cul-de-sacs. Flood events along Bayshore Drive will prevent access to several properties if no action is implemented. To ensure permanently accessible evacuation routes, the construction of two bridges along Bayshore Drive and Live Oak Street at the west end Marina and across the canal at Starlight drive is recommended. Furthermore, extending Bayshore Drive and Live Oak Street at the city’s east end will provide another loop and evacuation path rather than a dead end.
  • Increase connectivity across the bay to improve regional integration
    • IOB is approximately 30 min away from Downtown Corpus Christi, the closest urban center in the region and the only hospital. IOB is also located away from Padre and Mustang Island, the major tourist centers. Providing access to public transportation, on land and water, would enhance IOB’s role and deliver better regional integration. Water born transportation could also reduce the travel time to Downtown Corpus Christi and its hospitals and provide access for residents to other parts of the bay and visitors to IOB.
  • Monitor air and water quality to inform residents on potential health risks
    • Given the proximity to industrial facilities, utilizing both land and water, it is recommended to track potential pollutants that could cause health risks. Besides the release of greenhouse gases, several potentially harmful particles may cause health risks. Furthermore, it is crucial that such information is made publicly available to all residents to ensure a just urban environment.
After combining the community and research-based information to develop the seven adaptation options mentioned in the previous paragraph, the development of adaptation pathways now places these options on a timeline (Figure 7). The goal is to assess the co-dependency of each option and how they relate to the expected environmental impacts.
  • Timeframe 2020–2040
    • Monitoring air and water quality is recommended as an immediate strategy to identify potential health risks for for residents, fauna and flora alike. Adaptation options 1–4, including (1) building the additional breakwater, (2) construction of the tidal gate, (3) improving the shoreline protection along the bay and canal, and (4) raising the elevation of infrastructure all provide flood reduction benefits. By 2040, however, the effectiveness of the proposed breakwater will have diminished, as rising sea levels accelerate ship wake impacts. Option 2 alone would then also not be able to prevent flooding, but could only work in combination with other shoreline protection improvements.
  • Timeframe 2040–2060
    • Constructing the two proposed bridges and the road connecting Bayshore Drive and Live Oak Street east-end, is recommended before 2040, when the roads bayward of Sandpiper Street would be flooded during high tide events for the majority of the year. Similarly, public transportation options providing efficient evacuation routes is crucial. Improving the shoreline protection infrastructure along Bayshore Drive as the initial adaptation strategy could make both breakwater and tide gate obsolete to begin with and therefore reduce costs. However, this strategy alone will not be able to prevent flooding in IOB during the 80-year planning horizon used for this project.
  • Timeframe 2060–2080
    • Excessively high bulkheads reaching 1 m above ground level would be needed by 2060 to provide protection and mitigate coastal flooding and ship wake impacts. Once bulkheads overtop, they become a hazard preventing flood waters from draining back into the bay. At a certain point, the required bulkhead height to provide effective flood protection would interfere with coastal views and impact property values.
  • Timeframe 2080–2100
    • By the end of the century, large areas along Sandpiper Street and Bayshore Drive need to be raised to an elevation of 1.8 m or higher to prevent annual flooding. Such an undertaking requires 1.5 m of fill and would cause substantial disruptions during extended construction periods. While this option requires a substantial amount of funding, it also provides the greatest long-term benefits by preventing a city from being flooded for the majority of the year.
While the managed retreat from coastal areas is an adaptation tool applicable to cities along the Gulf of Mexico, as described by Sandifer & Scott 2021 [57], it does not seem to be a viable option for many communities right now. This study did not include the retreat option as residents felt strongly about protecting their community and investigating how to tackle climate change impacts without giving up their city. Future steps include policy-based strategies that could also impact the need for certain adaptation options proposed in this study. Reducing the ship speed in the LQSC and CCSC, for instance, may eliminate the need for a breakwater as reduced ship speed also reduces wake impact on the shoreline. Reduced wake heights would then also limit associated flooding and erosion hazards. In addition, concerns around water and air quality can be addressed by installing sensors around the city. While such sensors would not resolve a pollution issue, they could inform residents about potential threats. Certainly, policy changes on air quality would be an effective tool to ensure the health and well-being of all members of the coastal ecosystem

3.2.4. Visualizing Outcomes

The proposed adaptation pathways have been summarized in a short-film that outlines the process of co-creating the respective outcomes [58]. Presenting a list of proposed adaptation pathways to the community does not mark the project’s end but rather the next step in a continued dialogue. Compared to similar studies, the focus on visualizing goals, methods, and outcomes throughout the process has proven to be a successful tool for forming and informing academic-civic partnerships and allowing for the successful formation of additional engaged studies and projects.

4. Summary & Conclusions

This paper proposes developing climate adaptation pathways for cities as a co-creative task. This process requires the formation of academic-civic partnerships embedding the research within a specific community. As a context-based approach, this engaged scholarly process is an opportunity to build adaptation pathways with a community as a bottom-up undertaking, activating local knowledge. Step by step, community members, private and public stakeholders, and the research team informed each other as well as the study. In addition to the community workshops, regular emails were sent to workshop participants to provide updates and the opportunity for additional feedback.
This paper urges that co-creating climate adaptation pathways with communities requires interdisciplinary teams of experts to allow for a variety of potential outcomes. If goals are too narrowly defined in the initial phase of engaging a community, participants might feel that their voices are not heard. To address some of these comments outside the scope of this study, two follow-up projects were defined and awarded NSF funding (Awards 2125234 & 2231557) to develop a sociotechnical network on environmental monitoring. Therefore, the commitment of the research team to respond to various comments and concerns raised by the workshop participants enabled a longer-term academic-civic partnership and secured a continued community dialogue beyond this study.
Visualization and communication as part of the community dialogue are important to show how the respective comments are addressed. Regular meetings with community leaders and representatives of community-based organizations and local governments enable two-way communication in the process of developing a project. It is crucial to build trust with stakeholders and take their input seriously. To do so, the respective framework utilized to structure the community dialogue should allow for specific discussions on the chosen topics yet provide the freedom to incorporate unexpected comments. It is then for the project team to decide which challenges can be addressed in a project, how a team might have to grow into a new area of expertise, or whether a topic can be addressed as part of a future undertaking. In each scenario, the goal is to show that critical comments are heard and receive a response. This paper provides a practical outline of how to structure such a community dialogue.
Presenting the proposed adaptation pathways as interdependent strategies and not stand-alone options is crucial. Simultaneously each option should be understood as a process, looking at the entire lifetime. Identifying potential tipping points and associated thresholds triggering a transition to different adaptation strategies is important as the environmental impacts of climate change and industrial development in the region may occur faster than expected. The research team needs to communicate these uncertainties clearly, as described in this paper.
It is crucial to assess and analyze community input with predefined standards to ensure a generally applicable approach. This study shows how (1) participatory engagement frames the research process, how (2) a mixed-methods approach allows for flexibility when developing outcomes in response to stakeholder feedback, and how (3) visualizing and engaging in a community dialogue supports informing residents and decision-makers about what they need to adapt to. Therefore, this paper serves as a field guide for engaged scholars and designers when planning and executing a participatory study. Limitations of this study that will be addressed in future work include a quantitative component of gathering and evaluating community input to complement qualitative data collection.
In conclusion, the challenge of studies that are both interdisciplinary and engaging non-academic partners is to clearly identify the role of each collaborator or group within the project team. The question of how community-based information is gathered and then utilized within the project is equally as important as the question of what the respective disciplines contribute to the project, its methods, and its results. Similarly, potential disruptions in the participatory process require creative problem-solving, especially in the times of a global pandemic when in-person meetings and travel are reduced, if not impossible. While first emails and later online meetings were practical tools to reach community leaders, the COVID-19 restrictions made it difficult to communicate with a larger audience at once and to reach workshop participants with limited access to digital resources and communication platforms. Given that the engagement process took place at the beginning of the 2020 Pandemic, online platforms were not as commonly used as later on. Lastly, it is crucial to foster the community partnerships created throughout the project and to identify the next steps of collaboration, ensuring continued engagement. This study was used to strengthen existing relationships between the research team and the community and expand local and regional outreach for the mentioned follow-up projects. It was a tool for advocacy and providing a practical framework for adaptation pathways that formed the basis for discussions on the city’s comprehensive plan and informed future projects.

Author Contributions

O.J. contributed the overall framework, conceptualization, participatory methods, data analysis, data visualization, and the respective writing, review, and editing. M.A.H. contributed to the Flood Hazard Assessment in the mixed-methods section and the respective writing, review, and editing. All authors have read and agreed to the published version of the manuscript.

Funding

This research received no external funding.

Institutional Review Board Statement

The study was conducted in accordance with the Declaration of Helsinki, and approved by the Institutional Review Board of the University of Texas at Arlington. Approval Number 2019-0161.

Informed Consent Statement

Informed consent was obtained from all subjects involved in the study.

Data Availability Statement

Not applicable.

Conflicts of Interest

The authors declare no conflict of interest.

References

  1. Houghton, J.T.; Jenkins, G.J.; Ephraums, J.J. (Eds.) Climate Change: The IPCC Scientific Assessment; Intergovermmental Panel on Climate Change; Press Syndicate of the University of Cambridge: New York, NY, USA, 1990. [Google Scholar]
  2. Werners, S.E.; Wise, R.M.; Butler, J.R.A.; Totin, E.; Vincent, K. Adaptation pathways: A review of approaches and a learning framework. Environ. Sci. Policy 2021, 116, 266–275. [Google Scholar] [CrossRef]
  3. Albers, R.A.W.; Bosch, P.R.; Blocken, B.; van den Dobbelsteen, A.A.J.F.; van Hove, L.W.A.; Spit, T.J.M.; van de Ven, F.; van Hooff, T.; Rovers, V. Overview of challenges and achievements in the climate adaptation of cities and in the Climate Proof Cities program. Build. Environ. 2015, 83, 1–10. [Google Scholar] [CrossRef] [Green Version]
  4. Lin, B.B.; Capon, T.; Langston, A.; Taylor, B.; Wise, R.; Williams, R.; Lazarow, N. Adaptation Pathways in Coastal Case Studies: Lessons Learned and Future Directions. Coast. Manag. 2017, 45, 384–405. [Google Scholar] [CrossRef]
  5. Buurman, J.; Babovic, V. Adaptation Pathways and Real Options Analysis: An approach to deep uncertainty in climate change adaptation policies. Policy Soc. 2016, 35, 137–150. [Google Scholar] [CrossRef] [Green Version]
  6. Haasnoot, M.; Brown, S.; Scussolini, P.; Jimenez, J.A.; Vafeidis, A.T.; Nicholls, R.J. Generic adaptation pathways for coastal archetypes under uncertain sea-level rise. Environ. Res. Commun. 2019, 1, 71006. [Google Scholar] [CrossRef]
  7. Ranger, N.; Reeder, T.; Lowe, J. Addressing ‘deep’uncertainty over long-term climate in major infrastructure projects: Four innovations of the Thames Estuary 2100 Project. EURO J. Decis. Process. 2013, 1, 233–262. [Google Scholar] [CrossRef] [Green Version]
  8. Mortreux, C.; Barnett, J. Adaptive capacity: Exploring the research frontier. Wiley Interdiscip. Rev. Clim. Chang. 2017, 8, e467. [Google Scholar] [CrossRef]
  9. Cinner, J.E.; Adger, W.N.; Allison, E.H.; Barnes, M.L.; Brown, K.; Cohen, P.J.; Gelcich, S.; Hicks, C.C.; Hughes, T.P.; Lau, J. Building adaptive capacity to climate change in tropical coastal communities. Nat. Clim. Chang. 2018, 8, 117–123. [Google Scholar] [CrossRef] [Green Version]
  10. Hummel, M.A.; Wood, N.J.; Schweikert, A.; Stacey, M.T.; Jones, J.; Barnard, P.L.; Erikson, L. Clusters of community exposure to coastal flooding hazards based on storm and sea level rise scenarios—Implications for adaptation networks in the San Francisco Bay region. Reg. Environ. Chang. 2018, 18, 1343–1355. [Google Scholar] [CrossRef]
  11. Sheppard, S.R.J.; Shaw, A.; Flanders, D.; Burch, S.; Wiek, A.; Carmichael, J.; Robinson, J.; Cohen, S. Future visioning of local climate change: A framework for community engagement and planning with scenarios and visualisation. Futures 2011, 43, 400–412. [Google Scholar] [CrossRef]
  12. Haasnoot, M.; Kwakkel, J.H.; Walker, W.E.; ter Maat, J. Dynamic adaptive policy pathways: A method for crafting robust decisions for a deeply uncertain world. Glob. Environ. Chang. 2013, 23, 485–498. [Google Scholar] [CrossRef] [Green Version]
  13. Hallegatte, S. Strategies to adapt to an uncertain climate change. Glob. Environ. Chang. 2009, 19, 240–247. [Google Scholar] [CrossRef]
  14. Moser, S.C.; Pike, C. Community engagement on adaptation: Meeting a growing capacity need. Urban Clim. 2015, 14, 111–115. [Google Scholar] [CrossRef]
  15. Schroder, K.; Hummel, M.A.; Befus, K.M.; Barnard, P.L. An integrated approach for physical, economic, and demographic evaluation of coastal flood hazard adaptation in Santa Monica Bay, California. Front. Mar. Sci. 2022, 9, 1052373. [Google Scholar] [CrossRef]
  16. Egerer, M.; Haase, D.; McPhearson, T.; Frantzeskaki, N.; Andersson, E.; Nagendra, H.; Ossola, A. Urban change as an untapped opportunity for climate adaptation. Npj Urban Sustain. 2021, 1, 22. [Google Scholar] [CrossRef]
  17. Adger, W.N. Social capital, collective action, and adaptation to climate change. Der Klimawandel 2010, 1, 327–345. [Google Scholar]
  18. Barnett, J.; Graham, S.; Mortreux, C.; Fincher, R.; Waters, E.; Hurlimann, A. A local coastal adaptation pathway. Nat. Clim. Chang. 2014, 4, 1103–1108. [Google Scholar] [CrossRef]
  19. Baum, F.; MacDougall, C.; Smith, D. Participatory action research. J. Epidemiol. Community Health 2006, 60, 854. [Google Scholar] [CrossRef] [Green Version]
  20. DeJonckheere, M.; Lindquist-Grantz, R.; Toraman, S.; Haddad, K.; Vaughn, L.M. Intersection of mixed methods and community-based participatory research: A methodological review. J. Mix. Methods Res. 2019, 13, 481–502. [Google Scholar] [CrossRef]
  21. Tashakkori, A.; Creswell, J.W. The new era of mixed methods. J. Mix. Methods Res. 2007, 1, 3–7. [Google Scholar] [CrossRef]
  22. Israel, B.A.; Schulz, A.J.; Parker, E.A.; Becker, A.B.; Allen, A.J.; Guzman, J.R.; Lichtenstein, R. Critical issues in developing and following CBPR principles. Community-Based Particip. Res. Health Adv. Soc. Health Equity 2017, 3, 32–35. [Google Scholar]
  23. Reason, P.; Bradbury, H. Inquiry and participation in search of a world worthy of human aspiration. Handb. Action Res. Particip. Inq. Pract. 2001, 1, 1–14. [Google Scholar]
  24. Leviston, Z.; Price, J.; Bishop, B. Imagining climate change: The role of implicit associations and affective psychological distancing in climate change responses. Eur. J. Soc. Psychol. 2014, 44, 441–454. [Google Scholar] [CrossRef]
  25. Kimberlain, T.B.; Blake, E.S.; Cangialosi, P. National Hurricane Center Tropical Cyclone Report. Hurricane Patricia. 2015; pp. 1–32. Available online: https://www.nhc.noaa.gov/data/tcr/EP202015_Patricia.pdf (accessed on 27 June 2022).
  26. NOAA. Sea Level Trends. Available online: https://tidesandcurrents.noaa.gov/sltrends/sltrends.html (accessed on 25 April 2021).
  27. Sweet, W.; Park, J.; Marra, J.; Zervas, C.; Gill, S. Sea Level Rise and Nuisance Flood Frequency Changes around the United States; NOAA technical report NOS CO-OPS; 073; NOAA: Washington, DC, USA, 2014; p. 58. Available online: https://repository.library.noaa.gov/view/noaa/30823 (accessed on 12 June 2022).
  28. EIA, U.S. Energy Information Administration. Crude Oil Imports and Exports through the Port District of Houston-Galveston District. Available online: http://www.eia.gov/todayinenergy/detail.cfm?id=25372 (accessed on 25 April 2021).
  29. EIA, U.S. Energy Information Administration. Export of Petrolium & other Liquids. Available online: https://www.eia.gov/dnav/pet/pet_move_exp_a_EP00_EEX_mbblpd_a.htm (accessed on 25 April 2021).
  30. Port of Corpus Christi Authority Projects and Development, Port of Corpus Christi. Available online: https://portofcc.com/business/business-opportunities/projects/ (accessed on 8 June 2021).
  31. Jenewein, O.; Hummel, M.A. Developing Climate Adaptation Pathways with Communities Impacted by Sea-Level Rise and Industrial Development. In Proceedings of the World Environmental and Water Resources Congress 2021, held online, 7–11 June 2021; pp. 888–900. [Google Scholar]
  32. McIntyre, A. Participatory Action Research; Sage Publications: Thousand Oaks, CA, USA, 2007; ISBN 1483389391. [Google Scholar]
  33. Boylston, S. Designing with Society: A Capabilities Approach to Design, Systems Thinking and Social Innovation; Routledge: London, UK, 2019; ISBN 1351372068. [Google Scholar]
  34. Berke, P.R.; Quiring, S.M.; Olivera, F.; Horney, J.A. Addressing challenges to building resilience through interdisciplinary research and engagement. Risk Anal. 2021, 41, 1248–1253. [Google Scholar] [CrossRef]
  35. Sullivan, J.; Diamond, P.D.; Kaplan, C.L.; Mader, T.J.; Santa, R.; Lloyd, R.S. Community outreach as an iterative dialogue among scientists and communities in the Texas gulf coast region. Mutat. Res. Mutat. Res. 2003, 544, 331–338. [Google Scholar] [CrossRef]
  36. IOBCWA Ingleside on the Bay Coastal Watch Association. Available online: https://www.iobcwa.org/ (accessed on 17 April 2022).
  37. Pacione, M. Urban liveability: A review. Urban Geogr. 1990, 11, 1–30. [Google Scholar] [CrossRef]
  38. Páez, A.; Scott, D.M. Spatial statistics for urban analysis: A review of techniques with examples. GeoJournal 2004, 61, 53–67. [Google Scholar] [CrossRef]
  39. Pacione, M. Urban Problems (Routledge Revivals): An Applied Urban Analysis; Routledge: London, UK, 2014; ISBN 1315886650. [Google Scholar]
  40. QGIS 3.16 Hannover. Available online: https://www.qgis.org/en/site/forusers/visualchangelog316/index.html (accessed on 23 June 2022).
  41. Strauss, B.H.; Ziemlinski, R.; Weiss, J.L.; Overpeck, J.T. Tidally adjusted estimates of topographic vulnerability to sea level rise and flooding for the contiguous United States. Environ. Res. Lett. 2012, 7, 14033. [Google Scholar] [CrossRef]
  42. NOAA.; U.S.N.O.; A.A. Tidal Station 8774770 Rockport, TX, USA. Available online: https://tidesandcurrents.noaa.gov/stationhome.html?id=8774770 (accessed on 22 May 2022).
  43. NOAA.; U.S.N.O.; A.A. Tidal Station 8775296 USS Lexington, Corpus Christi Bay, TX, USA. Available online: https://tidesandcurrents.noaa.gov/ports/ports.html?id=8775296 (accessed on 22 May 2022).
  44. NOAA.; U.S.N.O.; A.A. Tides and Currents. Available online: https://tidesandcurrents.noaa.gov/ (accessed on 20 November 2020).
  45. Newell, R.; McCarthy, N.; Picketts, I.; Davis, F.; Hovem, G.; Navarrete, S. Communicating complexity: Interactive model explorers and immersive visualizations as tools for local planning and community engagement. Facets 2021, 6, 287–316. [Google Scholar] [CrossRef]
  46. Robert McNeel & Associates Rhinoceros 7.0. Available online: https://www.rhino3d.com/ (accessed on 27 April 2022).
  47. Mapbox Openstreetmap. Available online: https://www.mapbox.com/ (accessed on 21 April 2022).
  48. Adobe Creative Cloud. Available online: https://www.adobe.com/creativecloud.html (accessed on 21 April 2022).
  49. Act-3D Lumion. Available online: https://lumion.com/ (accessed on 21 April 2022).
  50. US Census Data. Available online: https://data.census.gov/cedsci/all?q=ingleside+on+the+bay (accessed on 25 April 2021).
  51. US Census Data. Available online: https://data.census.gov/cedsci/table?q=texas&tid=PEPPOP2019.PEPANNRES (accessed on 25 April 2021).
  52. US Census Ingleside on the Bay, TX. Available online: https://censusreporter.org/profiles/16000US4836020-ingleside-on-the-bay-tx/ (accessed on 12 March 2022).
  53. City of Ingleside, Texas. History of Ingleside. Available online: https://inglesidetx.gov/ingleside-history (accessed on 27 April 2021).
  54. Hamilton, P.; Wood, E.; Lin, L.; Campbell, T. Alternatives to Manage Sediment at the Intersection of the Gulf Intracoastal Waterway (GIWW) and the Corpus Christi Ship Channel (CCSC). USACE Eng. Res. Dev. Cent. 2018, 18, 1–15. [Google Scholar]
  55. USACE Galveston District Awards Second Corpus Christi Ship Channel Dredging Contract. Available online: https://www.swg.usace.army.mil/Media/News-Releases/Article/2143920/usace-galveston-district-awards-second-corpus-christi-ship-channel-dredging-con/ (accessed on 27 April 2021).
  56. FEMA Elevating Your House. Homeown. Guid. Retrofit. 2014, 3, 87–107.
  57. Sandifer, P.A.; Scott, G.I. Coastlines, Coastal Cities, and Climate Change: A Perspective on Urgent Research Needs in the United States. Front. Mar. Sci. 2021, 8, 631986. [Google Scholar] [CrossRef]
  58. Jenewein, O. Short-Film: Ingleside on the Bay: A Resilient Waterfront for a Texas Coastal Town. Available online: https://www.youtube.com/watch?v=nsOjIPvwIh0&t=10s&ab_channel=FUELED (accessed on 5 August 2022).
Figure 1. Ingleside on the Bay is located in San Patricio County on the Texas coast.
Sustainability 14 16046 g001
Figure 2. Overview of the participatory process utilized in this study.
Sustainability 14 16046 g002
Figure 3. Structure for discussion groups during the community workshop(s).
Sustainability 14 16046 g003
Figure 4. List of six major assets and ten major challenges as defined in the community workshop conducted in Ingleside on the Bay in February 2020. The points are listed from most frequently mentioned at the top to least frequently mentioned at the bottom.
Sustainability 14 16046 g004
Figure 5. Projected sea-level rise for Ingleside on the Bay in reference to NAVD88. The bars show the Mean Higher High Water (MHHW) in light blue and the Annual High Water (AHW) in dark blue.
Sustainability 14 16046 g005
Figure 6. Proposed master-plan of Ingleside on the Bay, including the adaptation options described in the previous paragraphs.
Sustainability 14 16046 g006
Figure 7. Proposed adaptation pathways.
Sustainability 14 16046 g007
Table 1. Flood maps from 2020–2100. Yellow areas show Annual High Water (AHW), purple areas show Mean Higher High Water (MHHW).
YearFlood MapsFlood Impacts
2020Sustainability 14 16046 i001
  • Annual flooding around the Beach Club and the center of the Bayshore Drive waterfront;
  • Annual flooding along the shores of the spoil islands in Ingleside Cove
2040Sustainability 14 16046 i002
  • Frequent minor flooding around the Beach Club
  • Annual flooding of several roads along Bayshore Drive and along the canal
  • Overtopping of bulkheads along Bayshore Drive and along the canal
2060Sustainability 14 16046 i003
  • Frequent flooding around the Beach Club
  • Frequent overtopping of bulkheads along the canal
  • Widespread annual overtopping of bulkheads along Bayshore Drive
2080Sustainability 14 16046 i004
  • Frequent flooding of the boat ramp at Cove Park and most properties bayward of Sandpiper
  • Annual flooding of the boat ramp and adjacent parking lot at Cove Park and additional properties bayward of Sandpiper
2100Sustainability 14 16046 i005
  • Frequent flooding of the boat ramp and adjacent parking lot at Cove Park and almost all properties bayward of Sandpiper
Publisher’s Note: MDPI stays neutral with regard to jurisdictional claims in published maps and institutional affiliations.

