

Optimizing Maize Belt Width Enhances Productivity in Wheat/Maize Intercropping Systems

Abstract
:1. Introduction
2. Materials and Methods
2.1. Experimental Site
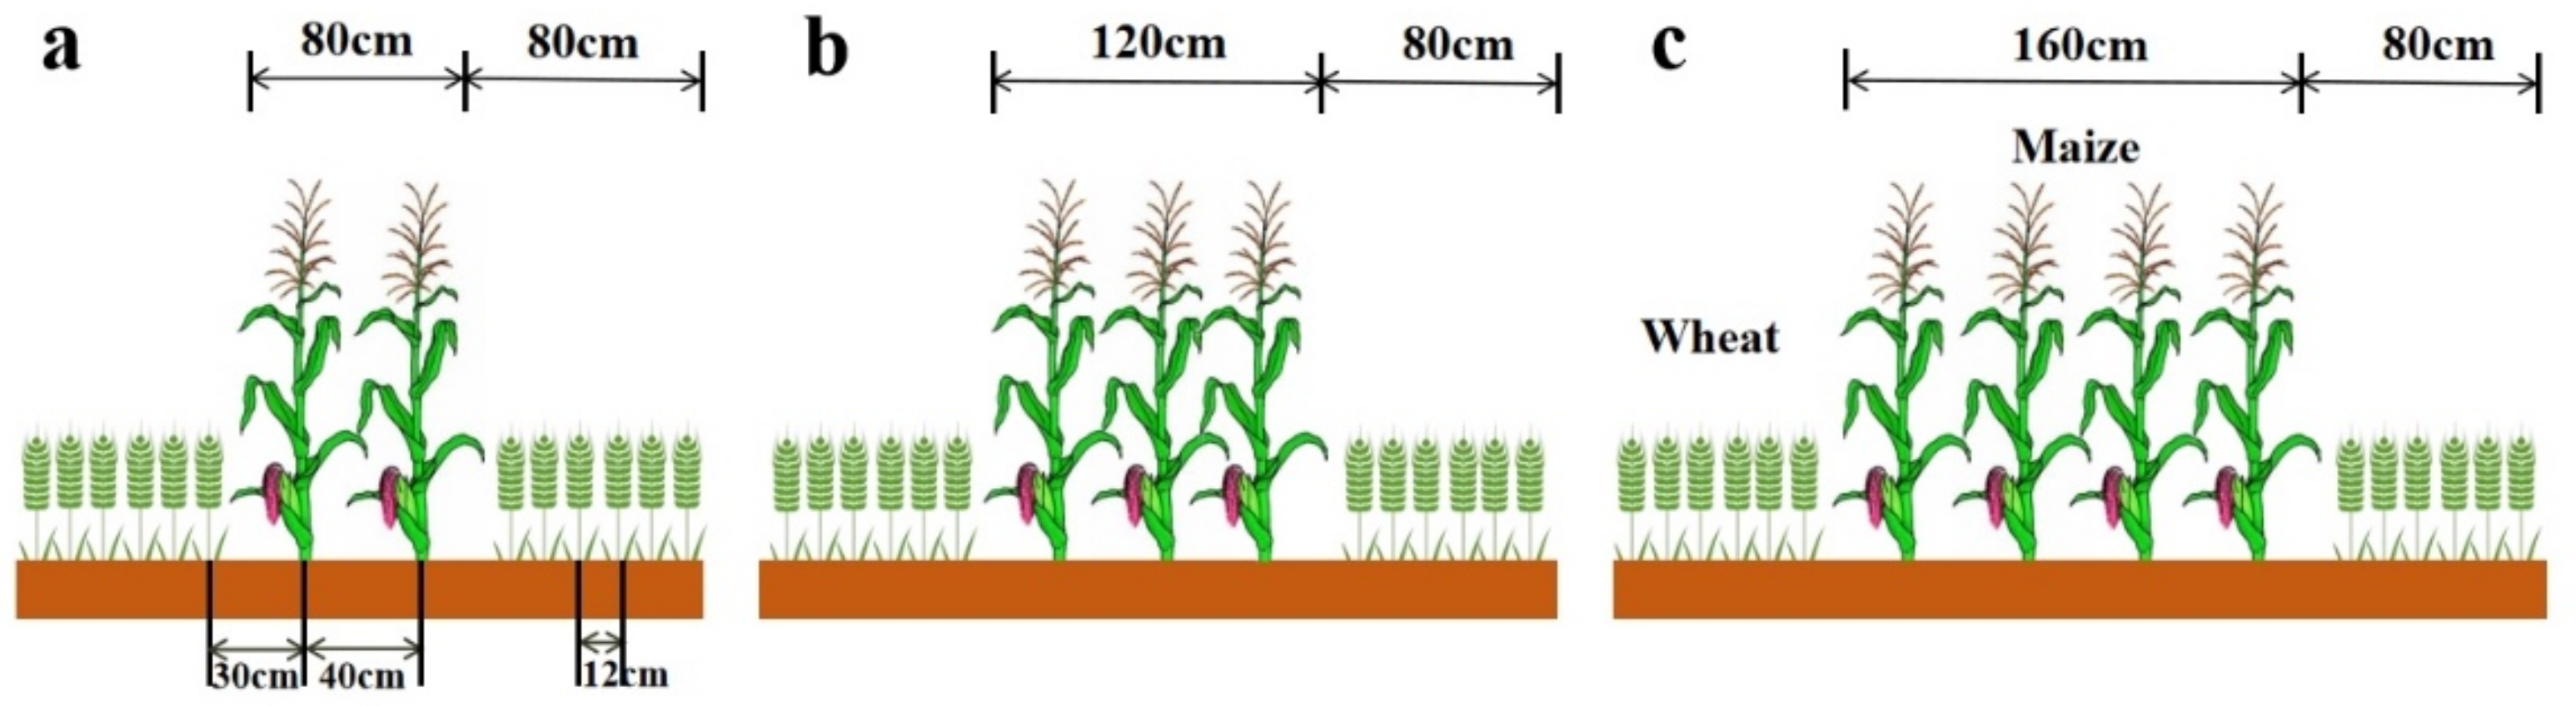
2.2. Experimental Design and Plot Management
2.3. Measurements and Calculations
2.3.1. Grain Yield
2.3.2. Land Equivalent Ratio (LER) and Partial Land Equivalent Ratio (PLER)
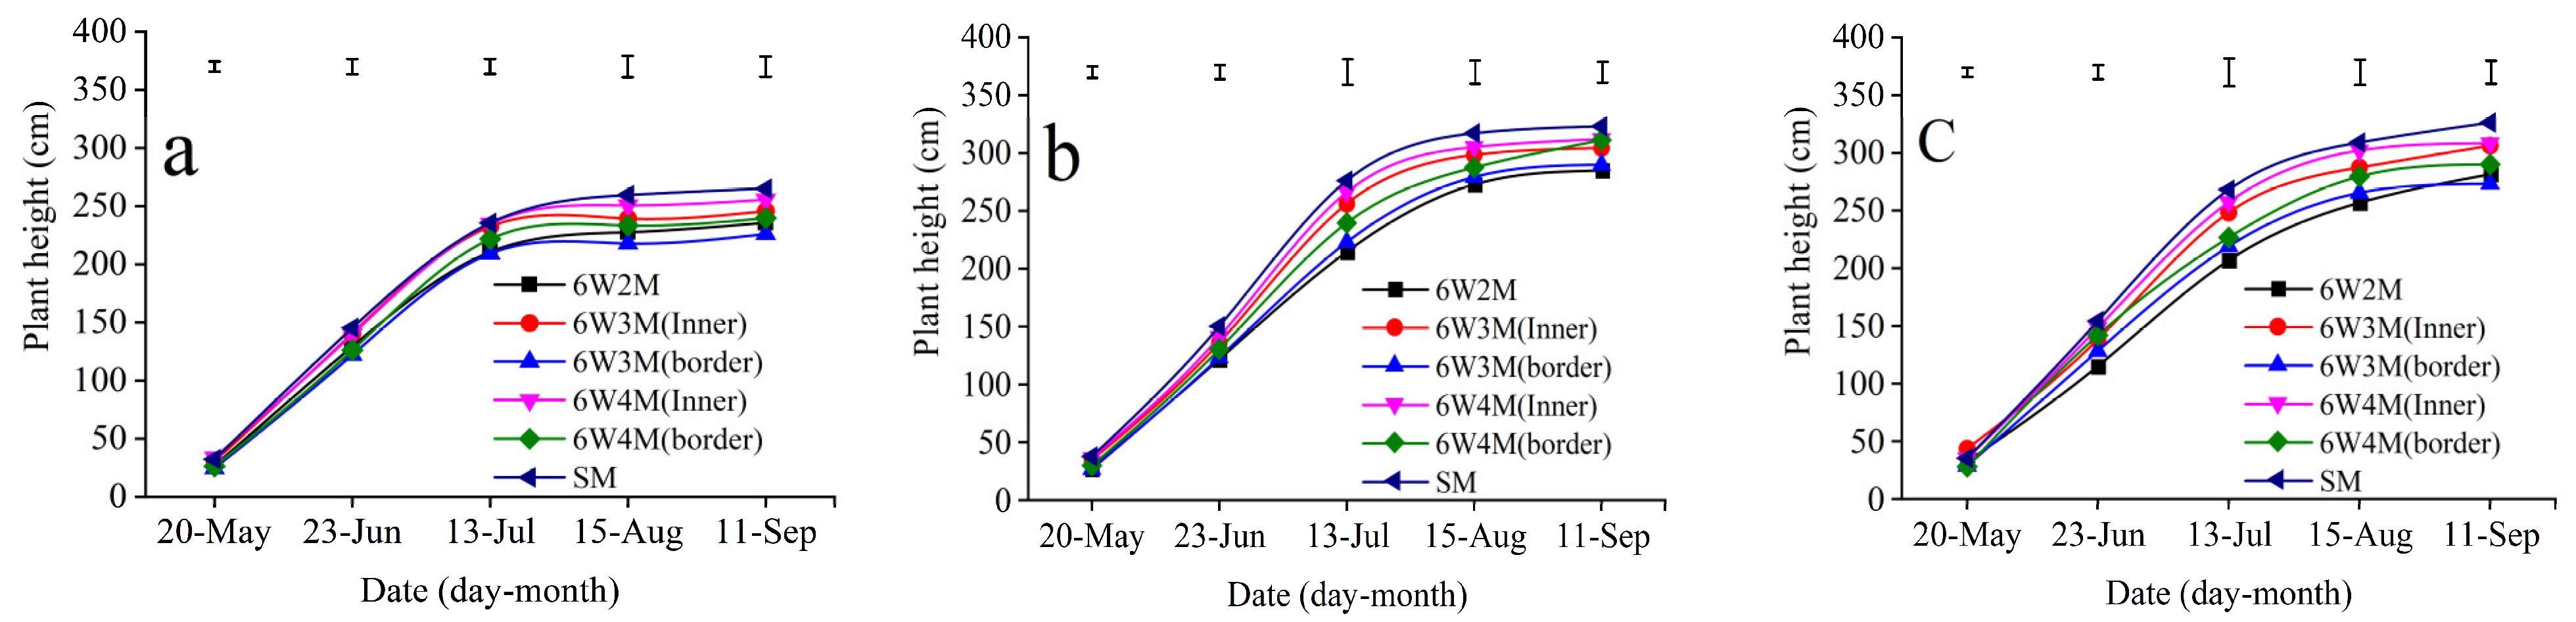
2.3.3. Maize Plant Height
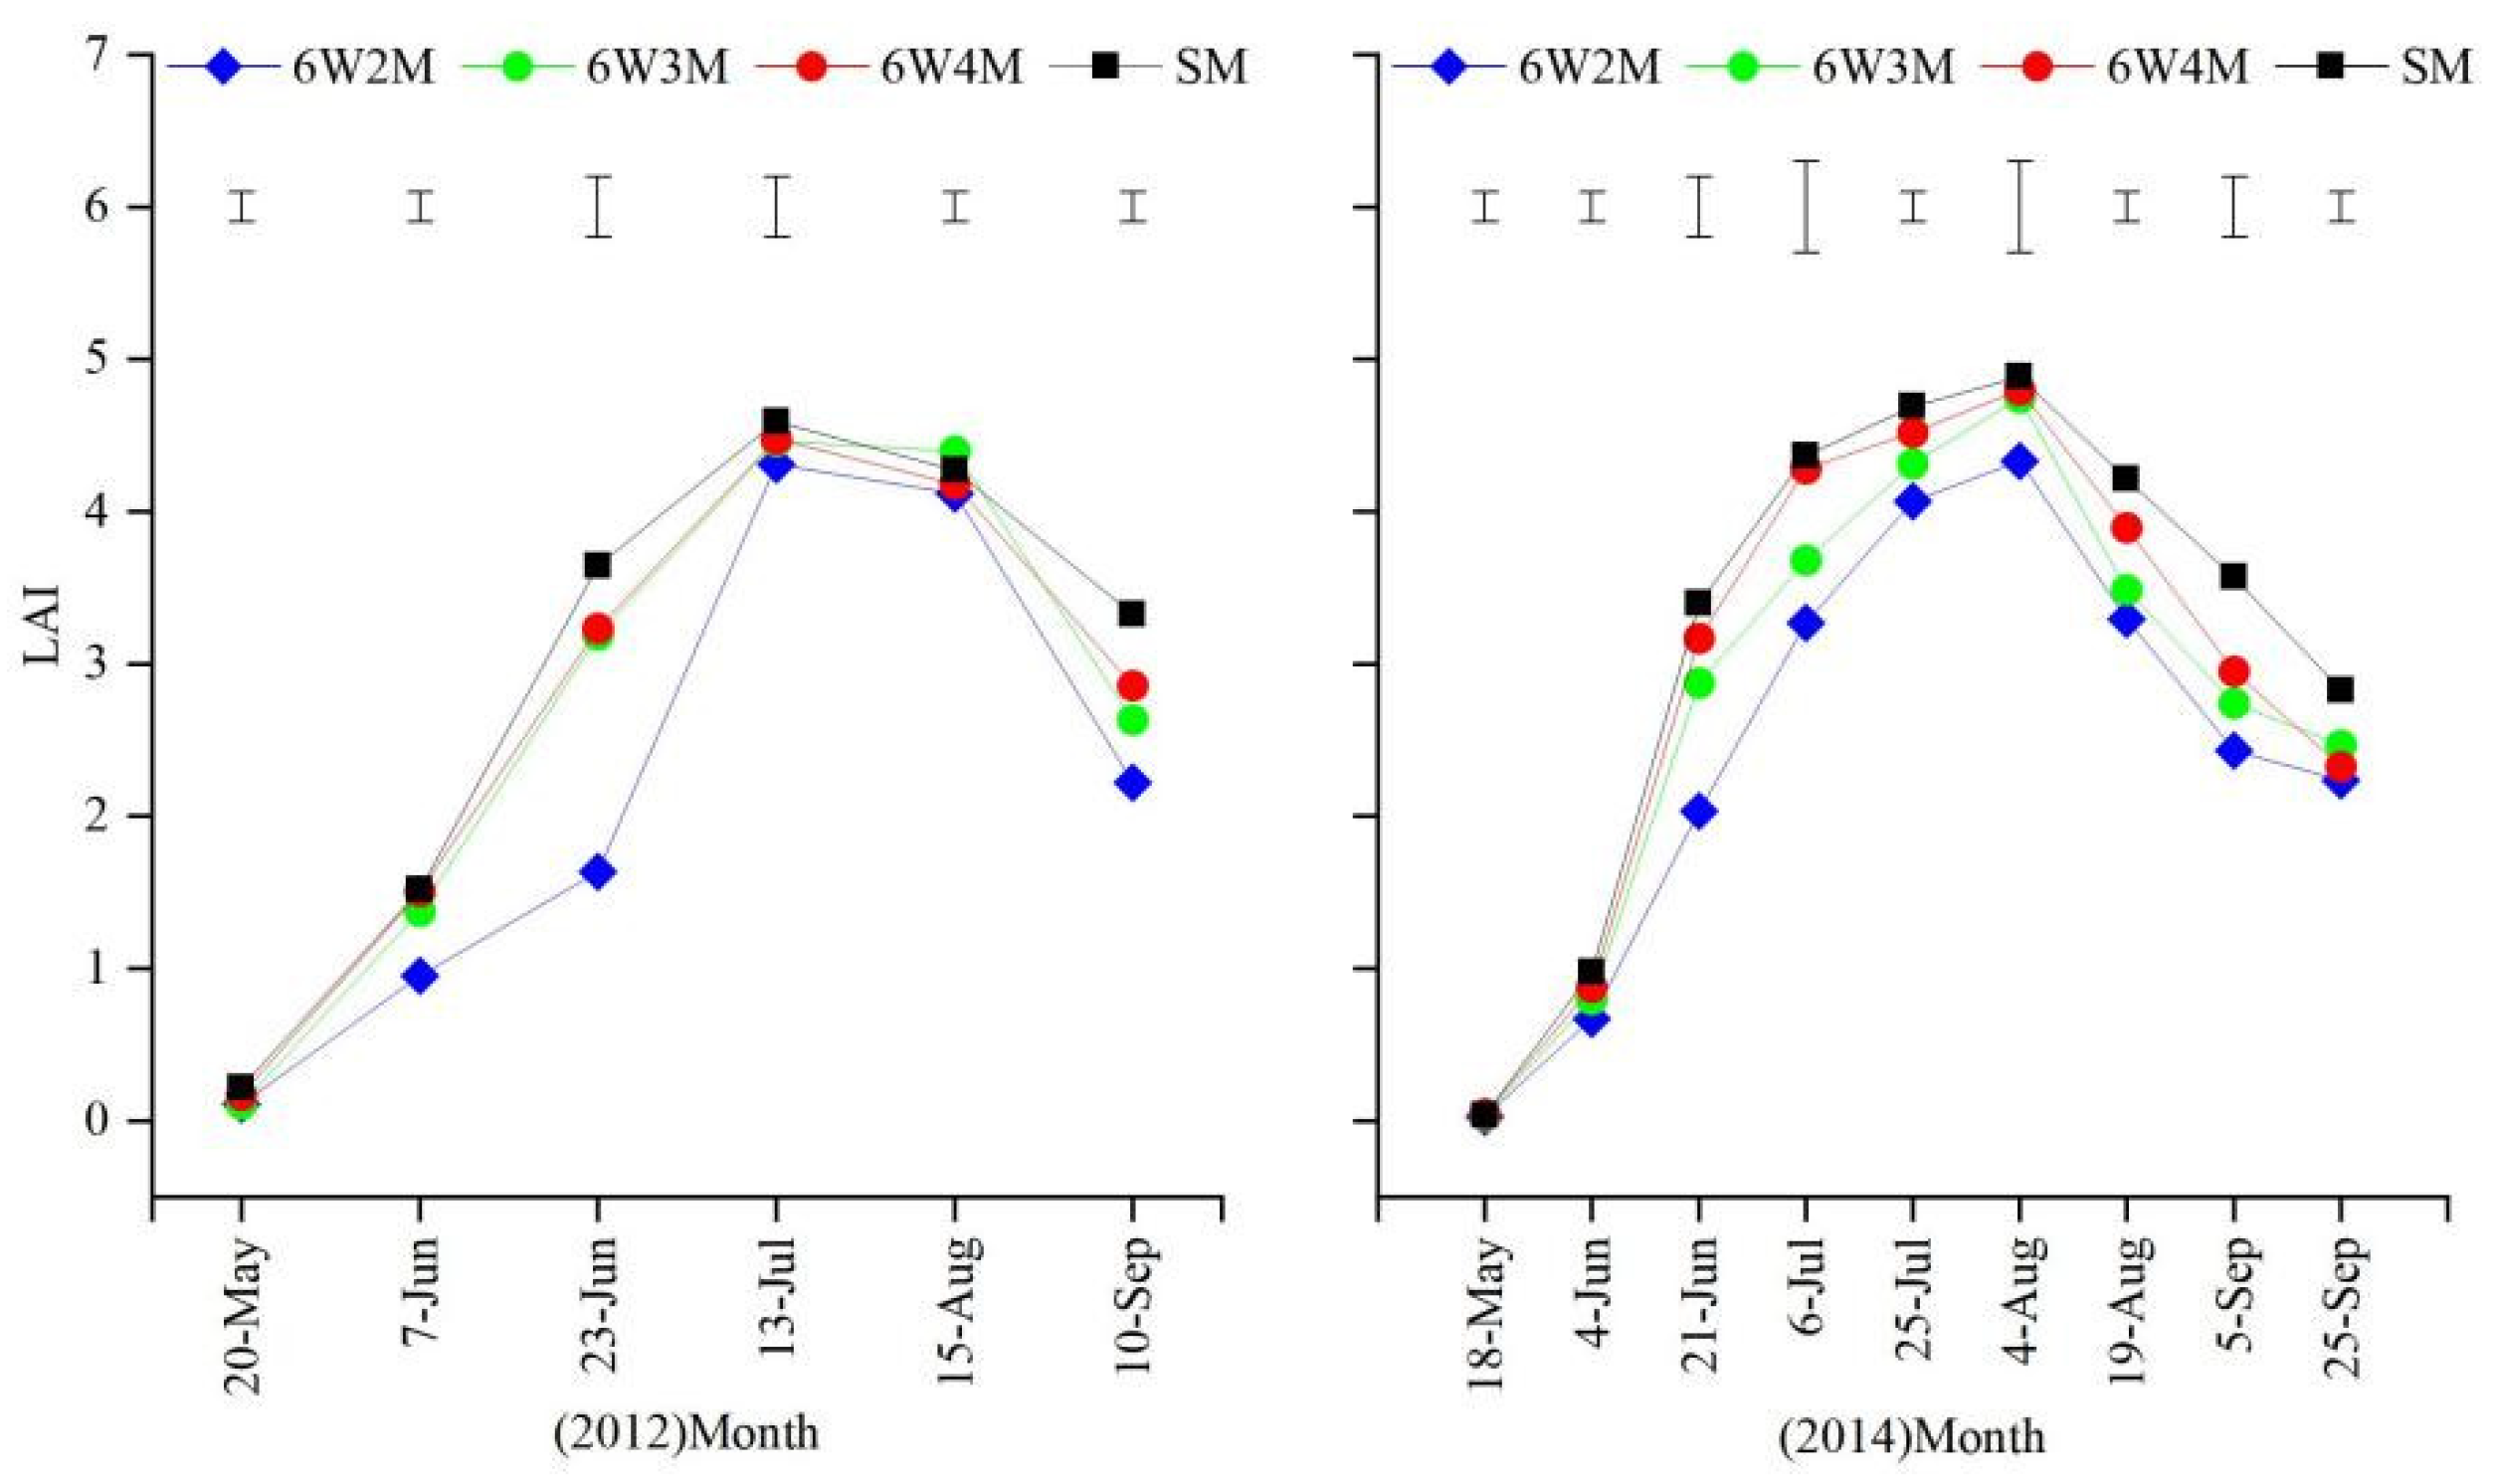
2.3.4. Leaf Area Index (LAI)
2.3.5. Soil Water Evaporation
2.4. Data Analysis
3. Results
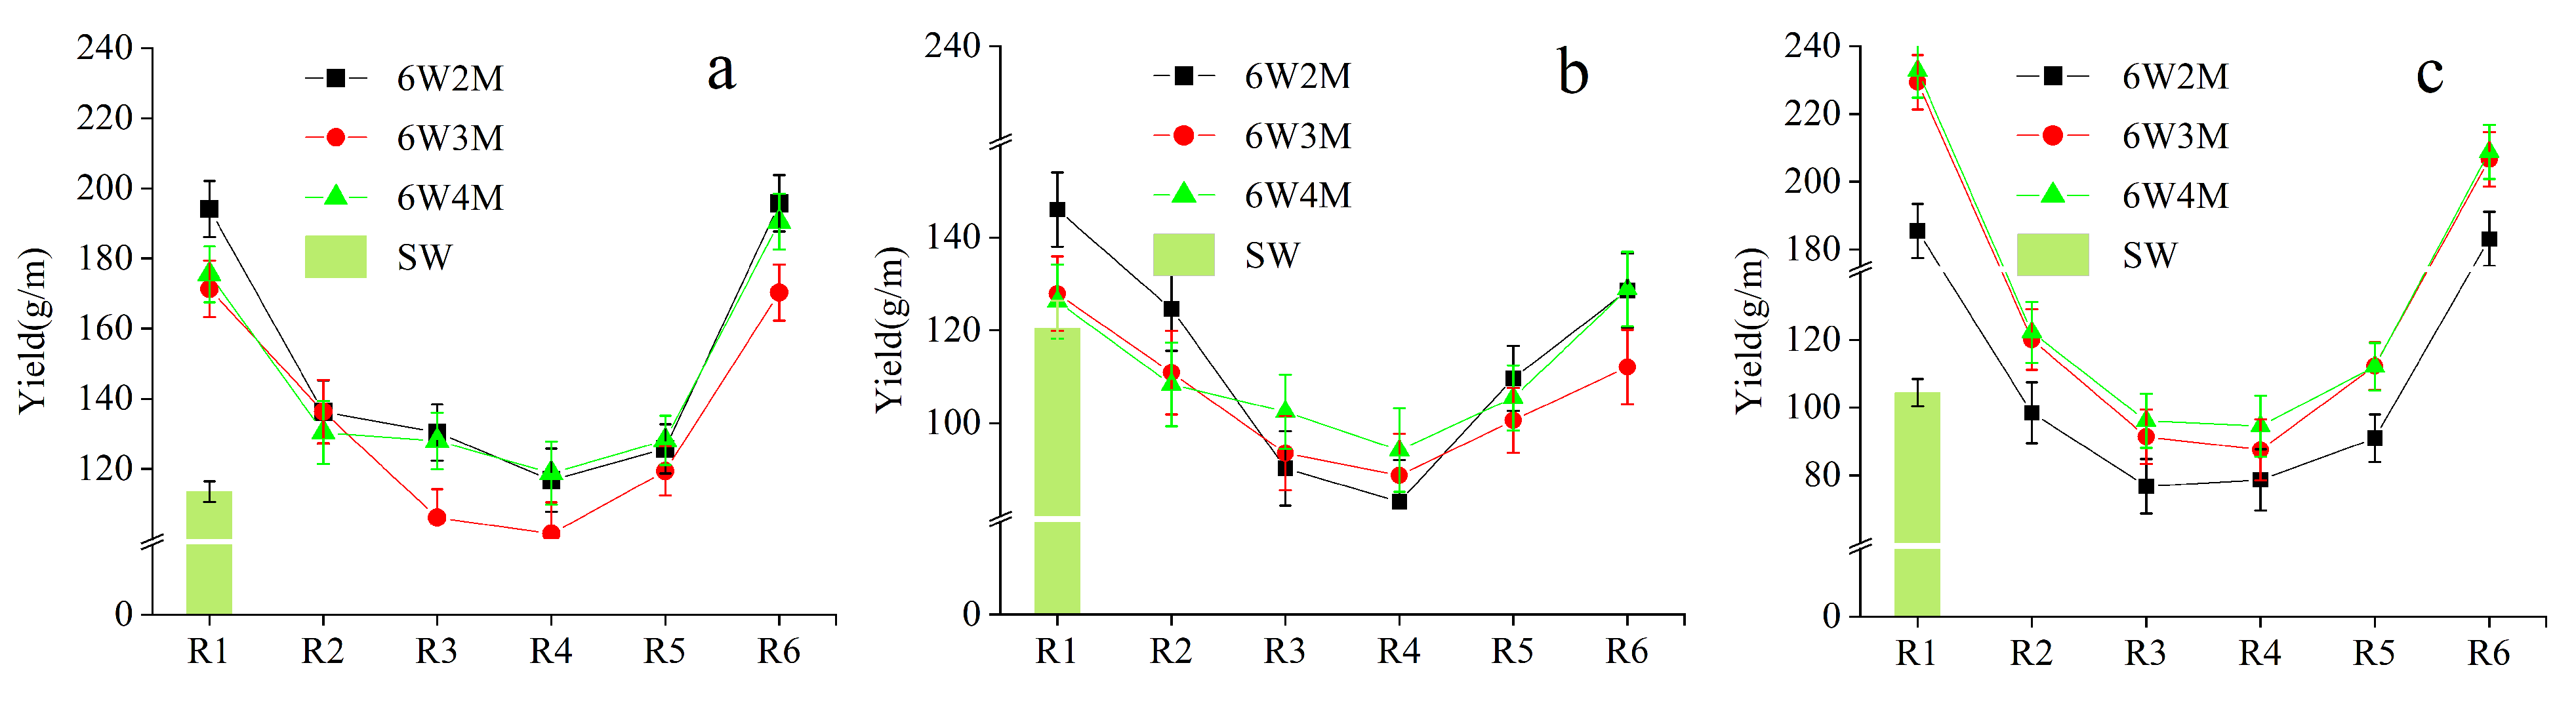
3.1. Grain Yield
3.2. Land-Use Equivalent Ratio (LER) and Partial Land-Use Equivalent Ratio (PLER)
3.3. Yield Component of Intercropped Wheat and Maize
3.4. Maize Plant Height Concerning Intercropping Pattern
4. Discussion
4.1. The Upper Canopy Shape of the Intercropped Maize and LAI of Maize
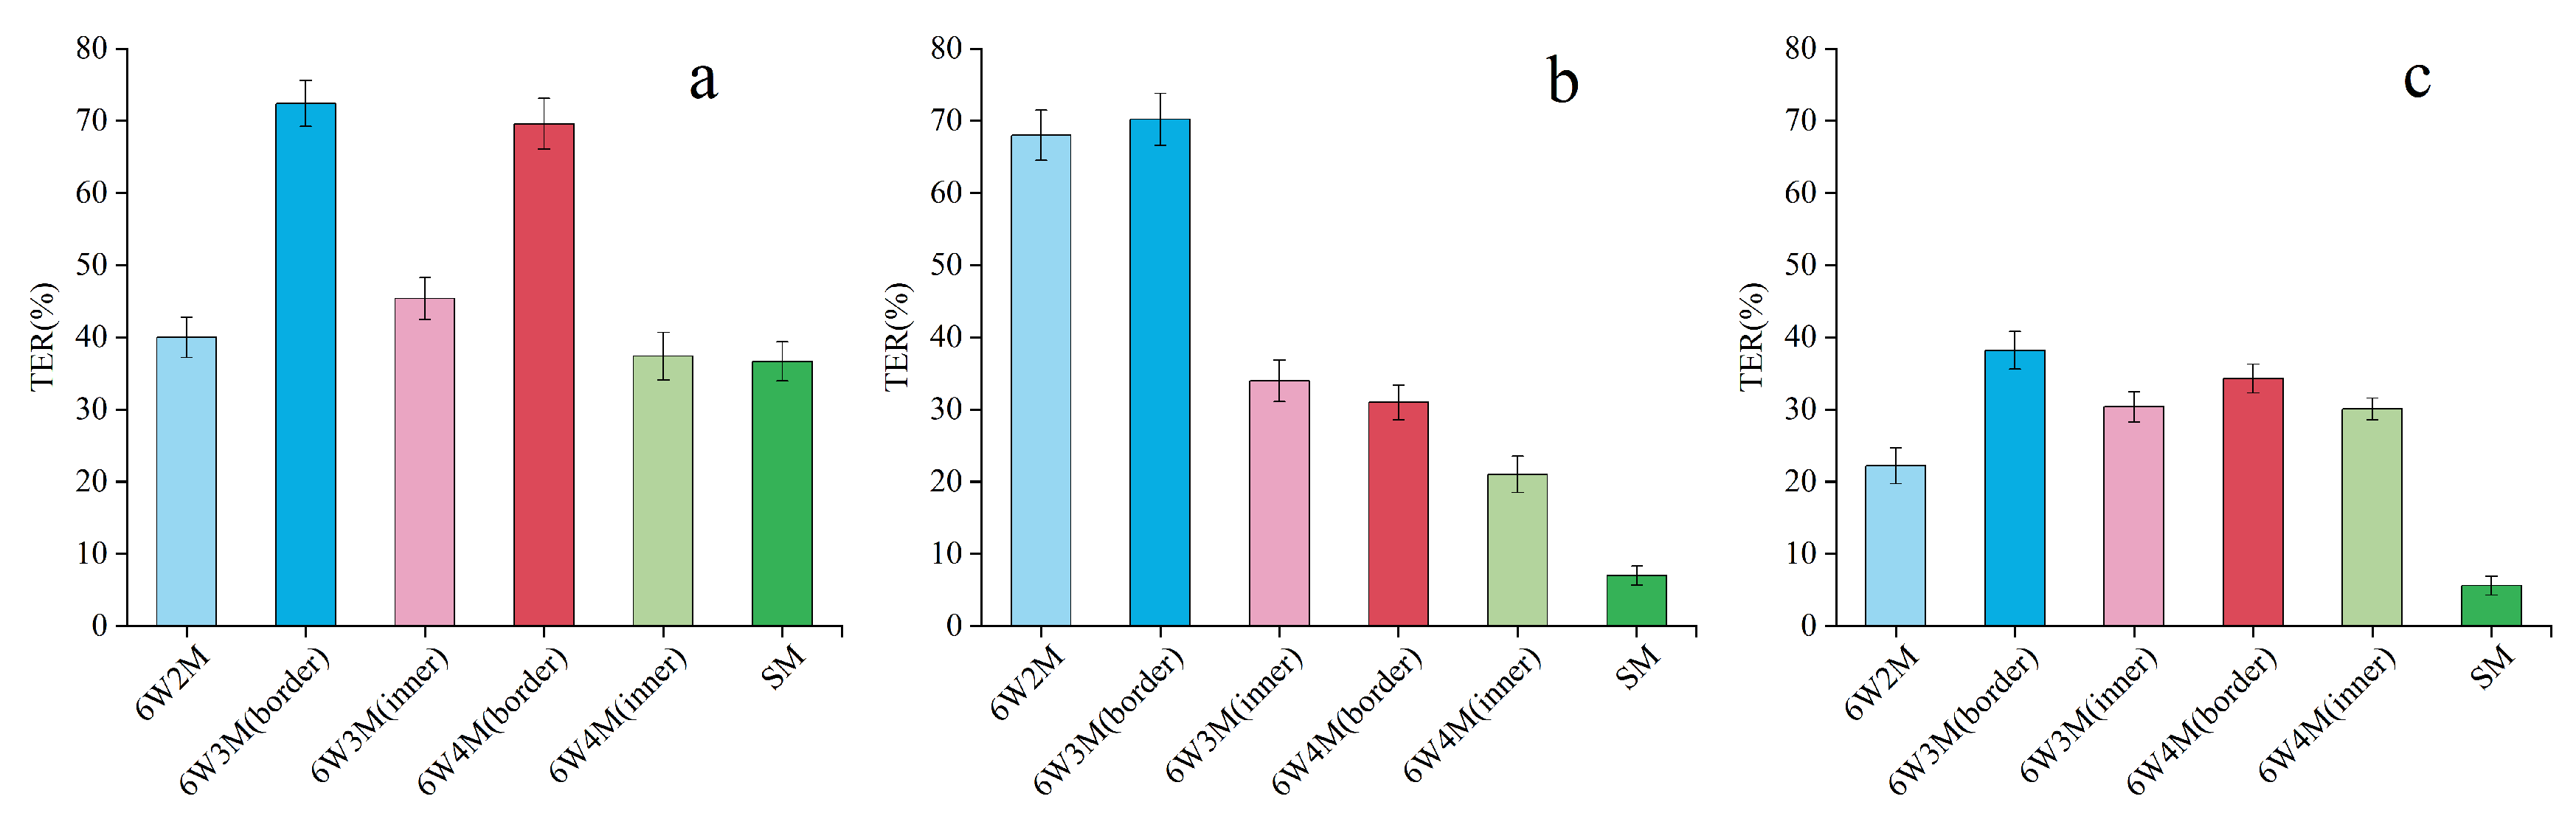
4.2. The Canopy Shape Affects the Light Distribution and the Soil Surface Evaporation
4.3. Yield Components Concerning Canopy Shape
4.4. Maize Canopy Shape Affected the Rate of the Two-Cob Plant Population
4.5. Border Row Effects
4.6. Land Equivalent Ratio (LER) Concerning Canopy Shape
5. Conclusions
Author Contributions
Funding
Institutional Review Board Statement
Informed Consent Statement
Data Availability Statement
Conflicts of Interest
References
- Li, C.; Hoffland, E.; Kuyper, T.W.; Yu, Y.; Zhang, C.; Li, H.; Zhang, F.; van der Werf, W. Syndromes of production in intercropping impact yield gains. Nat. Plants 2020, 6, 653–660. [Google Scholar] [CrossRef] [PubMed]
- Gebru, H. A review on the comparative advantages of intercropping to mono-cropping system. J. Biol. Agric. Healthcare 2015, 5, 1–13. [Google Scholar]
- Zhang, F.; Li, L. Using competitive and facilitative interactions in intercropping systems enhances crop productivity and nutrient-use efficiency. Plant Soil 2003, 248, 305–312. [Google Scholar] [CrossRef]
- Yin, W.; Chai, Q.; Guo, Y.; Fan, H.; Fan, Z.; Hu, F.; Zhao, C.; Yu, A. The physiological and ecological traits of strip management with straw and plastic film to increase grain yield of intercropping wheat and maize in arid conditions. Field Crop. Res. 2021, 271, 108242. [Google Scholar] [CrossRef]
- Qin, A.; Huang, G.; Chai, Q.; Yu, A.; Huang, P. Grain yield and soil respiratory response to intercropping systems on arid land. Field Crop. Res. 2013, 144, 1–10. [Google Scholar] [CrossRef]
- Grote, U.; Fasse, A.; Nguyen, T.T.; Erenstein, O. Food security and the dynamics of wheat and maize value chains in Africa and Asia. Front. Sustain. Food Syst. 2021, 4, 317. [Google Scholar] [CrossRef]
- Cao, G.C.; Wei, S.; Yu, L.H. Water-Saving and Crop Planting for Major Crops of Gramineae in Northern China; China Meteorological Press: Beijing, China, 2006. [Google Scholar]
- Yang, F.; Huang, S.; Gao, R.; Liu, W.; Yong, T.; Wang, X.; Wu, X.; Yang, W. Growth of soybean seedlings in relay strip intercropping systems in relation to light quantity and red: Far-red ratio. Field Crop. Res. 2014, 155, 245–253. [Google Scholar] [CrossRef]
- Liu, X.; Rahman, T.; Yang, F.; Song, C.; Yong, T.; Liu, J.; Zhang, C.; Yang, W. PAR interception and utilization in different maize and soybean intercropping patterns. PLoS ONE 2017, 12, e169218. [Google Scholar] [CrossRef] [Green Version]
- Moreira, A.; Moraes, L.A.; Schroth, G.; Mandarino, J.M. Effect of nitrogen, row spacing, and plant density on yield, yield components, and plant physiology in soybean–wheat intercropping. Agron. J. 2015, 107, 2162–2170. [Google Scholar] [CrossRef]
- Xu, R.; Zhao, H.; Liu, G.; You, Y.; Ma, L.; Liu, N.; Zhang, Y. Effects of nitrogen and maize plant density on forage yield and nitrogen uptake in an alfalfa–silage maize relay intercropping system in the North China plain. Field Crop. Res. 2021, 263, 108068. [Google Scholar] [CrossRef]
- Xu, Q.; Xiong, K.; Chi, Y.; Song, S. Effects of crop and grass intercropping on the soil environment in the Karst Area. Sustainability 2021, 13, 5484. [Google Scholar] [CrossRef]
- Zhu, J.; Vos, J.; van der Werf, W.; van der Putten, P.E.; Evers, J.B. Early competition shapes maize whole-plant development in mixed stands. J. Exp. Bot. 2014, 65, 641–653. [Google Scholar] [CrossRef] [PubMed] [Green Version]
- Wang, Z.; Zhao, X.; Wu, P.; Gao, Y.; Yang, Q.; Shen, Y. Border row effects on light interception in wheat/maize strip intercropping systems. Field Crop. Res. 2017, 214, 1–13. [Google Scholar] [CrossRef]
- Yang, C.; Huang, G.; Chai, Q.; Luo, Z. Water use and yield of wheat/maize intercropping under alternate irrigation in the oasis field of northwest China. Field Crop. Res. 2011, 124, 426–432. [Google Scholar] [CrossRef]
- Thavaprakaash, N.; Velayudham, K.; Muthukumar, V.B. Effect of crop geometry, intercropping systems and integrated nutrient management practices on productivity of baby corn (Zea mays L.) based intercropping systems. Res. J. Agric. Biol. Sci. 2005, 1, 295–302. [Google Scholar]
- Rahman, T.; Ye, L.; Liu, X.; Iqbal, N.; Du, J.; Gao, R.; Liu, W.; Yang, F.; Yang, W. Water use efficiency and water distribution response to different planting patterns in maize–soybean relay strip intercropping systems. Exp. Agric. 2017, 53, 159–177. [Google Scholar] [CrossRef]
- Ma, L.; Li, Y.; Wu, P.; Zhao, X.; Chen, X.; Gao, X. Coupling evapotranspiration partitioning with water migration to identify the water consumption characteristics of wheat and maize in an intercropping system. Agric. For. Meteorol. 2020, 290, 108034. [Google Scholar] [CrossRef]
- Wang, Z.; Zhao, X.; Wu, P.; He, J.; Chen, X.; Gao, Y.; Cao, X. Radiation interception and utilization by wheat/maize strip intercropping systems. Agric. For. Meteorol. 2015, 204, 58–66. [Google Scholar] [CrossRef]
- Gou, F.; van Ittersum, M.K.; Simon, E.; Leffelaar, P.A.; van der Putten, P.E.; Zhang, L.; van der Werf, W. Intercropping wheat and maize increases total radiation interception and wheat RUE but lowers maize RUE. Eur. J. Agron. 2017, 84, 125–139. [Google Scholar] [CrossRef] [Green Version]
- Ma, L.; Li, Y.; Wu, P.; Zhao, X.; Chen, X.; Gao, X. Effects of varied water regimes on root development and its relations with soil water under wheat/maize intercropping system. Plant Soil 2019, 439, 113–130. [Google Scholar] [CrossRef]
- Raz-Yaseef, N.; Rotenberg, E.; Yakir, D. Effects of spatial variations in soil evaporation caused by tree shading on water flux partitioning in a semi-arid pine forest. Agric. For. Meteorol. 2010, 150, 454–462. [Google Scholar] [CrossRef]
- Morris, R.A.; Garrity, D.P. Resource capture and utilization in intercropping: Water. Field Crop. Res 1993, 34, 303–317. [Google Scholar] [CrossRef]
- Yin, W.; Fan, Z.; Hu, F.; Yu, A.; Zhao, C.; Chai, Q.; Coulter, J.A. Innovation in alternate mulch with straw and plastic management bolsters yield and water use efficiency in wheat-maize intercropping in arid conditions. Sci. Rep. 2019, 9, 1–14. [Google Scholar] [CrossRef] [PubMed] [Green Version]
- Miao, Q.; Rosa, R.D.; Shi, H.; Paredes, P.; Zhu, L.; Dai, J.; Gonçalves, J.M.; Pereira, L.S. Modeling water use, transpiration and soil evaporation of spring wheat–maize and spring wheat–sunflower relay intercropping using the dual crop coefficient approach. Agric. Water Manag. 2016, 165, 211–229. [Google Scholar] [CrossRef]
- Ai, P.; Ma, Y.; Hai, Y. Influence of jujube/cotton intercropping on soil temperature and crop evapotranspiration in an arid area. Agric. Water Manag. 2021, 256, 107118. [Google Scholar] [CrossRef]
- Zhu, J.; van der Werf, W.; Anten, N.P.; Vos, J.; Evers, J.B. The contribution of phenotypic plasticity to complementary light capture in plant mixtures. New Phytol. 2015, 207, 1213–1222. [Google Scholar] [CrossRef]
- Rao, M.R.; Willey, R.W. Evaluation of Yield Stability in Intercropping: † Studies on Sorghum/Pigeonpea. Exp. Agric. 1980, 16, 105–116. [Google Scholar] [CrossRef]
- Mao, L.; Zhang, L.; Zhao, X.; Liu, S.; van der Werf, W.; Zhang, S.; Spiertz, H.; Li, Z. Crop growth, light utilization and yield of relay intercropped cotton as affected by plant density and a plant growth regulator. Field Crop. Res. 2014, 155, 67–76. [Google Scholar] [CrossRef]
- Liu, Y.; Zhang, W.; Sun, J.; Li, X.; Christie, P.; Li, L. High morphological and physiological plasticity of wheat roots is conducive to higher competitive ability of wheat than maize in intercropping systems. Plant Soil 2015, 397, 387–399. [Google Scholar] [CrossRef]
- Aggarwal, P.K.; Sinha, S.K. Response of droughted wheat to mid-season water application: Recovery in leaf area and its effect on grain yield. Funct. Plant Biol. 1987, 14, 227–237. [Google Scholar] [CrossRef]
- Slafer, G.A.; Savin, R. Postanthesis green area duration in a semidwarf and a standard-height wheat cultivar as affected by sink strength. Aust. J. Agric. Res. 1994, 45, 1337–1346. [Google Scholar] [CrossRef]
- Dong, B.; Yang, H.; Liu, H.; Qiao, Y.; Zhang, M.; Wang, Y.; Xie, Z.; Liu, M. Effects of shading stress on grain number, yield, and photosynthesis during early reproductive growth in wheat. Crop. Sci. 2019, 59, 363–378. [Google Scholar] [CrossRef]
- Efendi, R.; Andayani, N.N.; Kalqutny, S.H.; Azrai, M. Evaluation of Prolific Hybrids Maize Performance on Different Population Densities and Nitrogen Level; IOP Conference Series: Earth and Environmental Science; IOP Publishing: Bristol, UK, 2020; p. 12095. [Google Scholar]
- Tetio Kagho, F.; Gardner, F.P. Responses of maize to plant population density. II. Reproductive development, yield, and yield adjustments. Agron. J. 1988, 80, 935–940. [Google Scholar] [CrossRef]
- Cao, Y.; Wang, L.; Gu, W.; Wang, Y.; Zhang, J. Increasing photosynthetic performance and post-silking N uptake by moderate decreasing leaf source of maize under high planting density. J. Integr. Agric. 2021, 20, 494–510. [Google Scholar] [CrossRef]
- Thapa, S.; Stewart, B.A.; Xue, Q.; Pokhrel, P.; Barkley, T.; Bhandari, M. Growing corn in clumps reduces canopy temperature and improves microclimate. J. Crop. Improv. 2016, 30, 614–631. [Google Scholar] [CrossRef]
- Thapa, S.; Stewart, B.A.; Xue, Q.; Chen, Y. Manipulating plant geometry to improve microclimate, grain yield, and harvest index in grain sorghum. PLoS ONE 2017, 12, e173511. [Google Scholar] [CrossRef] [Green Version]
- Li, L.; Sun, J.; Zhang, F.; Li, X.; Yang, S.; Rengel, Z. Wheat/maize or wheat/soybean strip intercropping: I. Yield advantage and interspecific interactions on nutrients. Field Crop. Res. 2001, 71, 123–137. [Google Scholar] [CrossRef]
- Zhang, L.; Van der Werf, W.; Zhang, S.; Li, B.; Spiertz, J. Temperature-mediated developmental delay may limit yield of cotton in relay intercrops with wheat. Field Crop. Res 2008, 106, 258–268. [Google Scholar] [CrossRef]
- Lauer, J.G.; Simmons, S.R. Photoassimilate partitioning by tillers and individual tiller leaves in field-grown spring barley. Crop. Sci. 1988, 28, 279–282. [Google Scholar] [CrossRef] [Green Version]
- Noy Meir, I.; Briske, D.D. Response of wild wheat populations to grazing in Mediterranean grasslands: The relative influence of defoliation, competition, mulch and genotype. J. Appl. Ecol. 2002, 39, 259–278. [Google Scholar] [CrossRef] [Green Version]
- Bremner, P.M.; Rawson, H.M. The weights of individual grains of the wheat ear in relation to their growth potential, the supply of assimilate and interaction between grains. Funct. Plant Biol. 1978, 5, 61–72. [Google Scholar] [CrossRef]
- Sparkes, D.L.; Holme, S.J.; Gaju, O. Does light quality initiate tiller death in wheat? Eur. J. Agron. 2006, 24, 212–217. [Google Scholar] [CrossRef]
- Wang, Z.; Wu, P.; Zhao, X.; Gao, Y.; Chen, X. Water use and crop coefficient of the wheat-maize strip intercropping system for an arid region in northwestern China. Agric. Water Manag. 2015, 161, 77–85. [Google Scholar] [CrossRef]
- Denčić, S.; Kastori, R.; Kobiljski, B.; Duggan, B. Evaluation of grain yield and its components in wheat cultivars and landraces under near optimal and drought conditions. Euphytica 2000, 113, 43–52. [Google Scholar] [CrossRef]
- Guttieri, M.J.; Stark, J.C.; O’Brien, K.; Souza, E. Relative sensitivity of spring wheat grain yield and quality parameters to moisture deficit. Crop. Sci. 2001, 41, 327–335. [Google Scholar] [CrossRef]
- Gou, F.; Van Ittersum, M.K.; Couëdel, A.; Zhang, Y.; Wang, Y.; van der Putten, P.E.; Zhang, L.; van der Werf, W. Intercropping with wheat lowers nutrient uptake and biomass accumulation of maize, but increases photosynthetic rate of the ear leaf. AoB Plants 2018, 10, y10. [Google Scholar] [CrossRef] [PubMed]


| Sand (%) | Silt (%) | Clay (%) | BD (g/cm3) | OM (g/kg) | TN (g/kg) | AN (mg/kg) | AP (mg/kg) | AK (mg/kg) | pH |
|---|---|---|---|---|---|---|---|---|---|
| 27.9 | 66.2 | 5.9 | 1.42 | 15.81 | 0.87 | 105.96 | 29.12 | 169.58 | 7.36 |
| Irrigation No. | Irrigation Date | Irrigation Amounts | ||||
|---|---|---|---|---|---|---|
| 2012 | 2013 | 2014 | Sole Wheat | Sole Maize | Wheat/Maize | |
| ----------month–day----------- | ----------------------mm-------------------- | |||||
| 1st | 5–5 | 5–8 | 5–9 | 120 | 120 | 120 |
| 2nd | 5–29 | 5–25 | 5–28 | 100 | 100 | 100 |
| 3rd | 6–20 | 6–25 | 6–20 | 100 | 100 | 100 |
| 4th | 7–10 | 7–26 | 7–29 | 100 b | 100 | 100 |
| 5th | 7–31 | 8–20 | 8–22 | ― | 80 | 80 |
| 6th | 8–26 | ― a | ― | ― | 80 | 80 |
| Total | ― | ― | ― | 420 | 580 | 580 |
| Years | Treatment | Grain Yield (kg/ha) | Harvest Index | |||
|---|---|---|---|---|---|---|
| Wheat | Maize | Total | Wheat | Maize | ||
| SW | 6804 a | — | 6804 d | 0.42 a | — | |
| SM | — | 18,950 a | 15,182 ab | — | 0.54 b | |
| 2012 | 6W2M | 3697 b | 10,713 c | 13,885 bc | 0.39 b | 0.51 c |
| 6W3M | 2807 c | 14,445 b | 13,788 bc | 0.41 a | 0.56 a | |
| 6W4M | 2237 d | 14,983 b | 14,012 abc | 0.40 a | 0.55 ab | |
| SW | 8979 a | — | 7165 d | 0.40 b | — | |
| SM | — | 15,333 b | 16,560 a | — | 0.55 a | |
| 2013 | 6W2M | 4390 b | 14,188 c | 15,662 b | 0.40 b | 0.52 c |
| 6W3M | 3169 c | 17,955 a | 15,100 bc | 0.39 b | 0.56 a | |
| 6W4M | 2773 d | 16,875 a | 15,376 bc | 0.38 b | 0.54 b | |
| SW | 7831 a | — | 7594 c | 0.40 ab | — | |
| SM | — | 15,922 a | 15,922 a | — | 0.54 a | |
| 2014 | 6W2M | 4783 b | 9497 d | 14,025 b | 0.41 a | 0.51 b |
| 6W3M | 4237 b | 11,460 c | 15,003 b | 0.40 ab | 0.55 a | |
| 6W4M | 3610 c | 12,960 b | 16,101 a | 0.40 ab | 0.55 a | |
| Year | Treatment | PW | PM | LER |
|---|---|---|---|---|
| 6W2M | 1.12 a | 1.13 b | 1.11 b | |
| 2012 | 6W3M | 0.98 b | 1.27 a | 1.17 a |
| 6W4M | 0.99 b | 1.19 b | 1.12 b | |
| 6W2M | 0.98 a | 1.23 b | 1.28 a | |
| 2013 | 6W3M | 0.88 b | 1.30 a | 1.16 b |
| 6W4M | 0.93 ab | 1.10 c | 1.16 b | |
| 6W2M | 1.14 b | 1.07 b | 1.21 b | |
| 2014 | 6W3M | 1.35 a | 1.17 a | 1.26 a |
| 6W4M | 1.38 a | 1.13 a | 1.27 a |
| Year | Treatment | Wheat | Maize | ||||
|---|---|---|---|---|---|---|---|
| Grain Number /Spike | Heads /m2 | 1000 Grain Weight (g) | Yield per Plant (g/plant) | Kernel Number (/Plant) | 1000 Kernel Weight (g) | ||
| 2012 | 6W2M | 39.04 a | 9.48 a | 39.72 b | 394.92 ab | 659.13 b | 567.35 a |
| 6W3M | 40.06 a | 0.47 b | 39.36 b | 427.74 a | 800.41 a | 556.67 a | |
| 6W4M | 36.89 b | 9.71 a | 37.99 c | 410.51 a | 754.27 a | 571.62 a | |
| SW | 32.64 c | 83.23 a | 41.73 a | 359.72 b | 596.67 c | 549.39 a | |
| 2013 | 6W2M | 33.99 c | 91.17 a | 37.78 c | 444.91 c | 1056.52 a | 421.13 b |
| 6W3M | 38.17 a | 71.20 c | 38.87 b | 449.73 a | 911.53 a | 493.28 a | |
| 6W4M | 35.79 b | 82.05 b | 37.77 c | 366.80 b | 737.91 b | 497.04 a | |
| SW | 34.53 c | 74.15 c | 46.76 a | 357.13 b | 757.32 b | 471.42 a | |
| 2014 | 6W2M | 48.66 a | 113.33 b | 34.15 c | 346.92 b | 792.19 a | 488.38 b |
| 6W3M | 48.65 a | 128.67 a | 38.67 b | 447.43 a | 840.21 a | 518.72 a | |
| 6W4M | 49.16 a | 137.01 a | 36.81 b | 392.90 b | 731.06 ab | 503.21 a | |
| SW | 23.62 b | 97.67 c | 45.23 a | 247.42 c | 540.18 c | 487.68 b | |
| 6W2M | 6W3M | 6W4M | |||||
|---|---|---|---|---|---|---|---|
| Years | Growth Stage | Wheat Strip | Maize Strip | Wheat Strip | Maize Strip | Wheat Strip | Maize Strip |
| 2013 | Wheat jointing | 32.9 | 23.74 | 40.18 | 28.86 | 36.85 | 26.48 |
| Wheat anthesis | 11.5 | 7.51 | 14.87 | 9.65 | 14.18 | 9.19 | |
| Wheat grain filling | 9.6 | 6.96 | 11.84 | 8.57 | 10.63 | 7.67 | |
| Wheat mature | 5.91 | 4.42 | 7.12 | 5.28 | 6.15 | 4.55 | |
| Total | 59.91 | 42.63 | 74.01 | 52.36 | 67.81 | 47.89 | |
| Maize grain filling | 2.7 | 2.04 | 3.24 | 2.4 | 3 | 2.25 | |
| Maize mature | 5.65 | 4.65 | 7.9 | 6.49 | 7.15 | 5.87 | |
| 8.35 | 6.69 | 11.14 | 8.89 | 10.15 | 8.12 | ||
| Total | 68.27 | 49.32 | 85.15 | 61.25 | 77.97 | 56 | |
| 2014 | Wheat jointing | 30.24 | 21.47 | 33.98 | 24.21 | 32.48 | 23.13 |
| Wheat anthesis | 12.58 | 9.01 | 13.13 | 9.5 | 12.44 | 8.99 | |
| Wheat grain filling | 7.89 | 5.62 | 8.9 | 6.34 | 8.43 | 5.98 | |
| Wheat mature | 16.35 | 11.31 | 17.17 | 11.8 | 15.75 | 10.87 | |
| 67.06 | 47.41 | 73.18 | 51.85 | 69.1 | 48.97 | ||
| Maize grain filling | 4.03 | 3.3 | 4.05 | 3.31 | 3.75 | 3.06 | |
| Maize harvesting | 7.71 | 6.38 | 8.27 | 6.84 | 7.66 | 6.34 | |
| 11.74 | 9.68 | 12.32 | 10.15 | 11.41 | 9.4 | ||
| Total | 78.8 | 57.09 | 85.5 | 62 | 80.51 | 58.37 | |
Publisher’s Note: MDPI stays neutral with regard to jurisdictional claims in published maps and institutional affiliations. |
© 2022 by the authors. Licensee MDPI, Basel, Switzerland. This article is an open access article distributed under the terms and conditions of the Creative Commons Attribution (CC BY) license (https://creativecommons.org/licenses/by/4.0/).
Share and Cite
Chen, G.; Zhai, Y.; Zhou, J.; Li, Y.; Lin, J.; Wan, S.; Wu, Q. Optimizing Maize Belt Width Enhances Productivity in Wheat/Maize Intercropping Systems. Sustainability 2022, 14, 16137. https://doi.org/10.3390/su142316137
Chen G, Zhai Y, Zhou J, Li Y, Lin J, Wan S, Wu Q. Optimizing Maize Belt Width Enhances Productivity in Wheat/Maize Intercropping Systems. Sustainability. 2022; 14(23):16137. https://doi.org/10.3390/su142316137
Chicago/Turabian StyleChen, Guodong, Yunlong Zhai, Jianguo Zhou, Yanfang Li, Jiao Lin, Sumei Wan, and Quanzhong Wu. 2022. "Optimizing Maize Belt Width Enhances Productivity in Wheat/Maize Intercropping Systems" Sustainability 14, no. 23: 16137. https://doi.org/10.3390/su142316137