Abstract
The rheological energy characteristics and evolution law of fractured sandstone strengthened with CFRP (carbon fiber reinforced plastic) were studied to solve the problem of rheological failure of rock after engineering excavation disturbance. In this paper, the graded loading rheological tests of fractured sandstone after reinforcement are carried out. The results show that the failure rheological stress of sandstone increases with the increase of the area strengthened by CFRP. When the reinforcement area is from 3140 mm2 to 4710 mm2, the failure rheological stress of rock mass is increased from 65 MPa to 75 MPa, approximately 15.4%. Except for the initial rheological stage, the elastic energy is decreasing and the dissipative energy is increasing. The elastic energy is fully released, and the dissipative energy is provided by the total energy when the rock is destroyed. The energy dissipation ratio (Ud/U) of sandstone under the two reinforcement areas reached the minimum value at the stable rheological stage, which was 0.26 (A = 3140 mm2) and 0.42 (A = 4710 mm2) respectively. The energy mechanism of CFRP is that CFRP stores energy mainly and consumes energy secondly before the energy inflexion. However, CFRP switches to consuming energy mainly and storing energy secondly after the energy inflexion. The energy storage coefficient of CFRP can directly describe the function of elastic energy or dissipative energy of CFRP under arbitrary stress. When the energy storage coefficient T > 1, the damage of CFRP is small. Further, the energy storage coefficient reaches the maximum value of 5 at the energy inflection point (55 MPa). When the energy storage coefficient T < 1, the damage of CFRP is large, and the energy storage coefficient reaches the minimum value of 0.005 at the stress of 40 MPa. During the rheological process of fractured sandstone strengthened with CFRP, the energy evolution shows the relationship between elastic energy and dissipated energy. The energy mechanism of CFRP explains the working mechanism of the reinforced structure in the rheological process and plays a guiding role in the analysis of the rheological failure of the reinforced rock in the practical engineering.
1. Introduction
The excavation of rock mass in underground engineering is mainly subject to unloading load, especially in deep underground engineering. The deformation and failure of the reinforced rock mass after excavation essentially represent the process of energy storage and release in the course of subsequent construction or rheological action of the external load [1]. Therefore, it is of great significance to study the rheological energy evolution characteristics of reinforced rock mass for the stability analysis of surrounding rock and the determination of surrounding rock support method during the construction of deep underground engineering [2]. At the same time, the analysis of rheological energy has a certain reference significance for predicting the failure of rock mass in practical engineering.
In recent years, some scholars have studied the rheological properties and model of fractured rock. Cong et al. [3] used a triaxial creep test to obtain the creep curve of Jurassic sandstone under low confining pressure and used a nonlinear viscoelastic-plastic model to describe the creep curve of Jurassic sandstone under low confining pressure. Wu et al. [4] used shear creep tests on cubic sandstone samples with non-persistent joints to develop a creep model considering the effect of fracture or joint length on the behavior of rock with time. Nguyen-Sy et al. [5] used the standard Zener rheological model and found that the creep properties of Zener fracture media composed of Zener solid matrix and Zener fracture can be expressed by effective generalized Maxwell rheology. Patton et al. [6] proposed a rheological model for rock deformation by sliding on two groups of intersecting weak surfaces and used the derived constitutive relation to examine the response of fault layers to two common folding types. Hamza et al. [7] studied the creep behavior of argillaceous siltstone under axial and triaxial stresses and compared the time-dependent properties of intact and fractured rock samples, which may represent two general limit conditions of rock mass (before and after failure). The relationship between transient (short-term) stiffness and creep behavior is also discussed. Li et al. [8] used the triaxial unloading creep tests of pre-fractured coal samples under isoaxial pressure and staged unloading confining pressure to study the axial and transverse creep laws of coal samples with different dip angles. Zhang et al. [9] studied the unloading rheological characteristics of granite by means of experiments, and the unloading rheological deformation characteristics and laws of granite under complex stress conditions were obtained. The unloading rheological characteristics of the whole stress–strain curve were analyzed, and a nonlinear unloading rheological model based on fractional derivative (FOD-HKVP) was proposed. Khramchenkov et al. [10] studied the unified mathematical model of rheological and transport properties of saturated deformable broken rocks and clays. The model is based on the integration of filtration consolidation theory. Osipov et al. [11] used the experimental results of rock salt and magnesite cylinder samples from the Nizhnevolzhsky oilfield to obtain the strain curves under gradual loading and the viscoelastic model describing the variation of strain with time is developed and verified. Liu et al. [12] studied the creep tests of deep saturated rocks in Dongguashan mine by uniaxial single-stage loading and incremental cyclic loading, and the creep curves of saturated rocks under different loading stresses were obtained. The creep law of deep saturated rock is analyzed by comparing with the creep law of dry rock at the same position. Wang et al. [13] considered the characteristics of deformation and failure of rock mass, structural plane, and epoxy composite structure. The analytical formulas for the stress intensity factor and the opening displacement at the crack tip of type II compound crack were obtained. An improved Kelvin nonlinear creep model was proposed. Lyakhovsky et al. [14] proposed a strain-dependent modulus model for materials that describes the rheological properties of solids and also allows the simulation of rock expansion. Zakharov et al. [15] introduced a geomechanical model of tunnel with bolt support and analyzed the influence of bolt support on tunnel stability combined with rock rheological characteristics. Lukic et al. [16] introduced the basic elements of some rock mass rheological models and presented an analysis of these models, especially concerning the rheological process of marl and the influence of these processes on the reinforced concrete tunnel structure.
Besides, energy analysis began as a way for scholars to reveal rock damage. Wang et al. [17] studied the energy evolution mechanism of sandstone under different confining pressures and derived the energy intensity criterion based on the energy principle of rock failure. Zhou et al. [18] used impact tests on sandstone with 0–75 MPa axial static prestress to obtain the dynamic parameters. Wasantha et al. [19] studied the mechanical behavior and energy release characteristics of bedded sandstone under uniaxial compression in different directions. Arsalan et al. [20] used inverse gas chromatography (IGC) to characterize the surface energy of sandstone and further elucidated the surface chemistry of sandstone using X-ray diffraction (XRD) and X-ray photoelectron spectroscopy (XPS) techniques. Seth et al. [21] related the area under the capillary pressure curve to the thermodynamic work of the displacement and interpret the curve as a series of alternating actions and rheology. Sufian et al. [22] inversed the energy dissipation associated with the redistribution of energy from new surface formation and storage through newly fractured sandstone. Wang et al. [23] carried out dynamic compression tests on red sandstone samples which had not been freeze-thawed or subject to freeze-thawing cycles and analyzed the stress–strain curve and energy evolution curves of the samples. Zhang et al. [24] conducted three-stage loading and stress-seepage coupling tests on deep sandstone based on initial high in-situ stress reduction to obtain the stress–strain, energy, and permeability evolution curves of deep sandstone during the whole deformation process. Li et al. [25] studied the energy evolution and fatigue behavior of sandstone under cyclic loading and established a three-stage fatigue damage model of sandstone based on energy dissipation. Khan et al. [26] proposed the ratio of elastic dissipation energy to total elastic energy to predict EFP of sandstone with different water content based on the infrared ray and complex energy evolution during loading. He et al. [27] carried out a series of uniaxial loading and unloading tests on different red sandstone specimens to reveal the mechanical behavior and energy evolution characteristics of rock materials with cavity defects. Wen et al. [28] used the energy method to describe the mechanical properties of rock and redefined the damage variable according to the energy dissipation. Li et al. [29] analyzed the effect of slenderness ratio on the mechanical properties and energy dissipation characteristics of red sandstone under high strain rate, established the dynamic damage evolution model of red sandstone, and determined the constitutive model parameters under different slenderness ratio. Gautam et al. [30] studied the evolution of absorption energy per unit thickness at different temperatures and the changes in physical chemistry properties of high temperature treated sandstone through geochemistry and thermodynamic analyses.
In a word, the present research results have studied the rheological mechanical properties and energy model analysis of various intact rocks in detail. However, they cannot simulate the actual underground engineering well. In view of the actual situation of underground engineering, there is a problem that fractured rock mass needs reinforcement. Therefore, it is necessary to study the energy change of the reinforced fractured rock mass in the subsequent rheological process, which has some significance to predict the failure of engineering rock mass from the energy point of view. In the actual project, the method of grouting reinforcement is mostly used, while in the laboratory, the method of bolt reinforcement is mostly used. However, considering the existence of the cracks through rock mass, bolt reinforcement cannot play a very good role in restraining the deformation of rock mass, only from the outside of the rock mass reinforcement. Therefore, we used CFRP to simulate the reinforced structure and carried out the graded loading rheological test on the deep fractured sandstone of the tunnel. Based on the experimental data, the characteristics of elastic energy and dissipative energy of rock mass and the relationship between them are studied by distinguishing the different stages of rock mass failure. The failure characteristics of CFRP and rock mass are described by the change of energy, which provides a reliable theoretical basis for the failure of similar reinforced fractured rock mass in practical engineering.
2. Materials and Methods
2.1. Laboratory Equipment
As shown in Figure 1, the equipment used in the test is the rock mechanics testing machine. The maximum axial force of the testing machine is 2000 KN, and the maximum confining pressure is 60 MPa. The uniaxial loading and unloading test, triaxial loading and unloading test, creep test, and rheological test of common rocks can thus be carried out.
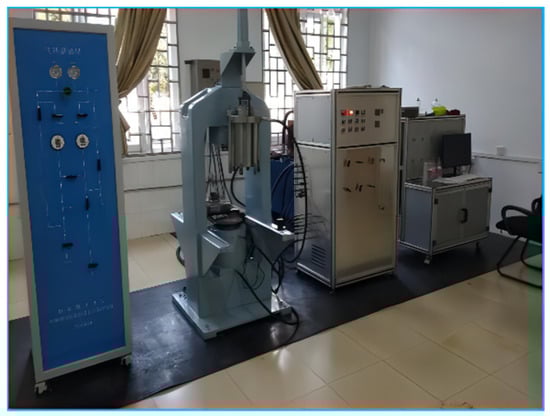
Figure 1.
Automatic rock triaxial test system.
2.2. Fractured Sandstone Preparation
The sandstone samples are all taken from a complete rock block at the side of a deep tunnel in Guilin. The size of the sandstone is uniform. The texture is hard, and the surface has no obvious joints. The natural surface is gray. According to the standard of rock mechanics experiment, the samples are machined into cylinder with diameter of 50 mm and height of 100 mm. As shown in Figure 2, the completed samples have been subjected to an unloading test in order to get the fractured rockstones. The fractured rockstones contain a single fracture surface. At the same time, in order to reduce the difference of the roughness of the fracture surface, which has a great influence on the later test, the selected samples are all the samples with similar roughness of the fracture surface under the same confining pressure.
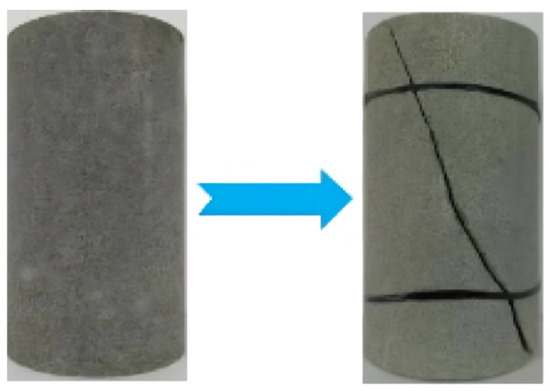
Figure 2.
Fractured sandstone samples.
2.3. Reinforcing Material
In order to avoid the secondary damage to the fractured rock samples, the CFRP (carbon fiber reinforced plastic), which is widely used in the reinforcement of concrete beams, is used as the equivalent reinforcement material. The technical parameters of CFRP are shown in Table 1.

Table 1.
Technical parameters of CFRP.
2.4. The Determination of the Unit of Optimum Reinforcement Area
In order to get the most suitable initial bonding area, the experimental results were compared with those of the sandstone samples under the condition of anchor-bolt in reference [31]. The sandstones with different reinforcement areas are shown in Figure 3. However, due to the difference of the instrument used in the test and the sampling area of the specimen in the literature, the results obtained by comparing the strength and the elastic modulus of the strengthened specimen are not stable. Therefore, we will mainly compare and analyze regarding the change of destruction form. In the reference, the loading failure of anchored sandstone is mainly shear failure without tension crack and the end of the sandstone is slightly damaged. It is found that the failure mode of deep sandstone under uniaxial loading is most similar when the area of CFRP reinforcement is 1256 mm2 and 1570 mm2. From Table 2, the peak stress of the specimens with 1256 mm2 and 1570 mm2 increased by 3.1% and 6.1% respectively. The elastic modulus of the specimens with 1256 mm2 and 1570 mm2 increased by 5.8% and 6.5% respectively. The mean values of peak stress and elastic modulus of the samples with anchors were 6.28% and 10.28% respectively. By comprehensive comparison, it is found that the failure mode and the improvement degree of mechanical properties of the specimen are most similar to the experimental results in the reference when the reinforcement area is 1570 mm2. Under this area, the reinforcement structure and the rock mass can better coordinate deformation. That is to say, the optimum reinforcement area of 1570 mm2 is one unit of reinforcement area.
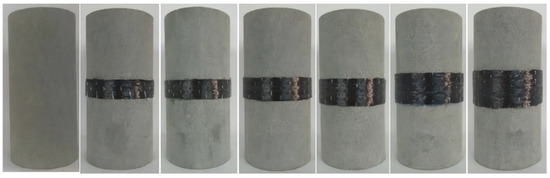
Figure 3.
Complete samples strengthened with CFRP.
Table 2.
Uniaxial compression test results of samples with different reinforcement areas.
2.5. Graded Rheological Test Scheme
Through the determination of the optimum reinforcement area unit, this paper respectively adopts two reinforcement methods to reinforce the fractured sandstone. The reinforcement area of the fractured sandstone is 3140 mm2 and 4710 mm2, respectively, as shown in Figure 4a,b. In order to reasonably design the loading parameters of the rheological test, the triaxial compression test was carried out on fractured sandstone with different reinforcement areas under 10 MPa confining pressure. The basic mechanical properties of samples with different reinforcement areas were obtained, and 3 samples with different reinforcement areas were tested. The average value was the final result. The mechanical parameters of samples with different reinforcement areas are shown in Table 3.
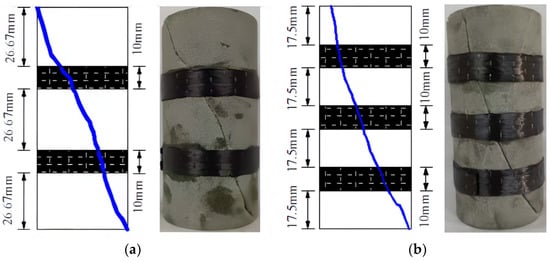
Figure 4.
Fractured sandstone with different reinforcement areas: (a) A = 3140 mm2; (b) A = 4710 mm2.
Table 3.
Experimental results of reinforced fractured sandstone under triaxial compression.
According to the actual depth of roadway, the confining pressure is 10 MPa. The initial stress level is chosen as 50% of the peak strength of the rock in the triaxial test. And the initial stress value is chosen as an integral value for the convenience of stress application. The stress grades of 3140 mm2 specimens were divided into six groups: 40, 45, 50, 55, 60, and 65 MPa. The stress grades of 4710 mm2 specimens were divided into eight groups: 40, 45, 50, 55, 60, 65, 70, and 75 MPa. The graded axial load increases 5 MPa in turn. The axial pressure increases to 40 MPa and the confining pressure increases to 10 MPa at the rate of 1.5 MPa/min and 1 MPa/min respectively. When the axial deformation of rock sample is less than 0.0015 mm/h, the load of this stage is considered to be stable, and the load of the next stage is applied until the failure of rock sample. The hierarchical load schematic is shown in Figure 5.

Figure 5.
Schematic diagram of hierarchical loading.
3. Results
3.1. Analysis of Rheological Curve
Based on the above steps, the rheological tests of fractured rock strengthened with CFRP (A = 3140 mm2 and A = 4710 mm2) are carried out respectively. The experimental data were processed to obtain the step-loading rheological test curve, as shown in Figure 6.
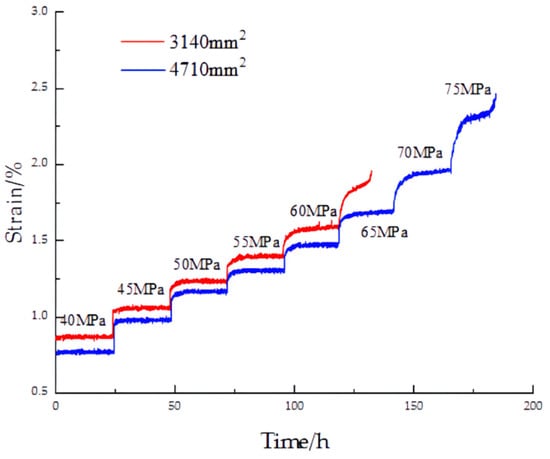
Figure 6.
Rheological test curve under step loading.
From Figure 6, it can be seen that the mechanical properties of the reinforced sandstones are greatly improved as a whole. Under the same stress, with the increase of the reinforced area, the deformation of the sample decreases. The rheological variation is obviously controlled, and the deformation of rock is restrained by CFRP. The reinforced sandstone with an area of 3140 mm2 underwent 6-stage stress-rheological behavior (132.2 h) and the ultimate rheological deformation was 1.96038%. While the reinforced sandstone with an area of 4710 mm2 underwent 8-stage stress-rheological behavior (184.3 h), the final rheological deformation was 2.46767%. With the increase of reinforcement area, the times of graded loading and rheological duration increase, and the effect of CFRP on restraining sandstone deformation is better.
From the point of view of failure rheological stress, the value of failure rheological stress of rock is 65 MPa when the reinforcement area is 3140 mm2. While the value of failure rheological stress of rock is 75 MPa when the reinforcement area is 4710 mm2. The value of failure rheological stress increased by about 15.4%. The former lasted 15 h and the latter 20 h, an increase of 33.3%. With the increase of the reinforcement area, the rheological failure value of the sample increases greatly, and the rheological velocity of the rock is delayed. At the same time, the plastic strain of sandstone under the two kinds of reinforcement areas increases rapidly with time, and the rheological rate increases until the sample is destroyed.
3.2. Interval Analysis of Rheological Stress
According to the amount of stress applied, the stress in the rheological process of fractured sandstone strengthened with CFRP can be divided into three zones: low stress, middle stress, and high stress. The stress intervals are shown in Table 4.
Table 4.
Distribution of stress interval.
According to Table 4 and Figure 6, the rheological behavior of fractured sandstone with various reinforcement areas is similar and different under three loading stress intervals. When the loading stress is in the low stress range, the sample only has two stages of initial and stable rheology. The strain of the specimen tends to be constant with the increase of time, at this time, the corresponding stable rheological stage of strain rate is approximately 0. The specimen is in the elastic deformation stage. When the loading stress is in the middle stress range, the specimen enters the accelerated rheological stage, the rheological rate and the strain are larger than the stable rheological stage. And the specimen is in the elastoplastic deformation stage. When the loading stress is in the high stress range, the specimen enters the post-peak rheological stage. The strain and rheological rate increase rapidly until the specimen is destroyed. The specimen is in the plastic deformation stage. It can be seen that the fractured sandstone with different reinforcement areas has undergone a rheological process from low stress interval to high stress interval. Moreover, the mechanical properties of the sandstones are viscoelastic-plastic, which plays an important role in the subsequent energy characteristics analysis.
4. Energy Signature Analysis
4.1. Energy Evolution Analysis of Rheological Processes
Based on the characteristics of energy evolution, the rheology of fractured sandstone strengthened with CFRP can be divided into four stages: initial stage I, stable stage II, accelerated stage III, and post-peak stage IV. The specific rheological stages are shown in Figure 7a,b.
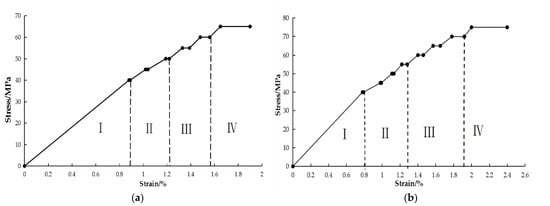
Figure 7.
The division of rheological stages under different reinforcement area:(a) A = 3140 mm2; (b) A = 4710 mm2.
The initial rheological stage refers to the initial stress loading stage. The strain increases rapidly because of the fracture surface compaction. A small part of mechanical energy from external input is stored in the sandstone interior in the elastic energy form. Most of the dissipated energy is the damage dissipated energy caused by the compactness of sandstone.
In the stable rheological stage, the stress is in the low stress range. The strain increases steadily with time, but the strain is still small because the confining pressure exerted on the sandstone suppresses the deformation. At this time, the sandstone is in the stage of elastic deformation. Most of the mechanical energy imported from outside is stored in the sandstone in the way of elastic energy. The dissipative energy is the energy caused by the continuous compression of the fractures in sandstone and the formation of some new fractures.
The accelerated rheological stage is that the stress is in the middle stress range. The strain increases rapidly with time. The confining pressure loses its function of restraining the deformation of sandstone, and CFRP begins to replace confining pressure to restrain the deformation. At this time, the sandstone was in the stage of elastic-plastic deformation, and the mechanical energy from external input was stored in the interior of the sandstone as elastic energy. However, the elastic energy increased slowly compared with the first two stages. The dissipative energy is the energy caused by new cracks and the plastic dissipative energy caused by CFRP deformation.
In the post-peak rheological stage, the stress is in the high stress range. The strain increases rapidly in a short time, the CFRP inhibition decreases, and the whole sandstone is destroyed. At this time, the sandstone is in the stage of plastic deformation. The elastic energy is stored up to the limit of energy storage, and the elastic energy is released in the form of surface energy. The mechanical energy is mainly used for plastic deformation, i.e., plastic dissipation energy.
4.2. Energy Calculation Analysis
In the step-loading rheological test, the total energy (U) absorbed by the rock is equal to the area under the stress-strain curve of the specimen during the loading and rheological process. Part of the total energy is stored in the rock in the form of elastic energy (Ue) and part of the total energy is in the form of dissipative energy (Ud), which is used for damage and the plastic deformation of rock.
According to the principle of energy conservation, before the post-peak rheological stage, the following relations should be satisfied during the loading process of sandstone:
where Ue is elastic energy; Ud is dissipative energy.
The expression for the total energy (U) is:
The expression for elastic energy (Ue) is:
where E0 is the initial elastic modulus, GPa; V is Poisson ratio; σ1 is axial pressure, MPa; σ3 is confining pressure, MPa.
After the post-peak rheological stage, the elastic energy accumulated in the first three rheological stages is released. The energy input in this stage is used for the plastic deformation of the sandstone, i.e., the energy input in this stage is equal to the plastic dissipative energy. Satisfy the following relationships:
where U4 is input total energy in post-peak stage; is plastic dissipative energy.
The energy relationships of fractured sandstones under the two reinforcement areas at various rheological stages are shown in Figure 8a,b.
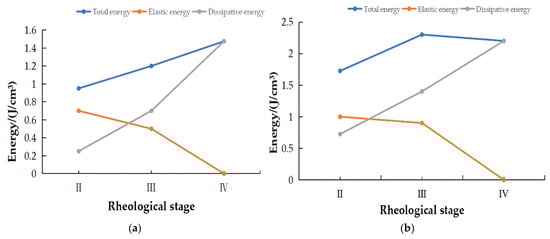
Figure 8.
The energy relationships of fractured sandstones under two reinforcement areas:(a) A = 3140 mm2; (b) A = 4710 mm2.
After the initial rheological stage, the change trend of energy of sandstone under the two kinds of reinforcement areas is basically the same. It is shown that the total energy increases, and the elastic energy decreases, indicating that the stable rheological stage is the stage with the best energy storage effect of sandstone. In the stage of accelerated rheology, the energy storage is decreased because the sandstone is near the limit of energy storage and some plastic deformation begins to occur. In the post-peak rheological stage, the elastic energy is dissipated as surface energy. The input energy is no longer converted into elastic energy, so the elastic energy of this stage is 0. The increase of dissipative energy indicates that the sandstone is in the state of compaction in the stable rheological stage, and most of the energy is stored in the interior in the form of elastic energy. In the accelerated rheological stage, new fractures begin to form, and more dissipative energy is produced. In the post-peak rheological stage, the input energy is converted into plastic dissipative energy. The elastic energy and the dissipated energy are equal at the accelerated rheological stage, and the curves of them are of “X” shape. However, in the initial rheological stage, the original fractures of sandstone need to be compressed. So, the dissipative energy is much larger than the elastic energy. For example, the dissipative energy is 17.62 J/cm3 and the elastic energy is 0.38 J/cm3 when the reinforcement area is 3140 mm2.
In order to better describe the degree of energy consumption in each stage of the sandstone rheological process, Figure 9 shows the change curve of energy dissipation rate (Ud/U).
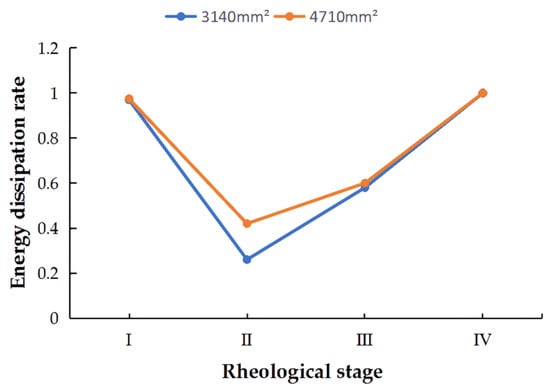
Figure 9.
Energy dissipation rate curve.
The change trend of energy dissipation rate of sandstone under two kinds of reinforcement areas is the same, which decreases first and then increases, showing a “V” type. In the stable rheological stage, the dissipation rate reaches the minimum, which is 0.26 (A = 3140 mm2) and 0.42 (A = 4710 mm2) respectively, which is due to: ① The rock consumed large dissipation of energy in the initial rheological stage of because of fracture compaction. ② In the stable rheological stage, the degree of fracture compaction is the best, and the stress did not reach the peak limit of the sandstone. The rheology tends to the stable value, and most of the energy is stored in the interior of the sandstone in the form of elastic energy. The damage to the sandstone is small.
4.3. Analysis of Energy Mechanism of CFRP
In order to better describe the energy change of CFRP during rheological process, the stress-energy curve of CFRP is given in Figure 10.
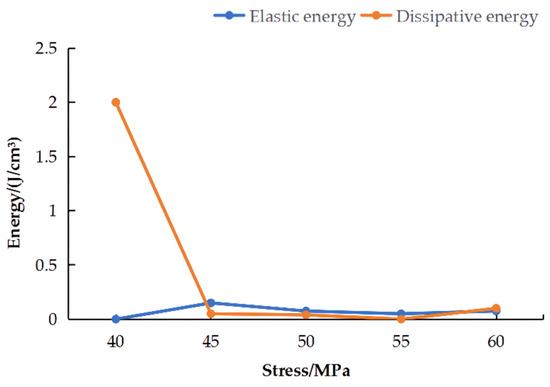
Figure 10.
Energy curve of CFRP.
The area of CFRP energy calculation in Figure 10 is 1570 mm2. The range of stress is that before entering the post-peak rheological stage, the two kinds of reinforcing areas of sandstone experienced the common stress. The elastic energy increases first, then decreases, and then increases again. When the stress is 40 MPa, the elastic energy is 0.01 J/cm3, which shows that the elastic energy storage of CFRP is almost non-existent in the initial rheological stage. Further, the elastic energy reaches the minimum value of 0.05 J/cm3 when the stress is 55 MPa. It is indicated that the elastic energy of sandstone and CFRP begin to be stored at the stage of stable rheology, but the energy of CFRP is smaller compared with the elastic energy of rock. The dissipation energy of CFRP decreases at first and then increases. When the stress is 40 MPa, the dissipation energy of CFRP is 2 J/cm3, reaching the maximum. This shows that the dissipation of CFRP is more than that of the rheological process at the initial rheological stage, when the stress is suddenly increased. Further, when the stress is 55 MPa, the minimum dissipation energy is 0.01 J/cm3. It indicates that the dissipation energy is mainly caused by the inner damage of sandstone at the stable rheological stage. The confining pressure can still restrain the deformation. Further, the CFRP does not play a major role.
In conclusion, except the initial rheological stage, the energy storage is greater than the energy consumption before the critical point of 55 MPa. In this paper, 55 MPa is defined as the energy inflection point of CFRP. Moreover, the energy inflection point corresponds to the middle stress interval of the preceding text. Therefore, the mechanism of CFRP is that the low-stress region consumes energy first and then stores energy. However, the storage energy is still greater than the consumption energy after the beginning of stable rheology, which is concluded primary energy storage and secondary energy consumption. After the energy inflexion point in the middle stress interval, the mechanism of CFRP changes to the primary energy dissipation and the secondary energy storage. Moreover, the sandstone gradually enters the accelerated rheology. The energy consumption of the CFRP-rock increases gradually.
4.4. Energy Storage Coefficient Analysis of CFRP
According to the analysis of the energy action mechanism of CFRP above, the main energy of CFRP is different under each stress. In order to better describe the energy action mechanism of CFRP, the ratio of elastic energy Ue to dissipative energy Ud under arbitrary stress is defined as energy storage coefficient T. The coefficient can be used to describe directly whether the elastic energy or dissipative energy is the main function of CFRP under arbitrary stress. The expression is as follows:
where T is energy storage coefficient; Ud is dissipative energy under arbitrary stress, J/cm3; Ue is elastic energy under arbitrary stress, J/cm3.
According to Equation (5), when the energy storage coefficient T > 1, the mechanism of CFRP is primary energy storage and secondary energy consumption. That is, the damage degree of CFRP is small under this stress. When the energy storage coefficient T < 1, the mechanism of CFRP is primary energy consumption and secondary energy storage. In other words, the damage degree of CFRP is great under this stress. CFRP energy storage coefficient analysis is shown in Figure 11.
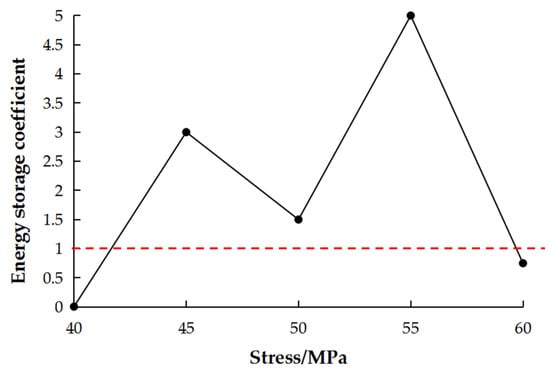
Figure 11.
CFRP energy storage coefficient curve.
As shown in Figure 11, when the sandstone is in the initial rheological stage, the stress is 40 MPa. After the energy inflexion point, the stress is 60 MPa. The energy storage coefficient of CFRP under these two stresses are less than 1, which indicates that the damage degree of CFRP is greater than that of the other three kinds of stress. The minimum energy storage coefficient is 0.005 when the stress is 40 MPa. CFRP mainly works in the form of damage dissipation energy. When the sandstone is mainly in the stable rheological stage, i.e., the stress is 45 MPa, 50 MPa, and 55 MPa, the energy storage coefficient of CFRP is greater than 1. This shows that the degree of energy storage of CFRP is greater than that of the other two kinds of stress. CFRP mainly works in the form of elastic energy. The energy storage coefficient of the energy inflexion point reaches the maximum value of 5, which shows that the energy storage degree of CFRP reaches the maximum. After the energy inflexion point, the energy mechanism of CFRP changes into energy dissipation until the specimen is destroyed.
5. Conclusions
Based on the rheological tests of fractured sandstone strengthened with CFRP, the rheological characteristics and the law of energy evolution of fractured sandstone under different strengthening areas are analyzed. It is found that CFRP can restrain the deformation of rock mass to a certain extent. The energy change of sandstone and CFRP during the rheological process is revealed. The failure mechanism of sandstone is described in terms of energy. The main conclusions are as follows:
- The larger the area of CFRP reinforcement, the greater the failure rheological stress of sandstone, the smaller the rheological variation under the same stress, the longer the rheological duration, and the better the effect of restraining deformation. The rheology of fractured sandstone strengthened with CFRP can be divided into four stages: initial rheology, stable rheology, accelerated rheology, and post-peak rheology. The loading stress can be divided into three zones: low stress, middle stress, and high stress.
- In the process of rheological failure of fractured sandstone strengthened with CFRP, the elastic energy decreases and the dissipative energy increases from the stable rheological stage. Further, the absorbed energy is completely converted into dissipative energy at the post-peak rheological stage. Rock no longer carries out elastic energy storage, and the elastic energy accumulated in the previous stage is released. The energy dissipation rate of the two areas reached the minimum in the stable rheological stage, indicating that most of the energy in this stage was stored in the form of elastic energy. Moreover, the rock had the best compactness, which is convenient for elastic energy storage. Rock damage is minimal.
- The energy mechanism of CFRP is that CFRP consumes energy first, then stores energy in the low-stress region. In this region, the mechanism of CFRP is primary energy storage and secondary energy consumption. When in the middle stress region after the energy inflexion, the mechanism of CFRP changes to primary energy consumption and secondary energy storage. CFRP has the minimum energy storage and the maximum energy consumption in the initial rheological stage. The energy storage coefficient of CFRP can describe the damage degree of it. When the energy storage coefficient T > 1, the damage of CFRP is small. When the energy storage coefficient T < 1, the damage of CFRP is large. Among them, the damage of CFRP is the biggest in the initial rheological stage, and the damage of energy inflexion is the smallest.
Author Contributions
Conceptualization and methodology, J.Y.; investigation, S.Z. and Y.L.; formal analysis, J.G. and X.Y.; data curation, Y.L.; project administration, S.Z.; funding acquisition, S.Z.; writing-original draft preparation, J.Y.; writing-review and editing, J.Y. and S.Z. All authors have read and agreed to the published version of the manuscript.
Funding
This study was supported by the National Natural Science Foundation of China (42067041) and was supported by Guangxi Natural Science Foundation under Grant No. 2020GXNSFAA159125.
Informed Consent Statement
Informed consent was obtained from all subjects involved in the study.
Data Availability Statement
The data presented in this study are available on request from the corresponding author. The data are not publicly available due to privacy.
Conflicts of Interest
The authors declare no conflict of interest.
References
- Xie, H.; Li, L.; Peng, R.; Ju, Y. Energy analysis and criteria for structural failure of rocks. J. Rock Mech. Geotech. Eng. 2009, 1, 11–20. [Google Scholar] [CrossRef]
- Wang, H.Y.; Arcady, D.; Phil, D.; Elena, P.; Ariel, H. Review of unloading tests of dynamic rock failure in compression. Eng. Fract. Mech. 2020, 225, 106289. [Google Scholar] [CrossRef]
- Cong, L.; Hu, X. Triaxial rheological property of sandstone under low confining pressure. Eng. Geol. 2017, 231, 45–55. [Google Scholar] [CrossRef]
- Wu, L.; Li, B.; Huang, R.; Sun, P. Experimental study and modeling of shear rheology in sandstone with non-persistent joints. Eng. Geol. 2017, 222, 201–211. [Google Scholar] [CrossRef]
- Nguyen-Sy, T.; Minh-Ngoc, V.; Quy-Dong, T.; Minh-Quan, T.; Nguyen-Thoi, T. On the effective viscoelastic properties of a fractured rock mass. J. Appl. Geophys. 2019, 169, 125–133. [Google Scholar] [CrossRef]
- Patton, T.L.; Raymond, C.F. A rheological model for fractured rock. J. Struct. Geol. 1998, 20, 491–502. [Google Scholar] [CrossRef]
- Hamza, O.; Stace, R. Creep properties of intact and fractured muddy siltstone. Int. J. Rock Mech. Min. Sci. 2018, 106, 109–116. [Google Scholar] [CrossRef]
- Li, M.; Li, K.; Zhang, D.; Liu, C.; Ma, D. Study on Creep Characteristics and Constitutive Relation of Fractured Rock Mass. Shock Vib. 2020, 2020, 8833512. [Google Scholar] [CrossRef]
- Zhang, L.; Yang, S. Unloading Rheological Test and Model Research of Hard Rock under Complex Conditions. Adv. Mater. Sci. Eng. 2020, 2020, 3576181. [Google Scholar] [CrossRef]
- Khramchenkov, M. Rheological double-porosity model for clayey rocks. Int. J. Rock Mech. Min. Sci. 2005, 42, 1006–1014. [Google Scholar] [CrossRef]
- Osipov, Y.V.; Voznesenskii, A.S. Investigation of the Rheological Properties of Rocks in Experiments on Stepwise Loading of Cylindrical Samples. J. Appl. Mech. Tech. Phys. 2022, 63, 347–355. [Google Scholar] [CrossRef]
- Liu, L.; Wang, G.-M.; Chen, J.-H.; Yang, S. Creep experiment and rheological model of deep saturated rock. Trans. Nonferrous Met. Soc. China 2013, 23, 478–483. [Google Scholar] [CrossRef]
- Wang, J.; Xu, J.; Nie, Z.; Liu, L.; Qin, M.; Ou, R. Creep Fracture Characteristics of Fractured Rock Mass Strengthened with Toughened Epoxy Resin. Adv. Civ. Eng. 2021, 2021, 1582745. [Google Scholar] [CrossRef]
- Lyakhovsky, V.; Podladchikov, Y.; Alexei, P. A rheological model of a fractured solid. Tectonophysics 1993, 226, 187–198. [Google Scholar] [CrossRef]
- Zakharov, V.N.; Trofimov, V.A.; Filippov, Y.A. Numerical Modeling of Rock Bolt Support in Case of Rheological Behavior of Rock Mass in Deformation. J. Min. Sci. 2021, 57, 883–893. [Google Scholar] [CrossRef]
- Lukic, D.C.; Zlatanovic, E.M.; Jokanovic, I.M. Tunnel lining load with consideration of the rheological properties of rock mass and concrete. Geomech. Eng. 2020, 21, 53–62. [Google Scholar] [CrossRef]
- Wang, Y.; Cui, F. Energy evolution mechanism in process of Sandstone failure and energy strength criterion. J. Appl. Geophys. 2018, 154, 21–28. [Google Scholar] [CrossRef]
- Zhou, Z.; Cai, X.; Li, X.; Cao, W.; Du, X. Dynamic Response and Energy Evolution of Sandstone Under Coupled Static–Dynamic Compression: Insights from Experimental Study into Deep Rock Engineering Applications. Rock Mech. Rock Eng. 2020, 53, 1305–1331. [Google Scholar] [CrossRef]
- Wasantha, P.; Ranjith, P.; Shao, S. Energy monitoring and analysis during deformation of bedded-sandstone: Use of acoustic emission. Ultrasonics 2014, 54, 217–226. [Google Scholar] [CrossRef]
- Arsalan, N.; Palayangoda, S.S.; Burnett, D.J.; Buiting, J.J.; Nguyen, Q.P. Surface energy characterization of sandstone rocks. J. Phys. Chem. Solids 2013, 74, 1069–1077. [Google Scholar] [CrossRef]
- Seth, S.; Morrow, N.R. Efficiency of the Conversion of Work of Drainage to Surface Energy for Sandstone and Carbonate. SPE Reserv. Eval. Eng. 2007, 10, 338–347. [Google Scholar] [CrossRef]
- Sufian, A.; Russell, A.R. Microstructural pore changes and energy dissipation in Gosford sandstone during pre-failure loading using X-ray CT. Int. J. Rock Mech. Min. Sci. 2013, 57, 119–131. [Google Scholar] [CrossRef]
- Wang, P.; Xu, J.Y.; Fang, X.Y.; Wang, P.X. Energy dissipation and damage evolution analyses for the dynamic compression failure process of red-sandstone after freeze-thaw cycles. Eng. Geol. 2017, 221, 104–113. [Google Scholar] [CrossRef]
- Zhang, J.; Song, Z.; Wang, S. Experimental investigation on permeability and energy evolution characteristics of deep sandstone along a three-stage loading path. Bull. Eng. Geol. Environ. 2021, 80, 1571–1584. [Google Scholar] [CrossRef]
- Li, T.; Pei, X.; Guo, J.; Meng, M.; Huang, R. An Energy-Based Fatigue Damage Model for Sandstone Subjected to Cyclic Loading. Rock Mech. Rock Eng. 2020, 53, 5069–5079. [Google Scholar] [CrossRef]
- Khan, N.M.; Ma, L.; Cao, K.; Hussain, S.; Liu, W.; Xu, Y.; Yuan, Q.; Gu, J. Prediction of an early failure point using infrared radiation characteristics and energy evolution for sandstone with different water contents. Bull. Eng. Geol. Environ. 2021, 80, 6913–6936. [Google Scholar] [CrossRef]
- He, Z.; Gong, F.; Wu, W.; Wang, W. Experimental investigation of the mechanical behaviors and energy evolution characteristics of red sandstone specimens with holes under uniaxial compression. Bull. Eng. Geol. Environ. 2021, 80, 5845–5865. [Google Scholar] [CrossRef]
- Wen, T.; Tang, H.; Ma, J.; Liu, Y. Energy Analysis of the Deformation and Failure Process of Sandstone and Damage Constitutive Model. KSCE J. Civ. Eng. 2019, 23, 513–524. [Google Scholar] [CrossRef]
- Li, M.; Mao, X.; Lu, A.; Tao, J.; Zhang, G.; Zhang, L.; Li, C. Effect of specimen size on energy dissipation characteristics of red sandstone under high strain rate. Int. J. Min. Sci. Technol. 2014, 24, 151–156. [Google Scholar] [CrossRef]
- Gautam, P.K.; Jha, M.K.; Verma, A.K.; Singh, T.N. Evolution of absorption energy per unit thickness of damaged sandstone. J. Therm. Anal. Calorim. 2019, 136, 2305–2318. [Google Scholar] [CrossRef]
- Wang, B.; Ning, Y.; Feng, T.; Wang, W.J.; Guo, Z.Y. Uniaxial mechanical properties of anchored sandstone and control machanism of buckling rock burst. J. Cen Sou Uni. 2019, 50, 2285–2294. (In Chinese) [Google Scholar] [CrossRef]


Publisher’s Note: MDPI stays neutral with regard to jurisdictional claims in published maps and institutional affiliations. |
© 2022 by the authors. Licensee MDPI, Basel, Switzerland. This article is an open access article distributed under the terms and conditions of the Creative Commons Attribution (CC BY) license (https://creativecommons.org/licenses/by/4.0/).