Article

Application of Sustainable Concrete in the Seismic Evaluation of an Innovative Type of Buckling Restrained Brace

1
School of Engineering and Design, Technical University of Munich (TUM), 80290 Munich, Germany
2
Department of Civil & Geomatics Engineering, California State University, Fresno, CA 93740, USA
*
Author to whom correspondence should be addressed.
Sustainability 2022, 14(24), 16344; https://doi.org/10.3390/su142416344
Submission received: 26 October 2022 / Revised: 28 November 2022 / Accepted: 2 December 2022 / Published: 7 December 2022

Abstract

:
The Buckling Restrained Braced Frame (BRBF), consisting of a ductile steel core in concrete or a steel tube encased in concrete, is constructed to avoid brittle failure modes. The application of ductile materials with improved damping properties, such as tire-derived lightweight aggregate concrete, has not been investigated in BRBF systems, but it enhances the overall performance of the system and contributes to sustainability. Hence, this study aims to investigate the influence of such an application on the response modification, overstrength, and ductility factors, as well as the general earthquake performance, of 4-, 8-, and 14-story special reinforced concrete moment resisting frames equipped with BRBF. The current study compares 48 different BRBF models with TDA infill and conventional concrete infill by considering various bracing configurations, such as Chevron (Inverted V and V), Split X, and Single-Leg BRBF, and different span lengths of 6 m and 8 m. The evaluations include nonlinear response history analyses intended to provide insights into the performance of BRBF when exploiting the available experimental stress–strain characteristics of tire-derived lightweight aggregate concrete as an alternative material. Furthermore, the effectiveness of using tire-derived lightweight aggregate concrete as an alternative damping material in BRBF is examined by comparing BRBF with the new damping properties of concrete. Buildings equipped with BRB encased in TDA showed reduced base shear demand (by an average of 7%) when compared to concrete infill, and the prescribed value for the response modification factor for buildings of 50 m or less provides an acceptable estimation of the lower bond factors in approximately 95% of the cases. Furthermore, when a system requires more damping, the application of BRB encased in TDA is recommended.

1. Introduction

Predicting structural behavior when subjected to seismic excitation is a challenging task for civil engineering. The damage level can be determined when a structure dissipates a large amount of kinetic energy caused by an earthquake. Since it is not economically feasible to dissipate this energy within the elastic range of materials, building codes allow the structure to yield in controlled/defined areas and a ductile manner in designated elements; in conventional braced frames, these elements are the so-called structural fuses [1]. Three major control system classes can replace conventional bracing systems: passive, active, and semi-active [2]. Among them, passive energy dissipation devices are characterized by an ability to enhance energy dissipation in the structural system, either by transferring the kinetic energy to heat, such as by frictional sliding, by the yielding of metals and viscoelastic solids or fluids, or via vibrating modes, such as using supplemental oscillators [3]. Conventional braces buckle when under compression, which leads to progressive degrading behavior and a loss of stiffness. To resolve this issue, Professor Wada developed an unbounded brace that provides an unbounded layer between the steel core and surrounding concrete to take all axial loads. Unbonded braces can provide both stiffness and a stable energy absorption capability; the brace forces are reduced and do not need to be designed for buckling [1]. This results in lower costs for new construction or retrofitting existing buildings, with lower forces in the superstructure and foundation; this model can be categorized as a passive control system, as presented in Figure 1.
The United Nations world commission on environment and development described sustainable development as “development that meets the needs of the present without compromising the ability of future generations to meet their own needs”. Sustainability is a long-term goal, and to achieve sustainable development, numerous steps should be followed, including enhancing the understanding of the environment, society, economy, and culture and the connection between them [5]. Concrete sustainability has been developed by using alternative fuels and raw materials in cement production, as well as utilizing reclaimed water and reused materials. The selection of materials in the concrete mixture, such as cementitious materials, aggregates, admixtures, and water, directly affects sustainable concrete. Non-conventional aggregates, such as lightweight aggregate, recycled/reused aggregates, recycled concrete, screening, crushed glass aggregate, waste plastic aggregate, recycled scrap tire aggregate, and recycled asphalt pavement aggregate, are becoming more popular. They reduce waste materials, CO2 emissions, and embodied energy; therefore, their use contributes to sustainability [6]. Rubberized concrete is the general name for tire-derived aggregate concrete. The idea is to enhance ductility by combining flexible and rigid materials [7]. Tire-derived aggregate (TDA) is derived from waste tires fitted to a standard range of practical sizes. TDA is defined as shredded scrap tires with a basic geometrical shape and can be split into two practical types; Type A, ranging from 75 to 100 mm, and Type B, ranging from 150 to 300 mm [8]. Aside from the environmental benefits of TDA, it can be used as a lightweight engineering application, and its engineering properties make TDA suitable for many civil engineering applications. It is also a very durable material and has significant cost advantages. The mechanical properties of tire-derived lightweight aggregate concrete (TDLWAC) were investigated using 38 cylindrical and 36 beam specimens [9]. The compressive, splitting tensile, flexural strength, flexural toughness, and impact flexure properties of rubberized lightweight aggregate were examined. The target strength was 21 MPa. The cylinder and beam specimens contained shale lightweight coarse aggregate, natural sand fine aggregate, cement, and water; the TDA was added to the cylinder and beam specimens in replacement ratios of 0% to 100%. A compression test was carried out using a 500 kN testing machine that applied 0.24 MPa per second to capture the strain gauge. ASTM C469 [10] was used to determine the static modulus of elasticity, and the stress–strain relationship was determined from the load–deflection data obtained during each test. The splitting tensile strength was determined via the load–deflection relationship and in accordance with ASTM C496 [10]. It was concluded that the static mechanical properties decreased when the rubber content increased, and these materials were found to be useful where energy absorption was considered an important aspect. Bracings have been used as the most common lateral load-resisting system. However, they do not perform well in the nonlinear deformation range, given their low ductility, nonsymmetrical hysteresis curve in tension and compression, and stiffness degradation due to buckling in cyclic loading. Therefore, a new generation of bracing systems known as “Buckling Restrained Braced Frames (BRBF)” has been investigated. These bracing systems have symmetric hysteresis curves, high ductility, and large drift capacity [11].
In ASCE 7-22 [12] and NBCC 2015 [13], the minimum earthquake lateral force is divided by the Seismic Force Resisting System (SFRS) reduction factor, known as the response modification factor. This factor does not consider span length, bracing configuration, the building’s height, or the period of the structure. Several studies have been conducted to assess the seismic design factors and performance of conventional BRBFs [11,14,15]. Most of the research carried out in the past focused on the behavior of Buckling Restrained Braced Frames in steel structures, and various approaches have also been proposed to perform their seismic evaluation [16,17,18,19,20,21,22,23]. Further studies are required to characterize the capacities of the overall brace frame system to examine the actual behavior of buckling restrained braces encased with TDA/concrete fillings as new design approaches. This study introduces another application for the use of recycled scrap tire aggregates to reduce waste and contribute to sustainability. Furthermore, the capacities of the overall brace frame system, such as the seismic design factors, are characterized, and the actual behavior of buckling restrained braces encased with TDA/concrete fillings as a new design approach is investigated. For this purpose, the mechanical properties of tire-derived lightweight aggregate concrete (TDLWAC) [24] were used to model the innovative BRB with encased steel composite containing TDA filling. The seismic force reduction factors, including overstrength, ductility, and response modification factors, of four-, eight-, and fourteen-story special reinforced concrete moment frames equipped with BRBF, as well as a comparison between the BRB-encased steel with TDA infill as a new damping feature and the BRB-encased steel with concrete infill, are then discussed. In addition, the effects of building height and span length on four different bracing configurations, including Single-Leg Braces (SLB), Chevron Inverted V Braces (CIVB), Chevron V Braces (CVB), and Split X braces (SXB), were investigated. Moreover, nonlinear response history analyses using twenty-one scaled ground motions based on ASCE 7 [12] and the fundamental period of each structure are performed to demonstrate the efficiency of these bracing systems.
Figure 2 demonstrates the sustainable construction concept as it has been integrated into the analysis procedures. The Nonlinear Static Procedure can consist of different load cases with different distributions in which structural and member stiffness are updated at every step. In this method global displacement, component actions and story drift can be determined. The nonlinear dynamic procedure is based on the mathematical integration of the equations of motions, in this model global displacement, story drifts, and element distortion can be derived from component deformation. When the sustainable material has been selected, its mechanical properties should be extracted using experimental tests. Section 2 concerns the design of a buckling restrained brace frame; Section 3, Section 4 and Section 5 address the calculating of the seismic reduction factors of the integrated sustainable material and conventional concrete in a BRBF, and Section 5 and Section 6 regarding the structural modeling and the calculation of the fundamental period. The application and performance of ductile sustainable material were then verified using nonlinear static procedures (Section 8) and nonlinear response history analysis (Section 9, Section 10, Section 11 and Section 12), followed by results and conclusions in Section 13 and Section 14.

2. Design of Buckling Restrained Braced Frame

A buckling restrained brace (BRB), consisting of a ductile steel core in a concrete or mortar steel tube, can replace conventional braces. The steel core provides the yielding mechanism, while the tube prevents the buckling of the core. The buckling restrained bracing element and hysteretic behavior of conventional and buckling restrained bracing members are presented in Figure 3 [28].
The steel core is the primary source of energy dissipation and is expected to undergo inelastic deformation during a moderate to severe earthquake. The ductility of the BRBF can be achieved by limiting the buckling of the steel core [30].

3. Response Modification Factor

The seismic force values are calculated by forces divided by a response modification factor, symbolized as R. Response modification coefficients, including the response modification factor R and the deflection amplification factor Cd, were introduced by ATC 3-06 (1982) [31] based on a detailed seismic framing system. Depending on the performance level of the structure, the component of the response modification factor can be defined in several ways, but the focus of this paper is life safety performance. The general performances of the system types during past earthquakes, their toughness, and the damping of the system were considered for the selection of R values [32].
Two bilinear approximation methods can estimate yield force and yield displacement. The first approximation is the load- or strength-versus-displacement method for reinforced concrete elements [33]. Hereby, the elastic stiffness is based on the secant stiffness of the frame and can be calculated from the force–displacement curve. The second method is the equal energy approach. Utilizing a bilinear approximation of the actual response curve (base shear vs. displacement), it is assumed that the area enclosed by these curves above the actual curve (i.e., area 1) is equal to the enclosed area below the actual response curve (i.e., area 2) (Figure 4), where Vy is the yield force, Δy is the yield displacement and Δm and Δu are the displacements corresponding to a limit state prior to failure. The post-yield stiffness K1 can be calculated from Equation (1).
K 1 = V m a x V y Δ m Δ y

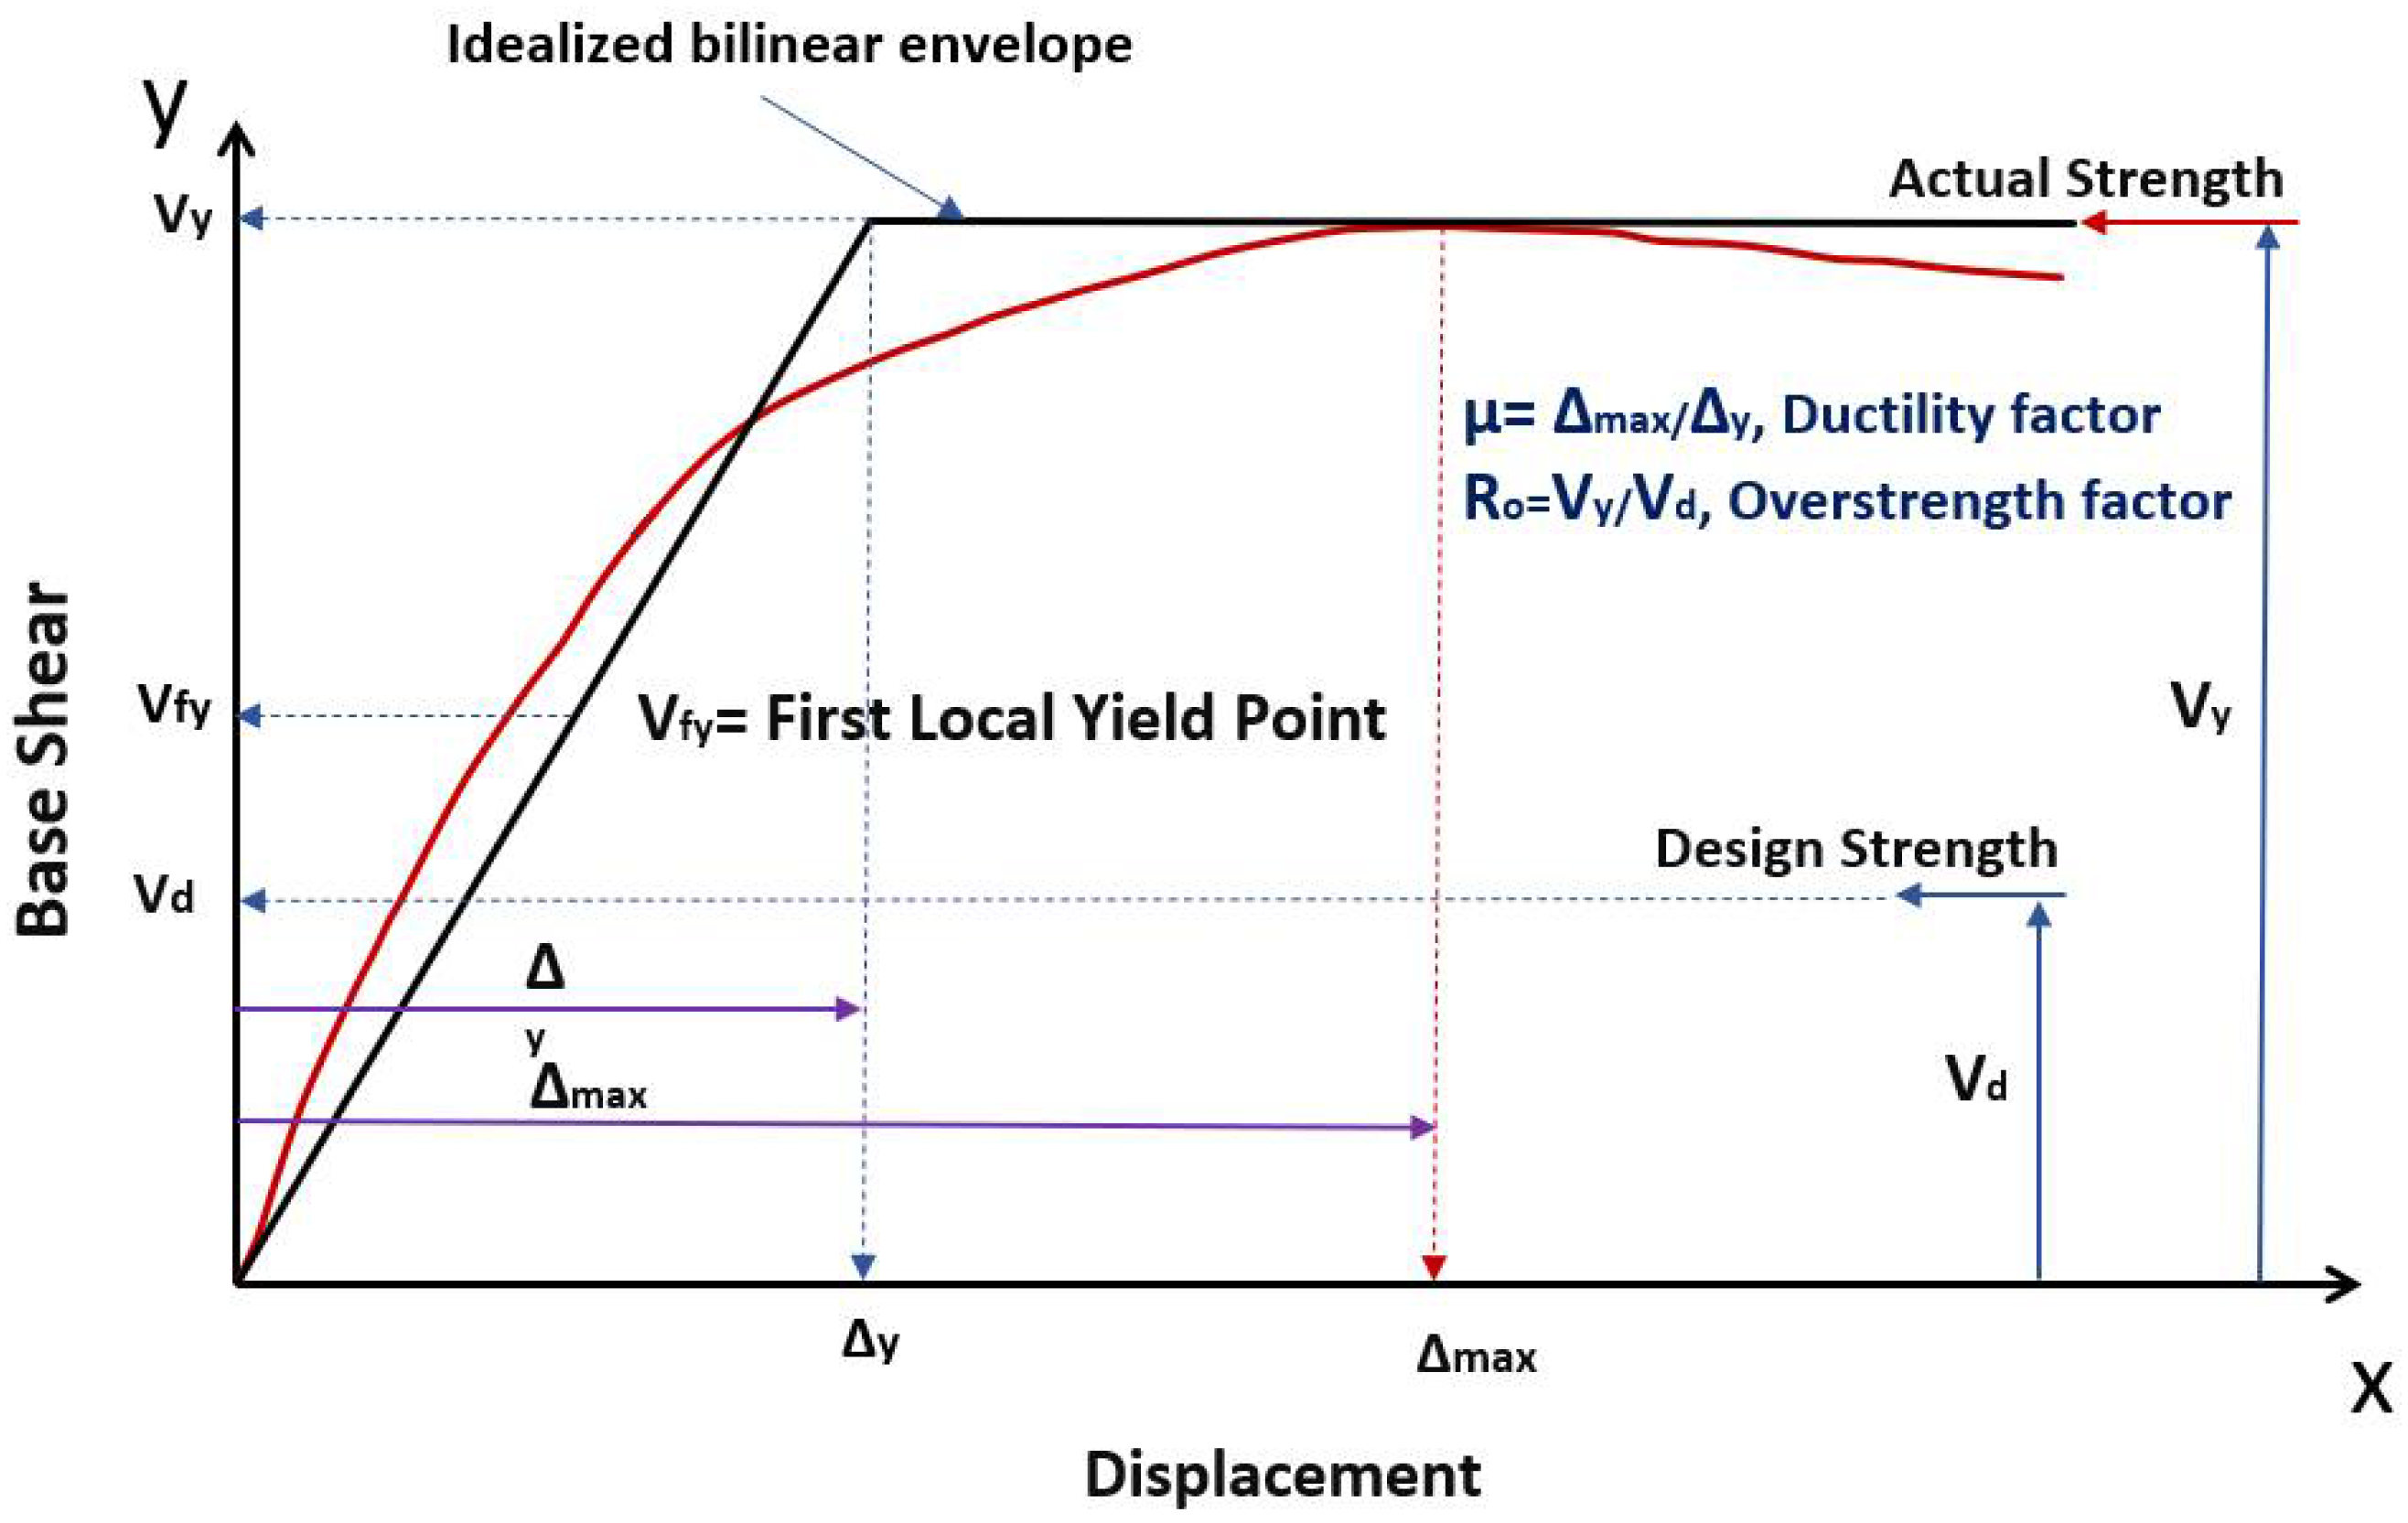
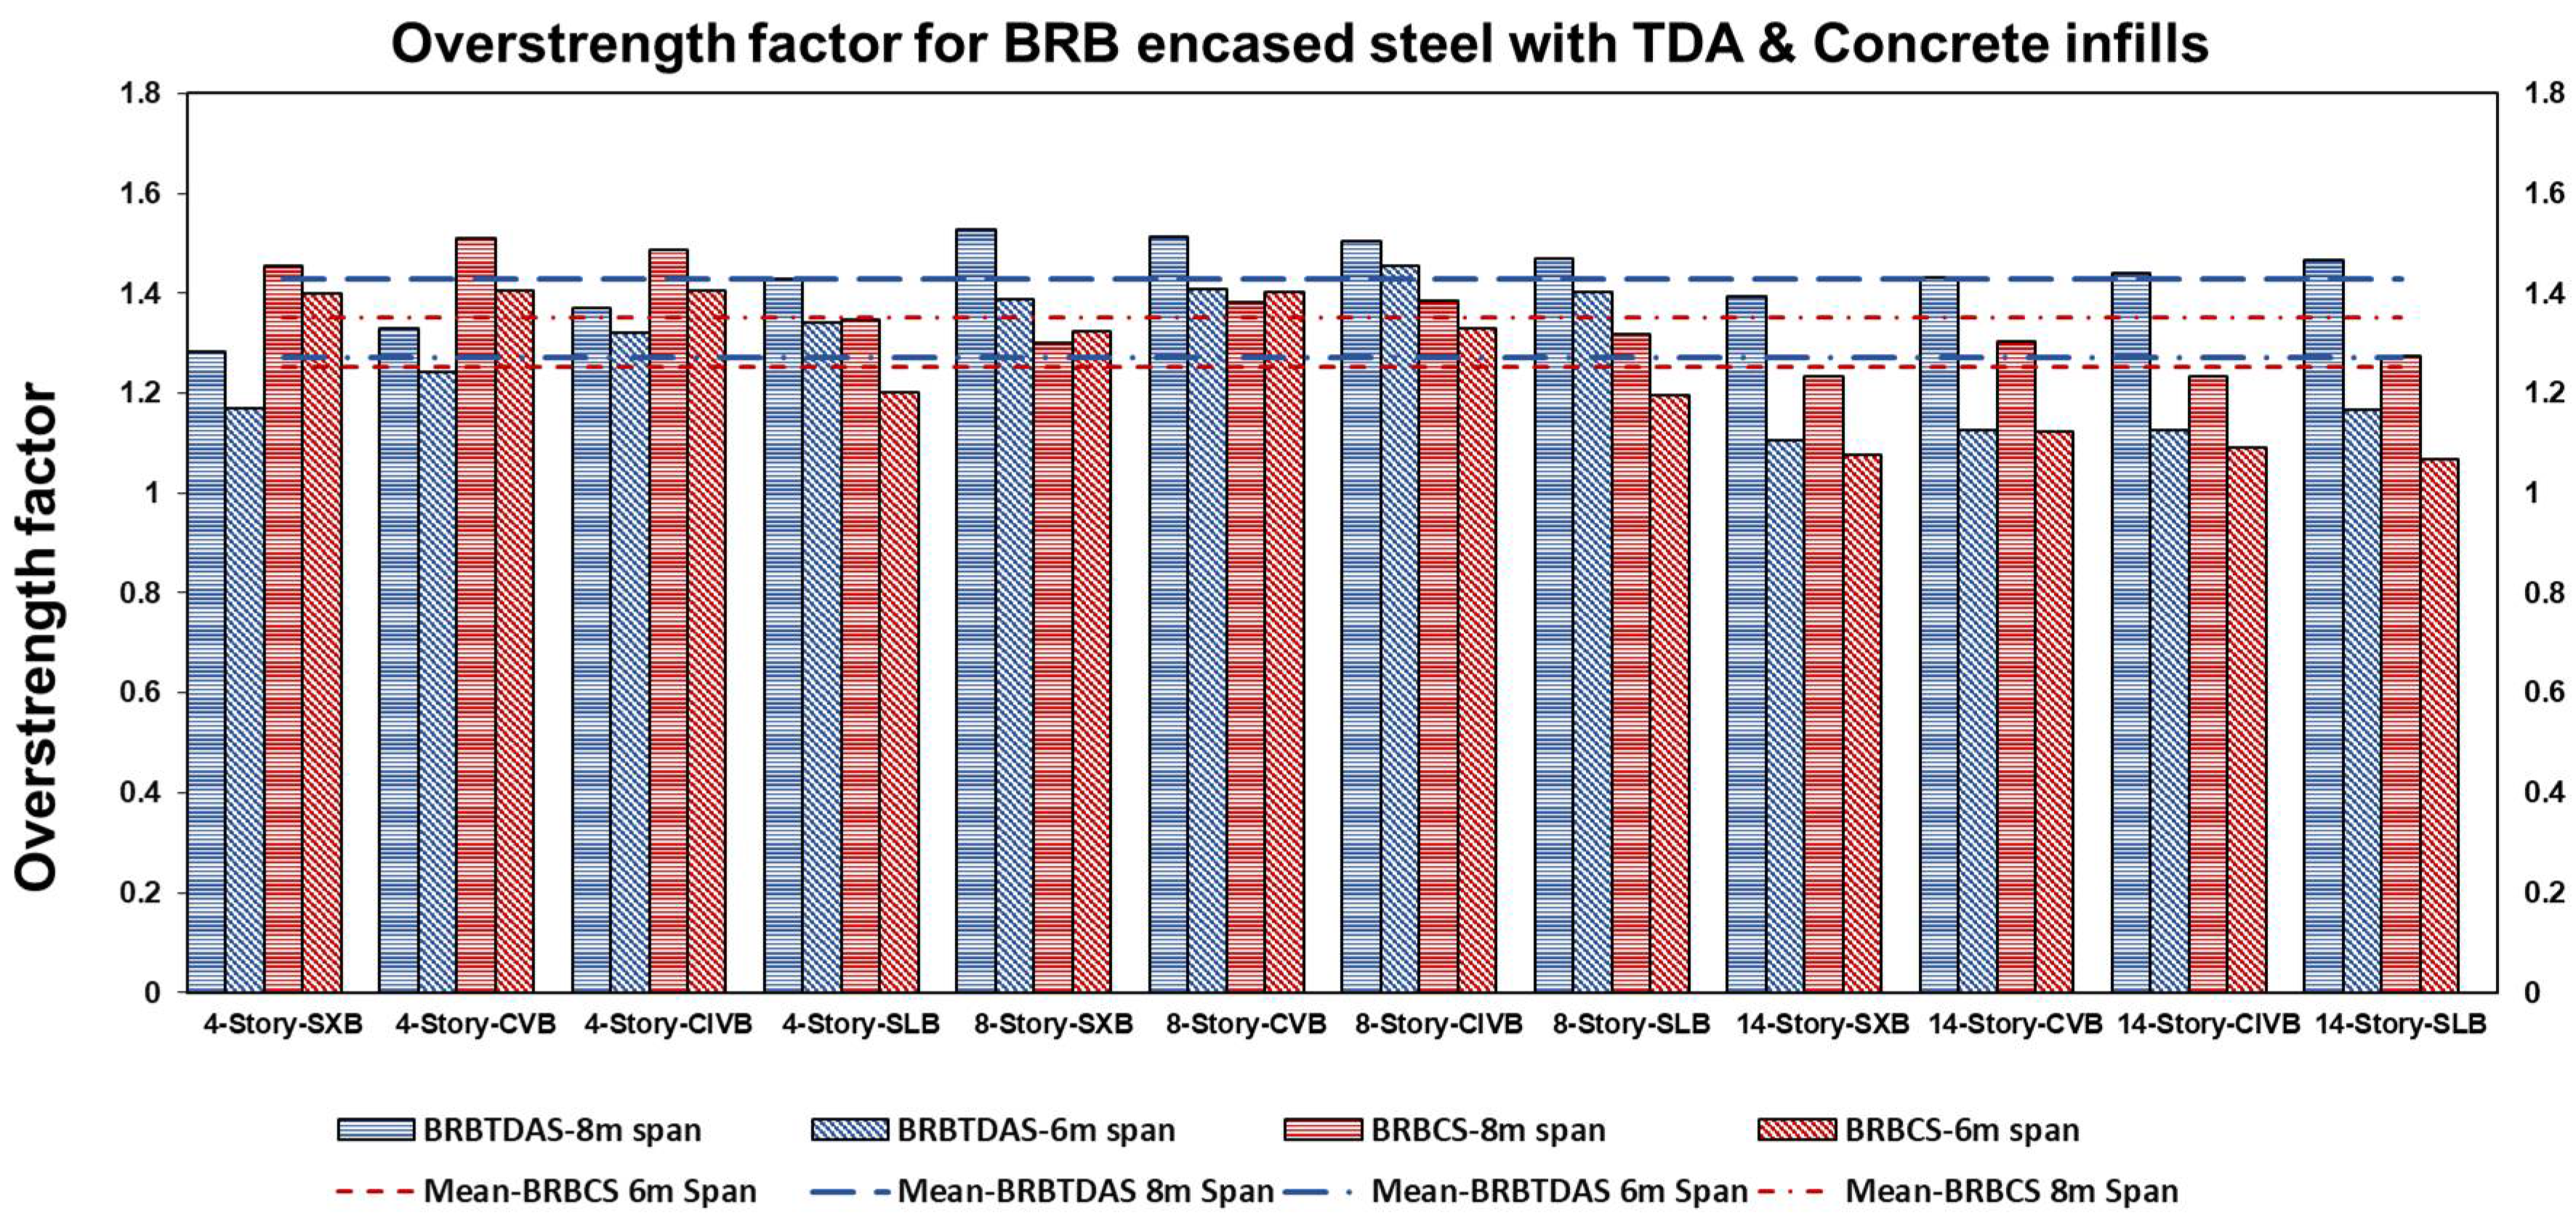
4. Overstrength Factors

Structural analysis under an earthquake in the elastic region can give the reverse strength in the structures, which is more significant than the structural response. The seismic codes take advantage of the fact that structures can dissipate a large amount of earthquake energy via their overstrength and ductility [11,14]. The ratio of the actual lateral strength (Vy) to the lateral design strength (Vd) is defined as the overstrength factor R0, as shown in Figure 5.

5. Ductility Factors

Several relationships estimate the ductility factor [34,35,36]. Rd is known as the ductility factor, which is the capacity of the structure to dissipate energy in an inelastic range by considering ductility µ, which can be calculated by dividing the maximum displacement over the displacement at the yield point, the soil type and the fundamental period of the structure. The methods proposed by Miranda and Bertero (1994) [35] and Nemark and Hall (1982) [36] were employed and compared in this study. According to Miranda and Bertero (1994) [35], the ductility reduction factor Rµ for stiff soil can be determined with Equations (2) and (3), where µ is ductility, T is the natural period of the structures, and ϕ is a function of ductility, the fundamental period and the soil conditions.
R μ = μ 1 φ + 1 1
ϕ = 1 + 1 10 T μ T 1 2 T e 1.5 ln T 0.6 2
Newmark and Hall (1982) [36] estimated the ductility reduction factor Rµ based on the structure period presented in Table 1.

6. Design of Structural Models

The lateral force versus deformation for a seismic force-resisting system is presented in Figure 6. The first plastic hinge occurred above the strength required by analysis due to specific design rules, limits, and material strengths. The system overstrength capacity is the margin at which the maximum strength along the curve is higher than the first highlighted yield. When the lateral load increases, plastic hinges are formed, followed by an increase in resistance until the maximum strength is reached.
In this research, the mechanical properties of tire-derived lightweight aggregate concrete (TDAC) and conventional concrete have been obtained from experimental tests [24] and used to model the BRB with TDA and conventional concrete. Forty-eight different models were created and their influence on the response modification, overstrength, and ductility factors, as well as the general earthquake performance, were assessed and compared against one another. The buildings under consideration are 4-, 8-, and 14-story special reinforced concrete moment frames equipped with buckling restrained braces with an interstory height of 4.5 m at the ground floor and 3.5 m at all levels, consisting of five bays in both east–west and north–south configurations. The buildings are assumed to be located in Los Angeles, California, on stiff soil (Type D). The height restriction for BRBFs risk category D is limited to 50 m, the maximum height restriction in this study. ASCE 7-22 [12] and ACI-19 [37] were used to design the 4-, 8-, and 14-story special reinforced concrete moment frames for BRB-encased steel with TDA and concrete infills to evaluate the overstrength, ductility, and response modification factors. Figure 7 displays the elevation, plan, and 3-D view of a 14-story building with various bracing configurations, such as Chevron (Inverted V and V), Split X, and Single-Leg BRBF, with span lengths of 6 m and 8 m; similar plans are considered for four- and eight-story buildings. The compressive strength f’c is 30 MPa, the modulus of elasticity Ec is 24,500 MPa, the unit weight of reinforced concrete is 24 kN/m3, the design live and dead loads for all models are assumed to be 1.5 kN/m2 and 2.4 kN/m2, and the snow load acting on the roof is 1.64 kN/m2.

7. Modal Analysis

The natural modes calculated from eigenvalue analysis provide the free-vibration mode shapes and frequencies of the system, whereas Ritz value analysis finds modes based on a specific loading. Since the Ritz value offers a better basis than eigenvalue, especially for analyses based on superposition such as response–spectrum or time–history, a Ritz value analysis was performed to determine the natural periods of the friction damper frame system. The fundamental period of the structure is calculated based on the results obtained from the ASCE 7-22 [12] with empirical Equation (4).
T a = C t h n x
where Ta is the fundamental lateral period, Ct and x are coefficients, and hn is the height of the structure. The results of the empirical equation Ta = 0.0731 × (hn)0.75 for hn = 50 m, 29 m, and 15 m, and the analytical results for BRB-encased steel with TDA and concrete infills are presented in Table 2 and Table 3. It can be observed that for BRB-encased steel with concrete infills, the empirical equation overestimates the fundamental period for four stories and is almost in the same range as the analytical results for eight- and fourteen-story buildings. However, for BRB-encased steel with TDA infills, the empirical equation underestimates the fundamental period for all different levels of buildings. The effect of bracing configuration and span length can be neglected due to minor differences.

8. Nonlinear Static Analysis

The static pushover analysis assumes that the response of the multi-degree-of-freedom structure can be equivalent to a single-degree-of-freedom system. This signifies that a single constant mode controls the response through the time–history regardless of the level of deformation. Although these assumptions are incorrect, several investigations have found that holding them can help yield a good prediction of the maximum seismic response of MDOF [38,39,40,41]. The equation for multi-degree of freedom can be written as Equation (5), based on this assumption [34]. Here, M is the mass matrices, C is the damping matrices, Q is the story force vector, x g ¨ is the ground acceleration, and X is the relative displacement vector equal to shape vector, φ, by roof displacement, x1.
M φ x 1 ¨ + C φ x 1 ˙ + Q = M 1 x g ¨
The single degree of freedom situation can be defined via Equation (6).
x * = φ T M φ φ T M 1 x t
The differential Equation (7) regards the equivalent single degree-of-freedom system and can be obtained by multiplying φ T in Equation (5) and substituting x t from Equation (6).
M * x ¨ * + C * x ˙ * + Q * = M * x g ¨
Presuming that the shape vector is known, from the results of the nonlinear pushover analysis of MDOF, the force deformation characteristics of the ESDF can be determined. Figure 8 presents the base shear vs. roof displacement (a) and idealized bilinear of ESDF with effective stiffness Ke (b). The effective stiffness Ke = Vy/xt,y, and the hardening stiffness Ks = αKe.
Sensitivity studies have shown that accurate predictions can be attained when the structural response is dominated by fundamental mode and the modification factor is constant for small to moderate changes in {φ}. This is also recommended by the National Hazard Reduction Program, and the seismic rehabilitation of existing buildings [42] is encouraged here as well as in various guidelines [43]. Nonlinear static pushover analysis is carried out to calculate the structural strength capacities and the deformation demand. This procedure involves pushing the structure under a lateral load pattern to the level of deformation expected in an earthquake. The main goal of this analysis is the evaluation of the deformation demands in critical elements with undesirable characteristics such as strength, stiffness discontinuities, extra loads on brittle elements, overall structural stability, and regions facing large deformation demands that require special detailing [38].
A pushover analysis can consist of different load cases with different load distributions on the structure, including acceleration, a lateral force proportional to a specified mode shape, static load pattern, and any combination of acceleration, lateral force, and static load pattern. The distributed plasticity is determined by employing fiber section “P-M2-M3” with a finite-length hinge zone, and the columns are meshed at intermediate joints and intersecting frames to increase the capture of local P-delta effects. Subsequently, nonlinear static pushover analysis was performed to calculate the overstrength and ductility factor of each structure and continued until the maximum interstory drift in the frame met the design limit of 2.5%. These values are calculated based on pushover results, and the idealized lateral force–displacement is shown in Figure 9 and tabulated in Table 4 and Table 5.
Figure 10 depicts the overstrength factor for BRB-encased steel with TDA and concrete infills for all brace configurations, as determined by the idealized bilinear response of base shear versus displacement. The overstrength factor ranges from 1.10 to 1.52 for the BRB-encased steel with TDA and 1.06 to 1.51 for the BRB-encased steel with concrete. The NBCC 2015 specifies an overstrength factor of 1.2, and the ASCE 7-22 [12] prescribes 2.5. These conservative values account for several factors, including member size, structural redundancy, and infill walls [44]. In general, overstrength increases with a greater span length, which shows an average value of 1.42 for BRB-encased steel with TDA infill and 1.35 for BRB-encased steel with concrete infill.
Ductility factors for BRB-encased steel with TDA and concrete infills are determined using the Miranda and Bertero (1994) [35] approach and compared to results using the Newmark and Hall (1982) [36] method, as presented in Figure 11 and Figure 12. It is evident that longer span lengths and higher building heights directly lead to increased ductility. The average ductility factors for BRB-encased steel with TDA infill were increased by about 5% compared to concrete infill. The average ductility factor computed using the Newmark and Hall [36] approach is lower by an average of about 15% than that determined using the Miranda and Bertero method [35]. The effect of bracing configuration can be neglected, with a maximum variation of about 3% for fourteen- and eight-story buildings and 4% for four-story buildings.
The results of response modification factors of BRB-encased steel with TDA and concrete infills and different frame configurations, derived via the Miranda and Bertero (1994) [35] and Newmark and Hall (1982) [36] methods, are presented in Figure 13 and Figure 14. The Miranda and Bereto method [35] gave higher values than Newmark and Hall [36], with an average increase of 17% and 14% for BRB-encased steel with TDA and concrete infills, respectively. This increase is due to implementing additional components, such as soil condition, ductility, and the structure’s natural period. ASCE 7-22 [12] and NBCC 2015 [13] prescribe the response modification values of 8 and 4.8 for BRBFs. The results show the maximum value of the response modification factor is 6.91 for TDA infill and 4.95 for concrete infill based on Miranda and Bertero [35]; however, these results are reduced to 5.80 and 4.48 under the Newmark and Hall method [36]. For BRB encased with TDA and concrete infills, the mean values are 4.97 and 4.21, respectively. Because different bracing configurations range from 5% to 12%, their effects should be considered.

9. Inelastic Response History Analysis

The nonlinear dynamic procedure or nonlinear response history analysis of a building is the nonlinear load deformation of individual components of the structure, incorporated directly via a mathematical model and subjected to ground motion acceleration histories [45]. The nonlinear behavior of the members shall be considered the same as in the pushover analysis. The equation of motion is modified to Equation (8) to recognize the inelastic behavior of the building, where u is the vector to lateral force–displacement, m is a diagonal matrix, c is the damping matrix, f s u is the inelastic force deformation relation, u ¨ g t is the ground acceleration, and ι is the influence vector. In this analysis, the force deformation for each member is hysteretic and nonlinear. The unloading and reloading curves differ from the initial loading curve. In this method, the stiffness matrix changes at each time step and must be formulated based on their element tangent stiffness matrices and deformation and the path dependence [46].
m u ¨ + c u ˙ + f s u = m ι u ¨ g t
P-Δ effects, structural modeling assumptions, and ground motion characteristics are among the most important factors affecting the results. The second-order, or P-Δ, effect refers to the gravity loads acting on the laterally deformed structure. These effects reduce the initial stiffness of the structure slightly when the structure is in the elastic phase. However, when the structure is in the inelastic phase, they cause a rapid increase in lateral force resistance with negative stiffness.

10. Ground Motion Selection

Earthquake ground motions resemble wave signals, and an accelerograph is used to record the ground motions. Ground motions have three major aspects: amplitude, frequency content, and duration [47]. The connections between the response of the structure and ground motion parameters have been explored through different strategies [48,49,50]. The earlier edition of ASCE 7-05/10 recommended three or seven ground motions for nonlinear response history analysis. When three sets of ground motions were used, the maximum values of the peak response of each were used to evaluate structural competence. If seven or more ground motions were used, the mean results were evaluated. These selections are insufficient to reach the required accuracy of the mean or the variability in the response. Therefore, the minimum number of ground motions was increased to eleven in the ASCE 7-16/22 standard. This larger number of ground motions is necessary to derive more reliable results in the mean structural response. In other words, it helps identify an unacceptable structural response in one or more ground motions, which indicates that the structure fails to meet the 10% target collapse reliability. The considered number of ground motion records and the attribution of the selected records are two important aspects when selecting ground motions. To identify the possible dispersion and mean of demand parameters, a large number of ground motion records are required due to the significant scatter of structural response to motions [51,52]. The first step of selection involves the consideration of important factors, including source mechanisms, magnitude, site soil conditions, usable frequency, period of sampling (between 0.001 s and 0.02 s), and the distance from the site to the source. Step two is selecting the final set of ground motions based on spectral shape, scale factor, and maximum motions from a single event.
In this study, the building is assumed to be located in Los Angeles, California, on stiff soil (Type D), with a latitude and longitude of 34.0522 and −118.2436. A single-target response spectrum with 5% damped and maximum considered earthquake (MCER) was developed by multiplying the design response spectrum by 1.5, as presented in Figure 15.
For the nonlinear response history analysis, 21 different ground motion records were selected based on the MCER target response spectrum from the Pacific Earthquake Engineering Research Center database [53], as presented in Table 6.

11. Ground Motion Scaling

Amplitude scaling and spectral matching are two approaches for adjusting time series to be consistent with the design response spectrum. Scaling includes multiplying the initial time series by a scaling factor, then the matched spectrum is made equal to or exceeds the design spectrum over a specified period range. Matching the time series frequency content to make it consistent with the design spectrum is known as spectral matching [48]. Since it is difficult to capture the tolerance over the entire spectrum, the idea is to focus on the period range of interest. The older version of ASCE 7-05/10 defined this range as between 0.2 T and 1.5 T, in which the lower and higher bounds were set to capture higher mode response and period elongation effects. In ASCE 7-16/22, nonlinear response history analysis is performed at MCER, which has a greater inelastic response than the design spectrum. Therefore, the higher bound has been increased to 2.0 T, where T is the maximum fundamental period of the building in both transitional directions as well as the fundamental torsional period. The lower bound period of 0.2 T should capture the periods required for 90% mass participation in both building directions. This additional requirement ensures that the ground motions can capture responses in higher modes for long-period structures. The accelerograms for each structure were scaled according to the maximum considered earthquake (MCER) with a period range of 0.2 T to 2.0 T using the applicable software [54], as shown in Figure 16.

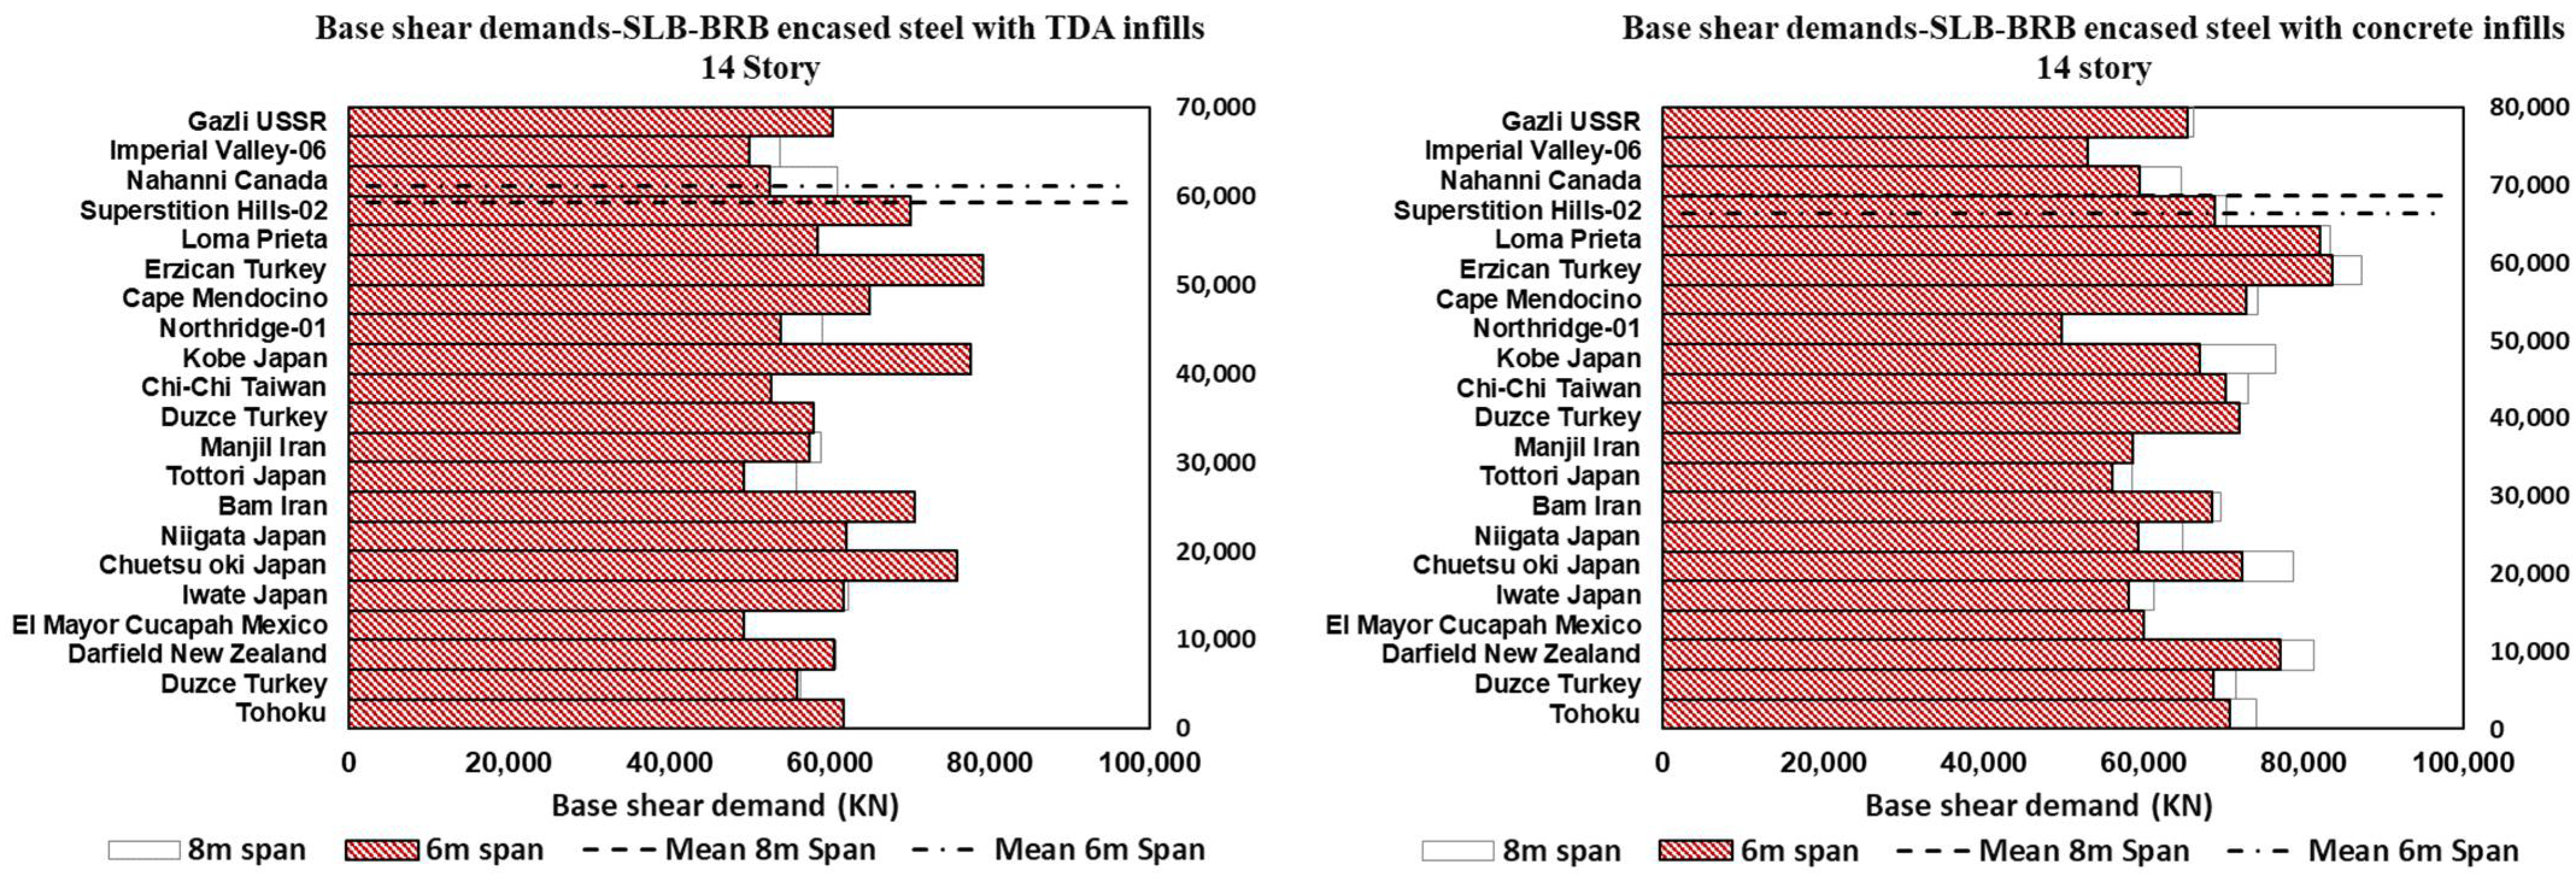
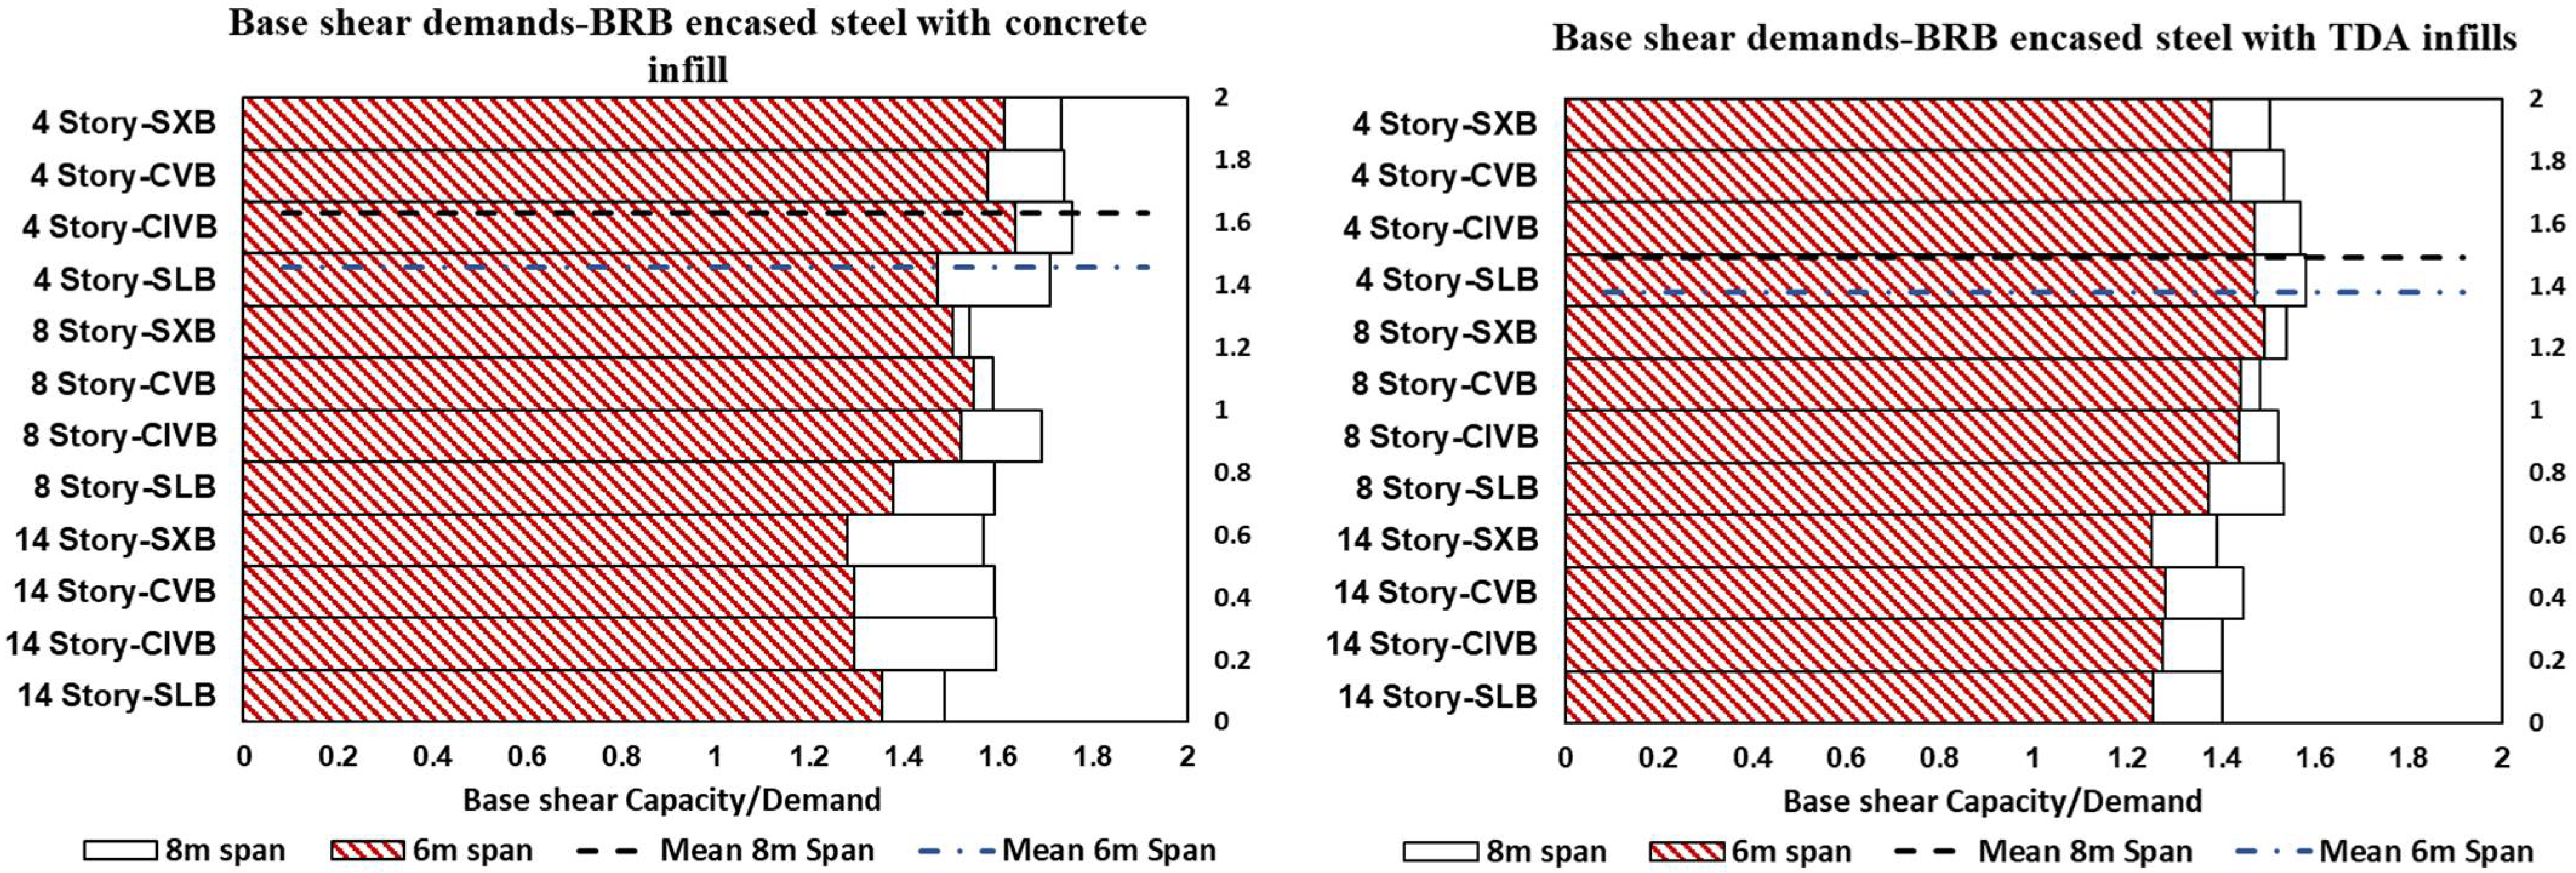
12. Roof, Inter-Story, and Base Shear Demand Results

The allowable drift for structures in ASCE 7 [12] is limited to 2%, which is implied at the design earthquake level. In this study, the allowable drift ratio is considered at the MCER level, which has a ratio of 1.5 to the design earthquake; therefore, the allowable drift becomes 3% (1.5 × 2%). However, in this research, the maximum allowable drift ratio of 2.5% is considered relevant to life safety performance. Based on the maximum mean value of the structural drift profiles, the allowable maximum drift ratio is less than 2% at the design earthquake intensity, and 2.5% at the maximum considered earthquake intensity, which is the deformation index used to judge the “failure” of the concrete frame structures.
Figure 17 presents the standard deviation plus the mean values of twenty-one ground motion records for different bracing configurations of BRB-encased steel with TDA and concrete infills at varying building heights and span lengths. The tenth level of a fourteen-story building with a BRB with encased steel with TDA infill has maximum mean peak values of 2.11% and 2.18%, which relate to the interstory demands for 6 m and 8 m spans of the SLB. However, the maximum mean interstory demand decreases to 2.23% and 2.32% at a similar level for the BRB with encased steel with concrete infill for 6 m and 8 m SLBs. The maximum mean interstory demands for the BRB-encased steel with TDA infill are 2.19% and 2.28% at the fourth level of an eight-story building for SLBs of 6 m and 8 m spans, respectively, while the maximum mean interstory demands for BRB-encased steel with concrete infill of SLB are 2% and 2.07% at the sixth level of an eight-story building. The third level of a four-story building with BRB with encased steel with TDA infill of the SLB has a maximum mean value of 2.12% and 2.34% for 6 m and 8 m span lengths, respectively, and the same level has maximum mean values of 1.94% and 2.17% for the BRB-encased steel with concrete infill for the same spans of SLB. The maximum mean values of the drift demand were observed at the third, fourth, and tenth levels for BRB-encased steel with TDA and concrete infills. In general, the drift demand has a higher value in relation to the BRB with encased steel with TDA compared to the BRB with encased steel with concrete.
The maximum base shear demands were calculated based on the nonlinear response history analysis results. In the interest of brevity, the results are only presented here for the base shear demand of BRB-encased steel with TDA and concrete with an SLB configuration, as shown in Figure 18, Figure 19 and Figure 20. It can be observed that the smaller span lengths have lower base shear demands compared with longer span lengths, and the base shear demand increases with the increase in building height and varies with different bracing configurations.
The mean base shear demands for BRB-encased steel with TDA and concrete infills with different span lengths, bracing configurations, and heights are presented in Figure 21. Overall, the base shear demands are reduced for the BRB-encased steel with TDA infill compared to the concrete infill and are higher in configurations with greater span lengths.
In addition, the base shear capacity over demand ratio is presented in Figure 22. This ratio is higher for 8 m-span configurations than for 6 m spans. The mean base shear demand values for BRB-encased with TDA infill are 1.49 and 1.38 for 8 m and 6 m spans, respectively, while these values increase to 1.63, and 1.45 for 8 m and 6 m spans of BRB encased in a concrete infill, respectively. Buildings equipped with BRB encased with TDA showed base shear demands that were reduced by an average of 7% compared to concrete infill.

13. Results and Discussions

It is critical to developing a system focused on sustainability in order to allow us to transition from simple curbside recycling to a broader perspective of employing different types of waste. Because aggregates account for a considerable amount of concrete mixtures, using waste aggregate materials such as tire-derived aggregates has a considerable influence on resource conservation. This study focuses on the effects of using tire-derived aggregate on a BRBF.
Furthermore, when the seismic design factors of a system are missing from the code, engineers/researchers work with the closest equivalent system with conservative values. This paper’s methodology is useful in evaluating and comparing these factors to the recommended factors set in the codes.

14. Conclusions

It is crucial to find different applications for utilizing scrap tires, which cause considerable environmental damage on a large scale [24]. This research introduced another application to reuse TDA in buckling restrained braces, which contributes to sustainability. They can be used in the retrofitting of new as well as existing structures, where the primary concern is the damping of the system. The seismic design factors for novel buckling restrained braces employing tire-derived lightweight aggregate concrete as a filling material were explored in this study. Four, eight, and fourteen-story special concrete moment frames were designed based on the ASCE 7-22 [12] and ACI 318 [37]. The effects of different bracing configurations, including Chevron (Inverted V and V), Split X, and Single-Leg BRBs with different span lengths of 6 m and 8 m, were discussed. The overstrength, ductility, and response modification factors of forty-eight frames were evaluated and discussed. Furthermore, nonlinear response history analysis was used to evaluate the performances of these buildings, utilizing twenty-one distinct ground motion recordings. The interpretation of inter-story and roof drifts, as well as their capacity over demand ratios, have been presented.
The following conclusions should be highlighted:
  • The average fundamental periods of BRB-encased steel with concrete with different span lengths and bracing configurations are 0.47(s), 0.86(s), and 1.32(s) for four-, eight-, and fourteen-story SCMFs. These values are increased to 0.55(s), 1.01(s), and 1.47(s) for four-, eight-, and fourteen-story SCMFs of BRB-encased steel with TDA. In general, the fundamental period of the structures, when calculated by an empirical equation, is more conservative than the result when using eigenvalue analysis of the structures for BRB-encased steel with concrete infill. It underestimates the period of the structure in higher buildings equipped with BRB encased steel with TDA. The fundamental period of BRB-encased steel with TDA infill is about 15% higher than BRB-encased steel with concrete infill. Furthermore, while computing the natural period of the structures, the effect of bracing configuration can be ignored;
  • The overstrength factor ranges from 1.10 to 1.52 and 1.06 to 1.51 for the BRB-encased steel with TDA and concrete infills. The prescribed overstrength factors in ASCE 7-22 and NBCC 2015 [13] are 2.5 and 1.2. ASCE 7-22 [12] gives a conservative value that accounts for several factors, including member size, effects of structural redundancy, and infill walls [44]. Moreover, span length directly affects the overstrength factor, and longer span lengths result in a greater overstrength factor;
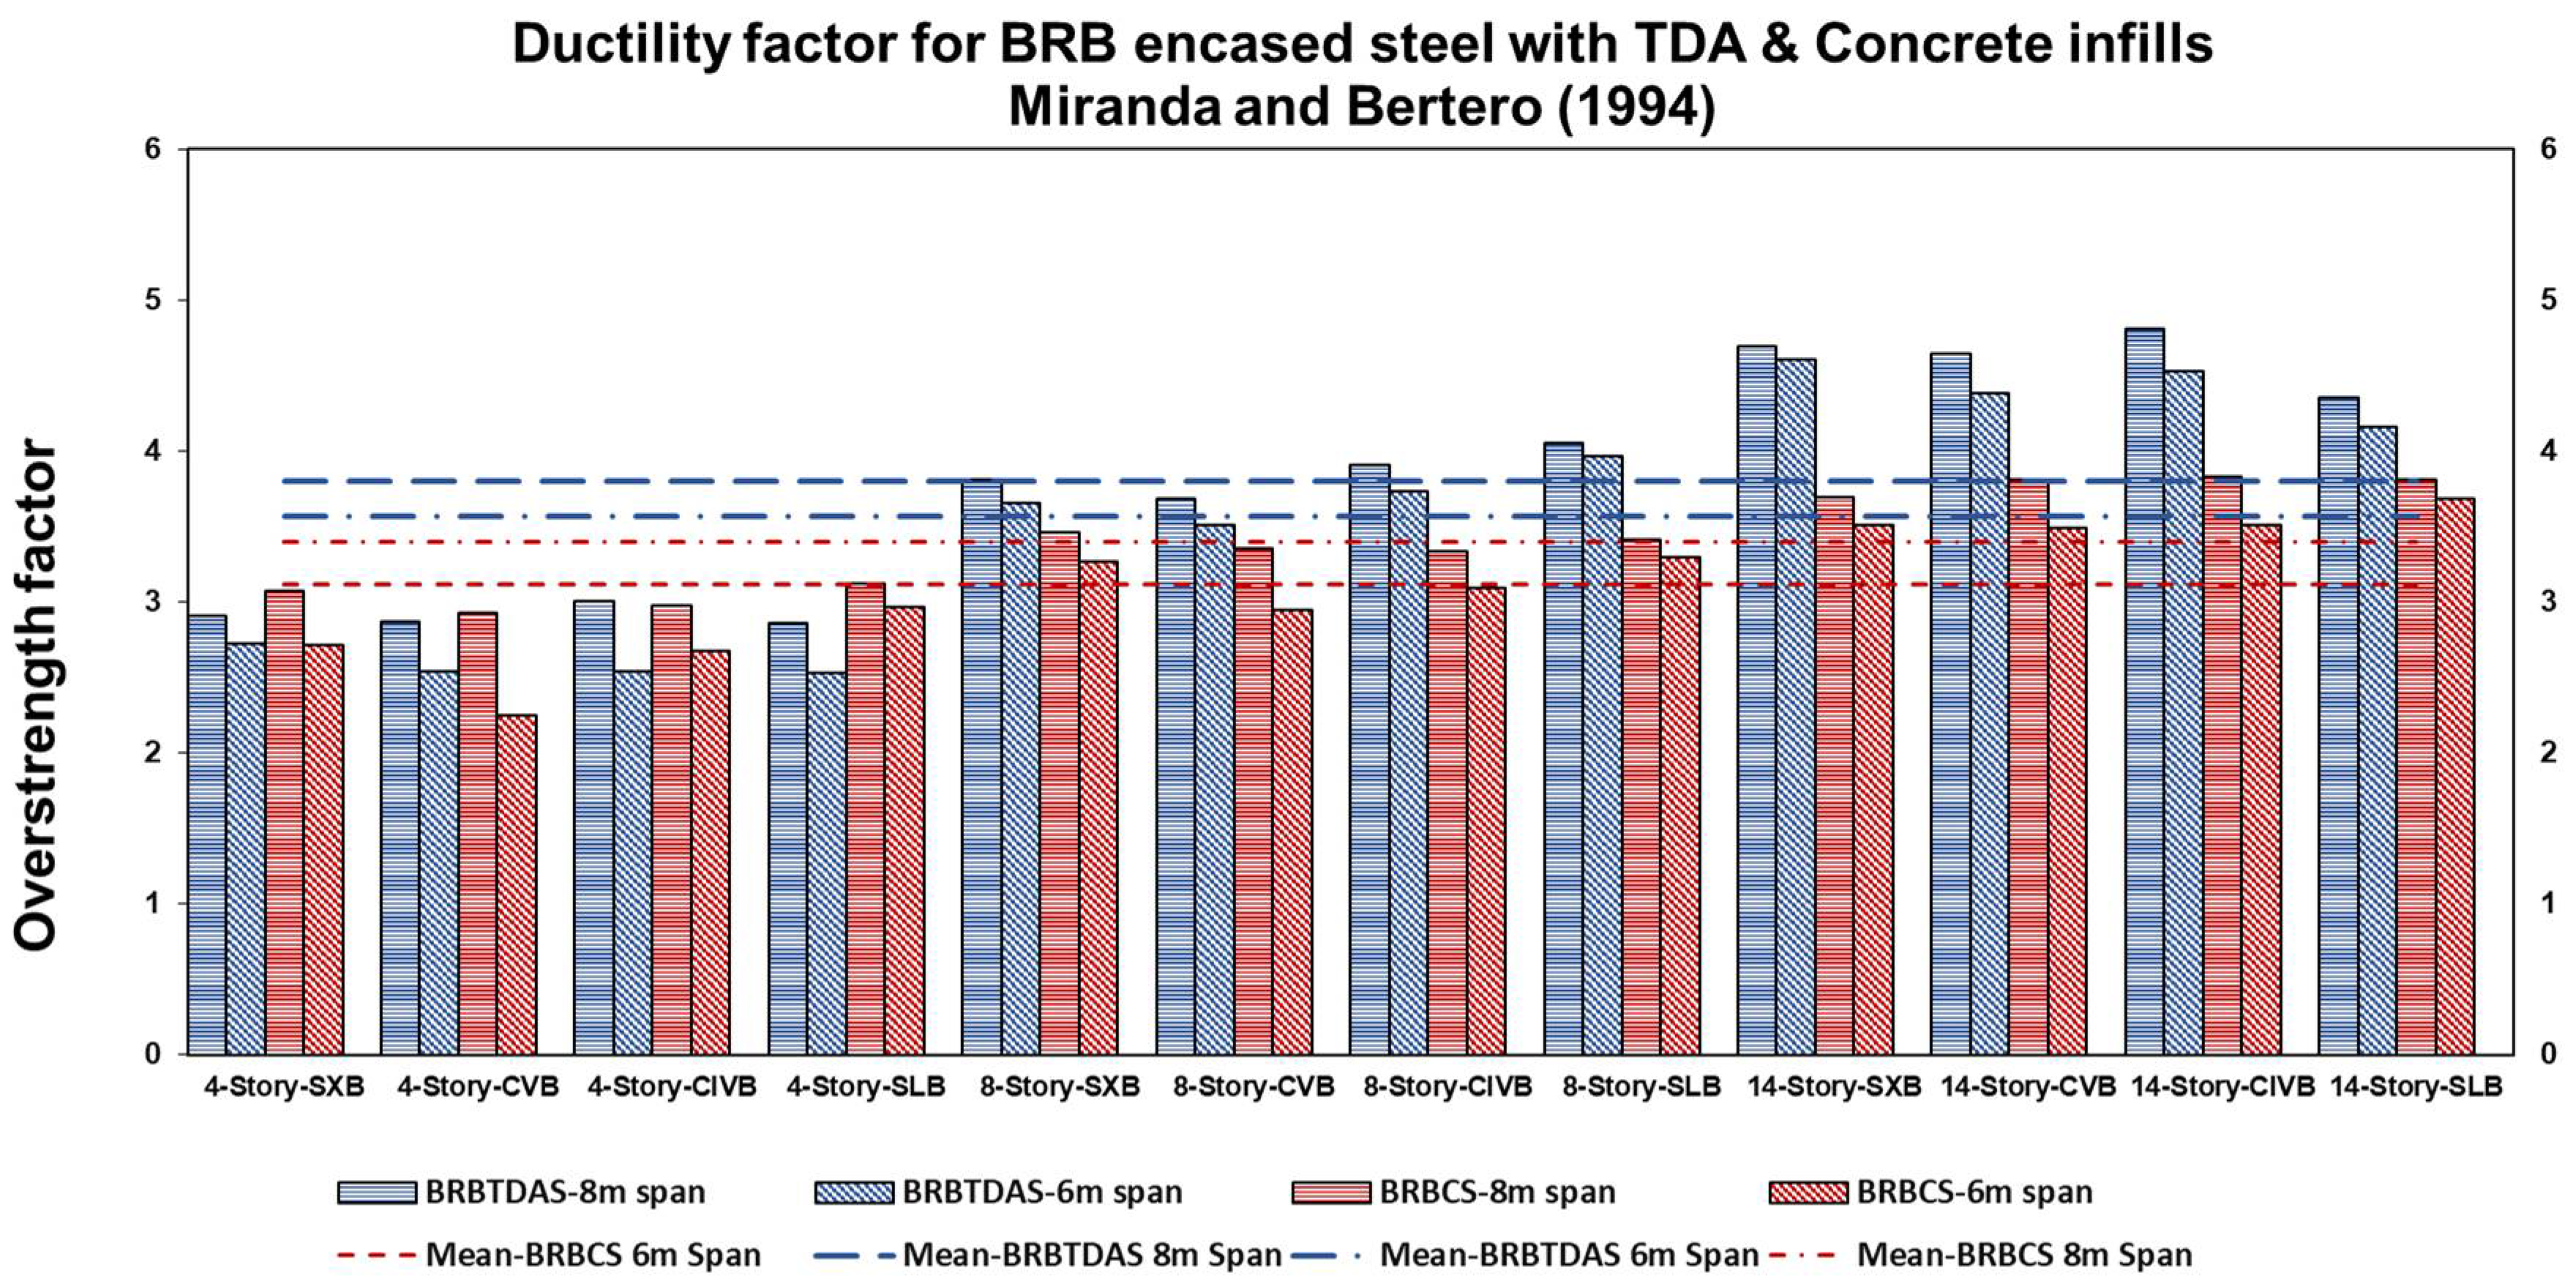
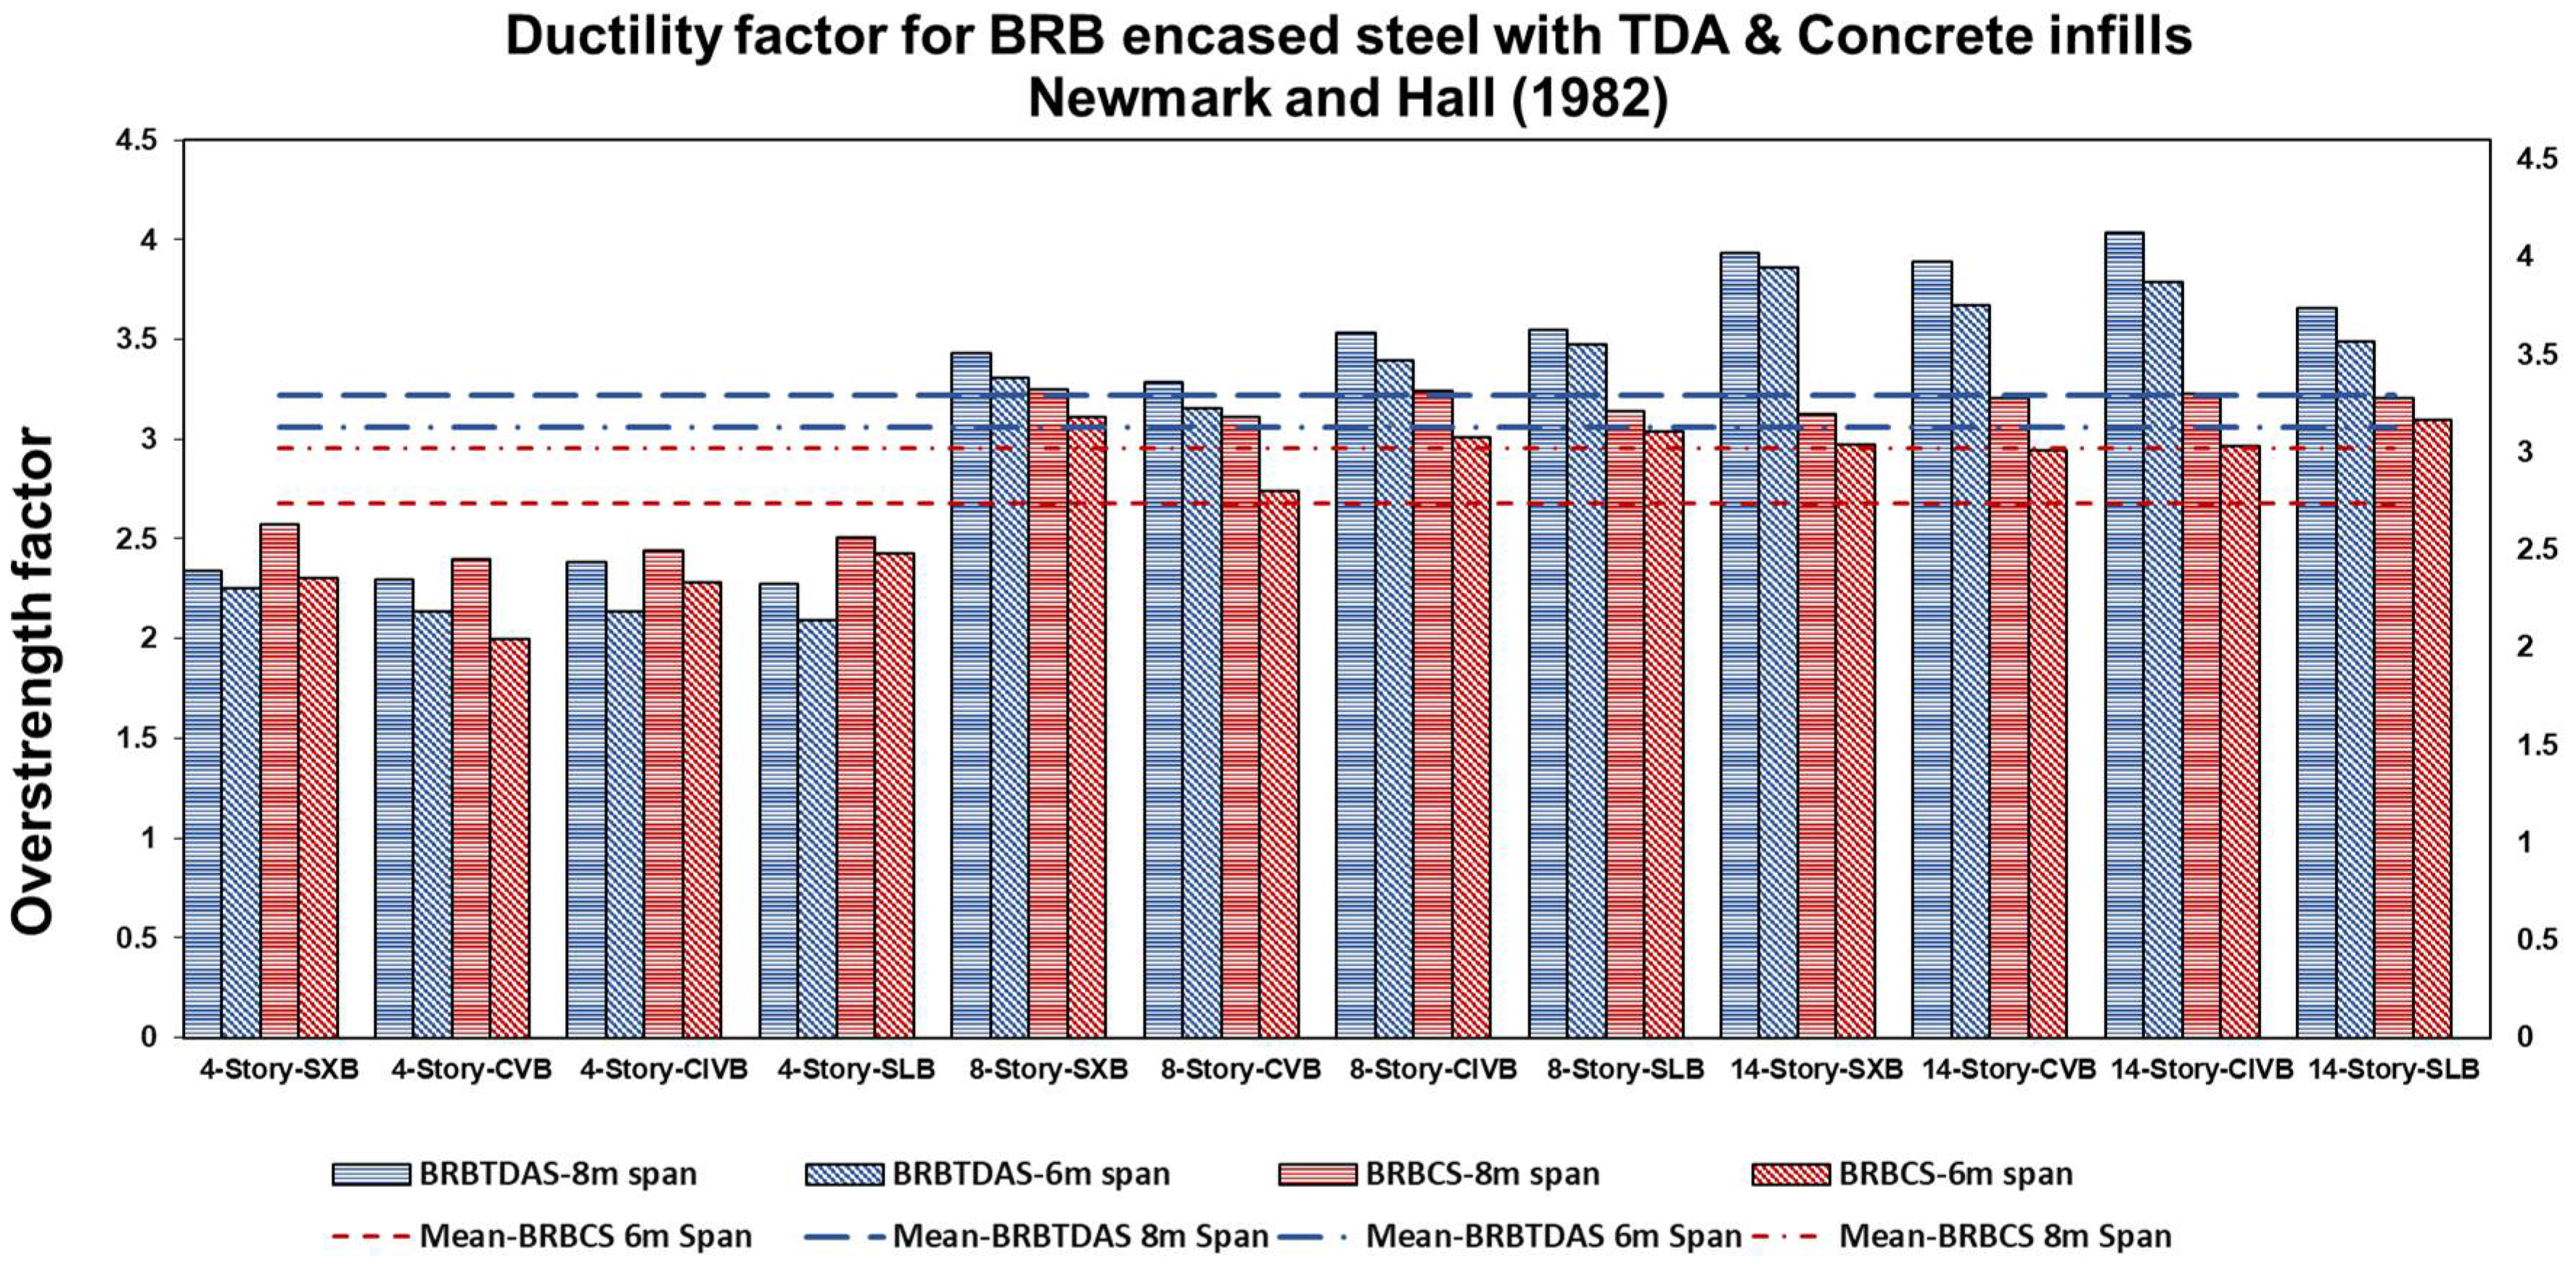
  • The ductility factors have been calculated and compared using the Miranda and Bertero (1994) [35] and Newmark and Hall (1982) [36] methods. We found that a longer span length and a higher building height increase the ductility factor. The BRB-encased steel with TDA infill increased the average ductility factors by 5% compared to the BRB-encased steel with concrete infill. The average ductility factor calculated using the Newmark and Hall (1982) [36] method is approximately 15% lower than that derived using the Miranda and Bertero (1994) [35] method. Additionally, because the variance in bracing configuration impact is less than 4%, their effect can be ignored;
  • The calculated mean value of RMF based on the Miranda and Bertero (1994) [35] method for BRB encased with TDA infill is 4.97, and it is 4.21 for concrete infill, while the computed mean value of RMF based on the Newmark and Hall (1982) [36] approach is 4.25, and it is 3.68 for BRB encased with TDA and concrete infills. The Miranda and Bertero (1994) [35] method achieves a better result than the Newmark and Hall (1982) [36] method because it considers more parameters, such as soil condition, ductility, and the natural period of the structure. The response modification factor increases as the building height and span length increase. The response modification factor for BRB encased with TDA and concrete infills was in the range of 3.13 to 3.61, with a mean value minus standard deviation of about 4 in both cases. Accordingly, ASCE 7-22 [12] and NBCC 2015 [13] specify response modification values of 8 and 4.8 for BRBFs, which are conservative. As a result, for structures with a height equal to or less than 50 m, a response modification factor of 4 is recommended, which covers about 95% of the cases. It is evident that different bracing configurations range from 5% to 12%, hence their effect should be addressed;
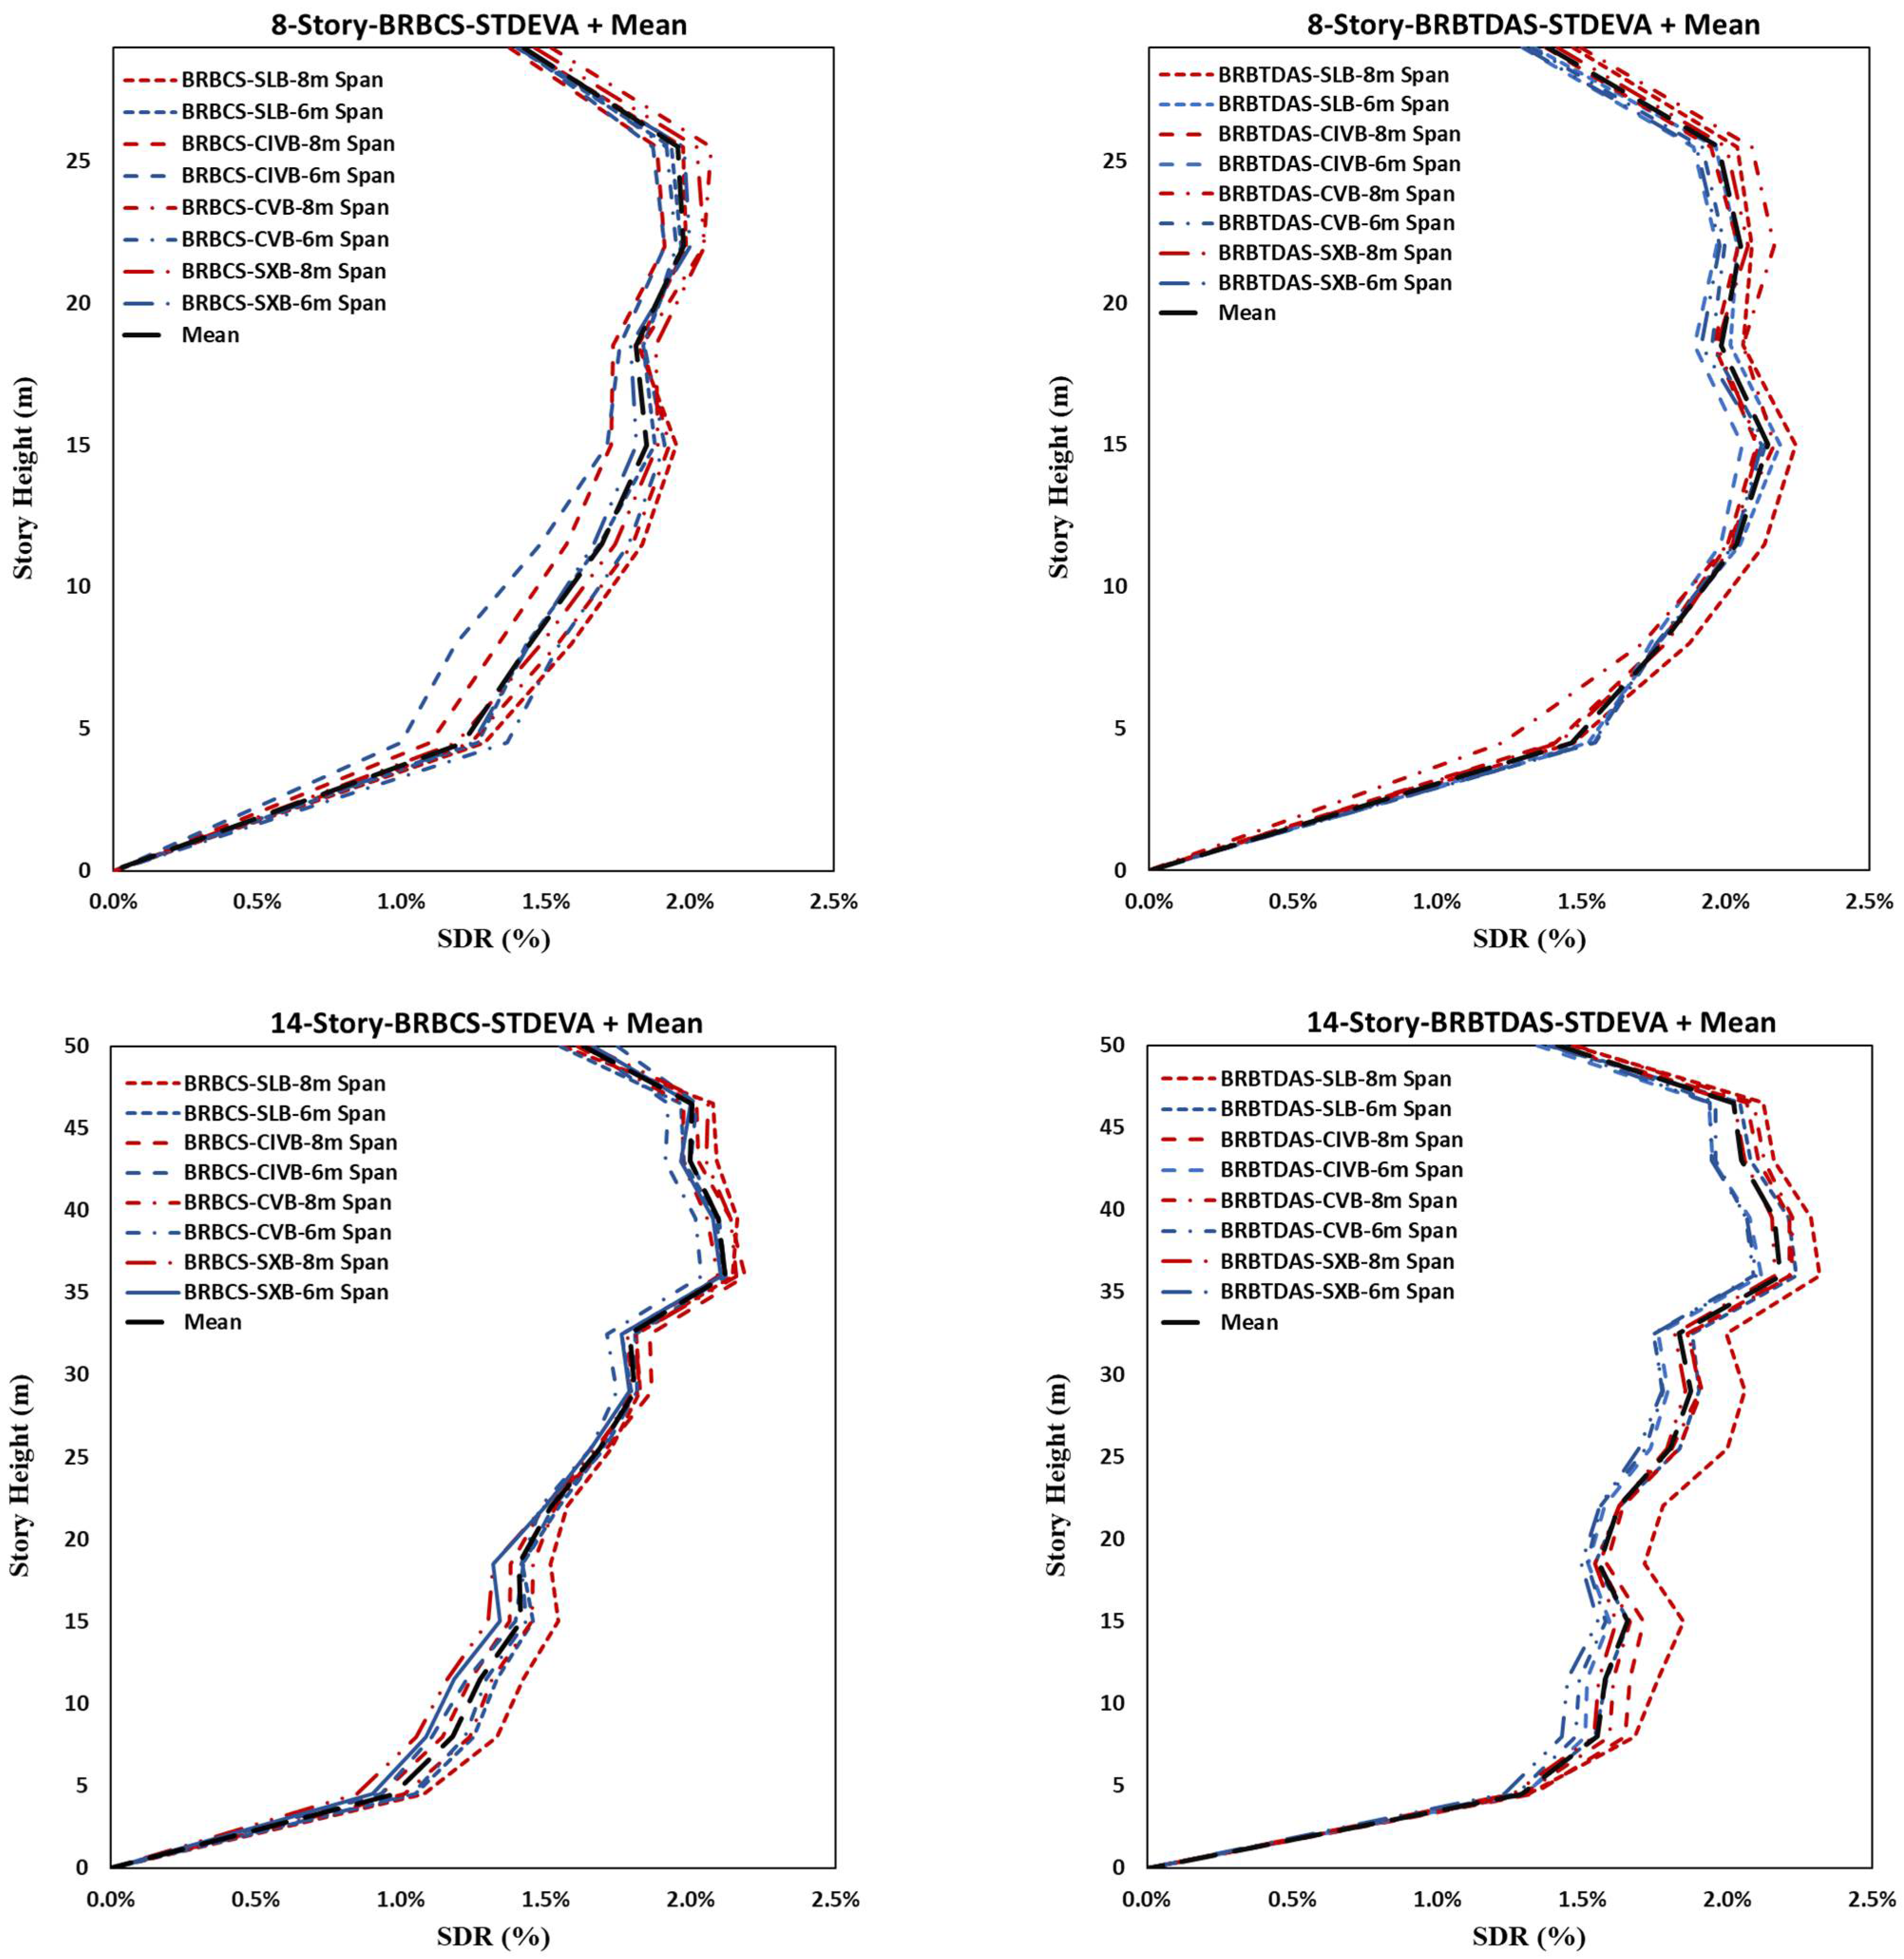
  • The maximum drift demand of nonlinear response history analysis increases with height. For four-story BRBFs, the maximum mean value of interstory demand was found at the third level, while it shifted to the fourth and tenth levels for eight- and fourteen-story structures. We found that with greater heights of the structure, the maximum interstory drifts move to higher levels, and longer span lengths increase the story drift ratios. The interstory demands are higher for BRB-encased steel with TDA infill than BRB-encased steel with concrete infill;
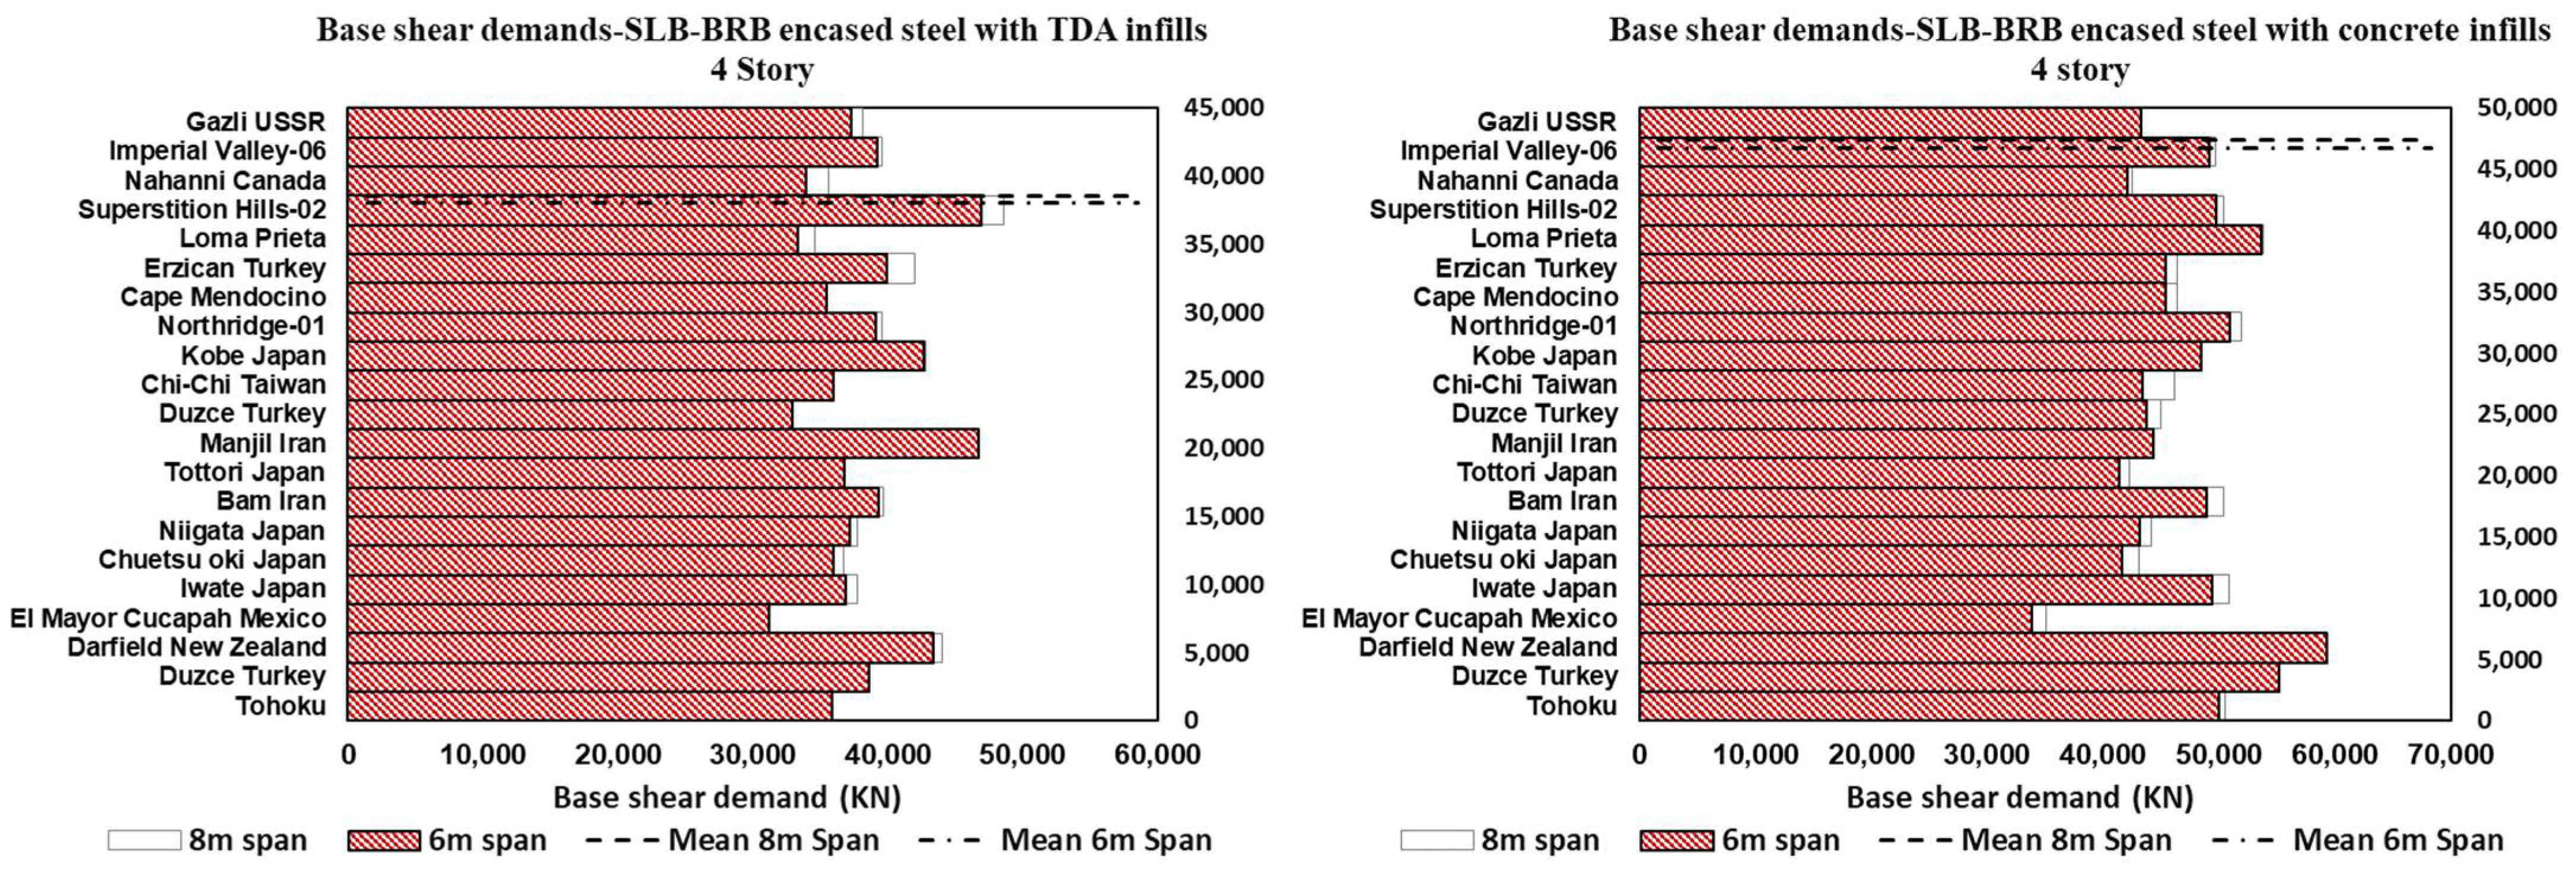
  • Base shear demands increase with greater span lengths and heights and vary with different framing configurations. Furthermore, compared to concrete infill, the base shear demands for BRB-encased steel with TDA infill are reduced in shorter span lengths, and are greater in longer span lengths.
This study is limited to the seismic design factors and overall performance of the system; further numerical and experimental studies are required to evaluate the effects of BRBFs with TDA filling in CMRF using different mechanical properties of tire-derived lightweight aggregate concrete (TDLWAC) to evaluate their seismic parameters, dissipation capacity, and performance under actual excitation conditions.

Author Contributions

Conceptualization, O.F., A.N. and F.M.T.; methodology, O.F., A.N. and F.M.T.; software, A.N.; validation, O.F. and F.M.T.; formal analysis, A.N.; investigation, O.F., A.N. and F.M.T.; resources, F.M.T.; data curation, A.N.; writing—original draft preparation, A.N.; writing—review and editing, O.F., and F.M.T.; visualization, O.F., A.N. and F.M.T.; supervision, O.F. and F.M.T.; project administration, O.F. and F.M.T. All authors have read and agreed to the published version of the manuscript.

Funding

This research received no external funding.

Institutional Review Board Statement

Not applicable.

Informed Consent Statement

Not applicable.

Data Availability Statement

Not applicable.

Conflicts of Interest

The authors declare no conflict of interest.

References

  1. Ko, E.; Field, C. The Unbonded Brace™: From Research to Californian Practice 2003, SEAOC convention. In Proceedings of the 13th World Conference on Earthquake Engineering, Vancouver, BC, Canada, 1–6 August 2004. NO.1321. [Google Scholar]
  2. Tehrani, F.M.; Nazari, M.; Naghshineh, A. Role of Seismic Isolation and Protection Devices in Enhancing Structural Resilience, EMI ORC MOP Part III Chapter 21. In Objective Resilience: Technology; American Society of Civil Engineers: Reston, VA, USA, 2022. [Google Scholar]
  3. Soong, T.T.; Dargush, G.F. Passive Energy Dissipation and Active Control 1999. In Boca Raton: Structural Engineering Handbook; CRC Press LLC: Boca Raton, FL, USA; pp. 1–28.
  4. Symans, M.D.; Constantinou, M.C. Semi-active control systems for seismic protection of structures: A state-of-the-art review. Eng. Struct. 1997, 21, 469–487. [Google Scholar] [CrossRef]
  5. UNESCO. Sustainable Development. 2022, UNESCO. Available online: https://en.unesco.org/themes/education-sustainable-development/what-is-esd/sd (accessed on 3 December 2022).
  6. ACI (American Concrete Institute). Report on the Role of Materials in Sustainable Concrete Construction; Reported by ACI Committee 130; ACI: Michigan, MI, USA, 2019. [Google Scholar]
  7. Tehrani, F.M.; Miller, N.M. Tire-Derived Aggregate Cementitious Materials: A Review of Mechanical Properties. In Cement-Based Materials; Saleh, H.E.-D.M., Rahman, R.O.A., Eds.; IntechOpen: London, UK, 2018. [Google Scholar] [CrossRef]
  8. ASTM D6270 (American Society for Testing and Materials). Standard Practice for Use of Scrap Tires in Civil Engineering Applications. 2008. Available online: https://www.astm.org/d6270-08.html (accessed on 3 December 2022).
  9. Miller, N.M.; Tehrani, F.M. Mechanical properties of rubberized lightweight aggregate concrete. Constr. Build. Mater. 2017, 147, 264–271. [Google Scholar] [CrossRef]
  10. ASTM C469 (American Society for Testing and Materials). Standard Test Method for Static Modulus of Elasticity and Poisson’s Ratio of Concrete in Compression. 2021. Available online: https://www.astm.org/c0469_c0469m-14e01.html (accessed on 3 December 2022).
  11. Asgarian, B.; Shokrgozar, H.R. BRBF response modification factor 2009. J. Constr. Steel Res. 2009, 65, 290–298. [Google Scholar] [CrossRef]
  12. ASCE (American Society of Civil Engineers). Minimum Design Loads and Associated Criteria for Buildings and Other Structures. 2022. Available online: https://ascelibrary.org/doi/abs/10.1061/9780784414248 (accessed on 3 December 2022).
  13. NBCC (National Research Council of Canada). National Building Code of Canada; NBCC: Ottawa, ON, Canada, 2015. [Google Scholar]
  14. Moni, M.; Moradi, S.; Alam, M.S. Response modification factors for steel buckling restrained braced frames designed as per the 2010 National Building Code of Canada. Can. J. Civ. Eng. 2016, 43, 702–715. [Google Scholar] [CrossRef]
  15. Mahmoudi, M.; Zaree, M. Determination the Response Modification Factors of Buckling Restrained Braced Frames. Procedia Eng. 2013, 54, 222–231. [Google Scholar] [CrossRef] [Green Version]
  16. Hosseinzadeh, S.H.; Mohebi, B. Seismic evaluation of all-steel buckling restrained braces using finite element analysis. J. Constr. Steel Res. 2016, 119, 76–84. [Google Scholar] [CrossRef]
  17. Bai, J.; Ou, J. Earthquake-resistant design of buckling-restrained braced RC moment frames using performance-based plastic design method. Eng. Struct. 2016, 107, 66–79. [Google Scholar] [CrossRef]
  18. Della Corte, G.; D’Aniello, M.; Landolfo, R. Field Testing of All-Steel Buckling-Restrained Braces Ap-plied to a Damaged Reinforced Concrete Building. J. Struct. Eng. 2015, 141, D4014004. [Google Scholar] [CrossRef]
  19. Nguyen, A.H.; Chintanapakdee, C.; Hayashikawa, T. Assessment of current nonlinear static procedures for seismic evaluation of BRBF buildings. J. Constr. Steel Res. 2010, 66, 1118–1127. [Google Scholar] [CrossRef]
  20. Balling, R.J.; Balling, L.J.; Richards, P.W. Design of Buckling-Restrained Braced Frames Using Nonlinear Time History Analysis and Optimization. J. Struct. Eng. 2009, 135, 461–468. [Google Scholar] [CrossRef]
  21. Kumar, R.G.; Kumar, S.R.; Kalyanaraman, V. Behaviour of frames with non-Buckling bracings under earthquake loading. J. Constr. Steel Res. 2005, 63, 254–262. [Google Scholar] [CrossRef]
  22. Kim, T.W.; Foutch, D.A.; LaFave, J.M.; Wilcoski, J. Performance Assessment of Reinforced Concrete Structural Walls for Seismic Loads; University of Illinois Engineering Experiment Station 2004, College of Engineering; University of Illinois at Urbana-Champaign: Urbana, IL, USA, 2004. [Google Scholar]
  23. Sabelli, R.; Mahin, S.; Chang, C. Seismic demands on steel braced frame buildings with buckling restrained braces. Eng. Struct. 2003, 25, 655–666. [Google Scholar] [CrossRef]
  24. Tehrani, F.M.; Masswadi, N.A.; Miller, N.M.; Sadrinezhad, A. An Experimental Investigation of Dynamic Properties of Fiber-Reinforced Tire-Derived Lightweight-Aggregate Concrete. Eur. J. Eng. Technol. Res. 2020, 5, 702–707. [Google Scholar] [CrossRef]
  25. RILEM. GLOBE—Global Consensus on Sustainability in the Built Environment. 2022. Available online: https://www.rilem.net/globe (accessed on 3 December 2022).
  26. FEMA 356; Prestandard and Commentary for the Seismic Rehabilitation of Buildings. Federal Emergency Management Agency: Washington, DC, USA, 2000.
  27. FEMA-440; Improvement of Nonlinear Static Seismic Analysis Procedures. Federal Emergency Management Agency: Washington, DC, USA, 2005.
  28. Alam, M.S.; Moni, M.; Tesfamariam, S. Seismic overstrength and ductility of concrete buildings reinforced with superelastic shape memory alloy rebar. Eng. Struct. 2012, 34, 8–20. [Google Scholar] [CrossRef]
  29. Kersting, R.A.; Fahnestock, L.A.; Lopez, W.A. Seismic Design of Steel Buckling-Restrained Braced Frames: A Guide for Practicing Engineers; National Institute of Standards and Technology: Gaithersburg, MD, USA, 2015; NIST GCR 15-917-34.
  30. AISC (American Institute of Steel Construction). Seismic Provisions for Structural Steel Buildings; American Institute of Steel Construction: Chicago, IL, USA, 2016. [Google Scholar]
  31. ATC (Applied Technology Council). Tentative Provisions for the Development of Seismic Regulations for Buildings; National Bureau of Standards: Gaithersburg, MD, USA, 1982. [Google Scholar]
  32. ATC (Applied Technology Council). Structural Response Modification Factors; ATC: Redwood City, CA, USA, 1995. [Google Scholar]
  33. Paulay, T.; Priestley MJ, N. Seismic Design of Reinforced Concrete and Masonry Buildings; John Wiley and Sons, Inc.: Hoboken, NJ, USA, 1992. [Google Scholar]
  34. Krawinkler, H.; Seneviratna, G.D.P.K. Pros and cons of a pushover analysis of seismic performance evaluation. Eng. Struct. 1998, 20, 452–464. [Google Scholar] [CrossRef]
  35. Miranda, E.; Bertero, V.V. Evaluation of Strength Reduction Factors for Earthquake Resistant Design. Earthq. Spectra 1994, 10, 357–379. [Google Scholar] [CrossRef]
  36. Newmark, N.M.; Hall, W.J. Earthquake Spectra and Design; EERI Monograph, Earthquake Engineering Research Institute: Berkeley, CA, USA, 1982. [Google Scholar]
  37. ACI (American Concrete Institute). Building Code Requirements for Structural Concrete and Commentary; ACI Committee 318; ACI: Michigan, MI, USA, 2019. [Google Scholar]
  38. Lawson, R.S.; Vance, V.; Krawinkler, H. Nonlinear static pushover analysis—why, when and how? In Proceedings of the Fifth US National Conference on Earthquake Engineering, Chicago, IL, USA, 10–14 July 1994; Volume 1, pp. 283–292. [Google Scholar]
  39. Fajfar, P.; Fischinger, M. N2 a method for non-linear seismic analysis of regular structures. In Proceedings of the Ninth World Conference in Earthquake Engineering, Tokyo-Kyoto, Japan, 2–9 August 1988; Volume 5, pp. 111–116. [Google Scholar]
  40. Sajidi, M.; Sozen, M.A. Simple nonlinear seismic analysis of R/C structures. J. Struct. Div. ASCE 1981, 107, 937–951. [Google Scholar]
  41. Miranda, E. Evaluation of Seismic Performance of a Ten Story RC Building during the Whittier Narrows Earthquake. Ph.D. Dissertation, Department of Civil Engineering, University of California, Berkeley, CA, USA, 1991. [Google Scholar]
  42. SEAOC (Structural Engineers Association of California). Vision 2000, A Framework for Performance-Based Engineering; Structural Engineering Association of California: Sacramento, CA, USA, 1995. [Google Scholar]
  43. Mwafy, A.M. Seismic Performance of Code-Designed RC Buildings. Ph.D. Thesis, Department of Civil and Environmental Engineering, Imperial College of Science, Technology and Medicine, London, UK, 2001. [Google Scholar]
  44. Elnashai, A.S.; Di Sarno, L. Fundamentals of Earthquake Engineering: From Source to Fragility; John Wiley & Sons: Hoboken, NJ, USA, 2015. [Google Scholar]
  45. ASCE (American Society of Civil Engineers). Seismic Evaluation and Retrofit of Existing Buildings; American Society of Civil Engineers: Reston, VA, USA, 2017. [Google Scholar]
  46. Chopra, A.K. Dynamics of Structures: Theory and Applications to Earthquake Engineering, 4th ed.; Prentice Hall: Upper Saddle River, NJ, USA, 2012. [Google Scholar]
  47. Kramer, S.L. Geotechnical earthquake engineering. In Prentice-Hall International Series in Civil Engineering and Engineering Mechanics; Prentice Hall: Upper Saddle River, NJ, USA, 1996. [Google Scholar]
  48. Gavin, H.P.; Dickinson, B.W. Generation of Uniform-Hazard Earthquake Ground Motions. J. Struct. Eng. 2011, 137, 423–432. [Google Scholar] [CrossRef] [Green Version]
  49. Cordova, P.P.; Deierlein, G.G.; Mehanny, S.S.F.; Cornell, C.A. Development of a two-parameter seismic intensity measure and probabilistic assessment procedure. In Proceedings of the 2nd U.S.-Japan Workshop on Performance-Based Seismic Design Methodology for Reinforced Concrete Building Structures, Sapporo, Japan, 11–13 September 2000; Pacific Earthquake Engineering Research Center, University of California: Berkeley, CA, USA, 2000; pp. 187–206. [Google Scholar]
  50. Baker, J.W. Correlation of ground motion intensity parameters used for predicting structural and geotechnical response. In Tenth International Conference on Application of Statistics and Probability in Civil Engineering; Taylor & Francis Group: London, UK, 2007; ISBN 978-0-415-45134-5. [Google Scholar]
  51. Stewart, J.P.; Douglas, J.; Javanbarg, M.; Bozorgnia, Y.; Abrahamson, N.A.; Boore, D.M.; Campbell, K.W.; Delavaud, E.; Erdik, M.; Stafford, P.J. Selection of ground motion prediction equations for the global earthquake model. Earthq. Spectra 2015, 31, 19–45. [Google Scholar] [CrossRef] [Green Version]
  52. TBI (Tall Buildings Initiative). Guidelines for Performance-Based Seismic Design of Tall Buildings; Pacific Earthquake Engineering Research Center, College of Engineering, University of California: Berkeley, CA, USA, 2017. [Google Scholar]
  53. PEER Ground Motion Database, PEER Center. Available online: https://ngawest2.berkeley.edu (accessed on 3 December 2022).
  54. SeismoSoft, Earthquake Software for Response Spectrum Matching; SeismoSoft: Pavia, Italy, 2018.
Figure 1. Passive control system [4].
Sustainability 14 16344 g001
Figure 2. Integration of sustainable construction in structural analysis [25,26,27].
Sustainability 14 16344 g002
Figure 3. Lateral load–roof displacement relationship on the left and typical BRB on the right [29].
Sustainability 14 16344 g003
Figure 4. Bilinear approximation [32].
Sustainability 14 16344 g004
Figure 5. Displacement versus base shear [28].
Sustainability 14 16344 g005
Figure 6. Inelastic force deformation [12].
Sustainability 14 16344 g006
Figure 7. (a) elevation view, (b) Structural models with Single-Leg Braces (SLB), Chevron Inverted V Braces (CIVB), Chevron V Braces (CVB) and Split X braces (SXB), (c) the column layout plan and (d) 3-D view of the building.
Sustainability 14 16344 g007
Figure 8. Force–displacement characteristics of MDOF structure and equivalent SDOF system [29].
Sustainability 14 16344 g008
Figure 9. Roof drift ratio versus normalized base shear ratio for BRB-encased steel with TDA and concrete infills (4-, 8-, 14-story).
Sustainability 14 16344 g009
Figure 10. Overstrength factor for BRB-encased steel with TDA and concrete infills.
Sustainability 14 16344 g010
Figure 11. Ductility factor for BRB encased steel with TDA and concrete infills based on the Miranda and Bertero method.
Sustainability 14 16344 g011
Figure 12. Ductility factor for BRB-encased steel with TDA and concrete infills based on the Newmark and Hall method.
Sustainability 14 16344 g012
Figure 13. Response modification factor for BRB-encased steel with TDA and concrete infills based on the Miranda and Bertero method.
Sustainability 14 16344 g013
Figure 14. Response modification factor for BRB-encased steel with TDA and concrete infills based on the Newmark and Hall method.
Sustainability 14 16344 g014
Figure 15. Design and MCER response spectrum.
Sustainability 14 16344 g015
Figure 16. Matched accelerograms based on the target response spectrum (4-, 8-, 14-story).
Sustainability 14 16344 g016
Figure 17. The standard deviation and mean values of the inter-story drift ratio for 4-, 8-, and 14-story buildings with BRB-encased steel with TDA and concrete infills for span lengths of 6 m and 8 m.
Sustainability 14 16344 g017aSustainability 14 16344 g017b
Figure 18. Base shear demand for four-story building with BRB-encased steel with TDA and concrete filling for SLB, CIVB, CVB, and SXB braces and different span lengths.
Sustainability 14 16344 g018
Figure 19. Base shear demand for eight-story building with BRB-encased steel with TDA and concrete filling for SLB, CIVB, CVB, and SXB braces and different span lengths.
Sustainability 14 16344 g019
Figure 20. Base shear demand for 14-story building with BRB-encased steel with TDA and concrete filling for SLB and different span lengths.
Sustainability 14 16344 g020
Figure 21. Mean base shear demand (BSD) for BRB-encased steel with TDA and concrete fillings and different span lengths.
Sustainability 14 16344 g021
Figure 22. Base shear capacity over demand for 4-, 8- and 14-story buildings with BRB-encased steel with TDA and concrete filling for SLB, CIVB, CVB, and SXB braces.
Sustainability 14 16344 g022
Table 1. Ductility reduction factor [36].
Period of Structure Ta (Sec)Ductility Reduction Factor Rµ
Ta < 0.1 R μ = 1.0
0.12 < Ta < 0.5 R μ = 2 μ 1
Ta > 1 R μ = μ
Table 2. The fundamental period of BRB-encased steel with concrete infill.
Span Length68Ta
Bracing SLBCIVBCVBSXBSLBCIVBCVBSXB(S)
Story
40.480.460.480.460.490.460.490.470.55
80.910.790.890.840.920.800.900.870.92
141.361.301.321.291.371.311.331.301.37
Note: Single-Leg Braces (SLB), Chevron Inverted V Braces (CIVB), Chevron V Braces (CVB), and Split X braces (SXB).
Table 3. The fundamental period of BRB-encased steel with TDA infill.
Span Length68Ta
Bracing SLBCIVBCVBSXBSLBCIVBCVBSXB(S)
Story
40.590.540.540.520.590.550.560.560.55
81.080.981.020.991.080.981.020.990.92
141.541.461.461.431.551.471.471.441.37
Note: Single Leg Braces (SLB), Chevron Inverted V Braces (CIVB), Chevron V Braces (CVB), and Split X braces (SXB).
Table 4. Pushover analysis results—BRB-encased steel with concrete infill.
StoryBracingSpan LengthYield Strength Vy (kN)Design Strength
Vd (kN)
Overstrength
Factor Ro
Maximum Displacement
Δmax (mm)
Yield Displacement
Δy (mm)
Ductility
µ
4SLB6711359181.2072213.44
8827861491.3480223.63
CIVB6831459111.4165213.09
8913061391.486203.48
CVB6831559141.4160242.50
8926261391.5174223.37
SXB6826759091.3969223.15
8892661361.4572203.61
8SLB6846470851.9149493.04
8955172461.32176563.14
CIVB610,46878771.33138463.01
811,40382401.38149463.24
CVB611,40382401.38156572.73
810,46878771.33165533.11
SXB6949871791.33157503.11
810,03377101.31155473.25
14SLB6898384201.06220713.49
810,93585901.27250783.65
CIVB6920884471.09222743.78
811,20990841.23260804.03
CVB6953184931.12230783.67
811,41787681.31270843.88
SXB6945987811.07215723.85
811,33291801.24257823.93
Note: Single-Leg Braces (SLB), Chevron Inverted V Braces (CIVB), Chevron V Braces (CVB) and Split X braces (SXB).
Table 5. Pushover analysis results—BRB-encased steel with TDA infill.
StoryBracingSpan LengthYield Strength Vy (kN)Design Strength
Vd (kN)
Overstrength Factor RoMaximum Displacement
Δmax (mm)
Yield Displacement
Δy (mm)
Ductility
µ
4SLB6700852221.3485312.68
8772354091.42101323.07
CIVB6740255991.3275272.77
8808859041.3690273.33
CVB6678554601.2475272.77
8797359901.3388283.14
SXB6661856541.1773243.04
8785561221.2884263.23
8SLB6838359761.41205623.47
8880659971.46220623.54
CIVB6931564051.45190563.39
810,16767531.51205583.53
CVB6869761711.41186593.28
8880659971.47197603.15
SXB6875763121.38185563.30
810,19066731.52199583.43
14SLB6899577081.16295843.49
811,47078191.463701013.65
CIVB6890079131.12299783.78
811,48979811.43360894.03
CVB6888778971.12298813.67
811,42279711.43360923.88
SXB6886280111.11299773.85
811,33281251.39350893.93
Table 6. Summary of metadata of selected records.
IDScale FactorEarthquakeYearMagnitudeArias Intensity
(cm/s, OA)
Arias Intensity
(cm/s, MA)
PGA
(g)
11.0797Gazli USSR19766.85.2813.190.702
21.3647Imperial Valley-0619796.533.9814.910.598
31.3146Nahanni Canada19856.763.888.641.108
41.6071Superstition Hills19876.543.7417.340.432
51.7282Loma Prieta19896.935.3620.590.456
61.6220Erzican Turkey19926.691.5310.620.386
70.9724Cape Mendocino19927.015.968.491.493
81.6892Northridge-0119946.693.0817.910.443
91.2280Kobe Japan19956.908.3916.090.834
101.1306Chi-Chi Taiwan19997.625.3417.220.636
111.3235Duzce Turkey19997.143.7212.120.739
121.4563Manjil Iran19907.374.6431.790.514
131.7718Tottori Japan20006.615.2918.070.733
141.1297Bam Iran20036.608.0218.220.807
150.7919Niigata Japan20046.6314.5117.351.166
161.3327Chuetsu-oki Japan20076.802.8116.730.482
171.0688Iwate Japan20086.9011.8219.251.343
181.5870El Mayor Mexico20107.206.0129.530.537
191.0332Darfield NZ20107.004.4910.710.764
201.6745Duzce Turkey19997.1413.3620.661.031
211.3840Tohoku19237.9011.5978.150.427
Note: Original accelerograms (OA), matched accelerograms (MA).
Publisher’s Note: MDPI stays neutral with regard to jurisdictional claims in published maps and institutional affiliations.

