Abstract
In the closed-loop supply chain, many suppliers opt for self-recycling or entrust retailers to recycle. Under both recycling channels, the member responsible for recycling can undertake or outsource logistics services. This paper investigates how consumers’ environmental awareness and recycling cost-saving affect the optimal combination of recycling channel and logistics-service strategy. To this end, we mathematically formulate the supplier-led Stackelberg game theoretical-framework, and apply the Karush–Kuhn–Tucker conditions for constrained optimization. We examine the optimal combination under the impact of consumers’ environmental awareness and recycling cost-saving on profits, environmental impact and social welfare, using numerical analysis. Results demonstrate that as consumers’ environmental awareness and recycling cost-saving remain at a higher level, the supplier and retailer will both achieve maximum profits when the supplier entrusts the retailer to recycle and the retailer undertakes the logistics services. Meanwhile, the third party will choose to be entrusted with services by the supplier, rather than the retailer. To improve supply-chain performance, the retailer should assume social responsibility to recycle and build the logistics-service system.
1. Introduction
The upgrade of consumption has been accelerating the iteration speed of electrical equipment, resulting in plentiful waste. Based on the survey “Global E-waste Monitoring in 2020” released by the United Nations University, the total quantity of e-waste produced globally reached a record 53.6 million metric tons in 2019, which had increased by 21% in five years. Comparatively speaking, the recovery rate of appropriate recycling was merely 17.4%. The improper disposal of e-waste will exacerbate environmental problems such as global warming. In addition, compared with new products, remanufactured products can save 50% of the cost and mitigate more than 80% of pollutant emissions, which is conducive to sustainable development [1]. Hence, governments and individuals worldwide are paying growing attention to the concept of low-carbon, environmental protection and sustainable development [2,3]. “The Fourteenth Five-Year Plan” formulated by the Central Committee of the Communist Party of China put forward the goal of “peak carbon dioxide emissions” and “carbon neutrality”, and emphasized the importance of strengthening the recycling services. In the closed-loop supply chain, the recycling logistics service is an important guarantee for the smooth development of recycling work. Meanwhile, consumers’ behavior plays an important role in the closed-loop supply-chain sustainability. Just as consumers’ environmental awareness is relatively low, in reality, maybe consumers are more willing to discard products rather than recycle. To sum up, discussing recycling by considering consumers’ behavior and logistics service in a closed-loop supply chain (CLSC) is of solid practical and theoretical significance.
In the CLSC, it is paramount to choose an appropriate recycling channel, which is conducive to promoting recycling efficiency and maximizing supply-chain members’ profits [4,5,6]. As retailers are closer to consumers, OEMs (original equipment manufacturers) entrust retailers to recycle, which is a shared recycling channel (e.g., Kodak, Samsung and Haier). In recent years, OEMs have gradually discovered that recycling and re-using used-products with high salvage-value (e.g., mobile phones and computers) can bring higher profits. Certain OEMs began to establish their recycling channels (e.g., IBM, Xerox, Canon and Apple).
The logistics service plays an essential role in the improvement of the recycling rate in the CLSC [7,8,9,10,11,12,13]. Logistics providers can enhance the convenience of consumers in returning used products by elevating the service quality of reverse logistics (i.e., door-to-door collection service and the simplification of the recycling process), which is the key to improving the recycling rate. In general, in the retailer recycling-channel, JD.COM primarily depends on the self-supporting logistics service for recycling, while Suning mainly outsources logistics service to a third party. In the supplier recycling-channel, IBM designs its reverse supply-chain and sets up a logistics subsidiary to recycle, while Apple principally counts on outsourcing the logistics service to a third party, for recycling. Divergent logistics-service formats usually contribute to the variations in logistics-service quality. Therefore, exploring the ambiguous interaction between the recycling channel and logistics-service outsourcing is of great practical and academic significance.
The decision-making of the supply-chain member is prominently influenced by consumer behavior [14]. Consumers’ willingness to recycle, and environmental awareness, have an essential impact on recycling quantity and product demand, respectively, which is worth discussing. First, in the CLSC, consumers are unwilling to recycle their used products until the utility they feel from recycling is more significant than their willingness to recycle. Second, with the enhancement of consumers’ environmental awareness, consumers have a more favorable impression of enterprises that support environmental protection. and prefer to buy products that can be recycled. Meanwhile, enterprises also expect to make environmental-marketing efforts to improve consumer preference and product demand [15]. For example, enterprises claim to be committed to green recycling to manifest their strong sense of environmental responsibility to the outside world, thus bringing higher utility to products and stimulating consumers’ desire to buy. Therefore, it is indispensable to take the influence of consumer behavior on product demand and recycling willingness for recycling and re-use, into consideration.
Related research in this paper involved the Karush–Kuhn–Tucker (KKT) condition and Stackelberg game, which are widely used in every field. In order to make the paper perspicuous, the relevant theories and concepts are explain here. The KKT condition is one of the most important theoretical achievements in the field of nonlinear programming, and it is a necessary condition for determining the optimal point [16]. The KKT condition extends the equality-constraints optimization problem handled by Lagrange multipliers, to inequality. The specific approach is to introduce the slack variable to change inequality constraints into equality constraints and to solve the Lagrange equation on the basis of the constraint equation for the optimization problem. Note that the KKT multiplier is greater than or equal to 0 [17]. For the Stackelberg game, it is a two-stage complete-information dynamic game with sequential time, and is mainly used to solve the game problem when different decision makers are in different positions, emphasizing the unequal strength among competitors. The decision maker who makes the decision first is called the leader, while the decision maker who makes the decision later is the follower, and the follower can observe the result of the leader’s decision [18,19,20].
In view of the above background, the integration of the recycling channel and logistics-service strategies would generate four representative scenarios: (i) supplier–supplier scenario (SS), under which the supplier is not only responsible for recycling but also for rendering the logistics service. (ii) Supplier–third-party scenario (ST), under which the supplier takes charge of recycling and the third party provides the logistics service. (iii) Retailer–Retailer scenario (RR), under which the retailer acts as a recycling party and provides the logistics service. (iv) Retailer–third-party scenario (RT), under which the retailer serves as a recycling party and the third party renders the logistics service. Based on the above scenarios, we will explore the following issues:
- In different scenarios, what are the logistics-service quality, retail- and recycling-price, environmental-marketing effort, members’ profits, consumer surplus, environmental impact and social welfare?
- Which scenario would bring the highest members’ profits, consumer surplus, environmental impact and social welfare?
- How do consumers’ environmental awareness impact the decision-making, profits and supply-chain performance?
- Which case is optimal if considering the interaction between the recycling channel and logistics-service outsourcing?
To address the questions above, we studied a CLSC consisting of a supplier, a retailer, and a third-party logistics firm. Based on this, we analyzed the environmental-marketing effort, logistics-service quality, recycling price and quantity, enterprise’s profits, consumer surplus, environmental impact and social welfare, under typical SS, ST, RR, and RT scenarios. Furthermore, we discuss the optimal strategies, profits, and the mode of choice within the context of the interactions between consumers’ environmental-awareness and recycling cost-saving.
The remainder of this paper is organized as follows. Related researches are reviewed in Section 2. In Section 3, we narrate the assumptions and relevant notations. Section 4 discusses modeling and the equilibrium analysis. Section 5 presents the numerical-simulation-analysis consequences, and offers some insights for managers. Section 6 considers an extension where the recycling cost-saving is not constant, and explores the equilibrium consequences under the influence of consumers’ environmental awareness and e recycling cost-saving. Finally, we summarize this paper in Section 7. All the proof is presented in the Appendix A.
2. Literature Review
2.1. Recycling in the Closed-Loop Supply Chain
In the past few years, recycling in the CLSC has captured the great attention of numerous academic researchers and practitioners. Foremost, some scholars have investigated the recycling-channel-selection problem in the field of the CLSC. Wang et al. [21] displayed the best option for recycling between two competing retailers, with and without cooperation. Savaskan et al. [22] showed that the retailer’s participation in the recycling channel is a first-ranked choice for the manufacturer. Subsequently, some scholars have expanded their research into the factors affecting recycling-channel strategies. De Giovanni et al. [23] discussed the influence of incentive strategies on the recycling channel. Zhao et al. [24] investigated the effect of divergent licensing methods on collection decisions and reverse-channel performance. In the field of the CLSC, non-linear constraint-optimization problem-solving methods can be used, such as the sequential unconstrained minimization technique (SUMT), and the approximation algorithm and KKT condition [15]. Through the method of SUMT, Liu et al. [25] solved a multi-objective optimization model of emergency-material allocation. Menezes et al. [26] evaluated location-routing decisions based on the recycling network via approximation algorithms. Lyu, et al. [17] used the KKT conditions to constrain carbon emissions under a strict carbon-cap and within the recycling context. Tao [27] formulated the two-stage supply-chain optimization problem under a decentralized model as a single-level optimization model. The nonlinear model is handled by KKT. We use the same solution to solve the optimal strategies. Most of the above research mainly concentrate on the pricing strategy, model selection, incentive and cost sharing in the CLSC. Our paper contributes to the field of CLSC by combining the recycling channel with the logistics-service outsourcing strategies, considering recycling cost-saving.
2.2. Consumer Behavior
Consumer behavior has a significant impact on the decision-making of the supply chain, a fact which has progressively drawn the attention of scholars. Most of the existing studies on behavioral factors focused on forwarding channels, roughly divided into individual and organizational levels, and explored the impact of these factors on the optimal strategy and profits of supply-chain members. The individual level includes consumer environmental-awareness [18,28], the marketing effort [29,30] and the quality preference [31,32]. The organizational level contains social responsibility [33,34,35,36] and fairness concerns [37,38,39]. The research on the reverse channel, considering consumer behavior, has been increasing in recent years but it is still quite limited. By way of illustration, Feng, et al. [14] introduced consumer preferences into the recycling channel and discovered that recycling quantities and profits vary with consumer preference. Wang et al. [40] discussed the impact of recycling-channel preference on a competitive dual-collection supply chain. He et al. [41] researched the recovery efficiency of purchaser behavior under the influence of channel inconvenience in a CLSC with competitive recycling. As mentioned before, most of the research focus on the marketing effort, social responsibility, fairness concerns etc. However, unlike the above papers, we consider two important factors, including consumers’ environmental awareness and convenience of recycling brought about by the recycling-logistics-service quality, which are not conjointly studied in the CLSC.
2.3. Service Outsourcing
Service outsourcing can effectively enhance the level of service, which has become a significant development tendency in the service industry. Existing papers on service outsourcing can be broadly classified into two categories: single-sourcing [42,43,44] and multi-sourcing [20,45]. Zhang, et al. [44] investigated the information-sharing strategies in an after-sale-service supply chain when services are undertaken by suppliers or outsourced to retailers. Ding, et al. [45] demonstrated the profits of an optimal project distribution-mechanism between the general contractor and multiple service-providers. Prior studies into the effect of logistics-service outsourcing on optimal decisions focus on the forward channel. He et al. [46] researched the strategic and economic impacts of logistics service-sharing in an e-commerce supply chain. Lou et al. [47] investigated the logistics-service-outsourcing choices in a retailer-led supply chain. The above studies mainly considered one-echelon service outsourcing, and mostly focused on the forward channel. Differently to this, we further explore the scenarios of multi-echelon service outsourcing and simultaneously concentrate on the closed-loop supply chain.
Combining the above research into Table 1, we summary our innovative point in a comprehensive way; firstly, existing research mainly concentrates on the pricing strategy, model selection, incentive and cost sharing in the CLSC, but there is relatively little researches on the optimal-strategy selection, considering recycling cost-saving and the combination mode between the recycling channel and the logistics service. Secondly, previous research results mainly focus on behavioral factors such as marketing effort, social responsibility and equity concerns, and some discusses consumer environmental-awareness. However, there is a lack of relevant research considering the impact of consumer environmental-awareness and recycling convenience. Thirdly, the existing literature mainly considers one-echelon service outsourcing, and most of it focuses on the forward channel lacking the research on supply chain decision-making that considers multi-echelon service outsourcing in the closed-loop supply chain. Therefore, we innovatively propose the optimal combination of the recycling channel and logistics-service outsourcing within the context of the interaction of consumer environmental-awareness and recycling cost-saving in the CLSC.

Table 1.
Comparison of our research with the previous studies.
3. Problem Description and Assumptions
In this section, we first explain the notations and assumptions used in this paper. Then, the problem description is tested. Lastly, we provide the basis for establishing the models.
3.1. Notations and Assumptions
3.1.1. Notations
- The following notations present key parameters and decision variables throughout the paper, and the detailed definitions are given in Table 2.
Table 2. Notations.
3.1.2. Model Assumptions
- The market in each period consists of consumers, and consumers can purchase one unit of product at most. In line with the research [40,52,53,54,55], consumers’ utility decreases with the retail price and increases with the environmental-marketing effort and consumers’ environmental awareness. The specific utility function is , where and refers to the retail price and the environmental-marketing effort, respectively. denotes consumers’ willingness to pay for the product, and conforms to the uniform distribution of 0 to . We consider that the fraction () of consumers are those who possess environmental awareness. The more robust consumers’ environmental awareness, the more likely they are to prefer products that can be effectively recycled, and to feel the environmental-marketing effort of businesses. Thus, similar to Shen, et al. [55] and Guo et al. [56], we assume they can obtain an additional value, . In practice, a consumer will purchase a product if, and only if, , namely, . Thus, the market-demand function is given by:
- In reality, consumers incur certain costs in returning used goods, including time and money. Therefore, it is necessary to consider consumers’ willingness to return the used products. Consumers will return the used products only when the profit is higher than their recycling willingness: denotes consumers’ willingness to recycle used products, and conforms to the uniform distribution of 0 to 1 [21].
- The recycling utility of consumers increases with the recycling price, , logistics-service quality, , and the environmental-marketing effort, ,. Similar to Wang, et al. [40], the consumers’ recycling-utility function is , where , and refer to the sensitivity of the recycling price, the logistics-service quality, and the environmental-marketing effort, respectively. Consumers are willing to recycle the used products when . Therefore, the recycling quantity is given by:
- In general, not all products can be recycled at the end of their life cycle, and therefore the market demand is greater than the recycling quantity. In accordance with the formula, we assume , namely . The profit of the supplier is under this constraint.
- Based on the methods of Qin, et al. [10] and Shen, et al. [55], we obtain the consumer-surplus function as follows:
- Similar to Shen, et al. [55] and He et al. [57], we assume the environmental-impact function is as follows:
- In accordance with to the approach of Shen, et al. [55], Krass et al. [58] and Zhang et al. [59], we obtain the social-welfare function as follows:
3.2. Model Description
We consider a CLSC consisting of a supplier, an online retailer, and a third-party logistics-service provider (hereafter referred to as supplier, retailer, and third party, respectively). The supplier produces new and remanufactured products, and the corresponding unit-costs are expressed as and , respectively. Let , where denotes the recycling cost-saving. Assuming that the appearance and performance of new- and remanufactured-products are similar, consumers can accept the consistent pricing of two products [54,60,61]. Therefore, we use and to represent the wholesale- and retail-price per unit product, respectively.
The member responsible for recycling sets the recycling price (), makes the environmental-marketing effort (), and bears the fixed cost () of establishing the recycling system. The environmental-marketing effort consists of advertising campaigns for environmental protection carried out by the recycling party to promote recycling, such as promoting the recycling website, introducing the recycling process and displaying the green contribution of enterprise. The corresponding cost is , and denotes the environmental-marketing-effort cost factor for the member. When the supplier entrusts recycling to the retailer, the supplier must pay the unit-transfer-payment price () to the retailer. We assume is reasonable to ensure the supplier remanufacturing is profitable while ensuring that the recycling party is profitable.
The convenience of recycling has a significant impact on consumers’ recycling willingness. This paper quantifies this index by using , which denotes the logistics-service quality. The party responsible for logistics bears the fixed logistics-service-management cost (), and needs to optimize the logistics-service quality to augment the recycling quantity, by accelerating the response speed of door-to-door recycling, maximizing the convenience of recycling and enhancing the service attitude. The corresponding cost is , and is the logistics-service-cost factor. When the recycling party outsources the logistics service, it is required to pay the unit logistics-service cost () to the third party, and is the incentive factor of logistics-service quality.
3.3. Sequence of Events
In our study, the decision-making process follows the Stackelberg game [61]. Firstly, we assume between the supplier and the retailer, the supplier is the leader and the retailer is the follower. Secondly, between the retailer and the third party, the retailer is the leader and the third party is the follower. Integrating this into reality, we propose four scenarios. The decision sequence of the Stackelberg game in four scenarios is as follows (Figure 1):
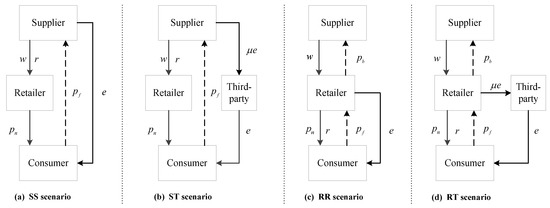
Figure 1.
CLSC Scenarios: SS, ST, RR, and RT.
(1) Supplier–Supplier Scenario (SS): The supplier first determines the wholesale price , the recycling price , the environmental-marketing effort , and the logistics-service quality . Subsequently, the retailer sets the retail price .
(2) Supplier–Third-Party Scenario (ST): The supplier determines the wholesale price , the recycling price , and the environmental-marketing effort . Then, the retailer sets the retail price . Finally, the third party determines the logistics-service quality .
(3) Retailer–Retailer Scenario (RR): The supplier first sets the wholesale price . Then, the retailer simultaneously determines the retail price , the recycling price , the environmental-marketing effort , and the logistics-service quality .
(4) Retailer–Third-Party Scenario (RT): First, the supplier determines the wholesale price . Then, the retailer sets the retail price , the recycling price , and the environmental-marketing effort . Finally, the third party determines the logistics-service quality .
Due to the fact that the game contains strategic interaction among the supplier, the retailer and the third party, the paper uses backward induction to ensure subgame perfection [62,63].
4. Model Solving and Equilibrium Analysis
4.1. SS Scenario
Under the SS scenario, the supplier works as a recycling party, and simultaneously provides the logistics service. The profit function for the supplier is written as:
The profit function for the retailer is written as:
In general, not all products can be recycled at the end of their life cycle; thus we assume , namely, . The Lagrange equation for Equations (6) is constructed as follows:
Solving the optimization problem by using the Karush–Kuhn–Tucker condition of (9), we can obtain the following proposition. (All the proof processes can be seen in Appendix B.)
Proposition 1.
Under the scenario, The optimal strategies are as follows:
Corollary 1.
According to Proposition 1, the optimal profits, consumer surplus, environmental impact and social welfare under the SS scenario, are obtained. The results are shown in Table 3. The proofs are in Appendix B.
Table 3.
Equilibrium results under four different scenarios.
Corollary 2.
Under the SS scenario, we have
➀ For decision variables, if , , , and ; if , then ; if , then ; vice versa.
➁ For profits, the consumer surplus, and the environmental impact: if , ; if , then and ; if , then ; and vice versa.
Corollary 2 manifests that an increment of recycling cost-saving within a specific constraint-range would increase the logistics-service quality, environmental-marketing effort, recycling price, retail and wholesale price, profits, consumer surplus, and environmental impact.
4.2. ST Scenario
Under the ST scenario, the supplier serves as a recycling party and the supplier outsources the logistics service to the third party. The profit function for the supplier is written as:
The profit function for the retailer is written as:
The profit function for the third party is written as:
The Lagrange equation for Equation (14) is constructed as follows:
Solving the optimization problem by using the Karush–Kuhn–Tucker condition of (19), we can obtain the following proposition. (All the proof processes can be seen in Appendix B.)
Proposition 2.
The optimal strategies in the ST scenario are solved via backward induction, as follows:
Corollary 3.
In accordance with to Proposition 2, the optimal profits, consumer surplus, environmental impact and social welfare under the ST scenario, are obtained. The results are shown in Table 3. All the proof is in Appendix B.
Corollary 4.
When the supplier acts as a recycling party and the logistics service is outsourced to a third party, we have
➀ For decision variables: If , then , and ; if , then ; when , ; and vice versa.
➁ For profits, the consumer surplus and the environmental impact: When , we have ; if , then ; for all , we have and ; if , then ; the reverse is also true.
Corollary 4 manifests that under certain constraints, with recycling cost-saving increasing, the logistics service quality, environmental marketing effort, recycling price, members’ profits, consumer surplus, and environmental impact would rise.
4.3. RR Scenario
Under the RR scenario, the supplier chooses to outsource the recycling business to the retailer, which acts as a recycling party and renders the logistics service. The profit function for the supplier is written as:
The profit function for the retailer is written as:
The Lagrange equation for Equation (23) is constructed as follows:
Solving the optimization problem by using the Karush–Kuhn–Tucker condition of (28), we can obtain the following proposition. (All the proof processes can be seen in Appendix B.)
Proposition 3.
The equilibrium decisions in the RR scenario are solved via the reverse solving method, as follows:
Corollary 5.
According to Proposition 3, the optimal profits, consumer surplus, environmental impact and social welfare under the RR scenario are obtained. The results are shown in Table 3. All the proof is in Appendix B.
Corollary 6.
When the retailer operates as a recycling party and renders the logistics service, we can obtain
➀ If , then ; If , then ; if , then ; if , note that ; if , then ; and vice versa.
➁ If , then ; when , we can obtain ; if , then ; if , then ; the converse is also true.
Similar to the SS scenario, Corollary 6 manifests that under certain constraints, in the RR scenario, an increase in the recycling cost-saving would increase the optimal logistics-service quality, environmental-marketing effort, and recycling price. Meanwhile, it also increases supply-chain performance (i.e., members’ profits, the consumer surplus, and the environmental impact).
4.4. RT Scenario
Under the RT scenario, the supplier outsources the recycling business to the retailer, and further outsources the logistics service to a third party. The profit function for the supplier is written as:
The profit function for the retailer is written as:
The profit function for the third party is written as:
The Lagrange equation for Equation (31) is constructed as follows:
Solving the optimization problem by using the Karush–Kuhn–Tucker condition of (38), we can obtain the following proposition. (All the proof processes can be seen in Appendix B.).
Proposition 4.
The optimal strategies in the RT scenario are solved via backward induction, as follows:
Corollary 7.
According to Proposition 4, the optimal profits, consumer surplus, environmental impact and social welfare under the RT scenario are obtained. The results are shown in Table 3. All the proofs are in Appendix B.
Corollary 8.
When the retailer works as a recycling party and the logistics service are provided by the third party, we have
➀ If , then ; if , then ; if , then ; if , then ; if , then ; the reverse is also true.
➁ If , then ; for all , we can obtain and ; if , then ; if , then ; and the values decrease otherwise.
Corollary 8 manifests that under certain constraints, as the recycling cost-saving increases, the optimal logistics-service quality, environmental-marketing effort, wholesale price and retail price and recycling price increase. At the same time, supply-chain performance also increases.
5. Numerical Analysis
In this section, we provide the numerical analysis to illustrate the impact of consumers’ environmental awareness on supply-chain members’ profits, consumer surplus, environmental impact and social welfare, under four different scenarios. Based on the realistic background of this paper and according to Wang, et al. [19,40], the values of the relevant parameters are assumed as follows: , , , , , , , , .
5.1. Impact of Consumers’ Environmental Awareness on Members’ Profits
Figure 2, Figure 3 and Figure 4 manifest that the consequence of the supplier’s, retailer’s and the third party’s profits hinge on the consumers’ environmental awareness.
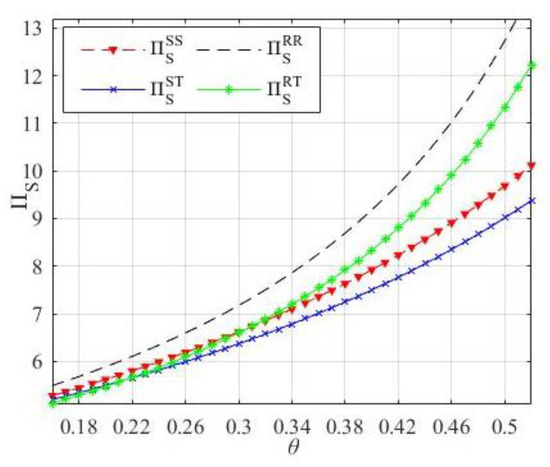
Figure 2.
The impact of on the supplier’s profit.
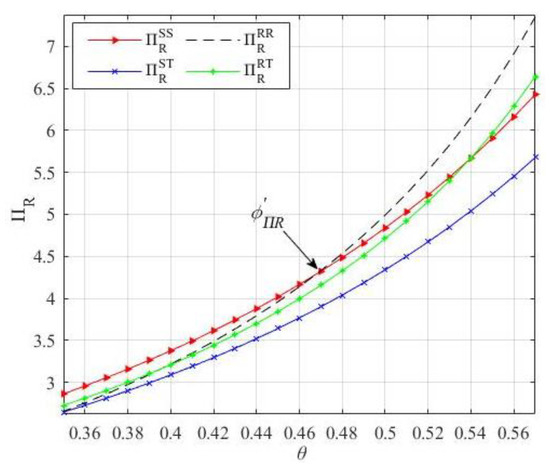
Figure 3.
The impact of on the retailer’s profit.
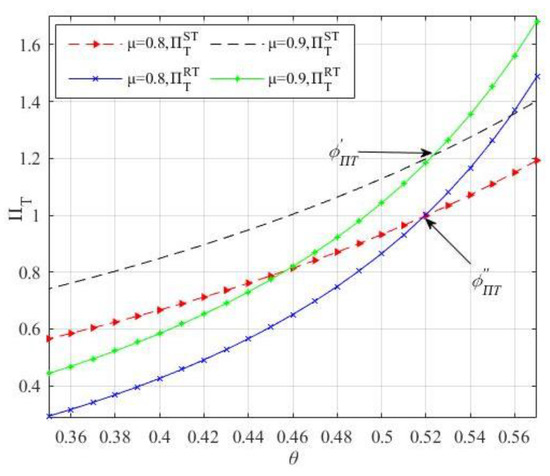
Figure 4.
The impact of on the third-party’s profit.
Figure 2 demonstrates that the supplier’s profit increases with the consumers’ environmental awareness, in four scenarios. The profit growth-trends of the supplier under the SS and ST scenarios are more correspondingly gentle than those under the RR and RT scenarios. Therefore, the supplier should cooperate with the retailer to subtly guide consumers to improve environmental awareness, utilizing green marketing to attain more profit. Under identical consumers’ environmental awareness, it is more beneficial for the supplier to commit to the logistics service than to entrust a third party. Moreover, it is the best choice for the supplier to achieve profit maximization by authorizing the self-logistics retailer to recycle. Nevertheless, the smaller-scale retailer is usually incapable of bearing the upfront investment-cost of the logistics-service system. If the supplier cannot cooperate with the retailer which has the logistics service, it is most beneficial for the supplier to choose the SS scenario when environmental awareness is low, and the RT scenario otherwise.
It can be seen from Figure 3 that improving consumers’ environmental awareness is conducive to the growth of retailers’ profit. With consumers’ environmental awareness increasing, the optimal choice for the retailer will evolve from the SS to the RR scenario. When consumer’s environmental awareness is low, it is more advantageous for the retailer to partner with the supplier who provides the recycling and logistic service. At the same time, if the retailer accepts the recycling business entrusted to the supplier, it is more beneficial for the retailer to outsource the logistics service than to operate the logistics service. When consumers’ environmental awareness exceeds the threshold, , and continues to increase, the retailer should actively strive for the recycling entrusted to the supplier and provide the logistics service, which is more conducive to maximizing the retailer’s profit.
Figure 4 indicates that the third-party’s profit increases with consumers’ environmental awareness and the logistics-service quality-incentive factor. With the augmenting of consumers’ environmental awareness, the optimal choice will gradually evolve from ST to RT. The growth trend of the third-party’s profit is flatter under the ST scenario than under the RT scenario. When the environmental awareness exceeds the threshold or , the cooperation between the third party and the retailer can maximize profits. In addition, when consumers’ environmental awareness is high, the impact of the logistics-service quality-incentive for the third party is more sensitive in the RT scenario than in the ST scenario. Therefore, when the third party collaborates with enterprises whose logistics-service quality-incentives are unstable, although the revenue in the RT scenario is greater than that in the ST scenario, it is likewise accompanied by higher risks.
5.2. Impact of Consumers’ Environmental Awareness on CS, EI, and SW
Figure 5, Figure 6 and Figure 7 manifest that the consequence of the consumer surplus, the environmental impact and social welfare rest with the consumers’ environmental awareness.
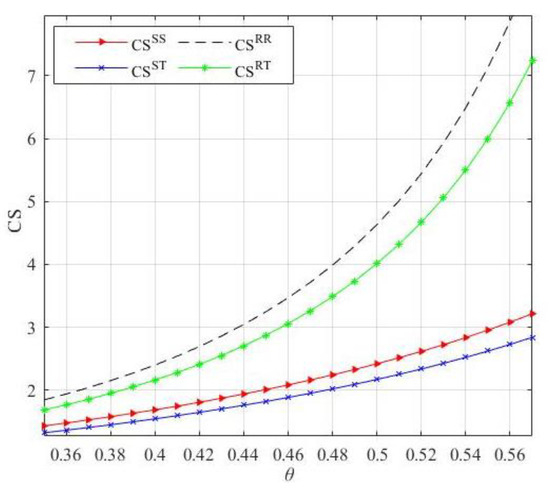
Figure 5.
The impact of on the consumer surplus.
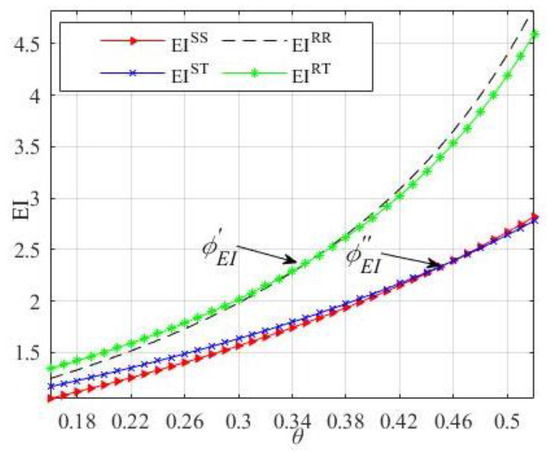
Figure 6.
The impact of on the environmental impact.
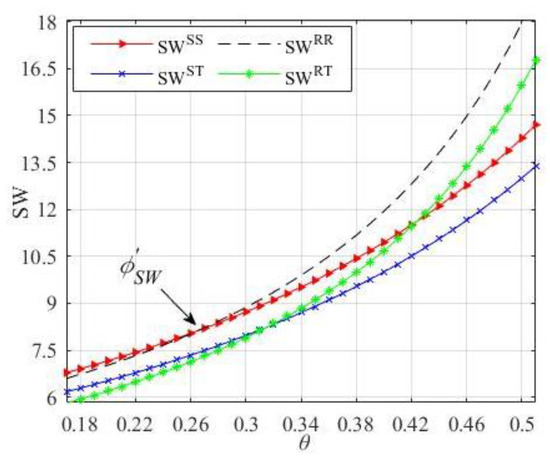
Figure 7.
The impact of on the social welfare.
Figure 5 demonstrates that the consumer surplus increases with the augmenting of consumers’ environmental awareness. The growth rate of consumer surplus under the RR and RT scenarios is faster than under the SS and ST scenarios, as consumers’ environmental awareness increases. When consumers’ environmental awareness is identical, the retailer recycling has more consumer surplus than the supplier recycling. The consumer surplus generated by providing the logistics service is higher than that from outsourcing logistics to a third party. That is to say, the higher consumer surplus will result when the supplier entrusts recycling to the self-logistics retailer. In this scenario, consumers will feel more extra value when purchasing goods, and it is easier to stimulate purchase demand. If they desire to increase sales and seize more market shares, the RR scenario is optimal for enterprises.
As illustrated in Figure 6, the environmental impact increases with consumers’ environmental awareness under four scenarios. In contrast, the growth rate of environmental impact under the SS and ST scenarios is gentler than under the RR and RT scenarios. With the same consumers’ environmental awareness, the environment impact generated by retailer-recycling is more severe than that generated by supplier-recycling. The SS scenario generates the most negligible environmental impact when consumers’ environmental awareness is below the threshold . The RR scenario leads to the highest environmental impact when consumers’ environmental awareness is above the threshold . Therefore, from the perspective of environmental protection, when consumers’ environmental awareness is low, the scenario that the supplier is self-recycling and provides the logistics service, is more favorable to the environment. When consumers’ environmental awareness is high, better environmental performance will be obtained when the supplier is responsible for recycling and outsourcing the logistics service.
Figure 7 indicates that social welfare increases with consumers’ environmental awareness. Social welfare under the SS scenario is the highest when consumers’ environmental awareness is low. When consumers’ environmental awareness exceeds the threshold , the RR scenario will generate the highest social-welfare. In general, social welfare is higher when the recycler provides the logistics service. However, when consumers’ environmental awareness is adequately high, the social welfare when the recycling-retailer outsources the logistics service is higher than that when the recycling-supplier provides the logistics service. Hence, when consumers’ environmental awareness is low, enterprises pursuing maximum social-welfare will choose the SS scenario, and the RR scenario in other cases, which is more conducive to fulfilling their social responsibilities and improving the service experience of consumers.
6. Extension: Interactions between and
This section considers the impact of consumers’ environmental awareness () and the recycling cost-saving (). Furthermore, the optimal combination of the recycling channel and logistics-service outsourcing under four scenarios, is examined. Figure 8, Figure 9 and Figure 10 manifests that the supplier’s, retailer’s and the third-party’s profits hinges on the interactions between consumers’ environmental awareness and recycling cost-saving. Figure 11 and Figure 12 manifest that the environmental impact and social welfare rest with the interaction between consumers’ environmental awareness and recycling cost-saving, respectively.
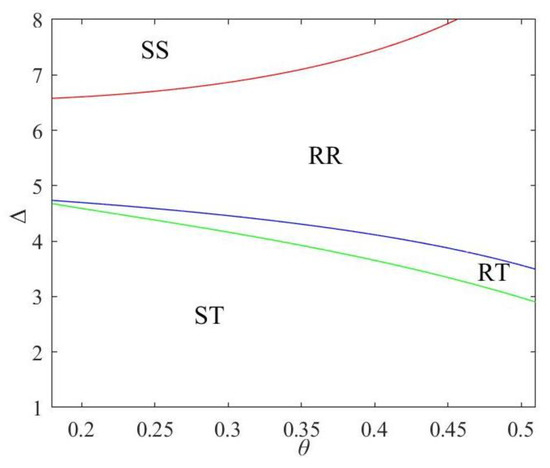
Figure 8.
The supplier’s preference: interactions between and .
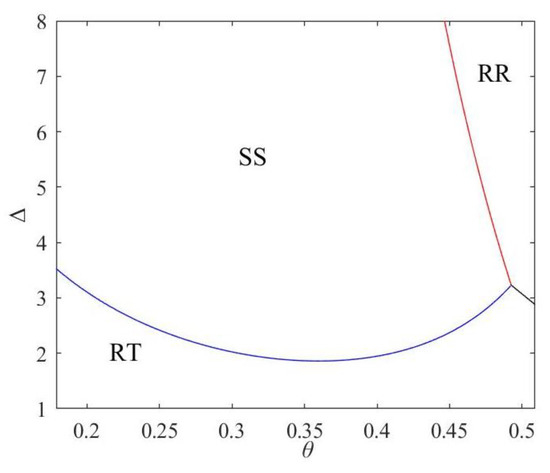
Figure 9.
The retailer’s preference: interactions between and .
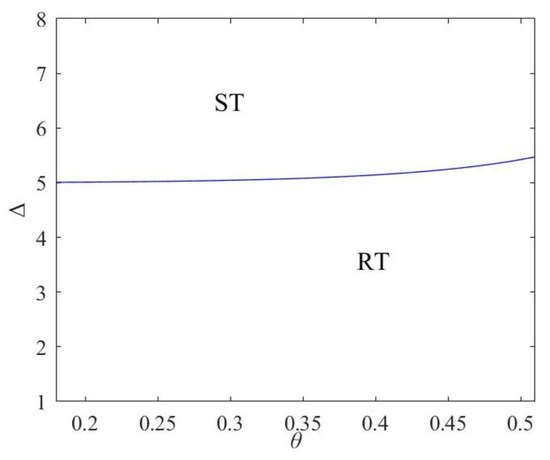
Figure 10.
The third party’s preference: interactions between and .
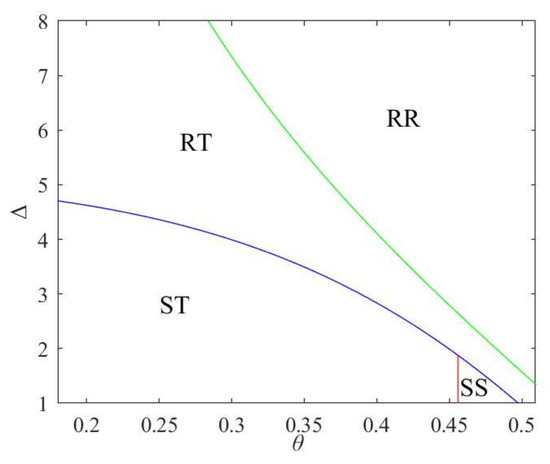
Figure 11.
Maximum and minimum environmental-impact scenarios: interactions between and .
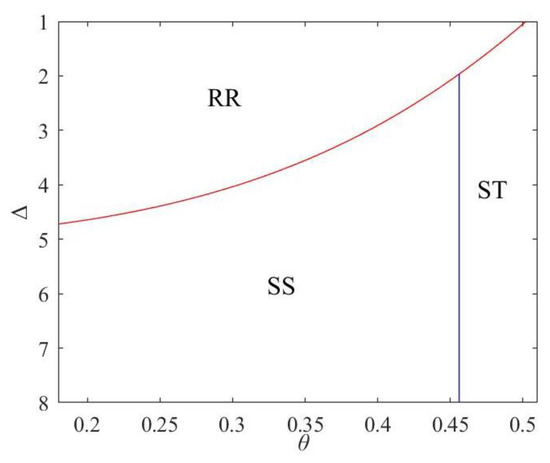
Figure 12.
Minimum environmental-impact scenario: interactions between and .
Figure 8 illustrates the fact that when the recycling cost-saving and consumers’ environmental awareness are low, the supplier will gain more benefit under the ST scenario. When the recycling cost-saving is moderate, the supplier will achieve the highest profit under the RR scenario. When the recycling cost-saving is high and consumers’ environmental awareness is low (high), the supplier will reap the highest profit under the SS (RR) scenario, respectively. That is to say, when the recycling cost-saving is low, the supplier is more inclined to recycle and to outsource the logistics service. When the recycling cost-saving is moderate, the supplier could encourage the retailer to recycle. When the recycling cost-saving is high, the supplier should make use of the dominant advantage by conducting self-recycling and providing the logistics service. When the recycling cost-saving and consumers’ environmental awareness is high, retailer-recycling and the services responsible for outsourcing will maximize the supplier’s profit, which is conducive to risk sharing and further enhances the enterprise’s competitiveness by means of focusing on boosting the core business.
Figure 9 indicates that when the recycling cost-saving is low, the RT scenario is more favorable for the retailer, regardless of whether consumers’ environmental awareness is high or low. With consumers’ environmental awareness and the recycling cost-saving increasing, the optimal choice for the retailer will gradually evolve from RT to SS and RR. This suggests that it is more advantageous for the retailer to outsource the logistics service when the recycling cost-saving is low; otherwise, the retailer prefers to partner with the supplier responsible for recycling and the logistics service. When the recycling cost-saving and consumers’ environmental awareness is high, the supplier is usually willing to pay a higher price for the transfer payment, due to the high recycling-value of the used products. Meanwhile, the retailer is more inclined to strive for the power of attorney of recycling from the supplier, and at the same time to be responsible for the logistics service, which is more beneficial to the retailer.
As shown in Figure 10, third-party profit is highest under the RT scenario when the recycling cost-saving is low. As the recycling cost-saving increases, the optimal choice of the third party will evolve from RT to ST. Meanwhile, with consumers’ environmental awareness increasing, the threshold of recycling cost-saving moves from RT to ST. This indicates that when the recycling value of used products is low, the third party is more willing to cooperate with the retailer who is responsible for the recycling. When the recycling value of used products is high, it is more beneficial for the third party to achieve profit maximization by working with the supplier undertaking recycling.
From Figure 11 and Figure 12, we can discover that the RT scenario gives rise to the maximal environmental impact when the recycling cost-saving is high and consumers’ environmental awareness is low. As the recycling cost-saving and consumers’ environmental awareness increase, the scenario with the highest environmental impact will evolve from ST to RT and RR. When the recycling cost-saving and consumers’ environmental awareness are low, the ST scenario has the maximal environmental impact, while the RR scenario has the minimal environmental impact. Due to consumers’ environmental awareness, consumers possess a greater preference for products that will be effectively recycled at the end of their life cycle. Meanwhile, consumers can more easily feel the additional utility brought about by the environmental-marketing effort. As a result, the sharp increase in consumer demand urges the supplier to increase the quantity of production, which adds a more significant burden to the environment. Therefore, from an environmental perspective, when the recycling cost-saving is low, it is more conducive to the environment for the retailer to be responsible for recycling and to provide the logistics service. When the recycling cost-saving is high and consumers’ environmental awareness is low, the pressure on the environment triggered by the supplier’s recycling and providing the logistics service is the slightest. When consumers’ environmental awareness exceeds the threshold and increases, the supplier who self-recycles and entrusts the logistics service to a third party, will improve the environmental-protection performance.
As shown in Figure 13, when the recycling cost-saving is relatively low or high and consumers’ environmental awareness is inferior, social welfare is largest under the SS scenario. When consumers’ environmental awareness is high, with the recycling cost-saving increasing, the maximal social-welfare gradually evolves from SS to RT and then RR, and finally back to SS. When the recycling cost-saving and consumers’ environmental awareness are both large, social welfare is highest under the RR scenario. That is to say, when the recycling cost-saving is low or high, it is easier for the supplier to realize the social-welfare maximum in the scenario of self-recycling and the self-providing logistics service. When the recycling cost-saving and consumers’ environmental awareness are high, the supplier should entrust the recycling and provision of the logistics service to the retailer. To maximize social welfare, enterprises should assume e social responsibility, and choose the scenario that gives the most excellent social-welfare, according to the recycling cost-saving and consumers’ environmental awareness. The government can also encourage enterprises to choose the scenario with the maximum social welfare, by giving them reputational or material rewards.
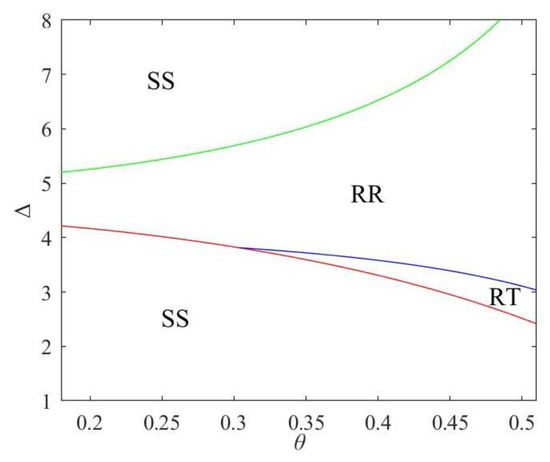
Figure 13.
Maximum social welfare scenario: interactions between and .
7. Conclusions
This paper discusses the optimal combination of the recycling channel and logistics outsourcing, and analyzes the influence of consumers’ environmental awareness and recycling cost-saving on the optimal strategies and profits. We mathematically formulate the supplier-led Stackelberg game theoretical-framework, and apply Karush–Kuhn–Tucker (KKT) conditions for constrained optimization. We summarize the key findings as follows. First of all, as consumers’ environmental awareness and recycling cost-saving remain at a higher level, the retailer is more willing to undertake recycling and to build a logistics-service system, through which the supplier and the retailer will create a win-win situation. Second, the third party will choose to trust the supplier rather than the retailer when consumers’ environmental awareness and recycling cost-saving are higher. Finally, to improve supply-chain performance, the retailer should assume social responsibility to recycle and build a logistics-service system when consumers’ environmental awareness and recycling cost-saving are higher.
The comprehensive analysis provides the following insights. Firstly, for the supplier, it is recommended that the supplier can choose to cooperate with the retailer and encourage the retailer to undertake recycling, to achieve the highest profits. When the supplier chooses to take charge of recycling, it is better for the supplier to build the logistics-service system, rather than outsource the logistics service.
Second, for the retailer, when consumers’ environmental awareness is relatively low, the retailer can choose to co-operate with the supplier and achieve a win-win situation. When consumers’ environmental awareness exceeds a certain threshold, the retailer can choose to undertake the recycling and logistics service. Rather than outsourcing the logistics service, the retailer can choose to undertake the logistics service, to achieve higher profits.
For the third party, when the incentive factor of logistics-service quality is relatively low, the third party should choose to co-operate with the supplier rather than the retailer. The third party should improve the logistics-service quality, to achieve higher profits.
The contribution of this paper is mainly reflected in three aspects. First, this paper is the first study to explore the optimal combination of the recycling channel and logistics outsourcing in the closed-loop supply chain. Different strategy-combinations will result in different scenarios. Second, our research not only fills the research gap in the existing research related to closed-loop supply chain and logistics services, but also explains the optimal combination, considering the important factors such as consumers’ environmental awareness and recycling saving, from a new perspective. Third, it provides some new management options for suppliers and retailers choosing the recycling channel and deciding whether or not to outsource the logistics service.
To summarize, several limitations still exist in this work, suggesting further research and improvement. Future papers can further explore the following potential directions. (i) The introduction of competition into the CLSC deserves further study. It will be interesting to contemplate recycling competition among multiple members of the CLSC. (ii) Further study can concentrate on the problems of demand-uncertainty and asymmetric information in the CLSC. (iii) It is not easy to accurately evaluate the quality of second-hand products taken back from consumers, in practice. Hence, the recycling problem of the CLSC that introduces blockchain technology which has traceability, has specific research prospects and merits further discussion. (iv) We can explore how to solve the corresponding multi-objective optimization, to find a balanced solution for each scenario.
Author Contributions
Conceptualization, X.Z. and P.X.; methodology, X.Z. and P.X.; formal analysis, X.Z. and P.X.; investigation, X.Z.; resources, P.X.; data curation, X.Z. and P.X.; writing—X.Z. and P.X.; writing—review and editing, M.W.; supervision, M.W.; project administration, X.Z. and P.X.; funding acquisition, P.X. All authors have read and agreed to the published version of the manuscript.
Funding
This research was funded by the National Natural Science Foundation of China (Grant NO.71801118), Scientific Research Fund of Liaoning Provincial Education Department (Grant NO. LQN202024) and Social Science Planning Foundation of Liaoning Province (Grant NO. L21CGL014).
Institutional Review Board Statement
Not applicable.
Informed Consent Statement
Not applicable.
Data Availability Statement
Not applicable.
Conflicts of Interest
The authors declare no conflict of interest.
Appendix A
, , , , , , , , , , , , , , , , , , , , , , , , , , ,
Appendix B
Proof of Proposition 1.
We are going to solve the optimization problem using the Stackelberg game. We first describe the equilibrium retail-price that would maximize the retailer’s profit for any given wholesale price , recycling price , environmental-marketing effort and logistics service quality . That is, in accordance with , we obtain . Substitute into Equation (6). We solve the supplier’s optimal solutions, based on the Karush–Kuhn–Tucker (KKT) conditions.
Scenario 1: When , from Equations (A1) to (A6) we get: , , , .
Substituting , , and into , the optimal retail-price can be obtained.
Scenario 2: When , then . That is, every product sold by the retailer will be completely recycled after use. In practice, this situation is challenging to implement, and will not be considered in this study. □
Proof of Corollary 1.
According to Proposition 1, by substituting Equations (10) to (14) into Equations (3) to (5) and Equations (6) and (8), the optimal profits of supplier and retailer, consumer surplus, environmental impact, and social welfare, under the SS scenario, can be obtained. □
Proof of Corollary 2.
Solve the first-order partial derivative of for ,, , , ,, , and , respectively. In accordance with the conclusion of Proposition 1 and some algebraic operations, Corollary 2 is proved. □
Proof of Proposition 2.
We are going to solve the optimization problem using the Stackelberg game. The optimal logistics-service quality can be obtained from solving the first-order condition . Substituting into Equation (17), the retail prices can be obtained from solving the following: . Substitute and into the supplier’s profit function. We solve the supplier’s optimal solutions, based on the Karush–Kuhn–Tucker (KKT) conditions.
Scenario 1: When , from Equations (A7) to (A11) we get: , .
Substituting , and into and , the optimal logistics-service quality and retail price can be obtained.
Scenario 2: When , then . That is to say, every product sold by the retailer will be fully recycled after being used. Similar to the SS scenario and the proof of Proposition 1, this scenario is not considered in this paper. □
Proof of Corollary 3.
According to Proposition 2, by substituting Equations (20) to (24) into Equations (3) to (5) and Equations (15) to (18), the optimal profits of supplier and retailer, consumer surplus, environmental impact and social welfare under the ST scenario, can be obtained. □
Proof of Corollary 4.
Solve the first-order partial derivative of for , , , , , , , , and , separately. In accordance with the conclusion of Proposition 2 and some algebraic operations, Corollary 4 is proved. □
Proof of Proposition 3.
when , from Equations (A12) to (A14) we get: .
We are going to solve the optimization problem using the Stackelberg game. From , , and , we get , , and . Then substitute them into the supplier’s-profit function. To prove concavity, we calculate the Hessian matrix of as follows:
Let , , . The Hessian matrix is negative definite when , , and . Hence, is jointly concave in , , and . We solve the supplier’s optimal solutions based on the Karush–Kuhn–Tucker (KKT) conditions.
Substituting into , , and , the optimal environmental-marketing-effort , logistics-service level , retail price and recycling price can be obtained. □
Proof of Corollary 5.
In accordance with Proposition 3, by substituting Equations (29) to (33) into Equations (3) to (5) and Equations (25) and (27), the optimal profits of supplier and retailer, consumer surplus, environmental impact and social welfare under the RR scenario, can be obtained. □
Proof of Corollary 6.
Solve the first-order partial derivative of for , , , , , , , and , separately. In accordance with the conclusion of Proposition 3 and some algebraic operations, Corollary 6 is proved. □
Proof of Proposition 4.
We are going to solve the optimization problem using the Stackelberg game. The optimal logistics-service quality can be obtained from solving the first-order condition . Substituting into Equation (36), the optimal retailer’s-profit can be obtained. In order to prove concavity, we calculate the Hessian matrix of as follows:
, let , , and . Similar to the Proof of Proposition 3, the Hessian matrix is negative definite; if the value of the first-order principal subset is , the value of the second-order principal subset is , and . Hence, is jointly concave in , and . From , and , we can get , and , and then substitute them into the supplier’s-profit function. We solve the supplier’s optimal solutions based on the Karush–Kuhn–Tucker (KKT) conditions.
When , from Equations (A15) to (A17) we get: .
Substituting into , , and , the optimal logistics-service-level , the environmental-marketing effort , the retail price , and the recycling price can be obtained. □
Proof of Corollary 7.
In accordance with Proposition 4, the optimal profits of supplier and retailer, consumer surplus, environmental impact and social welfare under the RT scenario, can be obtained by substituting Equations (39) to (43) into Equations (3) to (5) and Equations (34) to (37). □
Proof of Corollary 8.
Solve the first-order partial derivative of for , , , , , , , and , separately. In accordance with the conclusion of Proposition 4 and some algebraic operations, Corollary 8 is proved. □
References
- China Daily. Remanufacturing to Play Key Role in Green Economy. 15 November 2013. Available online: http://www.chinadaily.com.cn/business/2013-11/15/content_17109323.html (accessed on 5 January 2022).
- Raszka, B.; Dziezyc, H.; Heldak, M. Assessment of the Development Potential of Post-Industrial Areas in Terms of Social, Economic and Environmental Aspects: The Case of Walbrzych Region (Poland). Energies 2021, 14, 17. [Google Scholar] [CrossRef]
- Yan, D.; Liu, H.D.; Yao, P.B. Assessing Energy Efficiency for Economic and Sustainable Development in the Region of European Union Countries. Front. Environ. Sci. 2021, 9, 12. [Google Scholar] [CrossRef]
- Gong, Y.D.; Chen, M.Z.; Zhuang, Y.L. Decision-Making and Performance Analysis of Closed-Loop Supply Chain under Different Recycling Modes and Channel Power Structures. Sustainability 2019, 11, 26. [Google Scholar] [CrossRef]
- Huang, Y.T.; Wang, Z.J. Dual-Recycling Channel Decision in a Closed-Loop Supply Chain with Cost Disruptions. Sustainability 2017, 9, 28. [Google Scholar] [CrossRef]
- Wang, X.; Ma, D.Q.; Hu, J.S. Recycling Model Selection for Electronic Products Considering Platform Power and Blockchain Empowerment. Sustainability 2022, 14, 44. [Google Scholar] [CrossRef]
- Li, F.; Fan, Z.P.; Cao, B.B.; Li, X. Logistics Service Mode Selection for Last Mile Delivery: An Analysis Method Considering Customer Utility and Delivery Service Cost. Sustainability 2021, 13, 22. [Google Scholar] [CrossRef]
- Li, F.; Fan, Z.P.; Cao, B.B.; Lv, H.M. The Logistics Service Mode Selection for Last Mile Delivery Considering Delivery Service Cost and Capability. Sustainability 2020, 12, 17. [Google Scholar] [CrossRef]
- Lu, F.Q.; Wang, L.Y.; Bi, H.L.; Du, Z.C.; Wang, S.X. An Improved Revenue Distribution Model for Logistics Service Supply Chain Considering Fairness Preference. Sustainability 2021, 13, 30. [Google Scholar] [CrossRef]
- Qin, X.L.; Liu, Z.X.; Tian, L. The optimal combination between selling mode and logistics service strategy in an e-commerce market. Eur. J. Oper. Res. 2021, 289, 639–651. [Google Scholar] [CrossRef]
- Wang, S.N.; Hu, Z.H. Green Logistics Service Supply Chain Games Considering Risk Preference in Fuzzy Environments. Sustainability 2021, 13, 32. [Google Scholar] [CrossRef]
- Yu, Y.L.; Xiao, T.J. Pricing and cold-chain service level decisions in a fresh agri-products supply chain with logistics outsourcing. Comput. Ind. Eng. 2017, 111, 56–66. [Google Scholar] [CrossRef]
- Liu, K.; Li, C.F.; Gu, R.D. Pricing and Logistics Service Decisions in Platform-Led Electronic Closed-Loop Supply Chain with Remanufacturing. Sustainability 2021, 13, 28. [Google Scholar] [CrossRef]
- Feng, L.P.; Govindan, K.; Li, C.F. Strategic planning: Design and coordination for dual-recycling channel reverse supply chain considering consumer behavior. Eur. J. Oper. Res. 2017, 260, 601–612. [Google Scholar] [CrossRef]
- Zhang, L.H.; Wang, J.G.; You, J.X. Consumer environmental awareness and channel coordination with two substitutable products. Eur. J. Oper. Res. 2015, 241, 63–73. [Google Scholar] [CrossRef]
- Bazaraa, M.S.; Sherali, H.D.; Shetty, C.M. Nonlinear Programming: Theory and Algorithms; John Wiley & Sons: Hoboken, NJ, USA, 2013. [Google Scholar]
- Lyu, R.X.; Zhang, C.H.; Li, Z.T.; Li, Y.T. Manufacturers’ integrated strategies for emission reduction and recycling: The role of government regulations. Comput. Ind. Eng. 2022, 163, 33. [Google Scholar] [CrossRef]
- Jiang, W.; Yuan, M. Coordination of Prefabricated Construction Supply Chain under Cap-and-Trade Policy Considering Consumer Environmental Awareness. Sustainability 2022, 14, 22. [Google Scholar] [CrossRef]
- Wang, N.M.; He, Q.D.; Jiang, B. Hybrid closed-loop supply chains with competition in recycling and product markets. Int. J. Prod. Econ. 2019, 217, 246–258. [Google Scholar] [CrossRef]
- Wu, J.J.; Wang, H.Y.; Shang, J. Multi-sourcing and information sharing under competition and supply uncertainty. Eur. J. Oper. Res. 2019, 278, 658–671. [Google Scholar] [CrossRef]
- Wang, Q.F.; Hong, X.P.; Gong, Y.M.; Chen, W.Y. Collusion or Not: The optimal choice of competing retailers in a closed-loop supply chain. Int. J. Prod. Econ. 2020, 225, 15. [Google Scholar] [CrossRef]
- Savaskan, R.C.; Bhattacharya, S.; Van Wassenhove, L.N. Closed-loop supply chain models with product remanufacturing. Manag. Sci. 2004, 50, 239–252. [Google Scholar] [CrossRef]
- De Giovanni, P.; Reddy, P.V.; Zaccour, G. Incentive strategies for an optimal recovery program in a closed-loop supply chain. Eur. J. Oper. Res. 2016, 249, 605–617. [Google Scholar] [CrossRef]
- Zhao, J.J.; Wang, C.X.; Xu, L. Decision for pricing, service, and recycling of closed-loop supply chains considering different remanufacturing roles and technology authorizations. Comput. Ind. Eng. 2019, 132, 59–73. [Google Scholar] [CrossRef]
- Liu, Y.H.; Li, Y.C.; Huang, D. A Multiobjective Optimization Model for Continuous Allocation of Emergency Rescue Materials. Math. Probl. Eng. 2020, 2020, 5693182. [Google Scholar] [CrossRef]
- Menezes, M.B.C.; Ruiz-Hernandez, D.; Verter, V. A rough-cut approach for evaluating location-routing decisions via approximation algorithms. Transp. Res. Part B-Methodol. 2016, 87, 89–106. [Google Scholar] [CrossRef]
- Tao, Z.M. Two-Stage Supply-Chain Optimization Considering Consumer Low-Carbon Awareness under Cap-and-Trade Regulation. Sustainability 2019, 11, 5727. [Google Scholar] [CrossRef]
- Su, C.; Liu, X.J.; Du, W.Y. Green Supply Chain Decisions Considering Consumers’ Low-Carbon Awareness under Different Government Subsidies. Sustainability 2020, 12, 12. [Google Scholar] [CrossRef]
- Kaur, B.; Gangwar, V.P.; Dash, G. Green Marketing Strategies, Environmental Attitude, and Green Buying Intention: A Multi-Group Analysis in an Emerging Economy Context. Sustainability 2022, 14, 16. [Google Scholar] [CrossRef]
- Li, C.; Guo, S.W.; Zhang, H. Coordinating a Green Agri-Food Supply Chain with Revenue-Sharing Contracts Considering Retailers’ Green Marketing Efforts. Sustainability 2020, 12, 16. [Google Scholar]
- Chakraborty, T.; Chauhan, S.S.; Ouhimmou, M. Cost-sharing mechanism for product quality improvement in a supply chain under competition. Int. J. Prod. Econ. 2019, 208, 566–587. [Google Scholar] [CrossRef]
- Fan, J.C.; Ni, D.B.; Fang, X. Liability cost sharing, product quality choice, and coordination in two-echelon supply chains. Eur. J. Oper. Res. 2020, 284, 514–537. [Google Scholar] [CrossRef]
- Arya, A.; Mittendorf, B. Supply Chain Consequences of Subsidies for Corporate Social Responsibility. Prod. Oper. Manag. 2015, 24, 1346–1357. [Google Scholar] [CrossRef]
- Duan, C.Q.; Yao, F.M.; Xiu, G.Y.; Zhang, Y.H.; Zhang, X.L. Multi-Period Closed-Loop Supply Chain Network Equilibrium: Perspective of Marketing and Corporate Social Responsibility. IEEE Access 2021, 9, 1495–1511. [Google Scholar] [CrossRef]
- Zhang, C.H.; Xing, P.; Li, J. Optimal Strategy of Social Responsibility and Quality Effort in Service Supply Chain with Quality Preference. Asia Pac. J. Oper. Res. 2018, 35, 43. [Google Scholar] [CrossRef]
- Liu, Y.Z.; Xiao, T.J. Pricing and Collection Rate Decisions and Reverse Channel Choice in a Socially Responsible Supply Chain With Green Consumers. IEEE Trans. Eng. Manag. 2020, 67, 483–495. [Google Scholar] [CrossRef]
- Li, X.; Cui, X.Q.; Li, Y.J.; Xu, D.Q.; Xu, F.C. Optimisation of reverse supply chain with used-product collection effort under collector’s fairness concerns. Int. J. Prod. Res. 2021, 59, 652–663. [Google Scholar] [CrossRef]
- Ma, P.; Li, K.W.; Wang, Z.J. Pricing decisions in closed-loop supply chains with marketing effort and fairness concerns. Int. J. Prod. Res. 2017, 55, 6710–6731. [Google Scholar] [CrossRef]
- Wang, Y.Y.; Fan, R.J.; Shen, L.; Jin, M.Z. Decisions and coordination of green e-commerce supply chain considering green manufacturer’s fairness concerns. Int. J. Prod. Res. 2020, 58, 7471–7489. [Google Scholar] [CrossRef]
- Wang, N.M.; Song, Y.F.; He, Q.D.; Jia, T. Competitive dual-collecting regarding consumer behavior and coordination in closed-loop supply chain. Comput. Ind. Eng. 2020, 144, 15. [Google Scholar] [CrossRef]
- He, Q.D.; Wang, N.M.; Yang, Z.; He, Z.W.; Jiang, B. Competitive collection under channel inconvenience in closed-loop supply chain. Eur. J. Oper. Res. 2019, 275, 155–166. [Google Scholar] [CrossRef]
- Chen, J.X.; Liang, L.; Yao, D.Q. Factory encroachment and channel selection in an outsourced supply chain. Int. J. Prod. Econ. 2019, 215, 73–83. [Google Scholar] [CrossRef]
- Yao, X.; Huang, R.T.; Song, M.L.; Mishra, N. Pre-positioning inventory and service outsourcing of relief material supply chain. Int. J. Prod. Res. 2018, 56, 6859–6871. [Google Scholar] [CrossRef]
- Zhang, S.G.; Dan, B.; Zhou, M.S. After-sale service deployment and information sharing in a supply chain under demand uncertainty. Eur. J. Oper. Res. 2019, 279, 351–363. [Google Scholar] [CrossRef]
- Ding, H.P.; Chen, X.B.; Lin, K.H.; Wei, Y.B. Collaborative mechanism of project profit allotment in petroleum engineering service chain with customized integration. Int. J. Prod. Econ. 2019, 214, 163–174. [Google Scholar] [CrossRef]
- He, P.; Wen, J.Y.; Ye, S.; Li, Z.Q. Logistics service sharing and competition in a dual-channel e-commerce supply chain. Comput. Ind. Eng. 2020, 149, 14. [Google Scholar] [CrossRef]
- Lou, Y.Q.; Feng, L.P.; He, S.G.; He, Z.; Zhao, X.K. Logistics service outsourcing choices in a retailer-led supply chain. Transp. Res. Part E-Logist. Transp. Rev. 2020, 141, 18. [Google Scholar] [CrossRef]
- Ma, Z.J.; Zhang, N.A.; Dai, Y.; Hu, S. Managing channel profits of different cooperative models in closed-loop supply chains. Omega-Int. J. Manag. Sci. 2016, 59, 251–262. [Google Scholar]
- Liu, W.H.; Wang, D.; Shen, X.R.; Yan, X.Y.; Wei, W.Y. The impacts of distributional and peer-induced fairness concerns on the decision-making of order allocation in logistics service supply chain. Transp. Res. Part E-Logist. Transp. Rev. 2018, 116, 102–122. [Google Scholar] [CrossRef]
- Yang, L.; Hu, Y.J.; Huang, L.J. Collecting mode selection in a remanufacturing supply chain under cap-and-trade regulation. Eur. J. Oper. Res. 2020, 287, 480–496. [Google Scholar] [CrossRef]
- Feng, T.J.; Ren, Z.J.; Zhang, F.Q. Service Outsourcing: Capacity, Quality and Correlated Costs. Prod. Oper. Manag. 2019, 28, 682–699. [Google Scholar] [CrossRef]
- Chen, D.Q.; Ignatius, J.; Sun, D.Z.; Zhan, S.L.; Zhou, C.Y.; Marra, M.; Demirbag, M. Reverse logistics pricing strategy for a green supply chain: A view of customers’ environmental awareness. Int. J. Prod. Econ. 2019, 217, 197–210. [Google Scholar] [CrossRef]
- Guo, L.; Zhang, J.J. Consumer Deliberation and Product Line Design. Mark. Sci. 2012, 31, 995–1007. [Google Scholar] [CrossRef]
- Wu, C.H. OEM product design in a price competition with remanufactured product. Omega-Int. J. Manag. Sci. 2013, 41, 287–298. [Google Scholar] [CrossRef]
- Shen, B.; Cao, Y.F.; Xu, X.Y. Product line design and quality differentiation for green and non-green products in a supply chain. Int. J. Prod. Res. 2020, 58, 148–164. [Google Scholar] [CrossRef]
- Guo, R.X.; Lee, H.L.; Swinney, R. Responsible Sourcing in Supply Chains. Manag. Sci. 2016, 62, 2722–2744. [Google Scholar] [CrossRef]
- He, P.; He, Y.; Xu, H. Channel structure and pricing in a dual-channel closed-loop supply chain with government subsidy. Int. J. Prod. Econ. 2019, 213, 108–123. [Google Scholar] [CrossRef]
- Krass, D.; Nedorezov, T.; Ovchinnikov, A. Environmental Taxes and the Choice of Green Technology. Prod. Oper. Manag. 2013, 22, 1035–1055. [Google Scholar] [CrossRef]
- Zhang, Z.; Wang, Y.T.; Meng, Q.C.; Luan, X.Y. Impacts of Green Production Decision on Social Welfare. Sustainability 2019, 11, 16. [Google Scholar] [CrossRef]
- Hong, X.P.; Govindan, K.; Xu, L.; Du, P. Quantity and collection decisions in a closed-loop supply chain with technology licensing. Eur. J. Oper. Res. 2017, 256, 820–829. [Google Scholar] [CrossRef]
- Xiang, Z.H.; Xu, M.L. Dynamic game strategies of a two-stage closed-loop supply chain considering Big Data marketing, technological innovation and overconfidence. Comput. Ind. Remanuf. Eng. 2020, 145, 15. [Google Scholar] [CrossRef]
- Liu, L.; Parlar, M.; Zhu, S.X. Pricing and lead time decisions in decentralized supply chains. Manag. Sci. 2007, 53, 713–725. [Google Scholar] [CrossRef]
- Xiao, L.; Xu, M.H.; Zheng, J.J.; Huang, S. Inducing manufacturer’s quality enhancement via retailer’s acquisition strategy. Omega-Int. J. Manag. Sci. 2020, 93, 14. [Google Scholar] [CrossRef]


Publisher’s Note: MDPI stays neutral with regard to jurisdictional claims in published maps and institutional affiliations. |
© 2022 by the authors. Licensee MDPI, Basel, Switzerland. This article is an open access article distributed under the terms and conditions of the Creative Commons Attribution (CC BY) license (https://creativecommons.org/licenses/by/4.0/).