1. Introduction
Road transportation is the backbone of social and economic development, with a profound impact on both economic growth and employment rates [
1]. For example, more than 12 million people are employed in transport industries within European Union (EU) countries, and the automotive sector accounts for 5% of the EU GDP [
1]. The quality of transport services is one of the principal indicators of the quality of life, for which approximately 13.2% of every household’s budget is spent on the transport of goods and services [
1,
2]. Despite such remarkable social and economic contributions, the transportation sector is one of the primary causes of a wide variety of undesirable and unsustainable outcomes.
The numbers of deaths and injuries resulting from road collisions and car accidents are significant; traffic injuries are the principal cause of death among young people between the ages of 5 and 29 worldwide [
3]. A 2021 report of the World Health Organization (WHO) revealed that transport accidents contribute to over 1.35 million deaths and 20 to 60 million non-fatal but life-changing injuries worldwide annually [
3]. Along with these lives directly impacted, a wide body of research has evidenced the substantial contribution of transport to greenhouse gas and air pollutant emission inventories. On-road vehicles are the major source of fine and ultrafine particulate matter and nitrogen oxide air pollutants in urban environments; see, for example, [
4]. The transportation sector is a leading energy consumer globally; for example, on-road vehicles consumed 27.6% of the total US energy budget in 2018 [
2]. Hence, over 20% of global carbon dioxide (CO
2) emissions are produced by the combustion of fossil fuels in on-road vehicle engines, making transport currently one of the leading contributors to anthropogenic climate change [
5]. Globally, GHG emissions from the transport sector are rising, whereas emissions from other principal sources, such as industrial sectors, electric power plants and the residential sector, have somewhat decreased over the past few decades [
6]. It is noted that the current COVID-19 pandemic made small (perhaps only temporary) differences in total global emissions from transport.
Transport is considered a high-priority sector for sustainable development because of its large and growing contribution to climate change. Hence, sustainable transport has been given significant attention in the past two decades by researchers, academics, environmental specialists, policymakers and economists. The Brundtland Commission report defines sustainable development as ‘development that meets the needs of the present without compromising the ability of future generations to meet their own needs’ [
7]. A sustainable transport system should support the basic needs of society by being affordable, operating safely and efficiently, being secure and supporting the economy. It should also have limited emissions, waste and other negative environmental drawbacks.
A variety of attempts have been made to achieve sustainable transport by addressing the three fundamental pillars of environmental, social and economic sustainability. For example, introducing stringent vehicle emission standards, employing new engines and automotive technologies, boosting fuel quality and moving toward cleaner fuels all seek to address the environmental drawbacks of transport [
8,
9]. Several other strategies and models have been employed to achieve new approaches in optimising fuel consumption, improving road safety, reducing traffic congestion, etc., to support the social and economic dimensions of sustainable transport. Human behaviour is a key factor that is often not accounted for within the analysis but substantially impacts all aspects of sustainable transport. In the context of motor vehicle sustainability, human behaviour is usually referred to as driving behaviour (an example of which can be found in [
10]). Driving behaviour studies became increasingly prevalent in the period from 1995–2010 when civilian applicants began accessing the global positioning system (GPS) to instantaneously determine their location.
Vehicle telematics provides timestamped position information of vehicles over telecommunication networks [
11]. The concept of telematics data originated long before GPS, initially through the use of radio triangulation. The advent of GPS allowed for telematics data to become more precise, and correspondingly, the market grew alongside the use of the new technology. Telematics data were initially employed for anti-theft, asset recovery and routing purposes. Subsequently, they were utilised by insurance companies to tailor insurance premia according to individual driving styles or behaviours. A report from the British Insurance Brokers Association (BIBA) shows that the number of live telematics-based policies in the UK reached about one million in 2017 [
12]. Global figures show that over 200 million telematics units were in operation worldwide in 2019 and 2020 [
13]. The existing trade-offs between the insurance provisions and road safety are discussed in detail by [
14]. Recent technological advances, from new online communication techniques to new storage and processing technologies, will likely expand the application of telematics data to sustainable transport systems. For example, telematics data is a key element in developing trustworthy intelligent transportation systems (ITS), which are an essential feature for safety and productivity attainment in road transport [
15]. Telematics might also be employed to support new-to-market eco-routing and eco-driving routing systems to promote less idling and low-emission transport [
16]. Furthermore, telematics data provide a detailed spatial and temporal picture of roads, and that can be used to develop smart platforms as a part of the Internet of Things (IoT), Internet of Vehicles (IoV) and the development of autonomous vehicles.
Currently, no report in the literature provides a detailed review of the wide applications of vehicle telematics data in urban transport. The challenges ahead of the telematics market include data collection methods, the online collection and compilation of the data, data storage, legal issues, etc., and these aspects have not been sufficiently reviewed prior to this paper. In addition, the potential applications of vehicle telematics data in urban mobility and urban transport studies, as well as driving behaviour analysis, have not previously been reviewed.
Hence, this review paper assesses the current and potential contribution of telematics data to different aspects of sustainable road transport. We review the literature on the use of vehicle telematics data in driving behaviour assessments, analysing urban mobility, making roads and journeys safer, creating more efficient and reliable ITSs, developing urban freight logistics and, finally, moving towards safer, cleaner and cheaper driving. We also review the literature on the profound applications of vehicle telematics data in advanced transport technologies such as eco-routing services, traffic-light-to-vehicle communication (TLVC), vehicle-to-everything (V2X) communication, smart car parks, cooperative adaptive cruise control (CACC) systems, etc.
The paper is organised as follows.
Section 2 provides the literature review methodology.
Section 3 summarises the different collection methods of telematics data and the main challenges ahead for the telematics market. The application of telematics data to provide detailed driving behaviour statistics of a population of motorists is discussed in
Section 4. The role of telematics data in building a safer road network is outlined in
Section 5. The applications of telematics data in developing reliable and accurate ITSs, traffic flow maps and other smart urban platforms are investigated in
Section 6. The potential role of telematics data in moving towards a cleaner and more economical transport system is reviewed in
Section 7. Future research directions are itemised in
Section 8, and conclusions are provided in
Section 9.
2. Literature Review Methodology
The PRISMA method was used to identify the potential research content to review [
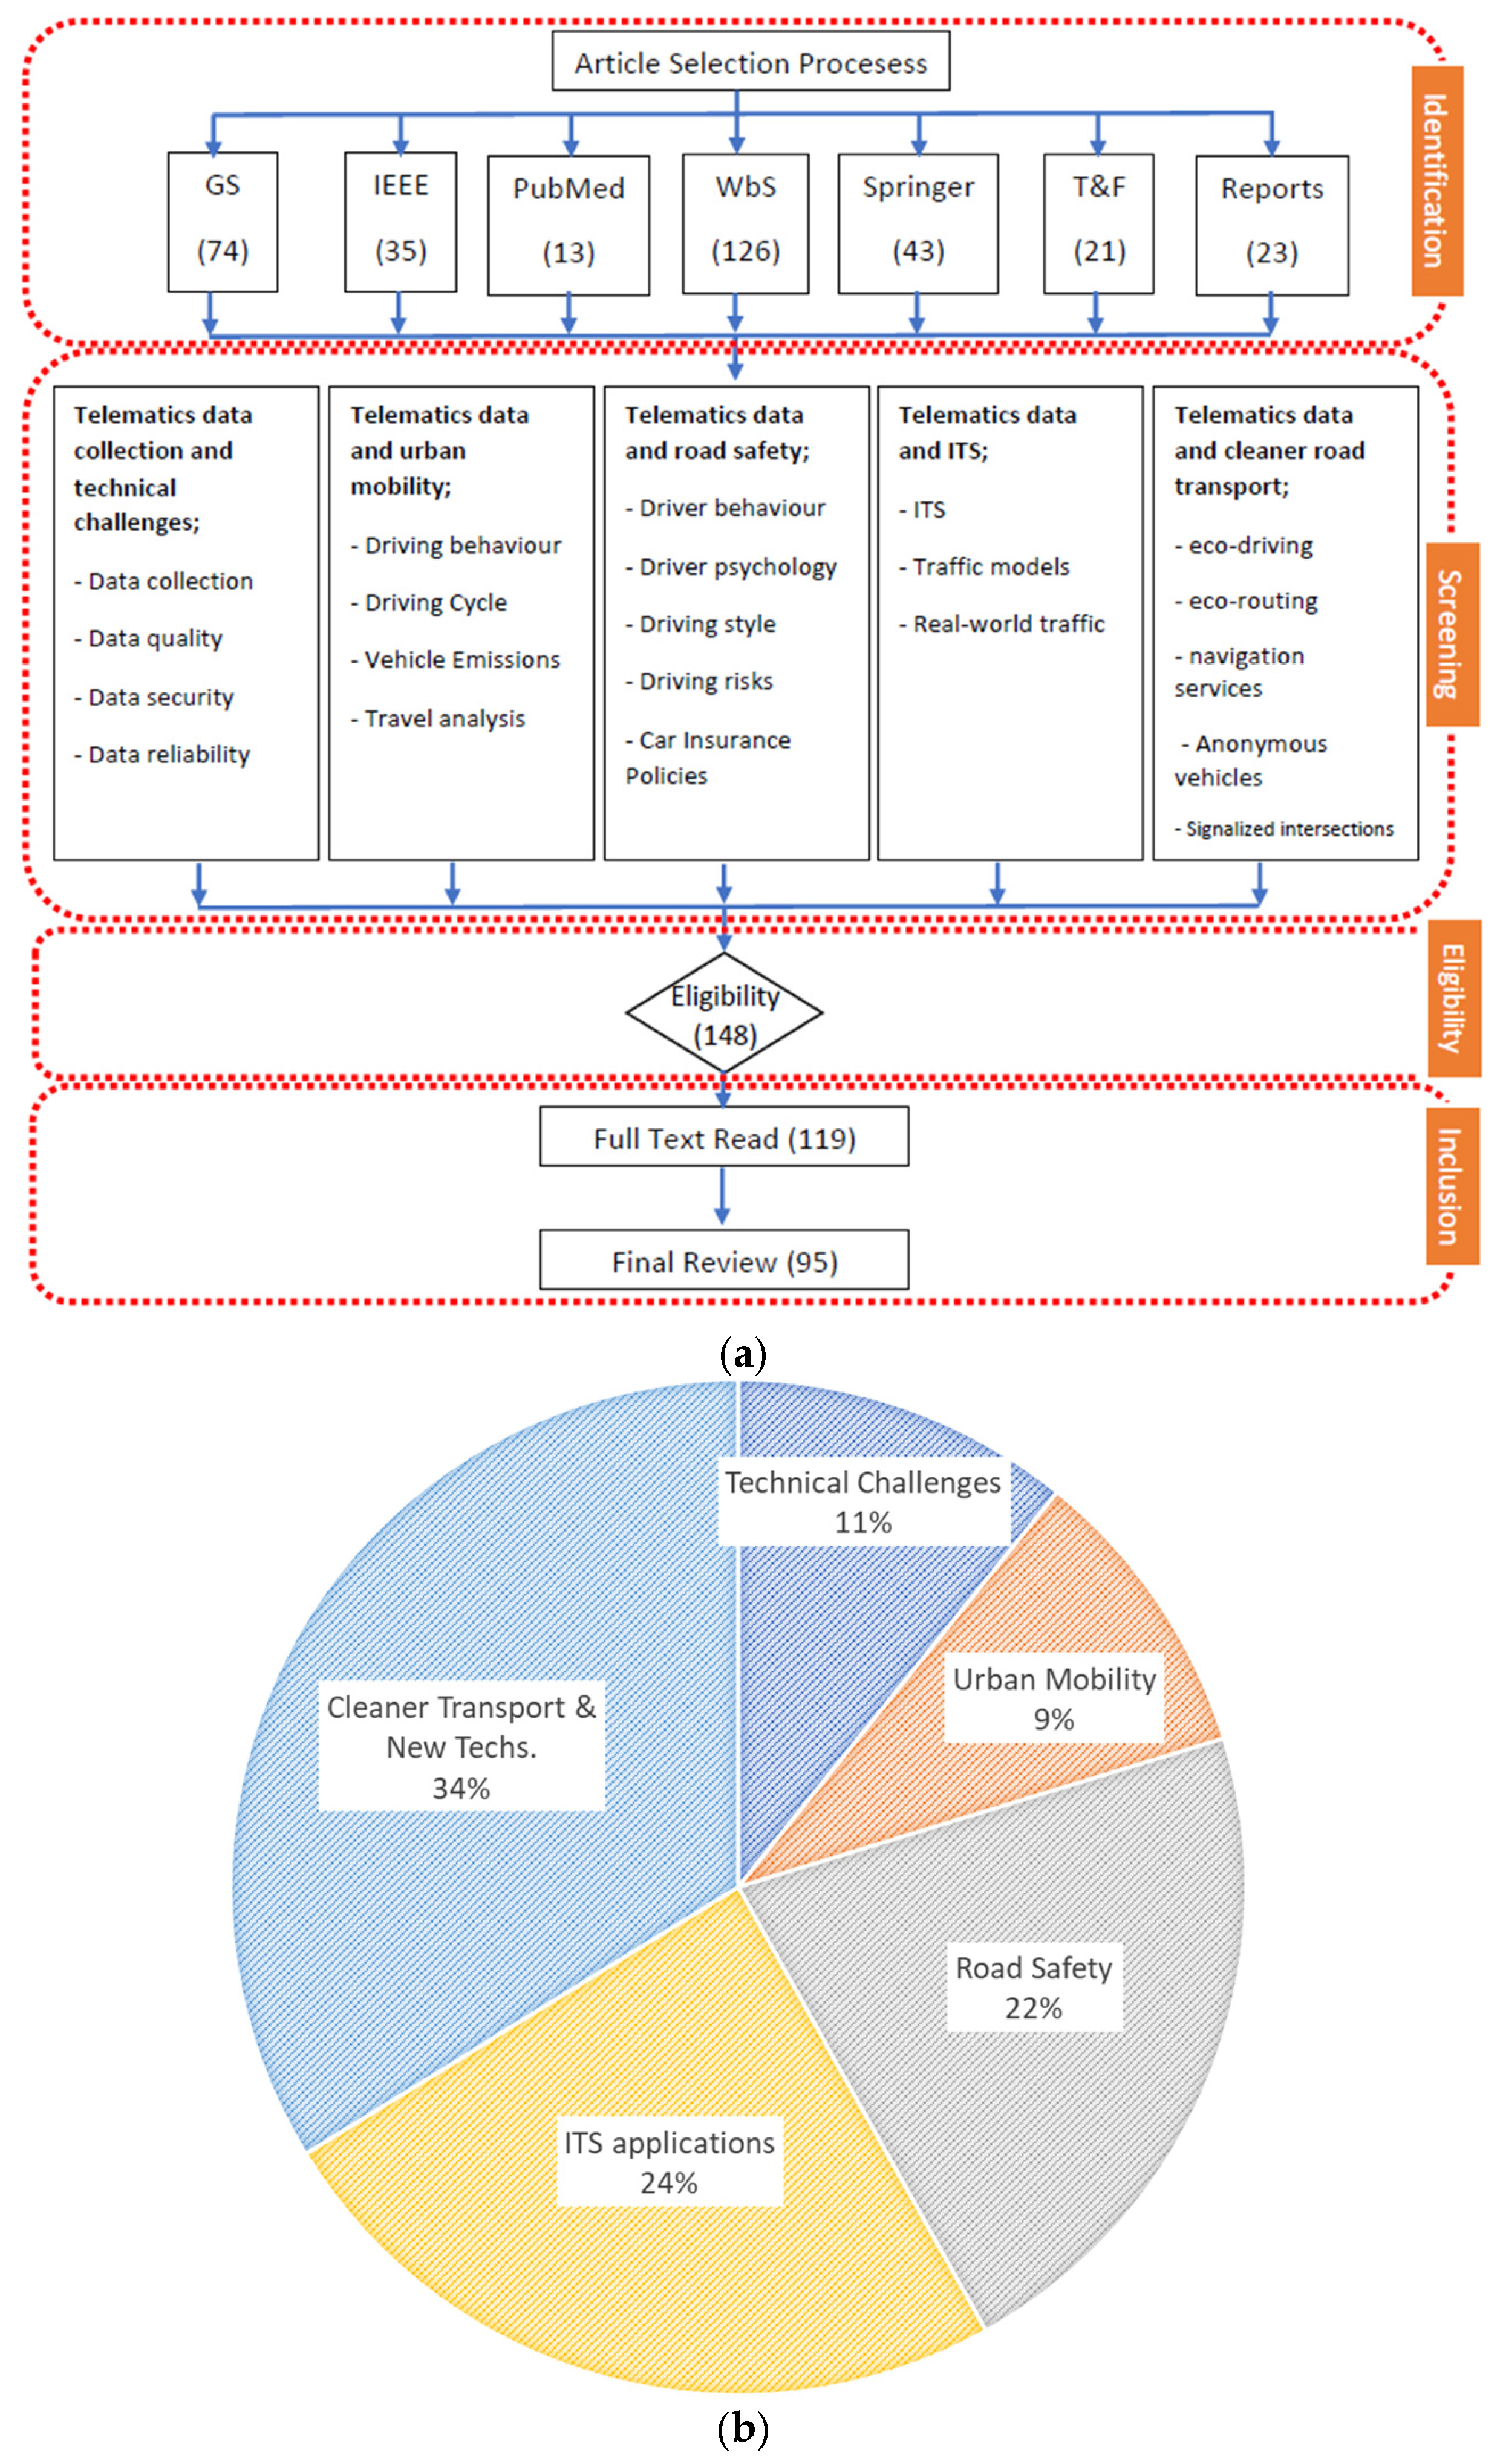
17]. The PRISMA method has four steps for the identification, screening, eligibility and inclusion of research materials, which are represented in
Figure 1a. For the first step, six literature datasets were used: Google Scholar, IEEE Xplore Library, PubMed, Web of Science, Springer and Taylor & Francis. A combination of search terms was used, consisting of {telematics data, GPS, GPS-connected vehicles} and {urban mobility, transport, driving behaviour, road safety, vehicle insurance, driving cycle, driving psychology, ITS, positioning, data communication, data security, data regulations, data quality}. At this initial step, 335 articles were identified. For the next step of screening, areas of interest were determined and assessed by meticulously reviewing each selected paper. The areas of interest, which are shown in
Figure 1a, covered a wide range of the application of telematics data in road transport, such as technical challenges ahead of the telematics market, urban mobility analysis using telematics data, road safety, ITS, new advanced road technologies and the role of technologies. The number of preliminary selected papers was reduced by screening the article title and abstract for relevance and quality. Most papers were removed due to their subject matter being unrelated to the study objectives. This screening removed 187 data sources.
The full text of papers that passed initial screening was reviewed if papers were: (1) published in English, (2) published or accepted for publication in a peer-reviewed journal and refereed conference proceedings, (3) official reports published by international organisations such as World Health Organization (WHO) or World Bank. Duplicates were also removed. Ultimately, 119 papers were left for full-text reading, and their contents were summarised, reviewed and, if still relevant, described within the body of this review. The final number of papers reviewed in this paper was 95 papers. The reviewed papers are browsed in five areas of telematics data collection and technical challenges, the application of telematics data in driving behaviour and urban mobility studies, the application of telematics data in road safety, the application of telematics data to improve the functionality of intelligent transport systems (ITS) and the contribution of telematics data to moving toward cleaner transport and also new advanced technologies. The contribution of the reviewed articles to the studied subjects is represented in
Figure 1b. A total of 34% of the reviewed articles studied the role of vehicle telematics data in moving toward cleaner road transport and also advanced transport road technologies.
3. Telematics Data Collection and Technical Challenges
Telematics data are collected using a variety of devices, including black boxes, onboard diagnostic (OBD) devices, 12 V plugin devices, original equipment manufacturer (OEM), tachographs and driver smartphones [
18]. Data are collected in support of several markets, including fleet management and the insurance sector. The data are usually used directly, for example, to monitor behaviour over a particular journey, but can also be aggregated to provide new insights and solutions for mobility-related problems. Telematics data has rapidly become an asset for evaluating driving behaviour within macro- and micro-scale traffic interventions, including low emission zones (LEZs), clean air zones (CAZs) and low-traffic neighbourhoods (LTNs).
There are some concerns about the degree to which the aggregated data can be representative of the total fleet population. For example, drivers that are monitored for insurance purposes might drive at slower speeds and with fewer harsh accelerations than if they were unmonitored to reduce the cost of their insurance premia. This is a manifestation of the so-called Hawthorne effect [
19]. However, it has been evidenced that the Hawthorn effect is short-lived, as it typically only takes 2–4 weeks for drivers to revert to their normal behaviours, which suggests that most tracked drivers are not influenced significantly by the tracking itself [
19]. The fact remains that insurers still observe a wide range of behaviours, including consistent use of bad driving practices by some drivers. There is also the possibility that the monitored population has different demographics compared to the overall population, particularly because insurers will target telematics towards those groups at higher risk of being involved in a crash. The rapid advancement in telecommunication technologies means that other, more passive telematics monitoring, such as those provided by triangulating the driver’s position using 5G cell phone towers or GPS devices installed by car manufacturers, may soon be able to address these concerns. Regardless of these sources of bias, telematics data can provide new insights into urban mobility, particularly during heavily trafficked periods when both monitored and unmonitored drivers should flow through the traffic at the same speeds and accelerations. Indeed, some routing services, for example, Google Maps, Waze and Citymapper, are now using such raw data in their estimations. For example, Google used telematics data to assess the response of urban mobility toward the COVID-19 pandemic in many cities across the globe; see [
20].
Although telematics technologies were initially designed for on-road vehicles, many urban features (traffic lights, trees, buildings, etc.) can become useful sources of telematics data once connected to the internet-of-things (IoT), with the ability to communicate their positional information to cloud-based servers. For example, a car park space can continuously report its live occupancy status to the cloud to aid driver decisions. We review some applications of telematics data in smart cities, such as signalised intersections, smart car parks, vehicle-to-vehicle (V2V) and even vehicle-to-everything (V2E) communication, in the next section. Connecting moving and static urban features will generate vast volumes of telematics data. The integration of these different sources of telematics data will also require developments in the field of cloud computing, the future internet, big data management and modern mobile platforms.
The ability to apply telematics data to solve problems will only be as strong as the quality and integrity of the positional data. Common sources of GPS errors include signal loss from satellite line-of-sight occlusions (e.g., a tunnel or urban canyon), extraneous data points (outliers), speed drifting and signal white noise. Technical solutions to each of these error types have been proposed by many previous investigators; see, for example, [
21]. Meanwhile, the large volume of users and their associated devices will challenge the ability of the network to reliably communicate the data [
22]. However, this technological constraint will likely be addressed by the next generation of communication architectures to satisfy the requirements of fifth-generation (5G) mobile network applications [
22].
Nearly all available telematics providers store data in the internal storage of the device until they can transmit it. Processing of the data is then completed downstream of data capture, which means setting up centralised data management centres or cloud-based centres. The complexity of telematics data coupled with intermittent or low bandwidth data transmission leads to slow data processing [
23]. Although edge computing seems to be a wise solution for such technical challenges, there are some debates about its application in the telematics market. Edge computing uses a distributed infrastructure in which applications perform computing and data storage closer to where they need to be, thereby reducing the amount of data transferred to the cloud, which improves response time and saves bandwidth [
23,
24]. The reasons to not process on edge nodes are often to control IP, security and certainty on the processing being done to prevent adverse disinformation created on modified endpoints [
24]. The pace of advancement in edge computing R&D provides promise for the telematics market to achieve real-world processing on a large scale in the near future; see, for example, the review of [
25].
Providing robust data security is a major challenge in telematics technologies. Telemetry that contains the location and mobility of individuals, if not suitably restricted, can be used for exploitative purposes. The EU general data protection regulation (GDPR) has been in force since May 2018 [
26]. GDPR provides important guidance on how to obtain a fair balance between the interests of telecommunication providers and users. However, although significant technical and legal attempts have been conducted to simultaneously assure data accuracy, protect the user’s privacy and keep the servers safe, there are still important problems to be solved. Technical aspects of telecommunications and network security are reviewed by [
27]. They discuss network architecture and design, network devices and protocols to achieve secure communications.
As was seen above, despite the pace of advancement in data collection and data science, online vehicle telematics data still has some technical and legal challenges, especially in edge computing, IP protection and GDPR relevance concerns.
4. Telematics Data to Deepen Understanding of Urban Mobility
According to the World Bank, urban mobility is the process of ‘moving people from one location to another location within or between urban areas’ [
28]. Before 2010, urban mobility was usually described in terms of the average speed, the volume of traffic flow, and the time of travel over the street networks. For the past decade, the definition of urban mobility has been expanded to include further social, economic, transport and environmental aspects. This has considered human behaviour, vehicular emissions, travel demand, travel capacity and access to public transportation. As will be seen below, telematics data can deepen the existing understanding of urban mobility in many dimensions and aspects. Here, we review the potential role of vehicle telematics data in broadening the knowledge of driving behaviour across urban environments.
Human behaviour, when considered through the lens of vehicle behaviour when driven by humans, plays a vital role in all aspects of sustainable transport. Behaviour is studied using either kinematics or contextual approaches. Whilst the former is a cumulative approach that investigates the driving behaviour of a population of vehicles in urban street networks, the latter concentrates on the driving styles, actions, reactions and responses of individual drivers. The kinematics and contextual approaches are usually employed to support emission and road safety studies, respectively. The first approach is discussed in this section, and the latter one will be reviewed in
Section 4.
The kinematic approach is typically conducted using so-called ‘driving cycles’ (DCs) for a particular region or route. DCs are primarily designed to characterise typical journey patterns and extents of operation for different transport modes. They support the compliance testing of road vehicles. DCs are speed-time profiles that describe standard vehicle behaviour over a specified region or route of interest. Several driving behaviour characteristics, such as the proportion of journey time spent in a state of acceleration, deceleration, cruising or idling, can be estimated using DCs. These parameters are particularly important for accurately estimating vehicular emissions and the social habits within the studied area. For example, [
29] used the DC of light-duty vehicles in the city of Isfahan, Iran, to discuss the impact of unsustainable urbanisation on driving behaviour and the resulting vehicular emissions. Results showed that unsustainable urbanisation increases the production of nitrogen oxides (NO
x) through exhaust emissions from vehicles in Isfahan by 57% compared with the same vehicles moving over Beijing, China. DCs are also used in vehicular emission laboratories to estimate brand-new vehicle emissions under real-world conditions [
30], where they are considered trustworthy tools by automotive manufacturers to provide a long-term basis for design, tooling and marketing [
31,
32]. DCs are developed using the instantaneous speed-time data collected from the streets of the city and so reflect valuable information about urban transport, including time of travel, the number of stops, congestion and other parameters. Accordingly, they are an essential tool for traffic engineers to design optimised traffic control systems and accurately simulate the flow of traffic; see, for example, [
33].
An example of a speed-time profile of a typical DC, which is developed using the instantaneous speed-time data of a moving vehicle over the streets of the city of Isfahan, Iran, and its derived driving behavioural characteristics are shown in
Figure 2 and
Table 1, respectively. DCs are constructed from a series of ‘micro-trips’, which are defined by the pattern of travel between the consecutive idling. The proportion of journey time spent in a state of acceleration or deceleration is a proxy for the aggressiveness of the drivers, while the amount of time spent idling and cruising can be indicative of the extent to which congestion occurs. In this example, the percentage of time spent idling is larger than the other measured driving characteristics (acceleration, deceleration and cruising), suggesting that the studied area is subject to heavy traffic congestion. Meanwhile, aggressive driving is also observed here through harsh variations in speed-time patterns.
Almost all DC development methods are plagued by the same technical and logistical challenges. DCs are developed using instantaneous speed-time data collected from GPS-connected vehicles moving over a set of streets or a fixed route. The main challenge in developing reliable DCs is achieving adequate sampling to achieve an accurate spatial and temporal representation of normal driving. Data collection from the entire road network within a city, or even smaller areas, is unlikely, mainly due to time and budget constraints. Studies have focused on collecting data over selected routes within studied regions to minimise costs and minimise bias in driving measurement. Although the route selection issue has been addressed by different approaches by preceding investigators, developed DCs do not present detailed spatial resolutions of urban mobility (see, for example, [
29]). In other words, DCs typically have low measurement coverage, which impacts their precision and the extent to which they can represent real-life traffic flow.
The temporal resolution of the data collection approach is another important issue in existing DC development methods. Continuous and extended data collection is impractical because of the high resource and time commitment required by those carrying out the driving. Hence, approaches typically target data collection within certain time schedules, which can cover broad intervals during a particular day, including rush hours and non-rush hours on weekdays and weekends. An example of a schedule of data collection used by [
34] is presented in
Table 2. Sporadic sampling during different intervals without geospatial information only provides a snapshot view of transport behaviours and fails to capture urban mobility in its complete and complex dynamism. Sparse temporal measurement also adds to the risk of biased reporting of behaviour that is not representative of true traffic behaviour. Conversely, the estimations of annual average DC can fail to capture the intricacies of different external factors on urban mobility, for example, festivals, school term times, large sporting events, seasonal behaviour changes, impacts of adverse weather and other mitigations, such as those introduced to help reduce the spread of COVID-19. To sum up, DCs and DC-based calculations cannot provide a detailed and reliable picture of complete urban mobility.
Telematics data can address many of the challenges of evaluating driving behaviour over a study area. It can provide detailed speed-time data covering an entire city rather than specific routes targeted by DCs. Also, data can be aggregated over specific time frames over extended periods to ensure representative measurements, thereby removing sampling biases seen in prior approaches. This is supported by existing telematics products gathering data containing instantaneous position and speed data of a significant percentage of the fleet over the entire road network at different times. Such products use sensors and telecommunication technologies to collate driving behavioural data that could be used to understand localised driving behaviours. To ensure data privacy and protection, telematics data must be anonymised and aggregated. Data can be aggregated by the road network location to provide a segment-based approach representing all parts of the road network. Aggregated data can include parameters such as average speed and other driving characteristics to support the understanding of traffic behaviour. The average speed and acceleration estimates for each road segment can then be translated into geographically specific vehicular emissions, thereby allowing for highly detailed spatial and temporal distributions of the average speed, vehicular emissions, and driving behaviour characteristics over all parts of the network in a studied area. An example of using telematics data to explore urban mobility and transport measures is illustrated in
Figure 3, which uses a part of the city of Birmingham, UK, from 9–11 a.m. on Mondays in 2016.
As can be seen above, vehicle telematics data can provide a detailed picture of several aspects of urban mobility, such as the annual average speed, percent time of acceleration and exhaustive CO2 emission over the street network. With this approach, driving characteristics and vehicular emissions might be considered urban geographic features and analysed in geospatial frameworks. Many other parameters, such as the proportion of time spent on accelerating, decelerating, the number of stops, kinematic energy, etc., could be assessed with this approach. In other words, telematics data can significantly deepen our insights into driving behaviour and vehicular emissions and the role of these factors within sustainable urban transport.
5. Telematics Data to Build Safer Roads
Road accidents cause over 1.35 million deaths per year [
3]. In particular, transport accidents are a major global cause of death among those aged 5 to 29 [
35]. Many factors have been attributed to causing these vehicle-related incidents, but contextual aspects of driving behaviour and human errors are always ranked as leading contributors to such incidences across the globe; see, for example, [
36].
Driving behaviour is called by various names, such as driving style, driving pattern, traffic psychology and driver heterogeneity, while the difference is not just semantics but also the context in which they appear [
37]. For example, ‘driver heterogeneity’ is used in the literature concerning traffic simulation, while ‘driving style’ is the favoured term for traffic psychologists [
37]. The first systematic and contextual studies on driving behaviour date back to at least the 1950s. Ref. [
38] conducted a research program in the field of highway safety using both in-vehicle observers and instruments. Ref. [
39] also applied in-vehicle instruments to analyse a driver’s physiological responses to traffic events. With the advancement in telecommunication technologies, contextual studies have been further developed. Telematics data have been used to study driving behaviour in terms of driving style, driver habits, actions, reactions, etc., and to assess the impacts of different demographic factors, such as age, driving experience and local GDP, on an individual’s driving. For instance, Ref. [
40] employed telematics data to investigate the effect of the distance travelled on the risk of accidents among young drivers; the role of gender was also analysed. The impact of distance travelled and driving time was also analysed by [
41] using telematics data, whereby their results suggest that these factors should be included within rating systems of driving behaviour. Refs. [
42,
43] consider these characteristics in addition to the other available risk factors, such as the percentage of distance driven above speed limits, the distances travelled in urban areas and the distance travelled during the night, to evaluate the major individual contributors to car crashes.
Telematics data were also employed to characterise the role of behavioural risk factors such as driving habits, driving style, exposure time, etc., in road safety. For example, Ref. [
44] employs these behavioural characteristics to design a new insurance pricing model. Ref. [
45] used telematics data from 1600 vehicles to extract exposure metrics from location trajectories and examine several multivariate logistics regression models. Ref. [
46] proposed a practical methodology for studying the risk factor of driving habits and driving style using three months of telematics data. Ref. [
47] used telematics data collected from mobile phones of a hundred vehicles to analyse driver behaviours and characterise driver behaviour according to driving events. They analysed many driving events, such as acceleration/deceleration/braking/cornering events, duration of mobile phone usage, etc., to score the behaviour of drivers.
The contextual features of driving behaviour can be used in motor insurance policies and motor insurance pricing systems and services. Motor insurance, which is informed by telematics, can be used as a risk reduction tool by obliging or encouraging drivers to consent to direct monitoring of risky driving behaviours [
48]. Telematics data brought about a revolution in the insurance market, where new information about driving behaviour could be incorporated into the calculation of vehicle insurance premia [
49]. Many insurance companies worldwide have developed user-based insurance (UBI) programmes, in which insurance premia are informed by measured driver behaviour obtained from telematics data. UBI programmes have been developed, initially as extensions to anti-theft devices reporting vehicle locations, where speeds and extreme behaviours could be measured. Early behavioural models, often termed ‘pay-as-you-drive’ (PAYD) models, broadly aimed to distinguish between higher and lower-risk drivers by enabling quantitative assessment of the driving behaviour of civilian drivers [
50]. These approaches have significantly advanced an individualised understanding of risk through new forms of dynamic insurance pricing, often termed ‘pay-how-you-drive’ (PHYD). In a PHYD model, insurance pricing can be adjusted based on post-trip (or periodic) analysis for levels of exposed risk from journeys and the driver behaviour providing discounts or pricing adjustments to lower-risk drivers. The evolution of driver behavioural models also facilitates driver education and feedback to not just monitor but also actively encourage positive driving changes, e.g., driving less, driving safer or even improving their driving habits, such as reducing the number of harsh braking and acceleration events [
51]. Positive outcomes of UBI programmes include reductions in annual travel distances and positive impacts upon socio-economic challenges, such as traffic congestion, fuel economy and air quality [
18].
According to the contents reviewed above, a key role for telematics is in designing fairer insurance premia and reducing incidences of accidents across urban roads.
6. Telematics Data to Develop Intelligent Transport Systems (ITSs)
Traffic congestion is a significant problem disrupting daily urban life. Over the decades, the number of on-road vehicles has rapidly increased, and many metropolitan areas have overcrowded their streets with moving and parked vehicles. Using informatics and telecommunications to reduce traffic congestion and better management of road systems dates back to the 1980s and 1990s [
52]. Advanced transport telematics (ATTs), which were designed to improve the performance of the transport sector by focusing on behavioural changes of travellers as a result of a better provision of road information, became a chief constituent of the ICT sector [
52,
53]. With additional technological breakthroughs, new generations of transport management systems entitled intelligent transport systems (ITSs) have been introduced in the sector. ITSs are referred to as the entire technologies, services and urban planning systems that improve safety, productivity, effectiveness, efficiency, accessibility and, therefore, sustainability in transportation [
54]. They are one of the most promising approaches to effectively address urban congestion [
55]. It has been argued that applying ITSs in metropolitan environments could improve street throughput and road traffic safety by 20–25% and 40–80%, respectively [
56,
57,
58]. These intelligent systems are playing an ever-greater role in increasing the efficiency of public and private transport, improving the driving experience and making contributions to road safety and reductions in vehicular energy consumption and road emissions.
Whilst rich countries are developing their fixed infrastructure ITS programs, the future for ITSs in less developed countries is less clear because of logistical and other sociodemographic factors, such as a lack of efficient road infrastructures, high rate of accidents, poor telecommunications between the road users/features and many others [
59]. However, the development of ITSs in high-income countries also faces financial and technical challenges. ITSs require new and costly infrastructure, which hinders the appearance and survival of innovative private-sector solutions to the market. Within current academic research, there is a strong emphasis on the introduction of new types of ITS services (e.g., traffic information, route planning) relying on information coming from urban mobility. However, despite the many potential advantages of ITSs/ATTs and significant investments by both public and private sectors in R&D projects and pilot studies since the 1980s, the ITS market has so far failed to flourish as expected [
58,
59].
An ITS is constructed on the interface between on-road vehicles and road networks to ensure the former makes the most efficient and rational use of the latter. Hence, the lack of sufficient development in both the smart vehicles and intelligent networks aspects of ITSs, might be considered the underlying reason for such market failure. Telematics data has the potential to invigorate ITSs. Telematics can strengthen urban facility management, improve the quality of urban services, meet the various requirements of the citizens and promote the intelligent and sustainable growth of the city [
60,
61]. Telematics data, in the context of ITS, could be also used to train deep learning models, such as convolutional neural networks (CNN) and (deep) reinforcement learning, to make a better transportation system through optimisation with resect to travel time, traffic jams, timely updates of smart traffic signs to better prevent accidents and for better traffic management to reduce traffic congestion and pollution; see, for example, [
62].
An accurate and detailed understanding of the prevailing traffic state in terms of flow, speed and density is essential for real-world ITSs applications. Hence, a wide body of research has been reported on various methods and techniques for developing and enhancing traffic flow models for the past four decades; see, for example, [
63]. Almost all deployed models use a mixture of traffic survey approaches alongside fixed-point traffic data sensors to build and validate models. Traffic surveys are usually expensive and minimally deployed, whilst fixed-point sensors are deployed only at limited locations. It has been argued that Lagrangian approaches, which are constructed on the coordinates moving with the vehicle streams, are more efficient and accurate for traffic flow models than Eulerian approaches, which look through the road cross-section in space-time coordinates [
64]. However, the former approach needs detailed instantaneous positions of on-road vehicles. With the recent advancements in telecommunication technologies and the introduction of connected vehicles, a new era has been initiated in the measurements, estimations and modelling of traffic characteristics [
65]. On-road speed-time data collected from one or more GPS-equipped vehicles is an asset in estimating the average speed of traffic flow in different road links of the city. Few research attempts have been designed to translate real-world speed-time data into the traffic flow for each road link. For instance, Ref. [
66] developed a method for providing the volume-related variables, including the flow, speed and density of traffic, using the position data of a GPS-equipped vehicle moving over a certain route in Tokyo, Japan. Ref. [
67] employed a second-order phase transition model (PTM) to incorporate trajectory data of the connected vehicle into the traffic flow map. Their model could also provide a reliable estimation of the driving behaviour characteristics in the studied road links. Ref. [
68] used a macroscopic model-based approach for the estimation of the speed and density of the traffic state. They applied the data of both connected vehicles and spot sensors and could provide an accurate picture of traffic density and speed. Ref. [
69] developed a new method to translate the average speed of a road link estimated by the connected vehicles to the traffic flow using the flow measurements provided by the traffic spot sensors. The traffic measurements were provided for the morning and evening rush hours, and Ref. [
69] investigated the potential bias between the data of connected vehicles and traffic flow measurements to estimate the traffic flow and density in the non-rush hours of the day. Ref. [
70] provide detailed traffic flow information through the use of telematics data collected from the smartphones of drivers.
All these abovementioned methods are constructed using vehicle telematics data collected from connected vehicles or objects. The reviewed articles above show that this data is valuable in developing accurate and reliable ITSs and also traffic flow maps within urban environments.
7. Telematics Data to Support Low-Emission and Carbon-Free Transport
Telematics data provides kinematic driving behaviour data of on-road vehicles, which can be used to design dynamic strategies for simultaneously reducing fuel consumption and air pollution emissions. The ‘best route’ to any location can be considered in terms of many competing metrics, such as the fastest, shortest, safest, most direct, least complex, cheapest and cleanest route. The fastest route may not always be the best decision in terms of fuel consumption and environmental impacts. Ref. [
71] employed microscopic and macroscopic emission estimation tools as well as the speed-time data of on-road vehicles to quantify the impact of route choice on fuel consumption and other environmental considerations. In this study, they considered different routes for commuting over a start/end destination pair in the Northern Virginia area, US, and observed that spending more time travelling by choosing longer routes with better traffic conditions could save approximately 20% of fuel over each journey.
During the last two decades, route selection, navigation services, and eco-routing have shown potential for enhancing on-road vehicle fuel efficiency. The published evidence argues that eco-routing could save 12–33% of consumed fuel [
16,
72]. Ref. [
73] employed advanced navigation systems to develop a novel eco-routing system. They used real-time traffic congestion information and geographic characteristics of the road network, such as the slope of each road, to provide the shortest distance and shortest duration route with minimum fuel consumption. Results show that the overall fuel economy of travelling along a flat route is superior to that of a sloping route by approximately 15 to 20% for light-duty vehicles, whereas the expected value could be much bigger for heavier vehicles. Moreover, the fuel economy improvements obtained by using their system ranged from 8.7–42.2%, dependent on traffic conditions. It is worth noting that most of the available navigation systems were designed and developed based on the spatial distribution of vehicle average speeds over street networks, whilst other kinematic driving characteristics such as the proportion of time spent braking, acceleration-deceleration, etc., are not used. The lack of detailed online spatial distributions of kinematic driving characteristics is the main drawback of traditional navigation systems. Meanwhile, the fuel consumption is usually estimated using the distribution of vehicle-specific power (VSP) [
74], which is a speed-acceleration function. Hence, the traditional average-speed-based navigation services are unable to provide a reliable estimation of the fuel consumed in a successful journey.
Recent advancements in telematics technologies could improve the capability and accuracy of the existing navigation services and create breakthroughs in the development of new-to-market fuel-saving navigation services [
75]. Through telematics technologies, the accuracy, credibility and reliability of urban ITSs could be considerably enhanced (see
Section 5) which would directly result in inventing, designing, and developing new technologies for saving fuel and reducing vehicle emissions. Traffic-light-to-vehicle communication (TLVC) as a part of vehicle-to-everything (V2X) communication is one such approach with great potential. V2X communications are usually included the communications between vehicle-to-network (V2N), vehicle-to-infrastructure (V2I), vehicle-to-vehicle (V2V), vehicle-to-cloud (V2C), vehicle-to-pedestrian (V2P), vehicle to the device (V2D) and vehicle to grid (V2G).
Within TLVC, the traffic light broadcasts its scheduling information over a wireless medium to vehicles in its vicinity. From this information, vehicles can compute the required speed to hit a green light and offer this information to their drivers, who can, in turn, adapt their speed accordingly [
23]. With more advances in telematics technologies, it could be expected that eco-routing will be employed based on not only TLVC, driving and traffic conditions but also vehicle-to-vehicle communications in terms of the internet of things (IoT) technologies [
76]. However, most of those efforts are under R&D status, and there are still considerable uncertainties around their real-world efficacies.
Promoting more environmentally friendly driving practices (eco-driving) is one of the most promising avenues for reducing vehicle emissions in the short to medium term. Eco-driving is a collection of driver-led actions and decisions that influence fuel economy [
77]. With the recent and future advancements in telematics technologies and services, the traditional concept of eco-driving might be upgraded into ‘dynamic eco-driving’ [
78]. First, telematics data and technologies could provide detailed, real-time and even online traffic flow distributions within the urban environment; see
Section 4. Then, the connected or autonomous vehicles could take advantage of real-time traffic sensing and infrastructure information to drive with lower amounts of fuel consumption and vehicle emissions. Dynamic eco-driving would allow individual vehicles to plan their velocity trajectories before they approach an intersection, thereby improving energy and environmental efficiencies by a factor of 5 to 20% [
79,
80]. Ref. [
79] studied the influence of dynamic eco-driving in an arterial corridor. They simulate a situation during which the vehicle is provided with the timing information of its closest traffic light and then adjusts its velocity while travelling through a signalised corridor. Their results show an initial fuel economy and CO
2 emission reduction of around 12%. Ref. [
81] studied the impact of telematics data on avoiding phantom jams—traffic caused by flawed driving behaviour of road users under metastable traffic conditions in the absence of a physical bottleneck—and observed a significant reduction in the number and weight of phantom jams after deployment of in-vehicle network devices.
Telematics data and technologies could also grant access to new services in the (‘eco-’) driving of on-road vehicles. For instance, with the developments of telematics-IoT technologies, smart devices could communicate with vehicles, analyse the past actions/reactions of the driver and propose new suggestions for projected upcoming events [
82]. Navigation services could also perform their estimations based on the passenger’s travel time demands. Access to detailed real-time traffic flow maps would allow new algorithms to practically predict expected travel time for environmentally friendly and safe driving [
83]. Car parking is another issue that could be addressed by telematics data and technologies. In crowded metropolitan areas, the time spent by drivers searching for vacant parking facilities can cause notable traffic congestion, additional fuel consumption, and more vehicle pollution [
84]. New telematics technologies could optimise the utilisation of available parking resources, increase ease of road-user orientation in multi-storey car parks when searching for free and accessible parking spaces, decrease traffic congestion caused by both vehicles searching for parking spaces and congestion caused by traffic routing and so reduce hazard emissions and fuel consumption [
85]. Telematics solutions could also assist fleet managers to optimise their workforce productivity, improve maintenance scheduling and even monitor driver behaviour to reduce fuel consumption and insurance costs and manage total expenses [
11]. Although there is considerable potential and usage for applying telematics data in fleet logistic support and control policy schemes, only a few studies have been conducted on these subjects. For example, Ref. [
86] studied the role of telematics data in designing new control scheme policies. Results show that urban freight telematics-based policies can reduce fuel consumption by 20%.
Along with these advanced technologies, there is also widespread worldwide interest in driver assistance systems such as cooperative adaptive cruise control (CACC), which is an extension of the adaptive cruise control (ACC) concept using V2X communications. For example, Ref. [
87] proposes a hybrid stochastic model predictive design approach for CACC in GPS-connected vehicle applications. Their simulations show the efficacy of their proposed control design approach in terms of vehicle safety and emission compared to the existing alternatives in the literature. Ref. [
88] discusses the potential benefits of Eco-CACC in reducing the fuel consumption of gasoline and electric vehicles. [
89] studied the relationship between the penetration rate of vehicles with CACC and three flow performances regarding the level of congestion and road emission. They show the possible effects of CACC on the environment and traffic in the near future are distinguishable. Ref. [
90] studied the relevance of CACC vehicles and on-road emissions within urban environments. They found deterioration impacts of using CACC systems on vehicle emissions and fuel consumption.
This review is finished with a brief review of the role of telematics data in fleet electrification, which is required for future low-emission transport. It is noted that even as vehicles go completely electric with zero-exhaustive emissions, there will still be non-exhaust emissions due to road friction with accompanying resuspension of dust, and there will also still be brake (in vehicles with friction-based braking systems) and tyre wear emissions [
91]. Fleet electrification and electric mobility have been undergoing a rapid increase over the last decade, with the electric vehicle (EV) market expanding fivefold between 2013 and 2020; see [
92]. It is widely argued that eco-driving and eco-routing strategies, discussed in the proceeding sections, as well as smart technologies such as V2V, which can be complemented by telematics data, could significantly affect the energy consumption of EVs [
93]. Meanwhile, telematics data have recently been used in several cities with established clean air zones (CAZ) to initiate novel automatic switching systems. For example, these systems could switch the engines of hybrid electric vehicles to run purely on electric power when they enter into CAZs [
94].
Along with the accelerating fleet electrification, there are growing demands for cost-effective charging stations. Vehicle telematics data might be an important asset for the development of an optimal and cost-effective network of vehicle charging stations. [
95,
96] reviewed the existing literature around optimal design, methods, models, algorithms and future research directions in developing new generations of electric vehicle charging stations.
9. Conclusions
In this paper, the applications of telematics data in various dimensions of sustainable transport have been critically reviewed based on scientific reports, publications and studies. Over 335 different papers, which were aligned with the scope of this review, were considered in terms of their titles and abstracts, and then the contents of the most relevant ones (95 papers) were reviewed and summarised here. The papers were reviewed in five major directions, whereby 11%, 9%, 22%, 24% and 34% of the reviewed papers considered telematics data collection and technical challenges, the application of telematics data in urban mobility studies, road safety, ITS development and cleaner transport and advanced technologies, respectively.
It is found the use of telematics data can greatly enhance the study of kinematics and the contextual aspects of driving behaviour. It is expected that telematics will become an essential component of such methodologies. Telematics data could significantly reduce the existing uncertainties in emission inventory calculations and be used to establish detailed spatio-temporal distributions of kinematics driving characteristics and vehicular emission throughout the road network. It was shown that the developed urban mobility and transport statistics, which were traditionally estimated annually and on the city/region scales, can now be pictured on spatiotemporal frameworks with high spatial and temporal resolutions using telematics-based methods.
Telematics data will also likely help to control contextual driving characteristics, which would reduce car accidents and facilitate progression toward safer roads. Additionally, telematics data will become an increasingly useful asset for insurance companies to improve the accuracy and credibility of their pricing systems and design new insurance policies. It has been shown that telematics data could be employed to aid the shift towards low-emission and carbon-free transportation. It has been widely argued that driving behaviour has a significant role of 20–40% on fuel consumption and so the emission of moving vehicles. Telematics can provide further contextual information on driving characteristics that could lead to eco-driving behaviours, reducing fuel consumption and on-road GHG emissions.
The introduction of new navigation systems linked to eco-routing could also significantly accelerate movement toward cleaner transport. It has been argued that optimised routing services can reduce the fuel consumption of road transport by 12–33%. Telematics data are also essential requirements in urban freight logistic support and the results show that telematics-based policies in the freight transport sector can have a 20% deterioration impact on fuel consumption.
Telematics data are also essential requirements of the new-to-market advanced technologies in smart and resilient cities, including signalised intersections, vehicle-to-vehicle (V2V) communication networks and internet of things (IoT) technologies. Finally, sustained efforts are required to design new methods, algorithms and procedures in addition to establishing new storage, communications and processing technologies, e.g., cloud-based computations, for the expansion of available data science and facilitation of telematics data employment in urban transport.


 ,
, 


