Article

The Pricing Strategy of Digital Content Resources Based on a Stackelberg Game

1
School of Economics, Beijing Technology and Business University, Beijing 100048, China
2
School of Economics and Management, Beijing Information Science & Technology University, Beijing 100192, China
3
Laboratory of Bid Date Decision Making for Green Development, Beijing 100192, China
*
Author to whom correspondence should be addressed.
Sustainability 2022, 14(24), 16525; https://doi.org/10.3390/su142416525
Submission received: 15 November 2022 / Revised: 30 November 2022 / Accepted: 8 December 2022 / Published: 9 December 2022
(This article belongs to the Special Issue Knowledge Management and Sustainability in the Digital Era)

Abstract

:
This paper uses a Stackelberg game model to analyze the profit function composition of digital content resource producers and publishers and uses a numerical simulation method to explore the equilibrium relationships between the various factors that affect the pricing strategy. The findings are as follows: ① platform-based publishers of digital content resources adopt a cost-plus pricing method for a single broadcast price; ② the revenue-sharing ratio of the producers decreases as the single broadcast cost increases; ③ the viewing effect is affected by many factors, such as copyright fees, investment difficulty, sales coefficient, and unit cost. Overall, the main contribution of this manuscript is to make an innovative demonstration and analysis of the factors affecting the pricing strategy of digital content resources, and the results of this paper can promote the transaction of digital content resources and ensure the sustainable development of the digital content industry.

1. Introduction

As an important competitive resource, content resources have always carried the important task of knowledge dissemination. Because of the realistic cultural communication needs of China’s “One Belt, One Road” strategy and the rapid development of the global digital industry [1,2], China’s content resources must be digitally transformed. As the digital content market continues to grow, digital content resources have shown the characteristics of increased quantity, optimized quality, and diverse forms. As the digital content industry is an emerging field, academic research on the pricing mechanism of digital content resources still remains in its infancy. In view of the economic particularity of knowledge resources, they do not conform to the law of diminishing marginal returns. Therefore, traditional pricing strategies and pricing methods are not applicable. We need to explore the key factors that affect the pricing of digital content resources.
In the initial stage of digital content resource trading, the “Buy it Now” or expert evaluation pricing method is usually adopted [3,4]. In practice, the Buy-it-Now transaction form is very common. For example, in a patented technology transaction platform, sellers usually ask for prices subjectively. Academic circles believe that such pricing methods lack scientific theoretical support, so they began to study value measurement models based on indicator systems [5]. This model type can identify the relevant factors that affect the total value and then use the entropy method, analytic hierarchy process, etc. to determine the indicator weights based on expert scoring to simply evaluate the total value of digital content resources. Zhao and Song [6] used this method to conduct qualitative and quantitative research on the total value of TV drama projects from the perspectives of investment and financing. The results showed that the fuzzy comprehensive evaluation method based on expert scoring could effectively determine the indicator weights.
As the demand for digital content resource transactions continues to increase, pricing methods based on platforms or devices have emerged. These include the membership fee of video playback platforms and the bundled price of e-book reading devices [7,8,9,10]. Kort et al. [11] found that many online sellers of digital content products are willing to launch their own mobile devices. In doing so, they can convert traditional wholesaler pricing into revenue-sharing contracts and increase their revenue. Especially when the platform has a large number of digital content products, such as a large amount of online music for group sales, this kind of bundled pricing model is more popular [12,13].
As the demand increases for personalized digital content products and the knowledge-based payment model gains widespread acceptance, pricing methods have gradually emerged that emphasize demand and competition [14,15,16,17]. The bargaining game model is an earlier research method applied in this field. Relevant research mainly focuses on the revenue-sharing ratio and the revenue discount factor [18]. The principal–agent model can more deeply analyze the cooperative relationship between buyers and sellers and can be applied in different market environments (such as a monopoly, an oligopoly, etc.), expanding the pricing practices of digital content products [19,20]. In addition, the auction mechanism [21] is an exploration of the pricing of high-quality digital content products. This method emphasizes the embodiment of demand and competition orientation. As the advantages of supply chain management gradually become more prominent, coordination mechanisms and pricing methods based on supply chains have also begun to be introduced. The current research mostly takes copyright management as the perspective, using the Stackelberg game to determine the best revenue-sharing ratio and equilibrium price of all channel members [22,23,24,25].
In summary, although the existing research explores different levels of the pricing strategy of digital content resources, the analysis of the factors that constitute revenue is not sufficiently comprehensive. It is currently limited to the analysis of factors such as price and the revenue-sharing ratio. Moreover, the analysis is not clear enough of the economic relationships between digital content resource producers and publishers. The research objective of this paper is to describe the profit function of producers and publishers in digital content resource transactions through the Stackelberg game model, take the investment costs, copyright fees, revenue-sharing ratio, and viewing effect into account, and deeply analyze the mutual constraints between these factors in the game equilibrium state, as well as the optimal pricing strategy. The main contribution of this manuscript is to make an innovative demonstration and analysis of the factors (especially the viewing effect) affecting the value of digital content resources, especially the improvement of the sales model. In so doing, it lays a theoretical foundation for accurately portraying the profit function of the game players and opens a direction for exploring a reasonable pricing strategy for digital content resources.
The rest of this manuscript is structured as follows. Section 2 presents the analysis of the related factors affecting the pricing of digital content resources. Section 3 proposes the hypotheses and presents the construction and equilibrium analysis of the Stackelberg game model and the results. Section 4 presents the simulation analysis of the influencing factors of digital content resource revenue and the discussion. Section 5 concludes the manuscript. Section 6 presents the limitations and future recommendations.

2. Analysis of the Factors Affecting the Pricing of Digital Content Resources

Digital content resources refer to various content resources with clear copyrights that are stored in digital forms, such as video and audio programs (materials), pictures, manuscripts, and commercial data, which are owned by the owner [26]. When exploring the relevant factors that affect the pricing of digital content resources, this manuscript focuses on the analysis of the profit function guided by the price, taking as the scope the profit composition of the transaction entities. The key link in the formation and realization of the profit function is the trading link of the digital content resources, which involves two main bodies: digital content resource producers and publishers. The producers refer to economic entities that produce, manufacture, and process digital content resources and have corresponding copyrights and usage rights, such as online movie producers and self-media people. The publishers refer to economic entities that have certain communication channels and capabilities, such as Tencent Video and Douyin, who obtain the broadcasting rights through purchase or agreement. Based on a literature review and considering the common characteristics of many digital content resources, we summarize the relevant factors affecting the pricing into four categories: viewing effect, copyright fees, investment costs, and revenue-sharing ratio.

2.1. Viewing Effect

As the digital content resource market is continually regulated, users pursue content quality. The viewing effect determines the depth and breadth of content resource dissemination. Generally, the viewing effect is mainly determined by content producers, and it is the core element of the investment and manufacturing process. First, producers determine the viewing effect of the content resources to be produced based on existing experience and ability. Then, they use a certain amount of human, material, and financial resources to achieve the expected effect [27,28]. Kim et al. [29] studied the influence mechanism of the characteristics of digital content resources on their value, traffic, and usage intensity and found that the viewing experience greatly increases the usage intensity. Daniel et al. [30] studied the influence of technological innovation on product prices and found that visualization effects created by media technology can improve the viewing effect and the price. In reality, we often see that the ranking of film ratings is also an evaluation of viewing effects, which can guide the judgment of the value of digital content resources [31,32]. Hu [33] used the data from popular TV series in 2019 for prediction and analysis and found that the broadcast platform, Douban rating, etc., will have an impact on TV series ratings, which will directly affect the revenue of digital content resources. Therefore, the viewing effect plays an important role in realizing value enhancement and is a key factor that reflects the value characteristics of digital content resources.

2.2. Copyright Fees

As people’s awareness of intellectual property protection continually improves and intellectual property protection efforts continue to increase, people pay increased attention to copyright value. Almost all countries have special legal provisions on copyright issues [34]. When academics discuss the value of digital content products, they often use the copyright value as a substitute. For example, when Tang [35] studied the value of information products, she believed that the copyright value accounted for the main part of the total value. Therefore, she replaced the total value with the copyright value of the TV program. Wang et al. [36] summarized the important factors affecting the pricing and found that when digital publications have high transfer costs, they tend to have higher pricing due to consumption lock-in. High transfer costs here mainly refer to the costs incurred during the transfer of copyrights or usage rights. In practice, to obtain broadcasting rights, digital content product publishers negotiate with producers on copyright fees [37]. There are usually two payment methods: a one-time payment of copyright fees or a proportional provision of copyright fees from the investment cost. The latter is usually used along with a revenue-sharing strategy. In short, copyright fees are an important factor to consider when studying pricing strategies [38].

2.3. Investment Costs

Investment costs involve both digital content resource producers and publishers, and the connotations of the two are very different. Among them, the investment costs of the producers are mainly reflected in fixed costs, that is, the sum of all human, material, and financial resources invested in the producing and manufacturing stages to achieve a certain viewing effect for the digital content resources, including the hardware equipment investment, the software resource investment, and the relevant personnel salary. Xia [39] conducted an empirical analysis of multiple linear regression models on the influencing factors of China’s 3D movie box office, and the results confirmed that movie budgets involving fixed equipment investment, cast and crew salaries, technology investment, and other projects are important factors affecting the total box office. In addition to the fixed costs, such as venue equipment and platform construction, the investment costs of the publishers also include variable costs, such as resource consumption, technical support, and personnel services required to broadcast the content resources. These expenses can all be regarded as platform investment costs. Ghazali and Islam [40] used multiple regression and selected non-parametric tests to study the data of 316 films in Malaysia and found that the number of cinemas has an important impact on the box office of films, which also confirms the impact of the investment cost of publishers on film revenue. Therefore, investment costs are an indispensable factor when considering the profit function of digital content resource producers and publishers [41].

2.4. Revenue-Sharing Ratio

Maximizing revenue is the basic principle of designing a pricing strategy. The income scale, which is composed of factors such as price, sales volume, and revenue-sharing ratio, is the main factor in the composition of the profit of the transaction entity. In general, in product revenue accounting, the revenue scale is usually obtained by multiplying price and sales volume. Digital content resources on network platforms can be copied, downloaded, and broadcast unlimited times, and product sales are determined by consumer needs. For producers, the market demand scale for digital content products is difficult to control, but they have a better understanding of the viewing effects and can roughly judge market popularity based on them, thereby predicting demand for digital content products. However, according to the explanation of consumer preferences in economic theory, there is a risk that the estimated number will not meet the expected demand. A similar risk obtains for publishers. At this time, revenue-sharing is a flexible and widely applicable revenue distribution strategy [42,43]. Since both parties to the transaction are rational “economic people”, they will adopt a strategy of proportionally dividing the total revenue based on the pros and cons to evenly share the risks and benefits [44]. Hansser [45] came to this conclusion as early as 2010 in the study of the incentive mechanism of the film industry. He found that the use of revenue-sharing instead of fixed fees would promote a sharp increase in the revenue from film screenings. Canbulut et al. [46] used a game theory model to study the relationship between members of the supply chain and found that revenue-sharing contracts can promote cooperation among members. In practice, movie producers and theater chains divide the total box office according to a certain ratio [37], and video playback platforms pay dividends to self-media people based on total traffic. Therefore, the revenue-sharing ratio has become an important factor in the pricing strategy.

3. Methods and Results

3.1. Basic Assumptions and Construction of the Stackelberg Game Model

According to the theory of supply chain management [47], we have constructed a supply chain relationship including digital content resource producers, publishers, and consumers. The specific process of the Stackelberg game model for the pricing strategy of digital content products is as follows. First, considering the copyright peculiarities of digital content resources, producers have a first-mover advantage and have the power to determine the viewing effect of digital content resources. Therefore, digital content resource producers are leaders in the transaction link, and publishers are followers. Second, digital content resource producers require a certain percentage of the revenue that may be obtained during the dissemination of content resources based on the viewing effect. Finally, digital content resource publishers determine an appropriate unit price based on the above information and their own capabilities. Stackelberg game is a complete information dynamic master-slave game [48]. On the one hand, it can depict the game relationship of supply chain members in different market positions, and on the other hand, the dynamic game reflects the optimal strategy of game players after they make decisions in the former. The equilibrium results of the game can be applied well to real scenarios. It has more advantages than pure strategy games in process analysis. As a result, a complete digital content resource transaction process is formed, as shown in Figure 1.
The basic assumptions of the Stackelberg game model regarding the pricing strategy of digital content products are as follows:
Producers first determine the viewing effect t of the content products. According to it, the investment scale of the digital content products is determined as I = m t 2 / 2 , where m > 0 , and m is any real number, which reflects the investment difficulty coefficient [49]. When the viewing effect is higher, the investment cost to be paid is greater. Because this model adopts a revenue-sharing strategy, the producers put higher revenue expectations on market revenue-sharing. Here, the copyright fee is set as a small part of the revenue source, only to ensure a part of the stable revenue. Therefore, when the producers deliver digital content resources to the publishers, the copyright fee is denoted by μ I , μ 0 , 1 , which is accrued according to the investment scale to offset part of the investment expenditure. μ is the copyright fees coefficient, which can be a critical value. If the producers are extremely optimistic about the demand for content resources in the market, to stimulate the enthusiasm of the content resource publishers, they may not charge copyright fees and share only the total revenue. If the producers are not optimistic about the market revenue of content resources, they may charge higher copyright fees. In this way, the variable income of the producers is derived from the share of the total revenue obtained by putting digital content resources on the market. Assume that the revenue-sharing ratio obtained by the producers is α , α 0 , 1 . At this time, the producers can choose not to share and rely only on the copyright fees to deduct the investment cost, but they can never exclusively enjoy the total revenue. Therefore, the range of the revenue-sharing ratio is 0 , 1 .
Suppose the publishers determine the single broadcast price of the digital content resource as p , that is, the unit price. The sales model draws on and improves the research results of Wu et al. [50] on the sales model of digital knowledge products. Suppose the total sales volume is Q = δ e p · ln t + 1 , and δ is the constant coefficient of the sales model, which satisfies δ > 0 . It reflects the combined effect of the price and viewing effect influence factors, and it includes the sum of all influences that can cause changes in sales. At the same time, the sales model reflects the applicable characteristics of digital content resources. The negative index effect of the price reflects the downward trend in demand caused by price changes. However, considering the particularity of the content products, the consumers’ sensitivity to the price is only valid within a certain range. When the price is too high, the consumers’ sensitivity to the price does not change much. The logarithmic function passing through the origin reflects the positive influence of the viewing effect on sales. Within a certain range, sales will increase rapidly as the viewing effect increases. Similarly, based on considerations such as the number of users and the scope of communication, the impact should change within a certain range and will not increase indefinitely. Therefore, the total revenue is R = p · Q = p · δ e p · ln t + 1 . Since the revenue-sharing ratio obtained by the producers is α , α 0 , 1 , that obtained by the publishers is 1 α . In addition, it is assumed that the unit cost that the publishers need to pay when the content resource is broadcast is c 0 , and it satisfies 0 < c 0 < p . The unit cost includes fixed and variable costs that are evenly amortized to a single broadcast during the investment process. Then, the total cost of the publishers is C = c 0 · Q = c 0 δ e p · ln t + 1 .
To facilitate the understanding of the specific meaning of the parameters below, the summary results are shown in Table 1.
Based on the above basic assumptions and a transaction process analysis, a profit function model can be constructed of the digital content resource transaction entities based on a Stackelberg game. The profit functions of digital content resource producers and publishers are assumed to be π 1 and π 2 , respectively. Then, the profit function models of the two entities are shown in Formulas (1) and (2).
π 1 = α p δ e p · ln t + 1 + μ m t 2 2 m t 2 2
π 2 = 1 α p δ e p · ln t + 1 μ m t 2 2 c 0 δ e p · ln t + 1

3.2. Equilibrium Analysis of the Stackelberg Game Model

To solve this model, the decision-making factors of the game players must be gradually analyzed according to the backward induction method [51,52]. In contrast with the transaction process shown in Figure 1, first, the profit function of the market follower must be analyzed to solve the profit maximization condition under market sales unit price p . Then, incorporate this condition into the profit function of the market leader and solve its profit maximization condition under revenue-sharing ratio α and viewing effect t . Thus, the equilibrium solution of the dynamic game model with complete information can be obtained. The specific solution process is as follows:
According to the backward induction method, the first derivate π 2 with respect to p and make the first derivative equal to zero:
π 2 p = 1 α e p e p ( 1 α p c 0 ) δ · ln t + 1 = 0 ,
Since δ · ln t + 1 > 0 , 1 α e p e p ( 1 α p c 0 ) = 0 , it is easy to find:
p = 1 + c 0 1 α
Incorporating Formula (3) into Formula (1), we obtain:
π 1 = α ( 1 + c 0 1 α ) δ e ( 1 + c 0 1 α ) · ln t + 1 + μ m t 2 2 m t 2 2
Then, take the derivative of π 1 with respect to α and make the first derivative equal to zero:
π 1 α = 1 + c 0 1 α + α c 0 1 α 2 e 1 + c 0 1 α + e 1 + c 0 1 α · c 0 1 α 2 · α + α c 0 1 α · δ ln t + 1 = 0
Because δ ln t + 1 · e 1 + c 0 1 α > 0 , it needs to satisfy:
1 + c 0 1 α 2 α c 0 1 α 2 α c 0 2 1 α 3 = 0
When we solve Formula (5), we obtain:
1 + c 0 1 α + c 0 2 1 α 2 c 0 2 1 α 3 = 0
Let 1 1 α = x , then simplify Formula (6) to obtain:
c 0 2 x 3 c 0 2 x 2 c 0 x 1 = 0
According to the ShengJin formula [53], we can solve the cubic equation with one variable. since c 0 2 > 0 , Equation (7) can be solved:
A = b 2 3 a c = c 0 4 + 3 c 0 3 > 0 , B = b c 9 a d = c 0 3 + 9 c 0 2 > 0 , C = c 2 3 b d = c 0 2 3 c 0 2 = 2 c 0 2 < 0 . Since Δ = B 2 4 A C = 9 c 0 6 + 42 c 0 5 + 81 c 0 4 > 0 , the cubic equation of one variable has one real and two conjugate imaginary roots. Considering the actual existence of the revenue-sharing ratio, only the real root is taken here. Therefore, according to the root-finding formula, we can obtain:
x = c 0 2 Y 1 1 3 Y 2 1 3 3 c 0 2
where
Y 1 , 2 = ( c 0 6 + 3 c 0 5 ) + 3 c 0 2 2 [ c 0 3 + 9 c 0 2 ± 9 c 0 6 + 42 c 0 5 + 81 c 0 4 1 2
Incorporating 1 1 α = x into Formula (8), we obtain:
α = 1 3 c 0 2 c 0 2 Y 1 1 3 Y 2 1 3
Since this function is related only to c 0 , it can be written as α c 0 .
Incorporating Formula (10) into Formula (3), we obtain:
p = 1 + c 0 2 Y 1 1 3 Y 2 1 3 3 c 0
Similarly, Formula (11) can be written as p c 0 .
Then, Formulas (10) and (11) are incorporated into Formula (1), and the derivative of t is derived so that the first derivative is zero:
π 1 t = ( 1 3 c 0 2 c 0 2 Y 1 1 3 Y 2 1 3 ) ( 1 + c 0 2 Y 1 1 3 Y 2 1 3 3 c 0 ) e 1 + c 0 2 Y 1 1 3 Y 2 1 3 3 c 0 · δ ln t + 1 t + 1 + μ 1 m t = 0
Since t > 0 , according to the root-finding formula of the quadratic equation in one variable, we can obtain:
t = μ 1 m [ μ 1 2 m 2 4 δ μ 1 m · α c 0 · p c 0 · e p c 0 ] 1 2 2 μ 1 m
As a result, the equilibrium solution based on the Stackelberg game model has been found. Now, the key analysis factors are sorted out, as shown in Table 2.
The equilibrium solution reflects the mutual restriction between various factors, and it is an important theoretical reference for game players to make decisions. The above equilibrium solution indicates that the sales unit price and the revenue-sharing ratio of the digital content products are related only to the publishers’ unit cost, and the viewing effect is affected not only by the unit cost but also by multiple factors, such as investment difficulty, copyright fees, and sales coefficient. The specific effects of these factors can be further intuitively reflected through simulation analysis.

4. Simulation and Discussion

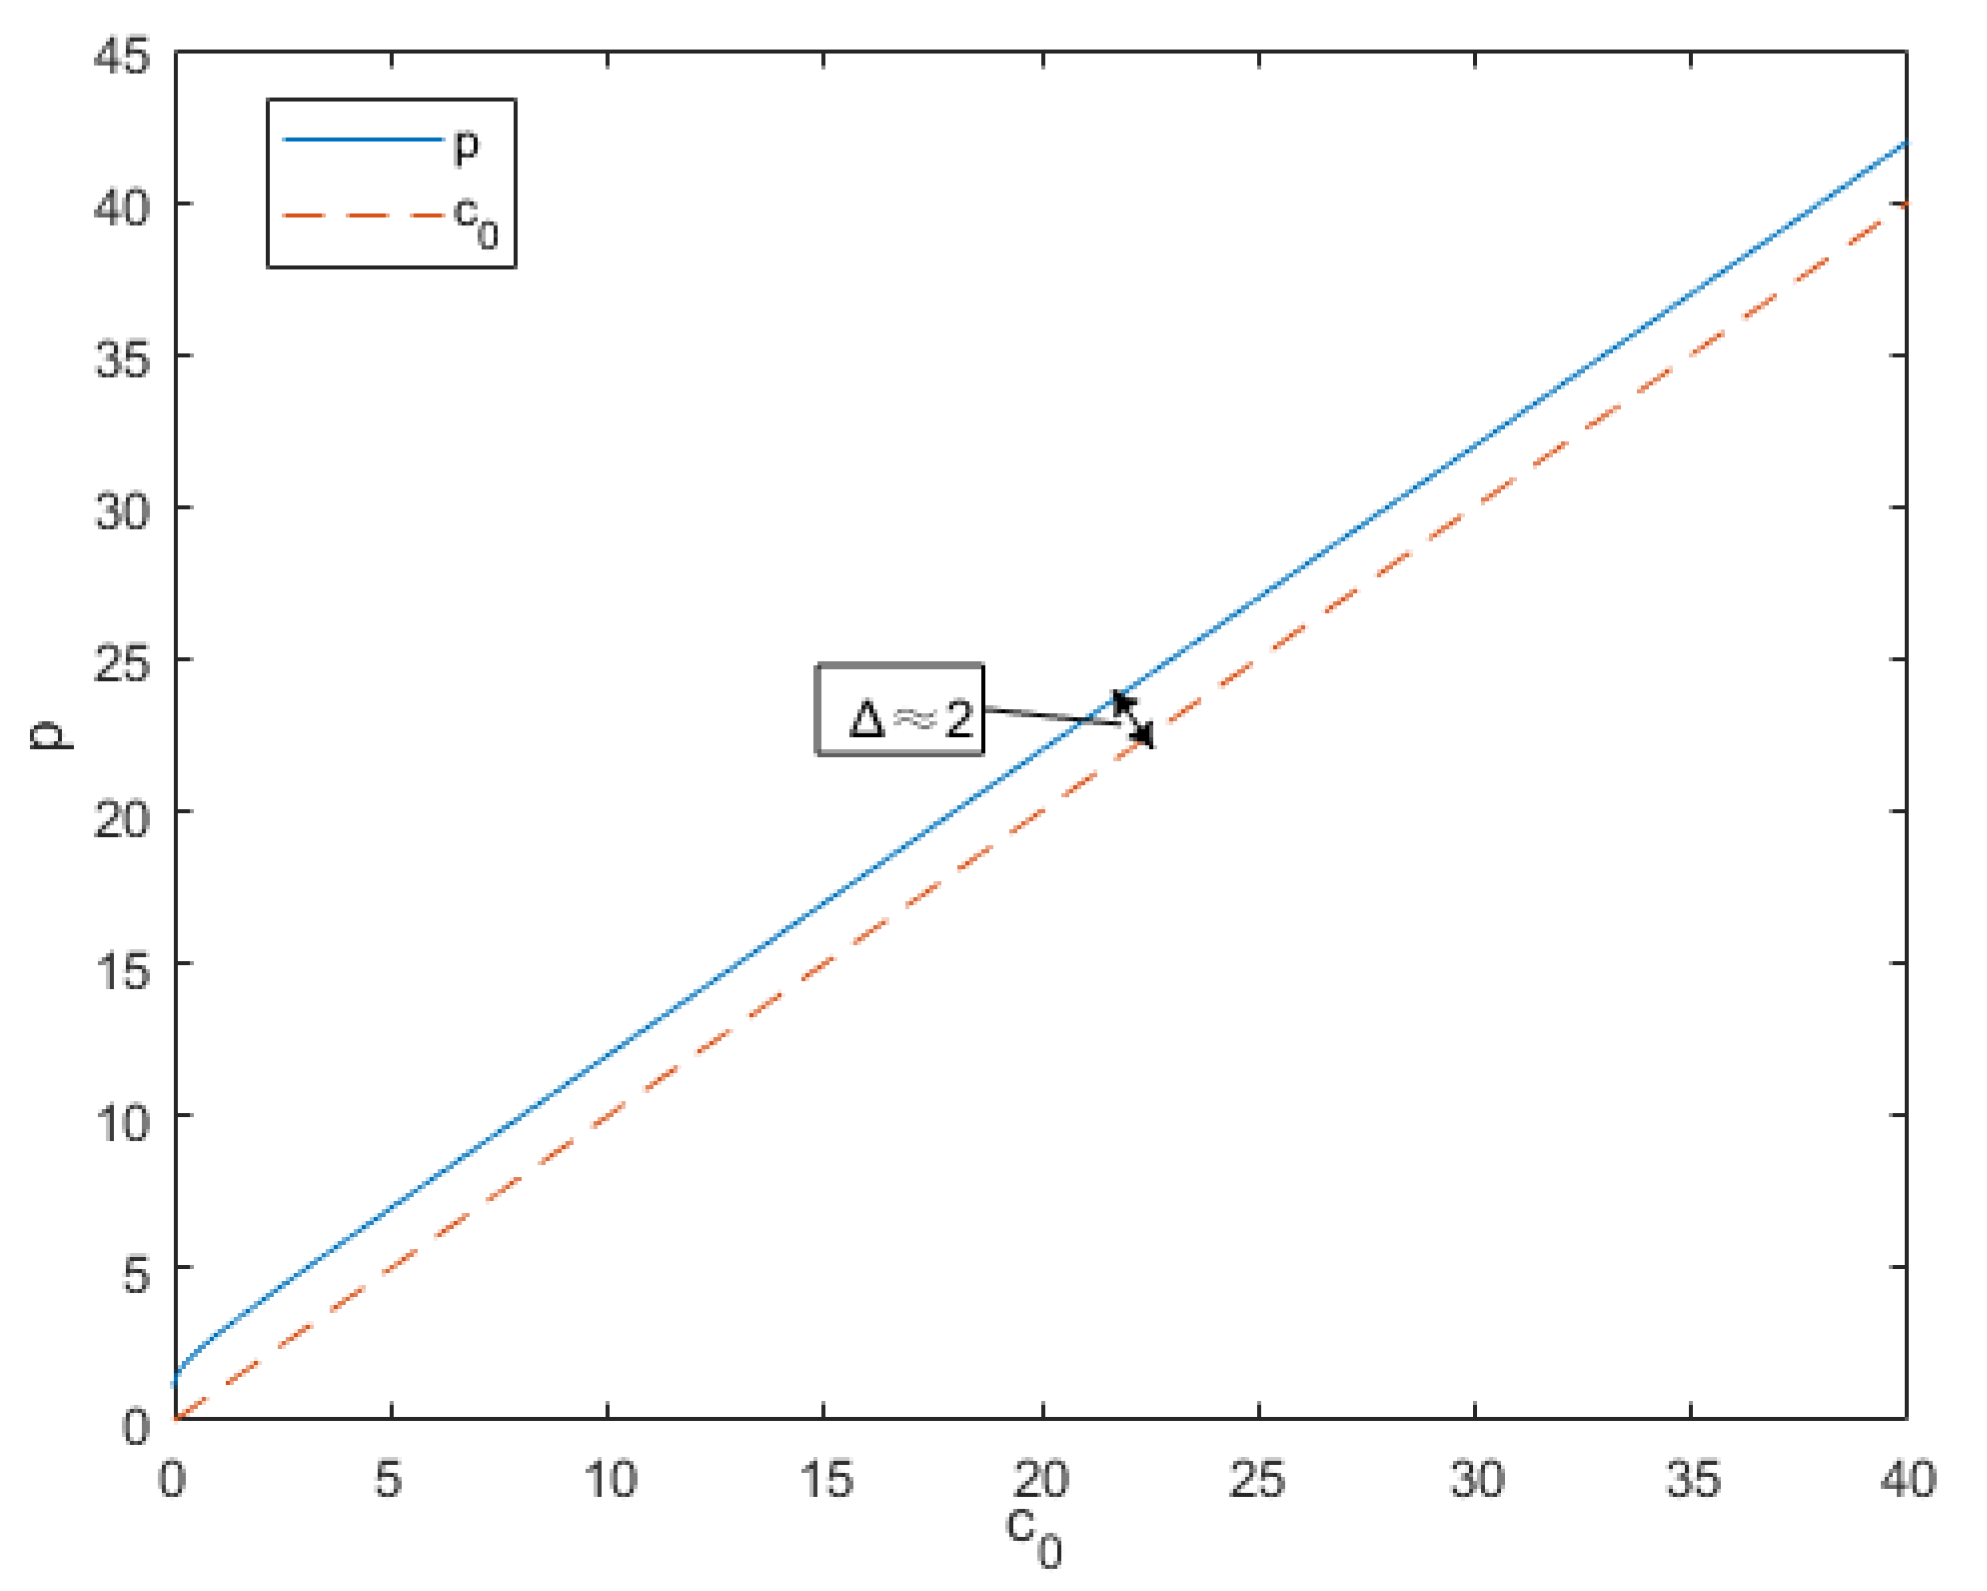
4.1. Simulation Analysis of Sales Unit Price

According to the equilibrium solution of the sales unit price, MATLAB software is used to carry out the numerical simulation analysis, and the simulation result is shown in Figure 2. It should be noted that the simulation data used in this chapter are all from computer numerical simulations. The same is true below.
Figure 2 shows that the sales unit price set by the publishers of the digital content resources is positively correlated with the unit cost; that is, the sales unit price increases as the unit cost increases, as shown by the solid line in Figure 2. The unit cost here refers to the cost of a single broadcast of the digital content resources. Further analysis indicates that the curve of the sales unit price is nearly straight, and as the unit cost continually increases, the difference between the sales unit price and the unit cost nearly always maintains a distance of approximately 2. Here, the specific value 2 is related to the model setting, which can be understood as a fixed constant. In addition, it can be seen that, at the forefront of the sales unit price curve, when the unit cost is small, it shows a slightly curved trend, and the distance from the unit cost is gradually reduced. At this time, the corresponding platform development status should be in the middle and late stages of platform development. Generally, it has been relatively standardized, and the platform is in the process of making a profit. With the scale benefits resulting from long-term operations, the original fixed-cost investment is gradually recovered. Thus, the single broadcast cost, mainly composed of the variable costs, gradually decreases, and the platform correspondingly reduces the single broadcast price. Therefore, when the cost of a single broadcast is small, the sales unit price gradually bends to the cost. However, the current development status of China’s digital content resource platforms, such as iQiyi and Tencent Video, is still in the active exploration stage of profit models and has not yet achieved large-scale profitability. Therefore, this is only a summary of the pricing law of the generalized platform, and the bending phenomenon is not considered in a small range of the front end. Based on the above analysis, we summarize the pricing phenomenon of the publishers as follows: the pricing strategy adopted by the publishers is the cost-plus pricing method [54], and the gross profit of the addition is approximately two units.
The simulation analysis shows that the unit price of the product is related only to the cost of a single broadcast. Schneider [55] research shows that when all costs and production quantities can be estimated, the cost-plus pricing method is an effective method to determine the product price, which can also reflect the profit of the product. Chang and Ho [56] also found that the cost-plus pricing method can be effectively applied to the pricing of electronic services and facilitate the measurement of service premiums. This result is more consistent with reality. For example, in the film and television works market, we often find that the prices of different film and television works broadcast on the same video platform are roughly the same. For example, Tencent Video charges 5 yuan to watch a movie. This is because, for the same platform, the cost is fixed for platform construction, operation, maintenance, etc., and the publisher has a certain understanding of the platform’s user conversion rate. Therefore, it can roughly judge the number of clicks on a certain content resource based on page views, user portraits, and historical experience. Based on this information, the market demand and development trend of the digital content resources on the platform can be roughly estimated. In this way, the approximate cost of each digital content resource broadcast is basically determined, and the publisher determines the unit price of the film based on the unit cost plus a fixed gross profit margin. Therefore, different films have the same pricing. However, the different operating costs incurred when different platforms provide related services, such as personnel management efficiency, technical level, and product procurement channels, cause different operating costs. Therefore, different platforms may charge different single broadcast prices for the same work. Overall, when pricing products, the publishers of digital content resources consider only the cost of a single broadcast and usually adopt a cost-plus pricing method.

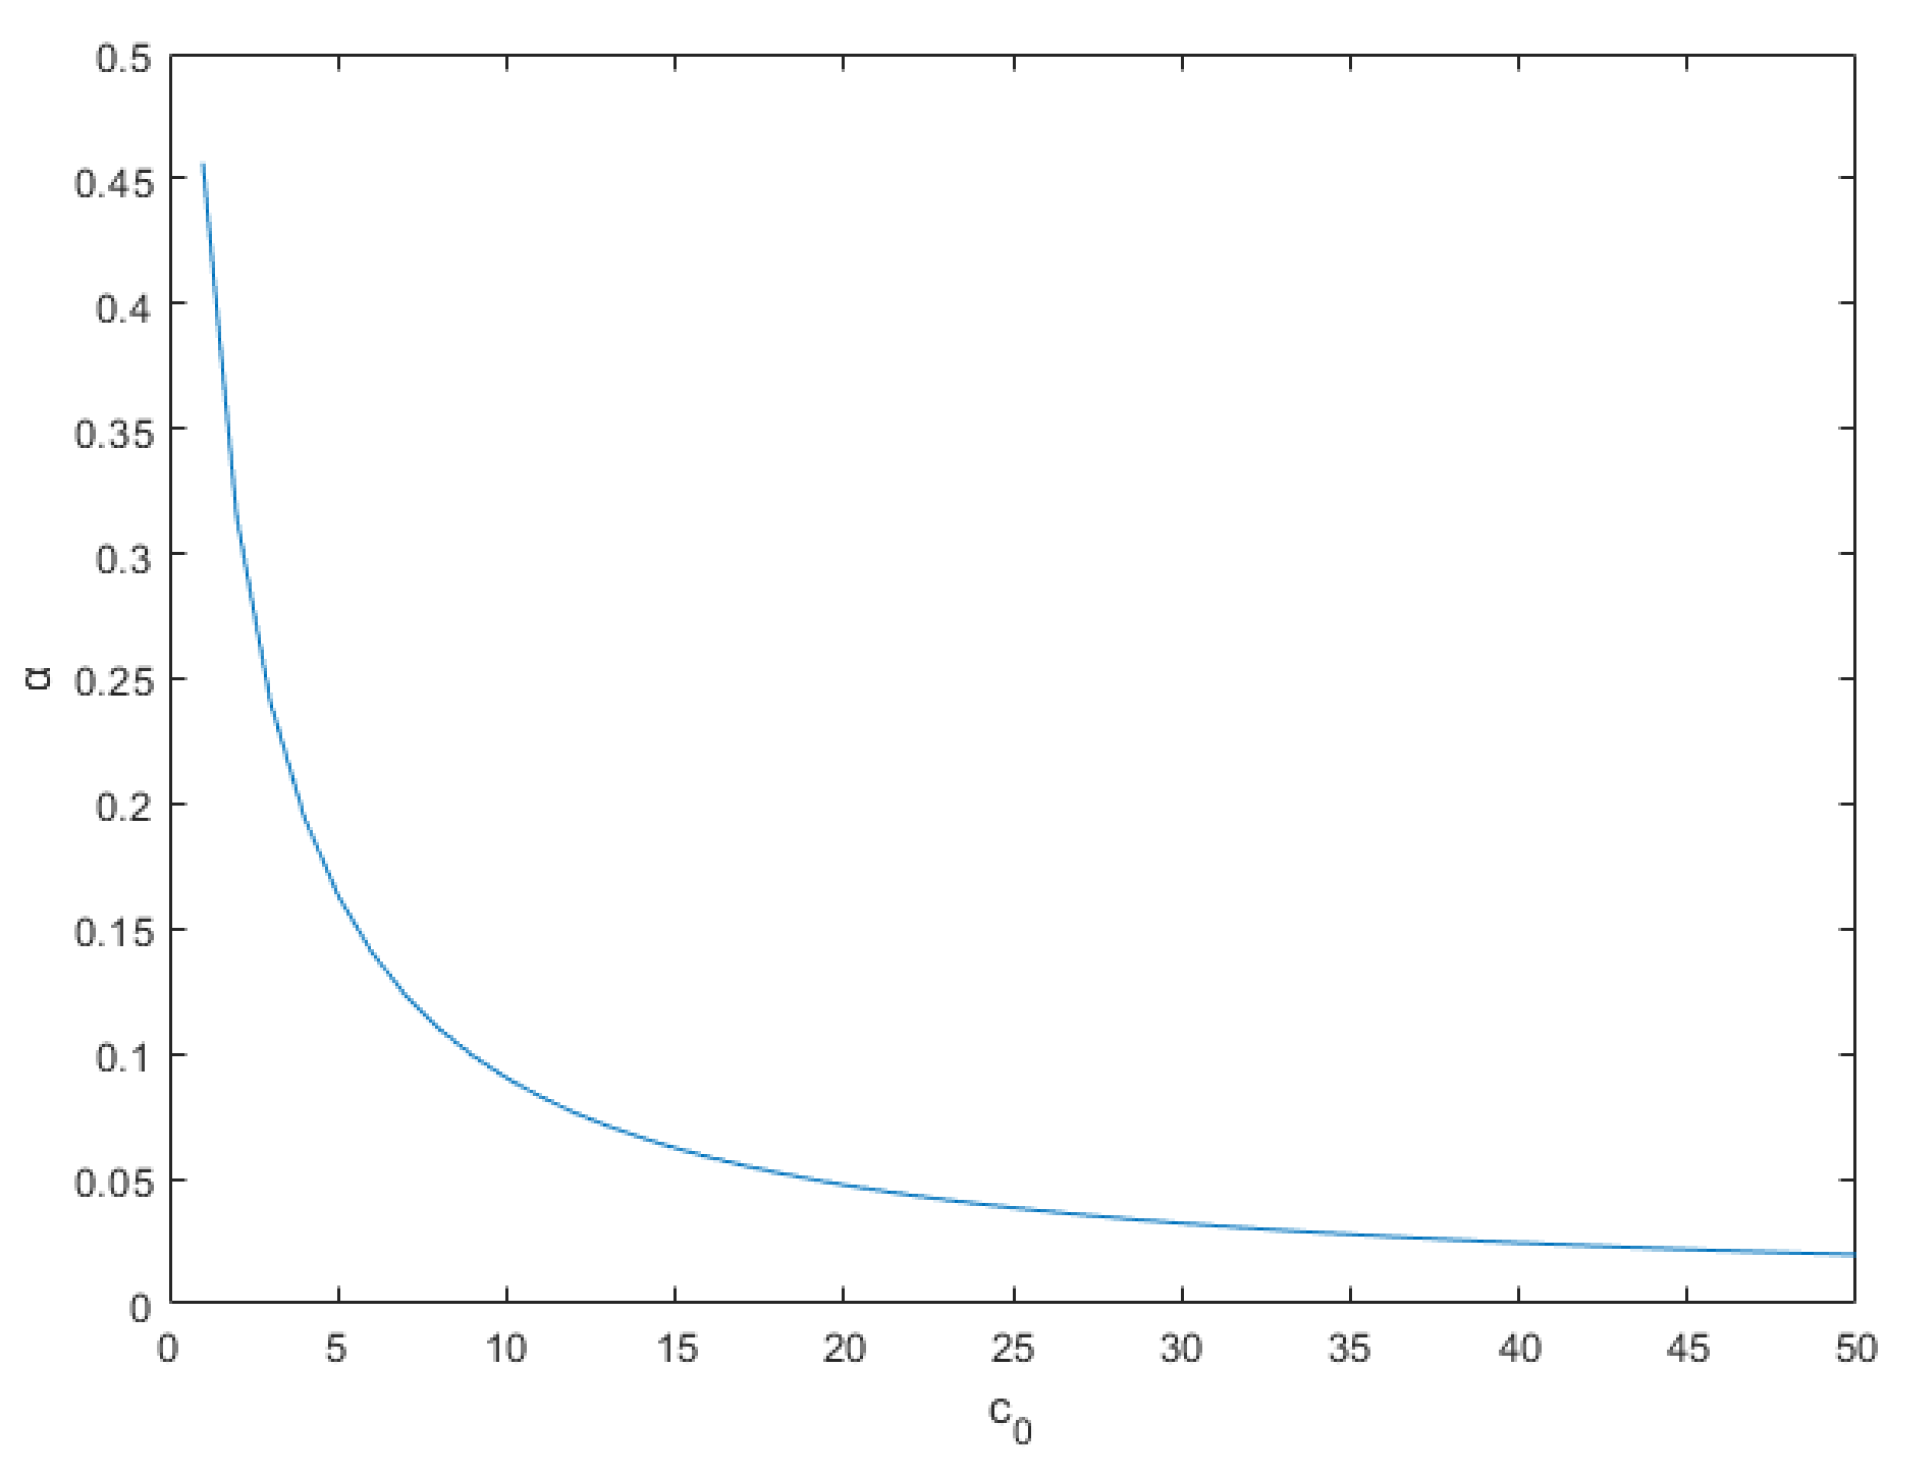
4.2. Simulation Analysis of the Revenue-Sharing Ratio

According to the equilibrium solution of the revenue-sharing ratio, MATLAB software is used to carry out the numerical simulation analysis, and the simulation result is shown in Figure 3.
Figure 3 shows that when digital content resource producers require a revenue-sharing ratio, they must consider the single broadcast cost, and the revenue-sharing ratio and unit cost are negatively correlated and concave toward the origin. That is, the revenue-sharing ratio decreases as the cost of a single broadcast increases, and the rate of decrease increasingly slows, as shown by the curve in Figure 3. Considering the basic status of the current digital platform and people’s demand for cultural, entertainment, and other knowledge resources, the demand has a certain base for digital content resources. Because a web search is convenient, a slight price change results in a massive price advantage. Therefore, at the front end of the curve, when the single broadcast cost is small, the revenue-sharing ratio changes more flexibly. However, as the cost of a single broadcast increases, the revenue-sharing ratio of the producers decreases, and the changes are smaller. Therefore, when the single broadcast cost is high, the revenue-sharing contract of the digital content resource producer can be reached only at a lower revenue-sharing ratio. At this time, the relationship is not significant between the revenue-sharing ratio and the single broadcast cost.
Theoretically, the equilibrium solution of the Stackelberg game model is the optimal choice of both players when the profits are maximized. Obviously, when the single broadcast cost is low, the publishers will meet the producers’ high revenue-sharing ratio requirement. When the single broadcast cost is high, to maximize their own interests, the publishers will choose to meet the low revenue-sharing ratio requirements of the producers. Avinadav et al. [57] studied the revenue sharing between the application publishing platform and the manufacturer. The results show that when the future demand is uncertain, the manufacturer will have more initiative in bargaining when he knows more about the platform information. Then if the manufacturer knows that the operating cost of the publishing platform is low, he can propose a higher revenue-sharing ratio. Im et al. [58] also discussed this issue through a multistage game model and found that the revenue-sharing ratio can coordinate the interest relationship between the digital content and network platform service providers. Because the content publishing platform adopts a cost-plus pricing method, a lower unit cost will lead to a lower sales price. The price advantage is also conducive to promoting an increase in sales, thereby ensuring higher returns. When the platform’s revenue is high, it may be able to meet the producer’s high revenue-sharing ratio requirement. In contrast, when the unit cost is high, so is the pricing of digital content resources, and the high pricing set by the platform causes the loss of some users, which affects sales and causes the revenue to be less than expected. When the revenue is low, the publishers will not agree to a higher revenue-sharing ratio to ensure their own profits. Therefore, the revenue-sharing ratio of the producer is closely related to the single broadcast cost of the digital content resource. This conclusion has important management significance for guiding the transaction of digital content resources.

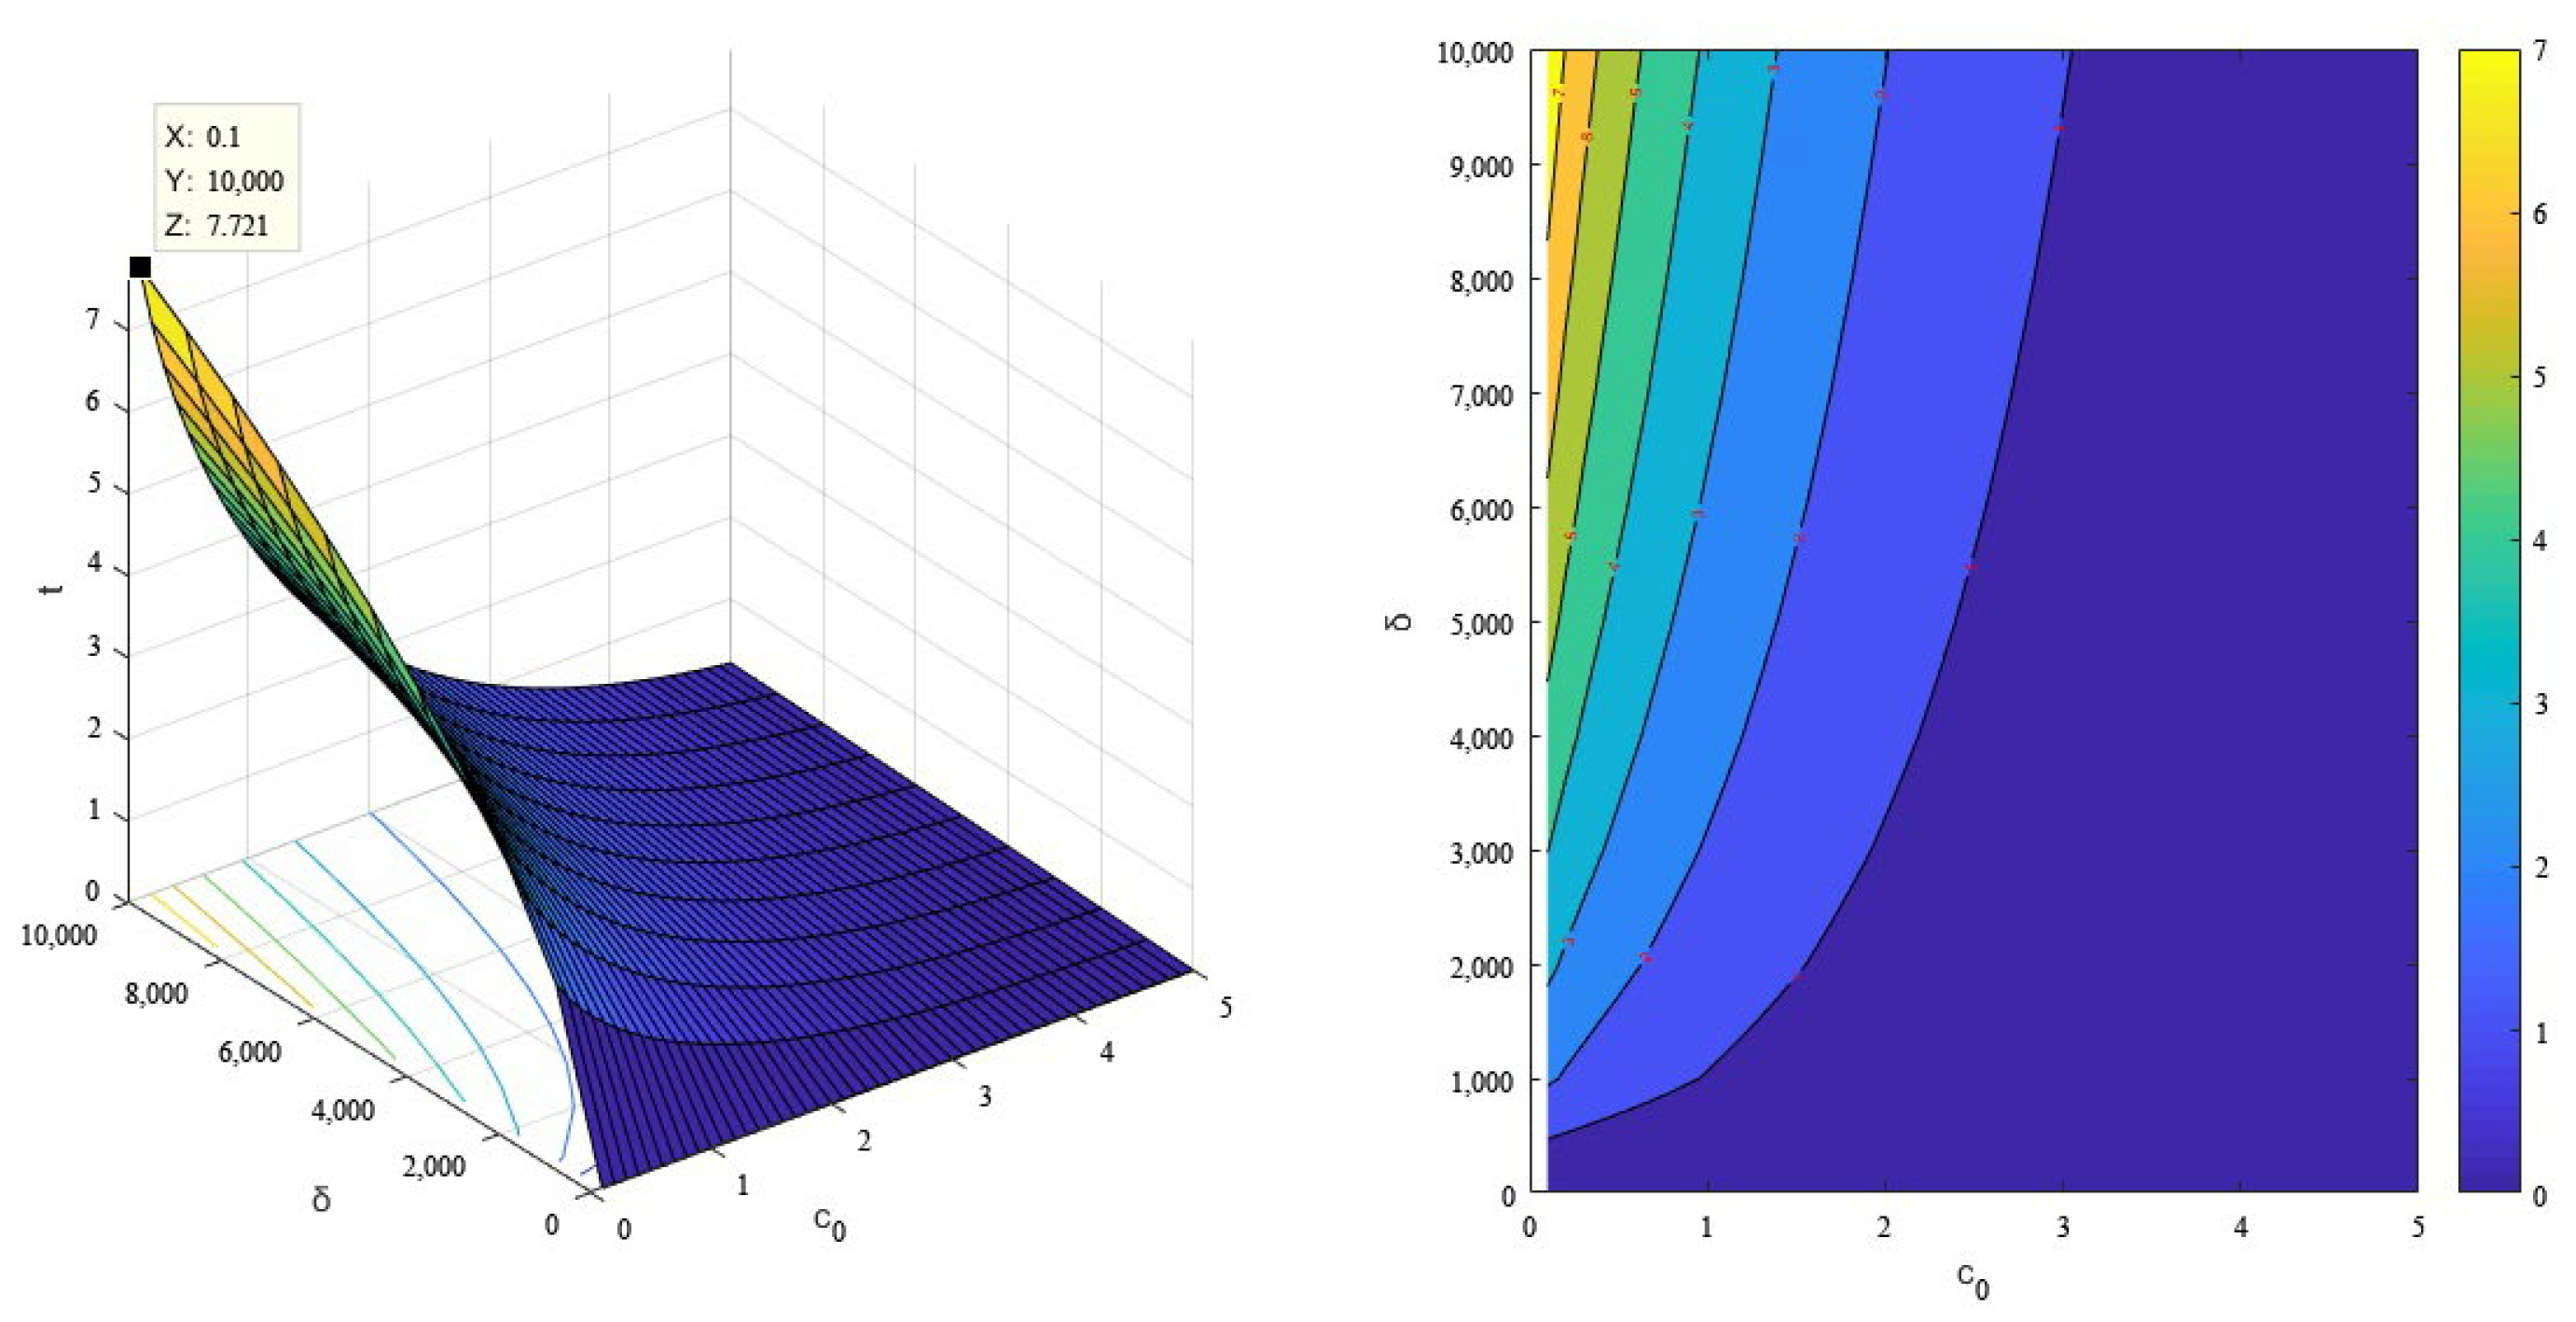
4.3. Simulation Analysis of the Viewing Effect

According to the equilibrium solution of the viewing effect, MATLAB software was used to carry out the numerical simulation analysis. Since the viewing effect is affected by multiple factors, the controlled variable method is adopted to individually simulate and analyze the relevant factors. First, fix the value of the sales coefficient ( δ = 10 6 ) and unit cost ( c 0 = 5 ), and simulate the producer’s investment difficulty coefficient and copyright fees coefficient. The simulation result is shown in Figure 4.
The left image in Figure 4 is a three-dimensional image of the viewing effect. The X-axis represents the investment difficulty coefficient, the Y-axis represents the copyright fees coefficient, and the Z-axis represents the viewing effect of digital content resources. The image on the right is the contour image of the viewing effect, which can more intuitively demonstrate the relationship between the increases and decreases of the three. Figure 4 shows that the viewing effect decreases when the investment difficulty coefficient increases and increases when the copyright fees coefficient increases. In fact, the viewing effect is significantly affected by the preferences and expectations of the producers. When the investment difficulty is low, the producer is more motivated to complete the work and can successfully fulfill the production task. In addition, the sense of accomplishment in completing the work promotes higher expectations for future market prospects. Therefore, the producer will consider the work to have a better viewing effect. In contrast, if the investment difficulty is great, various obstacles in the production process may cause the work to be incomplete or aborted, so it does not meet previous expectations. Naturally, this failure will lower the producer’s evaluation of the viewing effect. When Jahanmir and Cavadas [59] studied the impact of digital content product production technology on the viewing effect, they found that the evaluation of technical difficulty by the producers would have a negative impact on the dissemination effect. That is, the producer believes that the technical difficulty is greater, the digital content resources are less likely to be adopted, and the spread has a smaller scope. This conclusion also confirms the conclusion of this manuscript that the viewing effect will decrease as the investment difficulty coefficient increases.
The copyright fee coefficient is an important indicator that encourages the producers to strive to improve the viewing effect. When Cao et al. [60] studied the issue of music copyright, they found that the collection of copyright fees can stimulate the enthusiasm of musicians and help improve the effectiveness of music creation. Higher copyright fees enable the producers to recover as much of the funds as possible to offset the investment expenditures when authorizing the broadcasting rights and to achieve the goal of reducing the profit risk to the greatest extent. When the market demand is uncertain, the revenue-sharing contracts cannot guarantee stable returns for the producers. In the initial exploration of the value evaluation model, the copyright value was the main source of revenue for the producers. The acquisition of copyright fees can bring direct material incentives to the producers, and a larger copyright fee coefficient can prompt the producers to increase their enthusiasm for the pursuit of product viewing effects. Conversely, a better viewing effect is also a bargaining power for the producers to bargain over copyright fees. The viewing effect is an important indicator for the publishers to judge the market demand status of the content resources. Under the pricing strategy of pursuing revenue-sharing contracts, copyright fees account for a small proportion of market revenue, and the publishers are willing to bear a higher copyright fee coefficient for products with higher viewing effects. Therefore, copyright fees have a positive effect on the viewing effect of digital content resources.
Then, through the same method, the value of the fixed investment difficulty coefficient ( m = 10 2 ) and the copyright fees coefficient ( μ = 0.6 ) are used to simulate the sales coefficient and unit cost of the publishers, and the simulation result is shown in Figure 5.
The left image in Figure 5 is a three-dimensional image of the viewing effect. The X-axis represents the unit cost, the Y-axis represents the sales coefficient, and the Z-axis represents the viewing effect. The image on the right is the contour image of the viewing effect. Figure 5 shows that the viewing effect decreases as the unit cost increases and that it increases as the sales coefficient increases. When the analyses of the sales unit price and the revenue-sharing ratio are combined, a lower single broadcast cost can enable the producers to obtain a higher revenue-sharing ratio, and they can use the low-price advantage to increase sales and revenue. Therefore, the lower unit cost can generate positive incentives for the producers, which can encourage them to contribute more digital content products with better viewing effects. Conversely, the profit of the producers will be impaired, which will reduce their pursuit of viewing effects, resulting in lower viewing effects. In addition, the effect of a single broadcast cost on the viewing effect can produce a feedback evaluation mechanism, which is reflected in the correction of the viewing effect by the market evaluation. When the single broadcast cost is lower, so is the sales unit price, and the consumers will improve their appraisal of the viewing effect due to the high-quality and low-cost experience. In contrast, when the single broadcast cost is higher, so is the product price. The consumers will reduce their desire to buy because of higher prices, resulting in lower product satisfaction and lower consumer appraisals of the viewing effect. These results reflect the correction process of the feedback mechanism on the viewing effect. Overall, the single broadcast cost will have a negative impact on the viewing effect. In addition, the research by Huang et al. [61] found that keen competition among the media platforms provided high levels of user satisfaction, and the key to winning is to reduce the single broadcast cost.
The sales coefficient level directly determines the extent of the change in sales. According to the sales model, a higher sales coefficient indicates that small changes in prices and viewing effects will have a greater impact on sales. Therefore, a higher sales coefficient will encourage producers to strive to improve the viewing effect, increase sales, and pursue higher returns. At the same time, a higher sales coefficient will encourage the publishers to strive to maintain a price advantage to win higher consumer evaluations. Conversely, a small sales coefficient has little incentive for the producers, leading to insufficient motivation for them to pursue high viewing effects. Similarly, a low sales coefficient has less incentive effect on the publishers, and it is difficult to motivate them to use a low-price sales strategy to attract consumers to buy. The producers and publishers pay less attention to the viewing effects, which ultimately causes the original and feedback effects to fall short of expectations. A recent study has found that the dimension of digital media is an important variable that affects the value of digital content [62]. Generally, the higher the dimension of digital media, the better the brand value and the higher the market sales. This is consistent with the conclusion of this paper. Overall, the sales coefficient has a positive impact on the viewing effect.
Through this simulation analysis of the viewing effect, the relationship between the viewing effect and related factors can be clarified, and necessary explanations can be given. The summary results are shown in Table 3. The influence of these factors on the viewing effect will provide an important management strategy guide for the producers and publishers.

5. Conclusions

Based on the common characteristics of current digital content resources, this manuscript explores the relevant factors that affect their pricing strategy. Combined with the process analysis of the pricing strategy, key factors such as the viewing effect, revenue-sharing ratio, and sales unit price are selected from the influencing factors as important analytical parameters. Using the Stackelberg game model, we constructed a pricing strategy game model in which the producer is the leader, and the publisher is the follower. By solving the equilibrium solution of the game model and performing a numerical simulation analysis on it, we can more intuitively describe the mutual restraint relationship between the various factors that affect the pricing. The following conclusions can be drawn.
(1) The digital content resource publishers adopt a cost-plus pricing method for the single broadcast price. The management enlightenment of this pricing method is that digital content publishers should pay attention to cost control and strive to reduce operating costs to enhance price advantage. In the digital content resource market based on platforms, operating cost is an important factor affecting the pricing difference of digital content products. Due to the different technical levels, number of users, popularity, etc., of the platform, there are differences in the pricing of the single broadcast price of the digital content products. With the increasing market competition, further standardizing platform management and accurately calculating the cost of a single broadcast are important ways to ensure the objective pricing of digital content resources. At the same time, the platform should pay attention to further optimization and reduce operating costs so that publishers can maintain a competitive advantage.
(2) The revenue-sharing ratio of digital content resource producers decreases as the single broadcast cost increases. This mutual restriction relationship can guide the producers of digital content resources to obtain a reasonable revenue-sharing ratio. It can be seen from the above analysis that the high single broadcast cost reduces the price advantage of digital content resource publishers. In order to maximize their own revenue, publishers and producers can only reach a consensus on a lower revenue-sharing ratio. Because digital content resource publishers adopt the cost-plus pricing method, producers can judge their operating costs by observing the prices of products on the content resource publishing platform and thus propose a reasonable revenue-sharing ratio.
(3) The viewing effect of digital content resources is affected by multiple factors, such as copyright fees, investment difficulty, sales coefficient, and unit cost. These all participate in the formation of the pricing strategy through a complex process. According to the above analysis, if digital content resources want to achieve a better viewing effect, efforts can be made from the following aspects: first, set a higher copyright fee, which will encourage producers to actively improve the viewing effect of digital content resources. Second, choose digital content resources with relatively low investment difficulty for production, which will enable producers to easily achieve the expected goals. Third, set a higher sales coefficient, which will encourage publishers to maintain high-quality viewing effects from the perspective of economic benefits. Fourth, strengthen cost management to reduce platform operating costs and improve the price advantage of digital content products so as to enhance consumers’ positive evaluation of viewing effects. The above factors interact with pricing strategy, reflecting the particularity of the digital content resources that take the viewing effect as the core element of pricing. As personalized demand for content resources continues to develop, high-quality content products have become market leaders. Thus, the viewing effect is an important competitive advantage that determines the quality of digital content resources and an important starting point for realizing the transformation of payment models.

6. Limitations and Future Recommendations

The model in this paper is built as a single scenario of one producer and one publisher. The selection of factors that affect the value of digital content resources is limited. Therefore, this conclusion is applicable only when the digital content resource producers and publishers are two different subjects. If they were the same subject, the problem would be transformed into a centralized decision-making problem, requiring the discussion of a separate conclusion. This will also be a very worthy research direction in the future.

Author Contributions

Methodology, Y.Z.; Software, Y.Z.; Formal analysis, Y.N.; Writing—original draft, Y.Z.; Writing—review & editing, Y.N.; Funding acquisition, Y.N. All authors have read and agreed to the published version of the manuscript.

Funding

This research was funded by [the National Key R&D Program of China] grant number [2021YFF0900200] and the Research Foundation for Youth Scholars of Beijing Technology and Business University. And The APC was funded by [the National Key R&D Program of China].

Institutional Review Board Statement

Not applicable.

Informed Consent Statement

Not applicable.

Data Availability Statement

Data sharing not applicable to this manuscript as no datasets were generated or analysed during the current study.

Conflicts of Interest

The authors declare no conflict of interest.

References

  1. Vitorino, J.; Ribeiro, E.; Silva, R.; Santos, C.; Carreira, P.; Mitchell, G.R.; Mateus, A. Industry 4.0—Digital twin applied to direct digital manufacturing. Appl. Mech. Mater. 2019, 890, 54–60. [Google Scholar] [CrossRef] [Green Version]
  2. Wang, J.H.; Zhou, S.J. The current situation, characteristics and spillover effect of the development of digital industry in China. J. Quant. Tech. Econ. 2021, 38, 103–119. [Google Scholar]
  3. Malagoli, S.; Magni, C.A.; Mastroleo, G. The use of fuzzy logic and expert systems for rating and pricing firms: A new perspective on valuation. Manag. Financ. 2007, 33, 836–852. [Google Scholar]
  4. Vragov, R.; Shang, D.; Lang, K.R. Dynamic auctions with Buy-It-Now pricing: A practical design model and experimental evaluation. SSRN Electron. J. 2009, 14, 39–68. [Google Scholar] [CrossRef]
  5. Fischer, T.; Leidinger, J. Testing patent value indicators on directly observed patent value—An empirical analysis of Ocean Tomo patent auctions. Res. Policy 2014, 43, 519–529. [Google Scholar] [CrossRef]
  6. Zhao, D.; Song, P.Y. Evaluation of TV drama projects from the perspective of investment and financing. Mod. Commun. (J. Commun. Univ. China) 2019, 41, 131–138. [Google Scholar]
  7. Na, H.S.; Hwang, J.; Hong, J.Y.J.; Lee, D. Efficiency comparison of digital content providers with different pricing strategies. Telemat. Inform. 2017, 34, 657–663. [Google Scholar] [CrossRef]
  8. Sun, X.J. Strategy analysis for a digital content platform considering perishability. Ann. Oper. Res. 2022. Early Access. [Google Scholar] [CrossRef]
  9. Xu, J.; Duan, Y.R. Subscription price and advertising space decisions for online content firms with reference effect. Electron. Commer. Res. Appl. 2018, 30, 8–24. [Google Scholar] [CrossRef]
  10. Zhang, Y.; Niyato, D.; Wang, P.; Han, Z. Data services sales design with mixed bundling strategy: A multi-dimension adverse selection approach. IEEE Internet Things J. 2020, 7, 8826–8836. [Google Scholar] [CrossRef]
  11. Kort, P.M.; Taboubi, S.; Zaccour, G. Pricing decisions in marketing channels in the presence of optional contingent products. Cent. Eur. J. Oper. Res. 2018, 2, 167–192. [Google Scholar] [CrossRef] [Green Version]
  12. Kim, E.; Libaque-Saenz, C.F.; Park, M.C. Understanding shopping routes of offline purchasers: Selection of search-channels (online vs. offline) and search-platforms (mobile vs. PC) based on product types. Serv. Bus. 2019, 13, 305–338. [Google Scholar] [CrossRef]
  13. Shiller, B.; Waldfogel, J. The challenge of revenue sharing with bundled pricing: An application to music. Econ. Inq. 2013, 51, 1155–1165. [Google Scholar] [CrossRef]
  14. Kar, A.K.; Rakshit, A. Flexible pricing models for cloud computing based on group decision making under consensus. Glob. J. Flex. Syst. Manag. 2015, 16, 191–204. [Google Scholar] [CrossRef]
  15. Li, S.; Luo, Q.; Qiu, L.; Bandyopadhyay, S. Optimal pricing model of digital music: Subscription, ownership or mixed? Prod.-Tion Oper. Manag. 2020, 29, 688–704. [Google Scholar] [CrossRef]
  16. Seppo, K.; Harri, H.; Arto, T. Cost-efficient co-creation of knowledge intensive business services. Serv. Bus. 2018, 12, 779–808. [Google Scholar]
  17. Shivendu, S.; Zhang, R. The impact of digitization on content markets: Prices, profit, and social welfare. Mis Q. 2020, 44, 1905–1956. [Google Scholar] [CrossRef]
  18. Wang, X.J. A dynamic bargaining game with externalities. J. Syst. Sci. Complex. 2018, 6, 1591–1602. [Google Scholar] [CrossRef]
  19. Hong, Y.; Tang, S.L.; Li, Z. Differential pricing equilibrium analysis of online video content platform—Based on the angle of capacity commitment. J. Tech. Econ. Manag. 2015, 5, 7–11. [Google Scholar]
  20. Luo, C.; Leng, M.; Tian, X.; Song, J. Pricing the digital version of a book: Wholesale vs. agency models. INFOR Inf. Syst. Oper. Res. 2018, 56, 163–191. [Google Scholar]
  21. He, D.; Chen, W.; Wang, L.; Liu, T.-Y. Online learning for auction mechanism in bandit setting. Decis. Support Syst. 2013, 56, 379–386. [Google Scholar] [CrossRef]
  22. Bohnlein, T.; Kratsch, S.; Schaudt, O. Revenue maximization in Stackelberg Pricing Games: Beyond the combinatorial setting. Math. Program. 2020, 187, 653–695. [Google Scholar] [CrossRef] [Green Version]
  23. Linh, C.T.; Hong, Y. Channel coordination through a revenue sharing contract in a two-period newsboy problem. Eur. J. Oper. Res. 2009, 3, 822–829. [Google Scholar] [CrossRef]
  24. Huang, Y.S.; Lin, S.H.; Fang, C.C. Pricing and coordination with consideration of piracy for digital goods in supply chains. J. Bus. Res. 2017, 77, 30–40. [Google Scholar] [CrossRef]
  25. Linlan, Z. Protection in DRM and pricing strategies in a two-echelon digital product supply chain. Int. J. Syst. Sci. Oper. Logist. 2018, 5, 356–367. [Google Scholar]
  26. Song, P.Y.; Cao, S.H.; Sun, J.H. Research on copyright pricing methods of digital media content assets. Price Theory Pract. 2014, 10, 111–113. [Google Scholar]
  27. Jimenez, M.; Matus, J.A.; Martinez, M.A. Economic growth as a function of human capital, internet and work. Appl. Econ. 2014, 46, 3202–3210. [Google Scholar] [CrossRef]
  28. Kim, Y.; Mo, J. Pricing of digital video supply chain: Free versus paid service on the direct distribution channel. Sustainability 2019, 11, 46. [Google Scholar] [CrossRef]
  29. Kim, C.; Oh, E.; Shin, N. An empirical investigation of digital content characteristics, value, and flow. Data Process. Better Bus. Educ. 2015, 50, 79–87. [Google Scholar]
  30. Daniel, C.F.; Edward, N.; Jeffrey, J.T. Innovation and price: The case of digital cameras. Appl. Econ. 2009, 41, 2229–2236. [Google Scholar]
  31. Garcia-Ortega, R.H.; Garcia-Sanchez, P.; Merelo-Guervos, J.J. StarTroper, a film trope rating optimizer using machine learning and evolutionary algorithms. Expert Syst. Int. J. Knowl. Eng. 2020, 37, e12525.1–e12525.15. [Google Scholar] [CrossRef]
  32. Haktanir, E. Afuzzy film rating system using penthagorean fuzzy K-Means clustering. J. Mult.-Valued Log. Soft Comput. 2021, 37, 463–480. [Google Scholar]
  33. Hu, R. TV series ratings analysis and prediction based on decision tree. Assoc. Comput. Mach. 2021, 6, 147–152. [Google Scholar] [CrossRef]
  34. Fromer, J.C.; Silbey, J. Retelling copyright: The contributions of the restatement of copyright law. Columbia Univ. Libr. 2021, 3, 341–342. [Google Scholar] [CrossRef]
  35. Tang, Z.Q. Application of information product pricing method in copyright valuation of TV program: Basing on cus-tomer perceived value and conjoint analysis methods. Inf. Res. 2017, 1, 23–28. [Google Scholar]
  36. Wang, X.Q.; Hou, Z.P.; Bao, J.L.; Yuan, Q.J. Research on influencing factors of the pricing of digital publication from the perspective of consumer. Inf. Stud. Theory Appl. 2014, 37, 53–56, 41. [Google Scholar]
  37. Xu, S. Hollywood movies and China: Analysis of Hollywood globalization and relationship management in China’s cinema market. Glob. Media China 2018, 3, 177–194. [Google Scholar]
  38. Cheryl, F. Sharing with creative commons: A business model for content creators. Soc. Sci. Electron. Publ. 2010, 2, 64–93. [Google Scholar]
  39. Xia, D. An empirical analysis of the factors influencing the box office of 3D movies in my country. Mod. Commun. (J. Commun. Univ. China) 2012, 34, 139–140. [Google Scholar]
  40. Ghazali, L.; Islam, R. Critical determinants of box office success for the Malaysian film industry. Int. J. Bus. Syst. Res. 2021, 15, 491–509. [Google Scholar] [CrossRef]
  41. Bakker, G. Sunk costs and the dynamics of creative industries. In The Oxford Handbook of Creative Industries; Oxford University Press: Oxford, UK, 2015; pp. 351–386. [Google Scholar]
  42. Van der Rhee, B.; Schmidt, G.; van der Veen, J.A.; Venugopal, V. Revenue-sharing contracts across an extended supply chain. Bus. Horiz. 2014, 57, 473–482. [Google Scholar] [CrossRef]
  43. Sang, S. Supply chain coordination with revenue sharing contract in prospect theory. IAENG Int. J. Appl. Math. 2017, 47, 484–489. [Google Scholar]
  44. Nina, B.; Seethu, S.; Andrei, S. Revenue sharing vertical contracts in the movie industry: A theoretical analysis. Rev. Mark. Sci. 2019, 17, 81–116. [Google Scholar]
  45. Hansser, F.A. Revenue-sharing in movie exhibition and the arrival of sound. Econ. Inq. 2010, 40, 380–402. [Google Scholar] [CrossRef]
  46. Canbulut, G.; Kse, E.; Arik, O.A. Handling of revenue sharing contracts within the scope of game theory. Soft Comput. 2021, 25, 321–329. [Google Scholar] [CrossRef]
  47. Li, Z.P.; Wang, J.J.; Perera, S.; Shi, J.J. Coordination of a supply chain with Nash bargaining fairness concerns. Transp. Res. Part E: Logist. Transp. Rev. 2022, 159, 102627.1–102627.20. [Google Scholar] [CrossRef]
  48. Hou, X.; Li, J.; Liu, Z.; Guo, Y. Pareto and Kaldor–Hicks improvements with revenue-sharing and wholesale-price contracts under manufacturer rebate policy. Eur. J. Oper. Res. 2022, 298, 152–168. [Google Scholar] [CrossRef]
  49. Molto, M.J.G.; Georgantzis, N.; Orts, V. Cooperative R&D with endogenous technology differentiation. J. Econ. Manag. Strategy 2010, 14, 461–476. [Google Scholar]
  50. Wu, J.; Guo, Z.; Wang, J.; Gu, S. Pricing digital products with cost and competition considered in electronic commerce. J. Northeast. Univ. (Nat. Sci.) 2006, 7, 724–727. [Google Scholar]
  51. Bossert, W.; Sprumont, Y. Every choice function is backwards-induction rationalizable. Econometrica 2013, 81, 2521–2534. [Google Scholar]
  52. Carlos, A.F.; Klaus, R. Does backwards induction imply subgame perfection? Games Econ. Behav. 2016, 103, 19–29. [Google Scholar]
  53. Fan, S.J. The new root-seeking formula and new discriminant method of cubic equation. J. Hainan Norm. Univ. (Nat. Sci.) 1989, 2, 91–98. [Google Scholar]
  54. Amaral, J.V.; Guerreiro, R. Factors explaining a cost-based pricing essence. J. Bus. Ind. Mark. 2019, 34, 1850–1865. [Google Scholar] [CrossRef]
  55. Schneider, A. Cost-plus pricing when joint costs are present. Omega 1985, 13, 555–559. [Google Scholar] [CrossRef]
  56. Chang, W.L.; Ho, C.Y. A Mixed-Initiative Model for Quality-Based E-Services Pricing. In Proceedings of the Seventh International Conference on Information Technology: New Generations, IEEE Computer Society, Las Vegas, NV, USA, 12–14 April 2010. [Google Scholar] [CrossRef]
  57. Avinadav, T.; Chernonog, T.; Meilijson, I.; Perlman, Y. A consignment contract with revenue sharing between an app developer and a distribution platform. Int. J. Prod. Econ. 2022, 243, 108322.1–108322.16. [Google Scholar] [CrossRef]
  58. Im, N.; Mo, J.; Park, J. Revenue sharing of ISP and CP in a competitive environment: Game theory for networks. Springer Int. Publ. 2016, 174, 113–121. [Google Scholar]
  59. Jahanmir, S.F.; Cavadas, J. Factors affecting late adoption of digital innovations. J. Bus. Res. 2018, 88, 337–343. [Google Scholar] [CrossRef]
  60. Cao, J.L.; Wang, Z.; Dai, M.Z. The imposition strategy and improvement of the KTV music copyright fees: Based on the cooperative game theory and the Shapley model. J. Tech. Econ. Manag. 2014, 2, 24–29. [Google Scholar]
  61. Huang, Y.; Yang, C.-G.; Baek, H.; Lee, S.-G. Erratum to: Revisiting media selection in the digital era: Adoption and usage. Serv. Bus. 2016, 10, 239–260. [Google Scholar] [CrossRef]
  62. Janmohammadi, M. Investigating the impact of digital media advertising content on accepting or rejecting the message mediated by advertising value and modifier of brand trust and marketing innovation (case study: Citizens of the west of Tehran). Int. J. Electron. Mark. Retail. 2022, 13, 206–223. [Google Scholar] [CrossRef]
Figure 1. Digital content resource transaction process.
Sustainability 14 16525 g001
Figure 2. The simulation relationship between the unit cost and price.
Sustainability 14 16525 g002
Figure 3. Simulation relationship between the unit cost and revenue-sharing ratio.
Sustainability 14 16525 g003
Figure 4. The simulation relationship of the viewing effect when the investment difficulty and copyright fee change.
Sustainability 14 16525 g004
Figure 5. The simulation relationship of the viewing effect with the change in the sales coefficient and unit cost.
Sustainability 14 16525 g005
Table 1. Meaning of each parameter in the basic assumptions of the model.
Parameter RepresentationBasic Meaning
t Viewing effect
m Investment difficulty coefficient of the producers
I = m t 2 / 2 Investment scale
μ Copyright fee coefficient
μ I Copyright fee
α Revenue-sharing ratio of the producers
1 α Revenue-sharing ratio of the publishers
p Single broadcast price
c 0 Single broadcast cost
δ Constant coefficient of the sales model
Q = δ e p · ln t + 1 Total sales volume
R = p · Q Total revenue
C = c 0 · Q Total cost of the publishers
Table 2. Equilibrium solution of the Stackelberg game model.
Factor NameTheoretical Formula
Single broadcast price p c 0 = 1 + c 0 2 Y 1 1 3 Y 2 1 3 3 c 0
Revenue-sharing ratio α c 0 = 1 3 c 0 2 c 0 2 Y 1 1 3 Y 2 1 3
Viewing effect t = μ 1 m μ 1 2 m 2 4 δ μ 1 m · α c 0 · p c 0 · e p c 0 1 2 2 μ 1 m
Note: Among them, Y 1 , 2 = ( c 0 6 + 3 c 0 5 ) + 3 c 0 2 2 [ c 0 3 + 9 c 0 2 ± 9 c 0 6 + 42 c 0 5 + 81 c 0 4 1 2 ] .
Table 3. Relevant factors affecting the viewing effect.
Factor NameInfluenceExplanation
Copyright feesPositiveHigher copyright fees will offset some of the investment expenditures in advance, encouraging the producers to strive to improve the viewing effect
Investment difficultyNegativeSmaller investment difficulty will increase the enthusiasm of the producers and increase their expectations of the viewing effect
Sales coefficientPositiveA higher sales coefficient encourages the producers and publishers to work hard to improve the viewing effect and increase the market broadcast revenue
Single broadcast costNegativeLower unit cost will enable the producers to obtain a higher revenue-sharing ratio and use the advantage of low prices to increase sales and revenue
Publisher’s Note: MDPI stays neutral with regard to jurisdictional claims in published maps and institutional affiliations.

