Article

Evaluating Different Soil Amendments as Bioremediation Strategy for Wetland Soil Contaminated by Crude Oil

School of Water Energy and Environment, Cranfield University, Cranfield MK43 0AL, UK
*
Author to whom correspondence should be addressed.
Sustainability 2022, 14(24), 16568; https://doi.org/10.3390/su142416568
Submission received: 5 October 2022 / Revised: 28 November 2022 / Accepted: 29 November 2022 / Published: 10 December 2022
(This article belongs to the Special Issue Sustainable Management and Remediation of Contaminated Sites)

Abstract

:
This study evaluated the efficacy of using Tween 80 surfactant (TW80) and food-waste anaerobic digestate fibre (FWAD) as soil amendments for the remediation of wetlands contaminated by crude oil. A 112-day mesocosms experiment was carried out to simulate hydrocarbon degradation under typical acidified wetland conditions. Soil was spiked with 50,000 mg kg−1 crude oil and TW80 and FWAD were added to mesocosms at 10%, 20% and 30% w/w. The soil basal respiration, microbial community dynamics, environmental stress, alkanes, and PAHs degradation were monitored throughout the mesocosm experiment. Amending the mesocosms with FWAD and TW80 enabled the recovery of the soil microbial activities. This was evidenced by soil basal respiration which was the highest in the 30% FWAD and 30% TW80 mesocosms and translated into increased degradation rate of 32% and 23% for alkanes, and 33% and 26% for PAHs compared to natural attenuation, respectively. Efficient total hydrocarbon degradation was achieved in soil mesocosms with 30% FWAD and 30% TW80 at 90% and 86.8%, respectively after 49 days. Maize seed germination results showed significant improvement from 29% to over 90% following the FWAD and TW80 treatment.

1. Introduction

Wetlands are poorly drained areas subject to permanent or periodic water saturation [1]. Wetlands (WLs) are both ecologically and economically important because of their high agricultural productivity, complex biogeochemistry, and nutrient cycling ability [2,3]. Studies has shown that acidification is ongoing on account of low pH, high sulphate, and nitrate concentration in the WLs of Niger Delta [4,5], that is one of the most important and biodiverse WLs ecosystems in the world [6]. Acid rainfall caused by oil field gas flaring and continual industrialization has been linked to the acidification of the wetlands [7]. The acidification of wetlands is of primary concern because of its effects on WLs ecosystems, dissolved metal ions, water quality, and agriculture [8]. The wetlands of the Niger Delta house most of the crude oil fields in Nigeria. The exploration and exploitation of crude oil in the WLs have led to contamination through spillages and subsequent alteration in the wetland’s ecosystems [9].
The consistent occurrence of the petroleum hydrocarbons (HCs) spillages on acidified wetlands is of public concern for the severe public health, economic, and ecological risks correlated [10,11]. This is a particularly severe and widespread problem in the Niger Delta Region, which has been well documented in several previous studies [12,13,14]. Certain groups of HC contaminants in the acidified WLs, mainly medium and heavy molecular weight alkanes and polycyclic aromatics hydrocarbons (PAHs), are of concern due to their high mobility, availability, recalcitrant and carcinogenic nature [15,16,17]. The remediation of these contaminants in acidified WLs using conventional remediation methods including soil excavation and physiochemical treatments were not suitable [18,19,20].
Previous studies showed that biostimulation using nutrient rich soil amendments can increase the soil microbial activities and subsequently improve the biodegradation of contaminants [21]. Cipullo et al. [22] reported how using compost as nutrient amendment in a bioremediation of soil contaminated by petroleum HCs resulted in a 46% degradation efficiency after 180 days, from their initial concentration of 9163 mg/kg. Typically, biostimulation as a remediation strategy is less intrusive to the environment. Especially when using non-commercial nutrient supplement, including compost, and farmyard manure, the overall remediation costs, and carbon emissions during the treatment process is significantly reduced [23,24,25,26,27].
Digestate from anaerobic digestion (AD) of organic feedstock is a by-product of the AD process [28]. It contains high nutrients including nitrogen, phosphorus, and potassium. When applied to land, it is a high-quality bio-fertilizer which provides readily available nutrients to the soil [29,30,31]. The solid fraction of the digestate (digestate fibre) are better bio-fertilizers, more hygienic, and stabilized when compared with the whole or liquid fraction of digestate [28,32]. The feedstock to produce digestate includes biodegradable materials such as food waste, farmyard manure, municipal waste, and sewage [33,34,35]. Sewage digestate has been successfully applied as biostimulant for the remediation of diesel-contaminated soils [32]. However, sewage digestates are known to have high available metal and metalloids content and introduces pathogenic bacteria into the remediated soils [36,37]. Therefore, the land application of sewage digestate has caused environmental and public health concerns [32,33]. Food waste (FW) digestate possess higher nutrients contents when compared to the digestate of other feedstocks [36,38]. FW digestate are known to have low metal and metalloids contents, high nitrogen, phosphorus, and potassium content, which could increase soil nutrient value after hydrocarbons remediation [28,38]. Bacteria from FW digestate can easily adapt to degrade various organic contaminants (such as hydrocarbons), and grow exponentially, by showing the wide metabolic capacities of this digestate [32]. The increased bacteria growth subsequently leads to an increased HC degradation rate at a reduced time.
While the addition of anaerobic digestates, composts, or biochar have all shown promising results in enhancing the degradation of petroleum hydrocarbons, the extent of degradation can be highly variable. This is often related to the accessibility of the hydrocarbon compounds to the microbes, such as to the bioavailability of the hydrocarbons [39,40]. Enhancing the bioavailability of the contaminants by using a surface-active substance like non-ionic surfactant have been demonstrated to be more suitable for soil remediation than cationic and amphoteric surfactants [41]. The non-ionic surfactants are also cost-effective with minimal toxicity to the soil microbial communities [42]. Tween 80 (TW80) is a non-ionic surfactant with a low ecological toxicity, that increases the solubility and mass transfer of hydrophobic organic compounds including hydrocarbons [43]. Despite these benefits, Tween 80 primarily has been used for ex situ soil washing [41], and has rarely been considered as a supplement during in situ hydrocarbon remediation. In this context, this research focuses on evaluating the potential of TW80 and digestate as soil amendments for remediating petroleum HC contaminants in acidified WLs, by establishing their corresponding remediation endpoints.

2. Materials and Methods

2.1. Mesocosm Soil and Experimental Design

Pristine soil with no record of petroleum hydrocarbons contamination was collected from a construction site in Cranfield University (52.0746 N, 0.6283 E). An amount of 160 kg of soil was collected from top to 30 cm soil depth using trowels and shovels. After the soil collection, the soil was air dried at room temperature, sieved through a 2 mm aperture sieve and the sieved soil was stored in a soil cupboard for 4 days at 20 °C before use for the experiment. Triplicate soil mesocosms were set up using 1 kg soil in 2.5 L transparent polytetrafluoroethylene (PFTE) containers. Nine different mesocosms conditions were evaluated as summarised in Table 1.
The mesocosms except the pristine soils (control) were all acidified to pH of 5.8 by using HNO3 (PrimarPlus-trace analysis grade, supplied by Fisher Scientific UK, Limited). HNO3 was added as rainfalls in most part of the Niger Delta wetlands are weak nitric acid with pH between 5.7–5.9 [44,45]. The acidified soil mesocosms were spiked with 60 mL of Crude oil (<0.5% sulphur) to achieve a target hydrocarbons concentration of 50,000 mg/kg. The adopted concentration fell within the range of most HC contaminated wetlands in the Niger Delta [46,47]. The mesocosms were incubated at 28 °C to mimic the mean temperature of the Niger Delta, Nigeria [48].
FWAD was air dried and particles larger than 2 mm were removed using a 2 mm aperture sieve (model: BS410 manufactured by: Endecotts, London, England). Dried FWAD were mixed with crude-oil-spiked acidified soil at 10, 20 and 30% (w/w) in triplicates following the methods described by Nwankwo [49].
TW80 (Polyoxyethylene (20)sorbitan monooleate) was applied at 10, 20 and 30% (w/w) to the crude oil spiked acidified soil samples in triplicates. The application of the non-ionic surfactants (TW80) was as described by Trinchera and Baratella [50]. Three controls (pristine soil, acidified soil (without HCs) and crude oil spiked acidified soil with no treatment (natural attenuation) were maintained through the experiment. The soil moisture content of 13.75% was increased and maintained at saturation with 54.54% moisture increase. Moisture at saturation was maintained to depict the wetland condition in all mesocosms. Deionised water was used to maintain moisture in all mesocosm. The deionised water was added at 7 days intervals to maintain the soil saturation.

2.2. Soil and FWAD Physicochemical Properties Determination

Physical characteristics of the samples such as moisture content, dry matter, organic matter, water holding content and particle size distribution were analysed. The soil moisture and dry matter content were measured according to BS 7755: Section 3.1 [51]. A quantity of 50 g of air-dried soil samples were oven dried at 105 °C for 24 h. The organic matter content was determined through the loss on ignition (LOI) according to BS EN 13039 [52]. The water holding capacity at saturation and field capacity were determine by using BS 7755 Section 5.5 [53]. The particle size distribution was carried out by sedimentation according to BS-ISO 11277 [54] and ISO 11277 [55] using a Laser Analyzer Master-sizer (MS3000, Malvern Instruments Ltd., Worcestershire, UK), equipped with a hydro adaptor. The soil textural classification was based on percentage clay, silt, and sand using the United State Department of Agriculture soil textural classification scheme.
The chemical characteristics analysed were pH, phosphorus, potassium, magnesium, total nitrogen, total and organic carbons. pH values of the samples were measured with a pH meter (Jenway 3540, Cole-Palmer, Staffordshire, UK). Soil was diluted with deionised water, with a 1:5 soil to water ratio. The mixture was shaken for 60 min at 300 rpm by using an orbital shaker and then it was left to settle for further 60 min before measuring the pH values. The phosphorus content was determined according to BS 7755: Section 3.6:1995 [56], whilst potassium and magnesium were determined according to BS 3882 [57]. The total and organic carbons and total nitrogen were determined by using BS 7755 Section 3.8 [58].

2.3. Soil Biological Properties Determination

Soil basal respiration being the measurement of the steady rate of microbial respiration in soil was used to quantify the CO2 generation rate [59]. Soil basal respiration was measured at the onset of the experiment and, respectively on days 7, 14, 28, 49, 77, and 112 of the mesocosm experiment. The soil samples basal respiration was determined by using the Rapid automated bacterial impedance technique (RABIT) (Don Whitley Scientific, Bingley, UK) as a respirometer. An amount of 1 g of soil samples moistened to saturation in a glass boat was used as described by Pawlett et al. [60] for the determination of soil basal respiration. The microbial respiratory response ran for 48 h at 25 °C. The changes in conductivities (micro siemens) were determined and quantified to CO2 according to [61]. The RABIT software (RABIT version 2.31, 01-1999) was used for quantification of the conductivities.
The soil microbial community profiles and dynamics were determined based on phospholipid fatty acids (PLFA) analysis using a modified method from Frostegård and Bååth [62]. The PLFA were measured at 30-day intervals. Lipids were extracted from 10 g of freeze-dried soil samples using 1:2:0.8 (v/v/v) of chloroform: methanol: citrate buffer and 30 mg of Butylhydroxytoluene (BHT). The extracted lipids were fractionated by solid phase extraction, and the phospholipids fraction was derivatized by mild alkaline methanolysis according to Dowling and White [63]. The resulting fatty acids methyl esters (FAMEs) were analyzed by gas chromatography as explained in Pawlett et al. [60]. The fatty acids were used as an indicator of the presence of groups of microbes (biomarkers). The biomarkers were categorized into Gram-positive bacteria, Gram-negative bacteria, actinobacteria and fungi according to Quideau et al. [64] and Frostegård and Bååth [62].
The soil microbial count was determined through the use of colony forming unit (CFU) plate counting technique [65]. Soil suspensions were prepared by 10-fold serial dilutions with 1 g of soil in triplicates, using deionized water as diluents. The plates were incubated for a period of 24 h in an incubator (Heraeus Incubator, Thermos Scientific, Germany) at 37 °C.

2.4. Hydrocarbons Analysis

The total petroleum hydrocarbons (TPHs) were extracted and analysed by using the procedure described by Risdon et al. [66]. The readily available hydrocarbons fraction was extracted using 15 mL of methanol (HPLC grade, Merck Life Science Limited, Gillingham, UK) while the bioavailable hydrocarbons fraction was extracted using 50 mL of 50 mM of 2-Hydroxypropyl-β-cyclodextrin (HPCD; Merck Life Science Limited, UK) according to Cipullo et al. [22]. The hydrocarbons fractions of each extraction were analysed using a Shimadzu TQ8040 gas chromatography–mass spectrometer (GCMS) equipped with an AOC 6000 auto-sampler (Shimadzu UK, Milton Keynes, UK) and operated in positive ion mode at +70 eV. Quality control and assurance procedures were carried out with the whole procedure blank, clean soil matrix spike recovery and comparison with reference materials. TPHs and readily available hydrocarbons were analysed, respectively, on days 0, 7, 14, 28, 49, 77 and 112 while the bioavailable hydrocarbons were measured on days 0, 28 and 112. Alkanes were grouped into C11–C18 which are prominently liquids and are medium molecular weight, made up of undecane, dodecane to octadecane. The other group was C19–C37, which are prominently wax and heavy molecular weight, made up of nonadecane, octadecane to heptatriacontane. The petroleum PAHs were similarly grouped into C10–C18 and C19–C27.

2.5. Metal(Loid)s Analysis

Metal(loid)s including molybdenum, chromium, nickel, arsenic, cadmium, lead, and mercury of the soil samples were determined using US EPA Method 3051 [67] and BS7755 Section 3.13 [68]. The soil acid digestion was carried out with 0.5 g of the soil samples added with 6 mL of hydrochloric acid (1.18 specific gravity) and 2 mL of nitric acid (1.42 specific gravity) in the liner of a pressure vessel. The vessels were loaded into a microwave machine (model: Mars 240/50, manufacturer: CEM corporation, Charlotte, NC, USA) for digestion. After that, 10 mL of the filtrate were used for a flame atomic absorption spectrophotometer analysis (model: Jenway 6850, manufacturer: Jenway, Staffordshire, UK).

2.6. Ecotoxicity Assay

Germination assay for this experiment was carried out by using maize crop (Zea mays). Maize crop was chosen for the ecological risk assessment since it exhibits high toxicity sensitivity to high and low molecular weight hydrocarbons based on shoots, and germination delays and root biomass [69,70]. Maize is the second most important cereal crop in Nigeria ranking behind sorghum and is the most-consumed cereal crop within the Niger Delta region of Nigeria [48]. The maize crop was planted using the dibbling method which requires less seeds and gives rapid and uniform germination and good yield [71]. This method is most suited for laboratory-based experiments, and it is commonly practiced among local farmers of maize crops [72]. Five seeds of maize were planted per cell and the germination response and days of germination after planting were recorded at the onset and on day 112.

2.7. Statistical Analysis

Descriptive statistical analysis was carried out including mean, standard deviation, standard error by using Microsoft Excel (Version 2111 Build 16.0.14701.20278). The standard error was used to evaluate the variability across germination assays and the applied environmental stress while the standard deviation was used to ascertain the variability within sample measurements and applied to the metal(loid)s data. The JMP pro (version 16) software was used for spearman correlation. Differences in respiration, hydrocarbons, and concentrations between treatments were compared using spearman correlation at a 99.99 percent confidence level. The difference was significant if p < 0.01.

3. Results and Discussion

3.1. Soil Characterisation

The pristine soil is a sandy silt loam soil with a pH of 8.7 and moisture content of 13.75% (Table 2). The C: N: P ratio of soils are important indicators of soil fertility and soils with high C: N: P ratios are referred to as organic-rich soils [73]. The optimal soil C: N: P ratio for effective biodegradation of contaminants by microbes has been recommended at 100:10:1 [74]. The C: N: P ratio of 60:2:1 for the pristine soil samples suggests low carbon and nitrogen (Table 3) in the soil. When soil C: N: P ratios are below the optimal value, it can result in limited microbial activities [75], therefore, supplementation of C and N can aid in stimulating soil microbial activities. FWAD with C: N: P ratio of 250:13:1 indicated that the digestate has a higher quantity of nitrogen and organic carbons to improve the C: N: P ratio in the pristine soil and potentially stimulate microbial activities. This was confirmed by the higher degradation rates of petroleum HCs (shown in Table 4 and Table 5) after addition FWAD. The soil total and organic carbons for the pristine soil were 3.09% and 2.25%, respectively (Table 2). These were increased by the spiking of the soil with crude oil to 5.08% and 1.93%, respectively. Acidifying the soil increased the availability of the soil metals and metalloids (Table 6). This observed increment in availability of the metals and metalloids agreed with the findings of Chintala et al. [76] and Ning et al. [77]. The researchers concluded that the availability of metals increased as the soil becomes more acidic.

3.2. Soil Respiration and Its Relationship with Hydrocarbons Degradation

The pristine soil cumulative respiration rate resulted to be about 946 µg CO2/g soil by day 112. The acidification of the pristine soil reduced its cumulative respiration rate by 56% (Figure 1). The poor respiration can be attributed to the stress induced by the acidification on the soil microbial community. Similar conditions have been reported in several studies in the Niger Delta [78,79]. Kaur et al. [80] reported that environmental stresses such as soil acidification can limit microbial communities’ performance. The acidified soil with crude oil (crude oil mesocosm) has a better respiration than that acidified pristine soil (Figure 1a,b). The slight increment observed could be linked to the biodegradable HCs by the surviving soil microbes.
The application of digestate and Tween 80 surfactant to the spiked soils caused an increase in the soil respiration (Figure 1). This indicated that the TW80 and FWAD resuscitated the microbial communities by providing the required nutrients (shown in the C:N:P ratio) for improved microbial activities. The 30% FWAD and 30% TW80 mesocosms showed 44% and 43% increment in respiration rate, respectively if compared to the crude oil mesocosms. Similar trends were observed with the other digestate and Tween 80 mesocosms (Figure 1). The reported increments in CO2 production rate can be linked to increased activities of hydrocarbons degrading microbial communities that used the hydrocarbons as carbon and energy source under the thriving environment provided by the digestate. This finding agreed with the research of Sándor [81], where the researcher posited that when the soil nutrients quality is improved, it stimulates the activities and stability of the soil microbial community. The level of evolution of biogenic CO2 (CO2 from biomass or organic matter) is an indication of the organic level in soil after effective remediation of organic contaminants from the soil and indicates the extent of crop germination, growth and yield [82,83]. This hypothesis corroborates the high germination percentages recorded in the highly remediated samples of TW80 and FWAD mesocosms which showed higher cumulative CO2 values. The Tween 80 surfactant aided in changing the microbial cell surface hydrophobicity and improving the cell surface absorbing ability of the available hydrocarbons [41]. This subsequently caused more petroleum HCs to be degraded and led to increment in the CO2 generation rate [41,84].
The interrelation of the soil basal respiration and the hydrocarbons content showed that an inverse relation was established for all the mesocosms spiked with crude oil (Table 4 and Table 5). Negative degradation rates were established for the FWAD and TW80 mesocosms, which implied that the higher the gradients (that is the degradation rates) the more CO2 that are produced and the more reduction in the soil PAHs and alkanes. The reduction in PAHs and alkanes allowed for improvement of the remediated soil economic value, whilst the increasing CO2 generation implied that a habitat was gradually restored on the soil. 30% FWAD and 30% TW80 mesocosms showed the highest degradation rates for both alkanes and PAHs (Table 4 and Table 5) indicating the fastest HC degradation. A strong positive correlation was established in all the mesocosms between the respiration rate and hydrocarbons degradation rates using spearman correlation techniques at a probability p < 0.01. At p < 0.01, spearman coefficient (ɤ) is considered significant if it is greater than absolute p but less than 1 (Table 7). This strong correlation shown implied that the more the respiration rates, the more the hydrocarbons that are degraded by the active microbial communities. These suggestions were supported by Jiang et al. [85] stating that the more the hydrocarbons degraders, the more the CO2 produced in mesocosms.

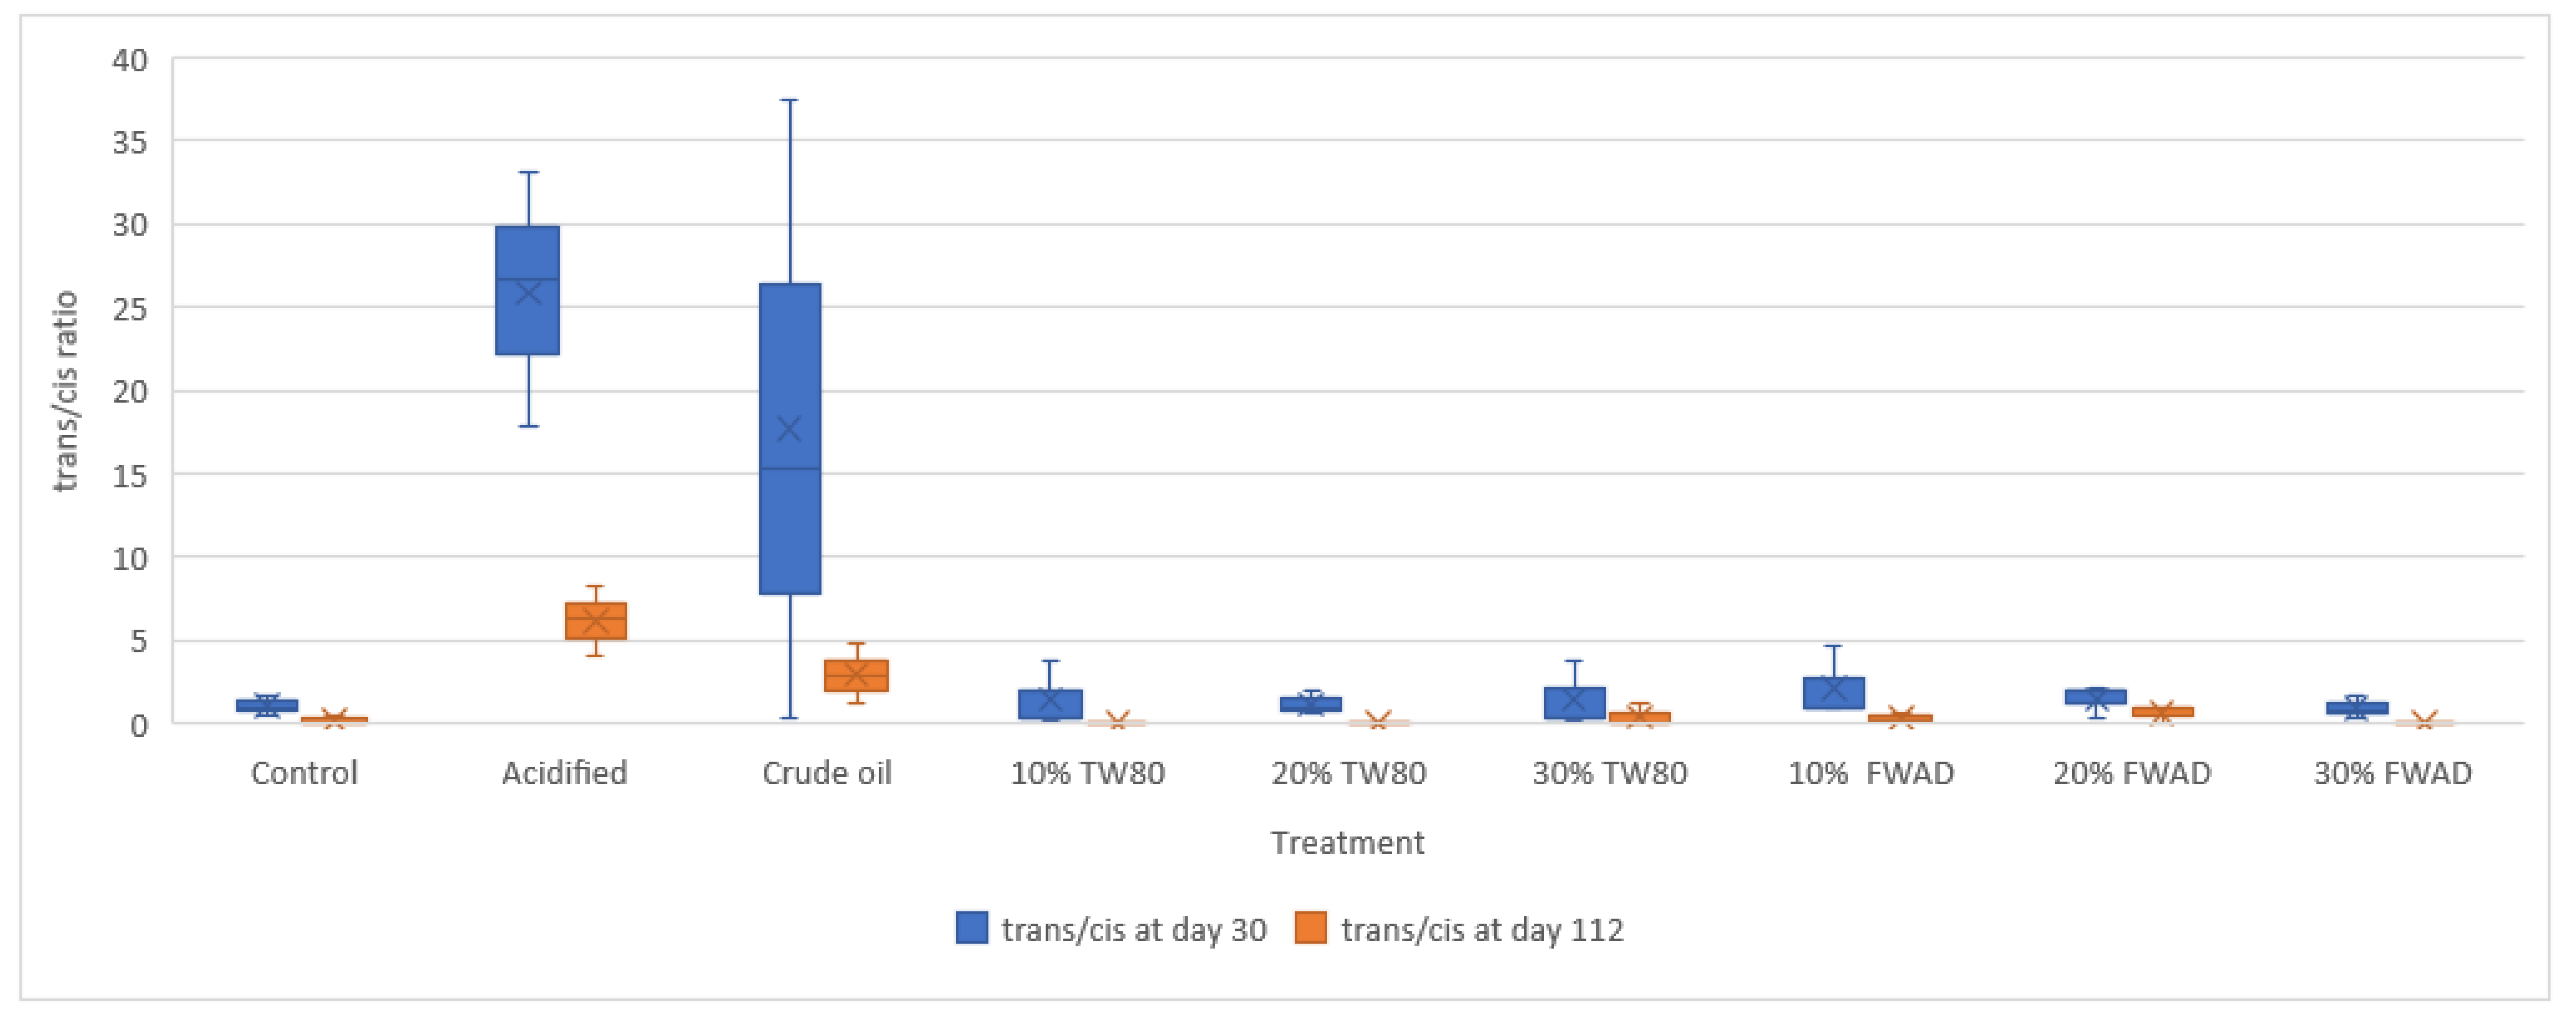
3.3. Soil Microbial Community Dynamics, and Environmental Stress

At the onset of the experiments, the soil microbial community was composed of 42% Gram-positive bacteria, 30% Gram-negative bacteria, 15% actinobacteria and 13% fungi (Figure 2). Crude oil contamination and acidification induced a shift in the soil microbial community towards the Gram-positive and Gram-negative bacteria. The application of FWAD and TW80 to the soils further induced the shift towards the Gram-positive bacteria (Figure 2). The observed dominance by the Gram-positive and negative bacteria could be linked to the degradation of the long chains and recalcitrant PAHs and alkanes [86,87]. Studies by Cipullo et al. [22] correlated hydrocarbon degradation to PLFA specific to the microbial communities that survived the stress from the hydrocarbons’ contamination. The observed dominant microbial communities (Figure 2) survived and adjusted to the applied stress from both the acidification and crude oil spike. Dunfield [88] and Lewe et al. [89] stated that resistant microbial groups can survive severe environmental stresses.
The applied environmental stress was examined using a trans/cis ratio (Figure 3) from PLFA of Figure 2. The high environmental stresses observed on day 30 of remediation dropped across the mesocosms on day 112 of remediation. The conversion from cis to trans unsaturated fatty acids causes a reduction in microbial membrane fluidity, which counteracts against induced stress [80,90]. However, the trans/cis ratio (Figure 3) for the acidified and crude oil mesocosms were greater than 10. This implied that the microorganisms in the acidified and crude oil mesocosms experienced nutrient starvation. This is in agreement with the research of Zhang et al. [87] on the characteristics analysis of PLFA in sediments. The researchers concluded that at a trans/cis ratio >10, the sediments bacteria were in an unhealthy situation and were experiencing severe starvation due to the applied environmental stress. The reduction in environmental stress (trans/cis ratio) at the FWAD and TW80 mesocosms could be linked to the observed shift in the dominant Gram-positive microbial communities. This subsequently implied that there was a drop in soil toxicity and improvement in the soil ecological quality [87,91], which can be attributed to the FWAD and TW80. The trans/cis ratio has higher predicted efficiency for environmental stress when compared with percentage actinobacterial PLFA and G+/G- ratio [92].

3.4. Crude Oil Degradation

In the Tween 80 mesocosms (TW80), the extent of alkanes and PAHs degradation was greatest in soil mesocosms with 30% TW80 in comparison with 20% and 10% TW80 (Figure 4a). On day 49, 75.5% of alkanes and 98% of PAHs in the 30% TW80 mesocosm were degraded (Figure 4a). These results agreed with the study of Feng et al. [93], in which the researchers observed that surfactant increases dissolution of PHCs in the aqueous phase which aids in bioaccessibility of the contaminants to the microbes for degradation. Ceschia et al. [43] confirmed that surfactants in wet soils reduced the interfacial tension and attraction between the contaminants, soil particles and soil moisture. This subsequently makes the contaminants more accessible to the cell walls of the bacteria leading to the mineralisation of the hydrocarbons. It was observed that the bioavailability of the contaminants in the TW80 mesocosms decreased following the degradation of the hydrocarbons (Figure 4a,c). A more significant degradation for medium molecular weight hydrocarbons (C11–C18) was observed compared with heavy molecular weight hydrocarbons (C19–C37) (Figure 4a,c).
The medium molecular weight alkanes which include undecane, dodecane, tridecane to octadecane showed more than 99% degradation by day 112 of remediation for the 30% TW80 mesocosms (Table 8 and Figure 4a). Previously reported hydrocarbons contaminant degradation on wetlands using biochar showed reduced degradation, with 50% degradation of 500 mg/kg alkanes at the same period [94]. The heavy molecular weight hydrocarbons (C19–C37) which include pristane, phytane, nonadecane, hexatriacontane, and heptatriacontane degraded at a reduced rate with the heavier molecular weights showing lesser degradation and availability (Table 9). On day 112, about 85% of the total C19–C37 alkane degradation was achieved at the 30% TW80 mesocosms. Other TW80 mesocosms showed similar degradation but with reduced degradation rates. Wartell et al. [95] stated that medium weight alkanes are more easily degraded by microorganisms if compared to the heavy molecular weight alkanes. The fast degradation observed can be linked to the TW80 which changed the soil bacteria cell surface hydrophobicity by absorbing the surfactants molecules to the bacteria cell surface which subsequently improved the transmembrane transport of the hydrocarbons to the bacterial cell [41]. The degradation pattern observed with the alkanes were similar to that of the soil PAHs. The medium molecular weight compounds degraded on the average 1.25 times faster than the heavier molecular weight PAHs for the TW80 mesocosms. Naphthalene, Fluorene, Phenanthrene, Benz[a]anthracene and Chrysene (that is C10–C18) on day 49 showed about 99% degradation for 30% TW80 (Figure 4a and Table 10). The heavier molecular weight PAHs such as Benzo[b]fluoranthene, Benzo[k]fluoranthene to Indeno(123)[cd]pyrene showed 96% degradation (Figure 4a and Table 11) for 30% TW80. On day 112, both medium and heavy molecular weight PAHs showed more than 99% degradation. Wang et al. [40] researched on surfactant-enhanced remediation of PAHs in farmlands. The researchers concluded that surfactant weakens soil contaminants’ sorption, thereby enhancing PAHs desorption from soil.
The fastest hydrocarbon degradation for the FWAD mesocosms was at the 30% FWAD mesocosms (Figure 4b). 82% of alkanes and 98% of PAHs were degraded by day 49 compared to the natural attenuation (crude oil mesocosms), which has less than 65% for both alkanes and PAHs. Gielnik et al., [96] hypothesized that the metabolic potential of soils can be enriched by the bacteria contained in digestate which can provide new HCs degrading taxa and increase the alkB gene content. AIkB genes encoding alkane hydroxylases belonging to monooxygenases are effective in alkanes degradation [60,97,98].
This hypothesis corroborates with the high CFU/g count in the FWAD mesocosms (Table 4), which can be linked to the high metabolization of the petroleum HCs by the dominating Gram-positive bacteria communities. On day 49, it was observed that the undecane, dodecane, tridecane to octadecane (medium molecular weight HCs) degraded faster than the heavy molecular weight hydrocarbons. The medium molecular weight HCs (C11–C18) showed about 99.5% degradation on day 112 for the 30% FWAD mesocosms (Figure 4b and Table 9). This increased degradation could be linked to the availability of the medium weight hydrocarbons and the increased microbial activities caused by the availability of nutrients (supplied by FWAD) needed for optimal performance of the microbes (Table 4 and Figure 4d). It was observed that the heavy molecular weight hydrocarbons which include pristane, phytane, nonadecane to hexatriacontane and heptatriacontane on day 112 showed reduced degradation as the molecular weight increases to achieve 88.6% degradation (Table 9). The PAHs in the FWAD mesocosms degraded faster than the alkanes (Figure 4b,d). On day 112, more than 99% of the PAHs were degraded (Table 10 and Table 11) [99] and [100] stated the application of stimulants (such as FWAD) could cause an increase in surface area of the samples which could allow for increased microbial attacks on the PAHs.

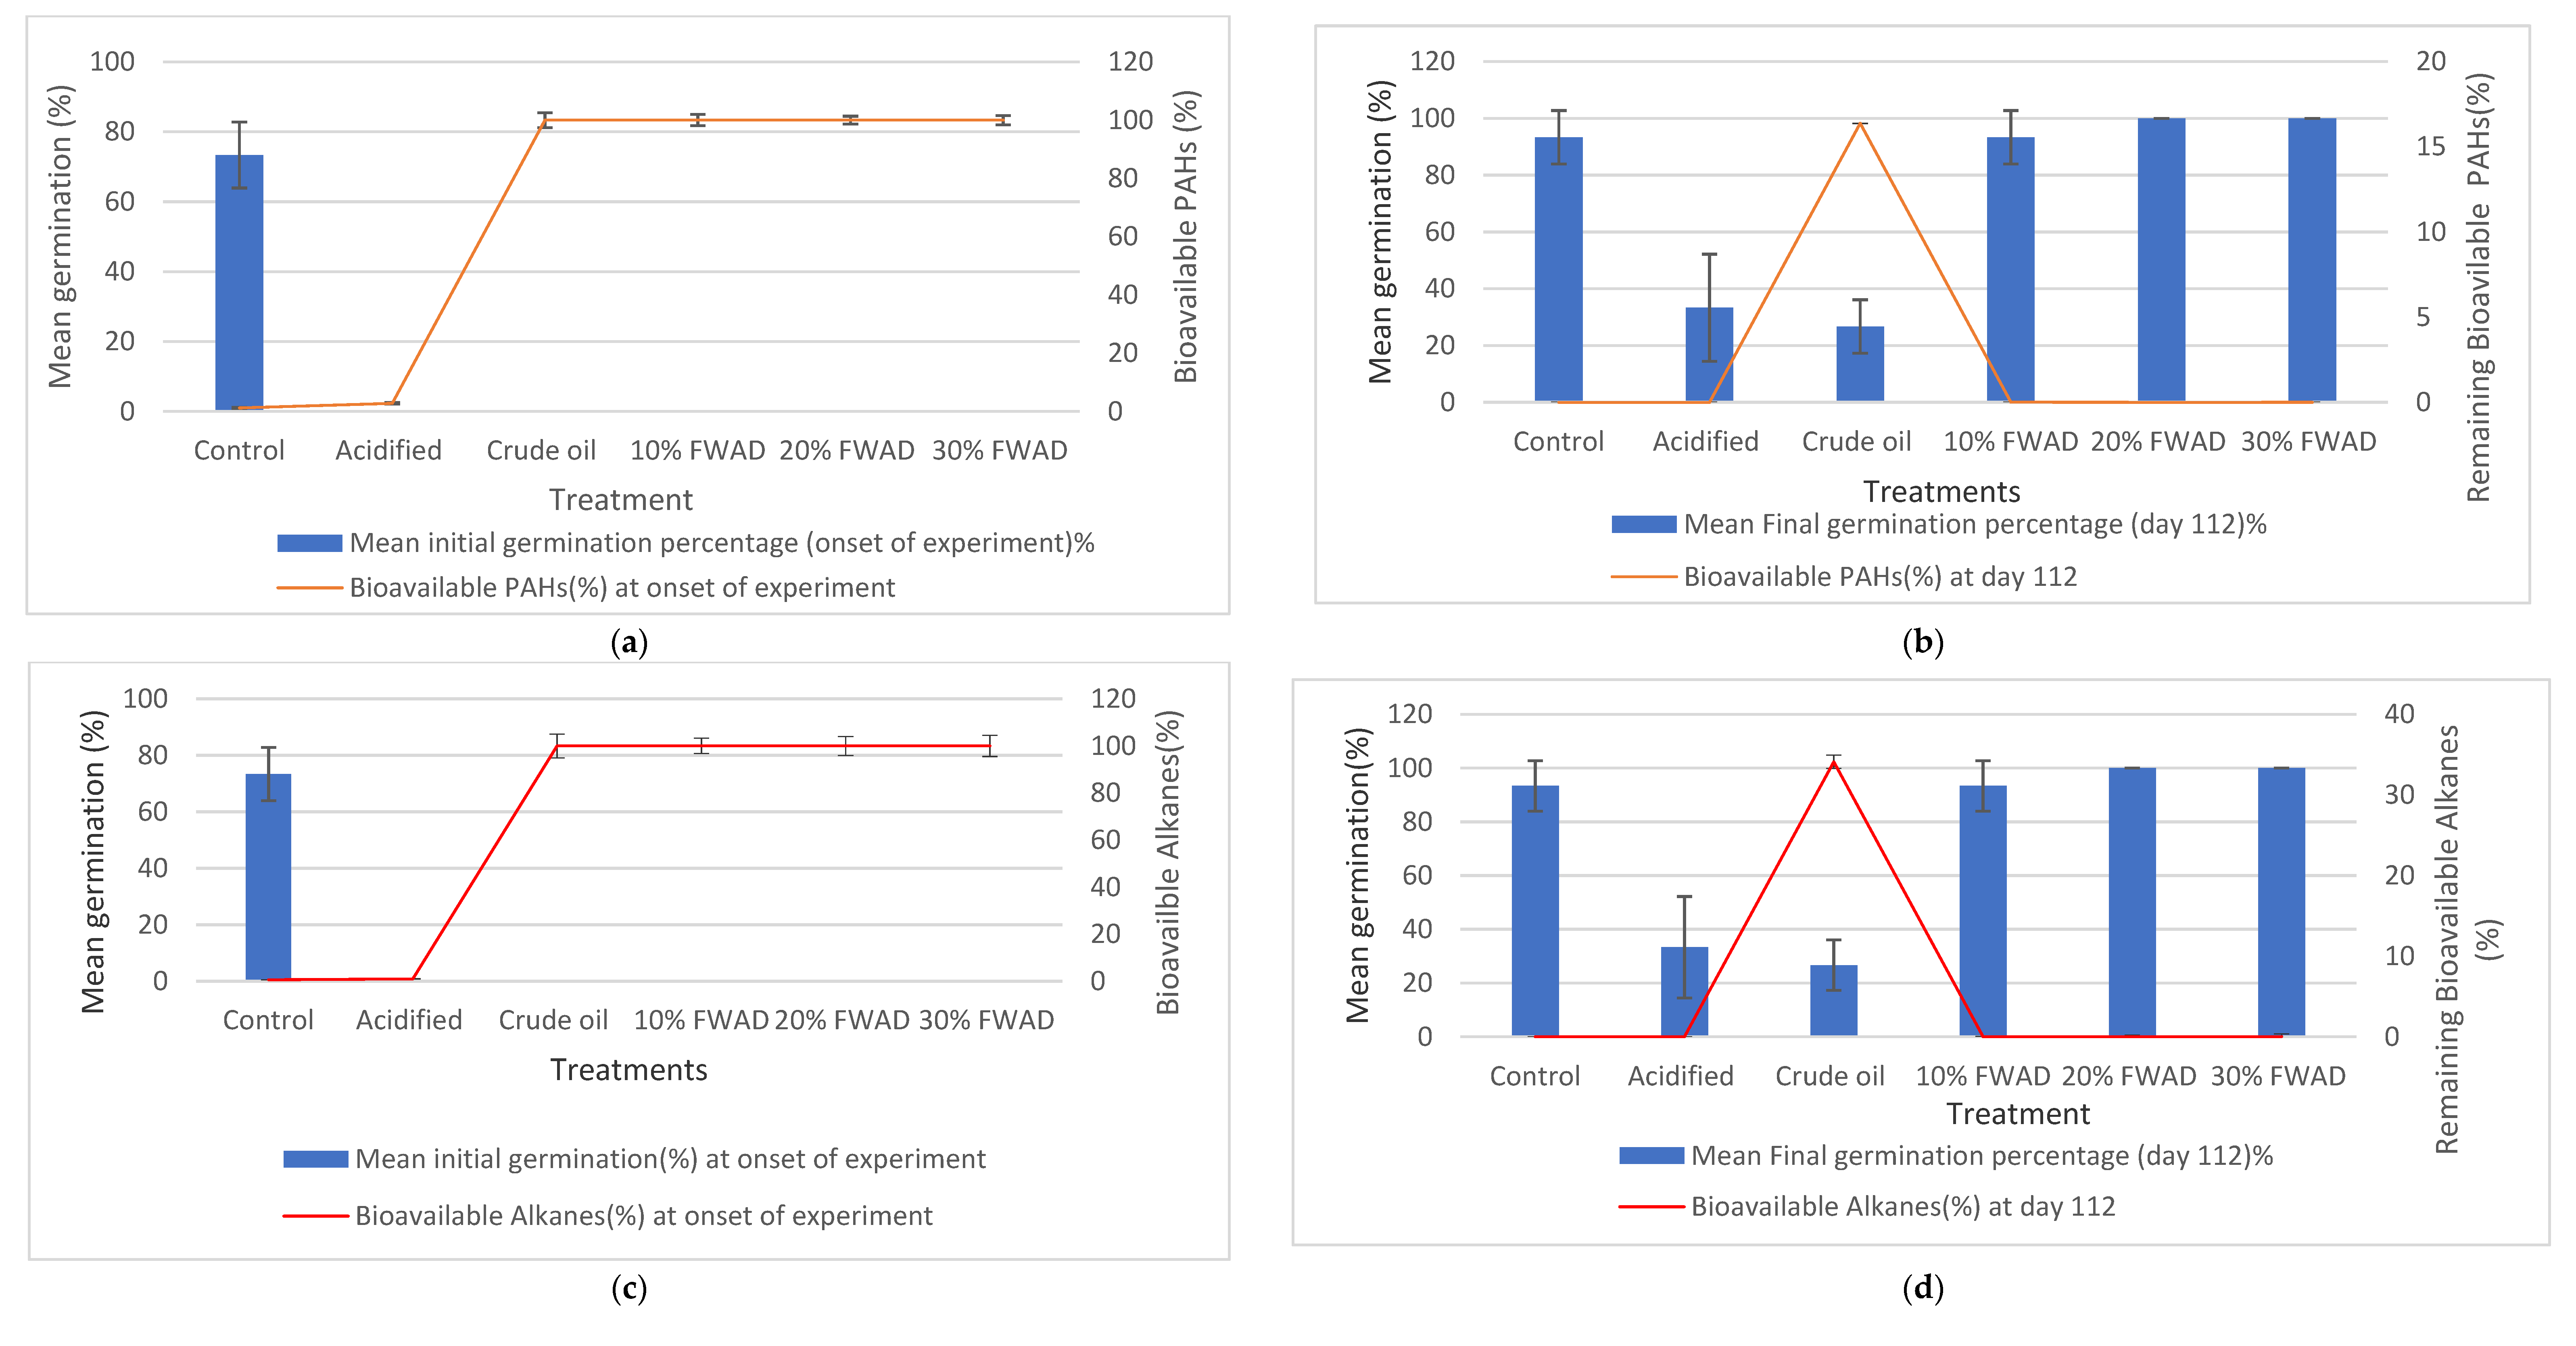
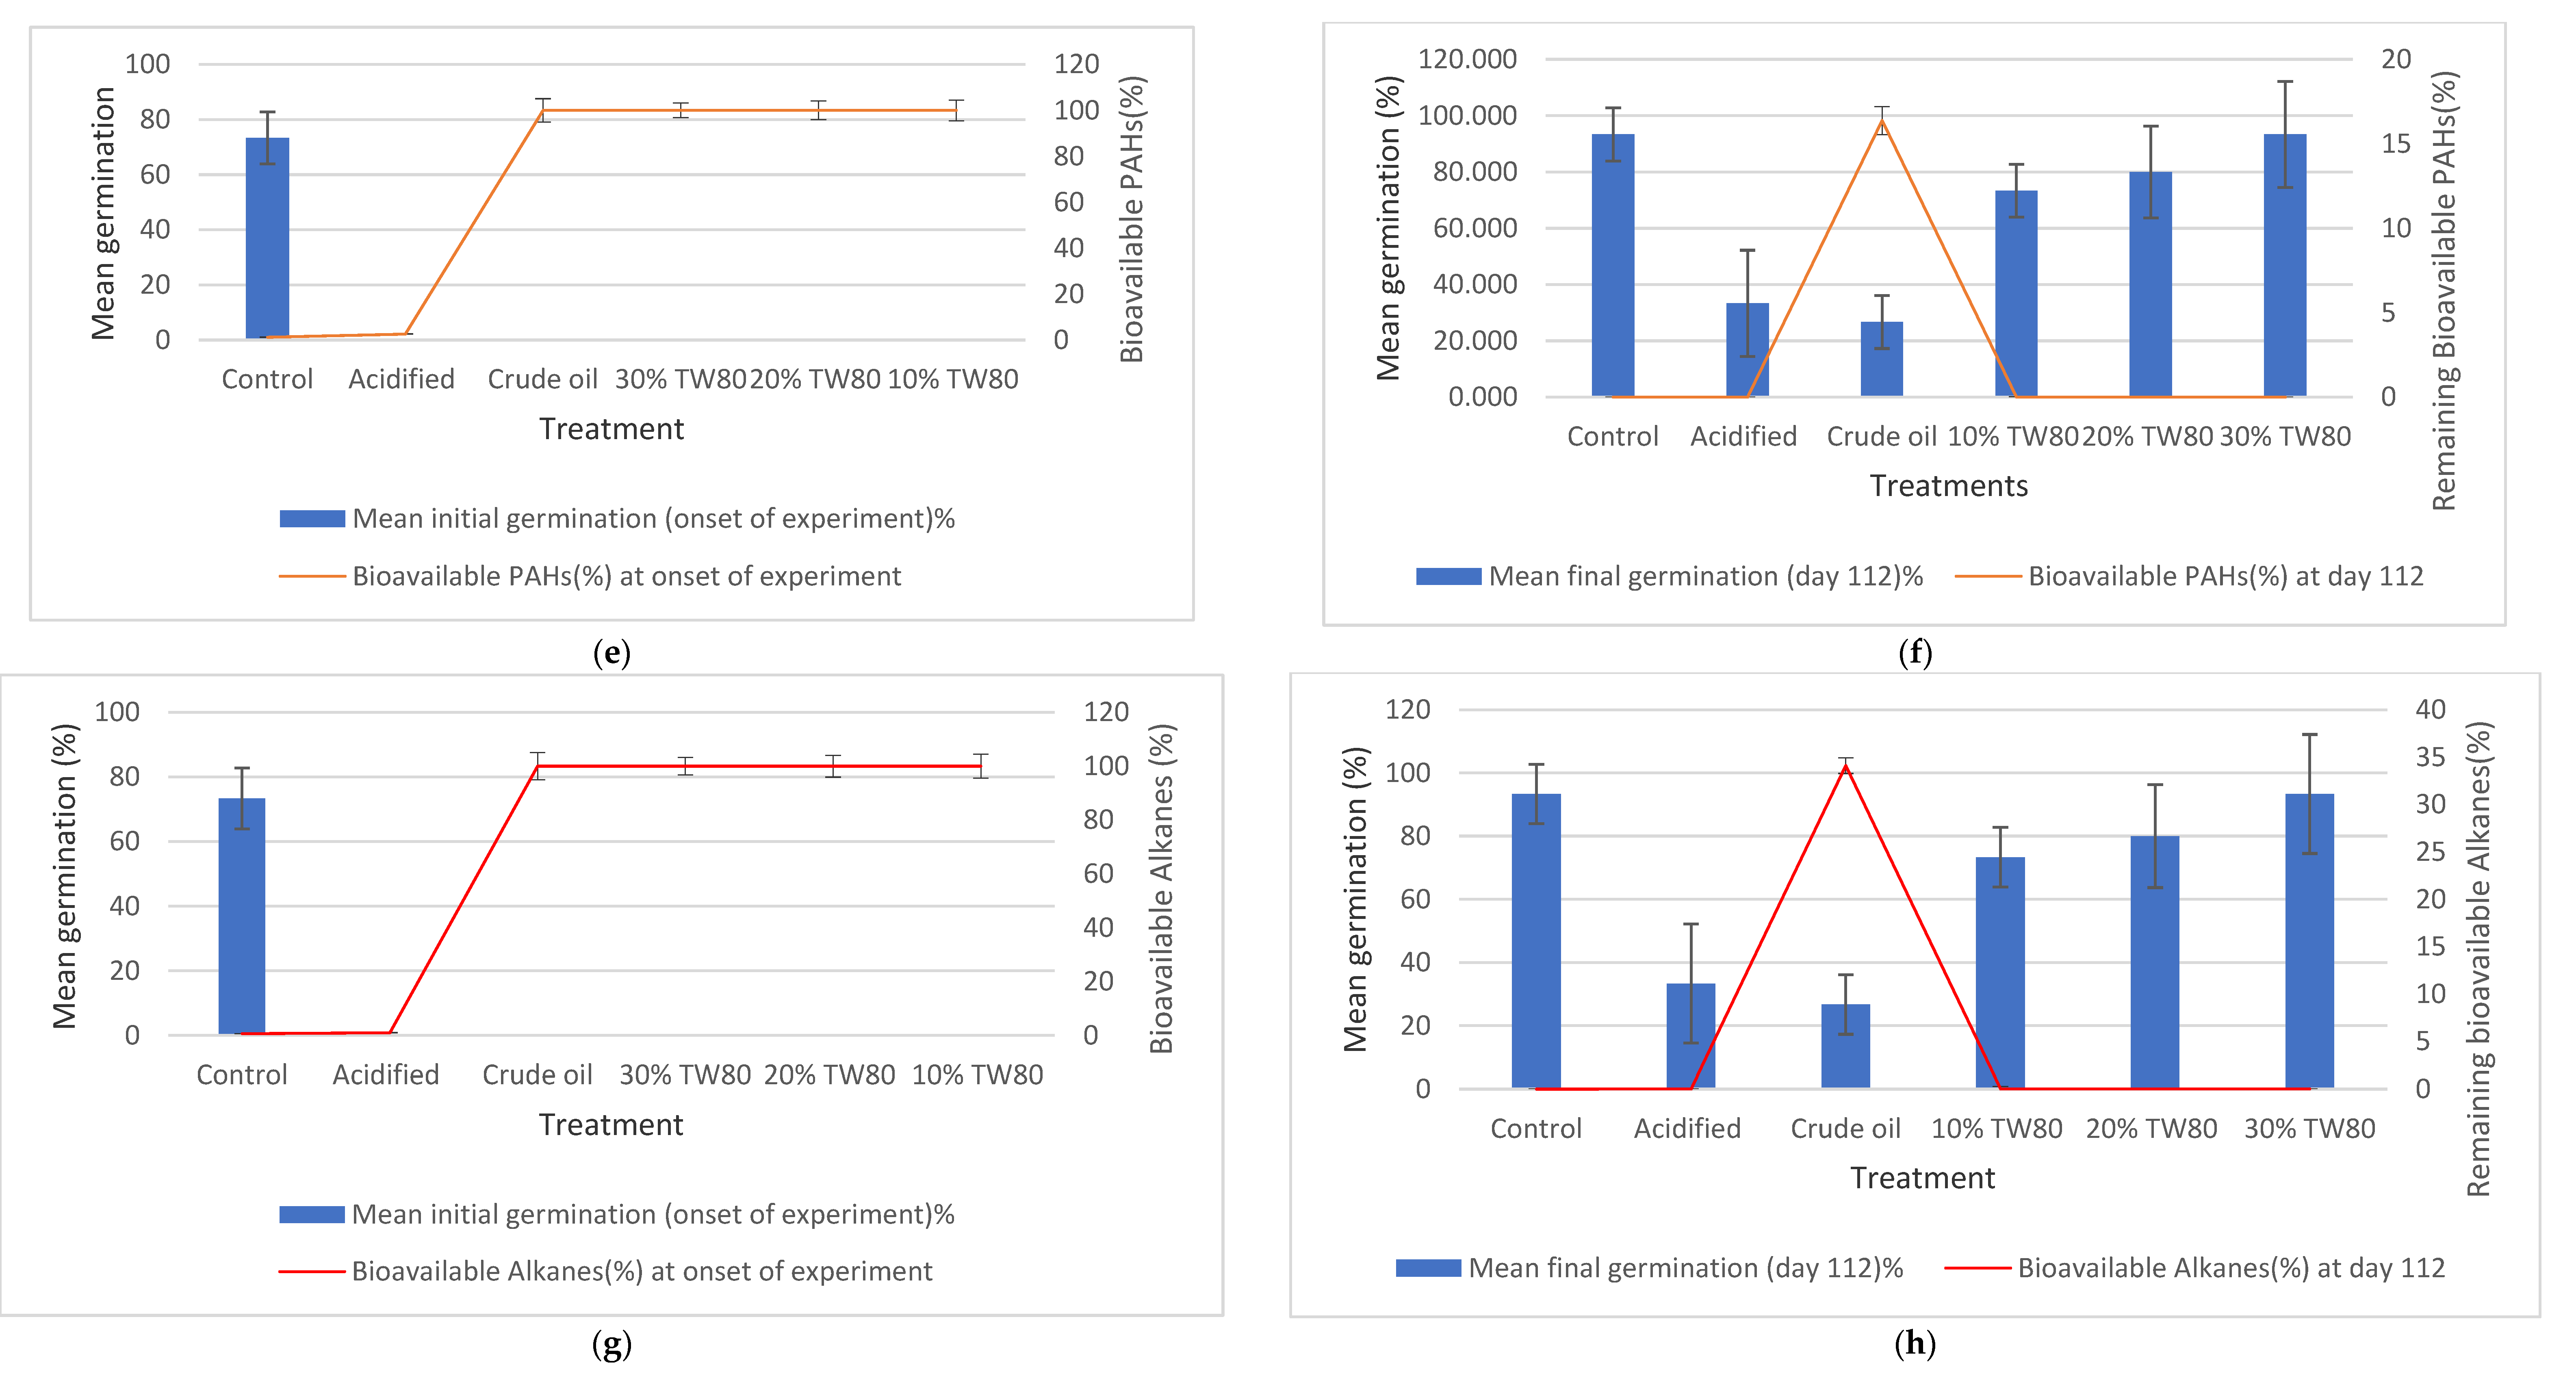
3.5. Remediation Endpoint

At the onset of the experiment, germination was only recorded at the control (pristine soil). The acidification of the soil to pH of 5.8 and spiking with crude oil increased the soil toxicity and inhibited the germination of the maize crops (Figure 5). This result corroborates the research of [101] on the response of crops to soil acidity. The researchers concluded that soil acidity severely affects crops’ root development and germination. The bioavailability of the PAHs and alkanes (from the spiked crude oil) to the maize crops may have increased the soil toxicity level leading to the no-germination recorded at the onset of the experiments (Figure 5). Bioavailability, the freely available fraction of contaminants in soil is an important feature in risk assessment as it explains contaminants partitioning and degradation in the environment [22]. Seed germination bioassays alongside bioavailability, despite being cost effective, have the potential to evaluate the establishment of the remediation endpoint [22,102,103].
On day 112 of the experiment, the highest germination was recorded at the 30% and 20% FWAD with 100% germination, while the 30% TW80 and the control had 93% germination and the crude oil mesocosms had 26% germination (Figure 5a,b,f,h). The above 90% germination in the various remediated mesocosms corroborates the low bioavailable PAHs and alkanes in the mesocosms. These agreed with the ecotoxicity evaluation research of [104] who stated that the response of crops to germination on polluted soils varies with ability of the nutrient to remediate contaminants from the soil. This implied that the FWAD and TW80 treatments aided in the recovery of the soil contaminated with crude oil. Overall, the extent of recovery shown by the soils through the maize germination and the low bioavailable alkanes and PAHs was an indication that remediation endpoint was achieved on day 112.

4. Conclusions

This research has shown that acidified wetlands contaminated by petroleum HCs can be effectively remediated using low carbon stimulants such as FWAD and TW80 surfactant. The Gram-positive bacteria were the dominant microbial group in the FWAD and TW80 surfactant mesocosms. The application of 30% FWAD, and 30% TW80 degraded the HCs contaminants in the acidified wetlands by 90% and 86.8% of TPH in 49 days, respectively. The 30% FWAD were the least metabolically stressed mesocosms, followed by 30% TW80 at the end of remediation when compared with the other mesocosms. Therefore, 30% FWAD and 30% TW80 mesocosms showed the least environmental toxicity to the soil ecosystems and achieved remediation endpoints faster. This conclusion was further confirmed by the more than 90% maize crops germination alongside no bioavailable HCs recorded at the end of the experiment in the 30% FWAD and 30% TW80 mesocosms. The extent and rate of HCs degradation was dependent on the CO2 generation rate from the basal respiration of the soil microbial communities since the HCs were mineralized by the microbes to generate the CO2.

Author Contributions

Conceptualization, F.C., I.B. and Y.J.; Methodology, T.C., I.A. and E.A.; Investigation, R.B.J.; Writing—original draft, R.B.J.; Writing—review & editing, F.C., I.B. and Y.J.; Supervision, F.C., I.B. and Y.J. All authors have read and agreed to the published version of the manuscript.

Funding

This research was funded by Nigeria Petroleum Technology Development Fund grant number P9161795477277231.

Institutional Review Board Statement

Not applicable.

Informed Consent Statement

Not applicable.

Data Availability Statement

Not applicable.

Conflicts of Interest

The authors declare no conflict of interest.

References

  1. Drake, H.L.; Horn, M.A.; Wüst, P.K. Intermediary ecosystem metabolism as a main driver of methanogenesis in acidic wetland soil. Environ. Microbiol. Rep. 2009, 1, 307–318. [Google Scholar] [CrossRef] [PubMed]
  2. Morse, J.L.; Ardón, M.; Bernhardt, E.S. Greenhouse gas fluxes in South-Eastern U.S. coastal plain wetlands under contrasting land uses. Ecol. Appl. 2012, 22, 264–280. [Google Scholar] [CrossRef] [PubMed]
  3. Nwankwoala, H.O.; Okujagu, D.C. A Review of Wetlands and Coastal Resources of the Niger Delta: Potentials, Challenges and Prospects. Environ. Ecosyst. Sci. 2014, 5, 37–46. [Google Scholar]
  4. Johnston, S.G.; Burton, E.D.; Aaso, T.; Tuckerman, G. Sulphur, iron and carbon cycling following hydrological restoration of acidic freshwater wetlands. Chem. Geol. 2014, 371, 9–26. [Google Scholar] [CrossRef]
  5. Ohimain, E.I. Environmental Impacts of oil mining activities in the Niger Delta Mangrove Ecosystem. In Proceedings of the 8th International Congress on Mine Water & the Environment, Johannesburg, South Africa; Nel, P.J.L., Ed.; International Mine Water Association: Granada, Spain, 2003; pp. 503–517. [Google Scholar]
  6. Konne, B.R. Inadequate monitoring and enforcement in the Nigerian oil industry: The case of shell and ogoniland. Cornell Int. Law J. 2014, 47, 181–204. [Google Scholar]
  7. Jeffries, D.S.; Brydges, T.G.; Dillon, P.J.; Keller, W. Monitoring the results of Canada / USA acid rain control programs: Some lake responses. Environ. Monit. Assess. 2003, 88, 3–19. [Google Scholar] [CrossRef]
  8. Singh, S.; Chakraborty, S. Performance of organic substrate amended constructed wetland treating acid mine drainage (AMD) of North-Eastern India. J. Hazard. Mater. 2020, 397, 122–130. [Google Scholar] [CrossRef]
  9. Ruley, J.A.; Amoding, A.; Tumuhairwe, J.B.; Basamba, T.A.; Opolot, E. Enhancing the phytoremediation of hydrocarbon-contaminated soils in the Sudd Wetlands, South Sudan, using organic manure. Appl. Environ. Soil Sci. 2020, 2020, 4614286. [Google Scholar] [CrossRef]
  10. Osuji, L.C.; Idung, I.D.; Ojinnaka, C.M. Preliminary investigation on Mgbede-20 oil-polluted site in Niger Delta, Nigeria. Chem. Biodivers. 2006, 3, 568–577. [Google Scholar] [CrossRef]
  11. Zhu, X.; Venosa, A.; Suidan, M.; Lee, K. Guidelines for the Bioremediation of Oil-Contaminated Salt Marshes. EPA, July 2004. pp. 1–61. Available online: http://edocs.dlis.state.fl.us/fldocs/oilspill/federal/LPS68040.pdf (accessed on 21 August 2021).
  12. Nwaichi, E.O.; Uzazobona, M.A. Estimation of the CO2 Level due to Gas Flaring in the Niger Delta. Res. J. Environ. Sci. 2011, 5, 565–572. [Google Scholar] [CrossRef] [Green Version]
  13. Osuji, C.; Adesiyan, S.O.; Obute, G.C. Post-impact assessment of oil pollution in agbada west plain of niger delta, nigeria: Field reconnaissance and total extractable hydrocarbon. Chem. Biodivers. 2004, 1, 1569–1578. [Google Scholar] [CrossRef] [PubMed]
  14. Sam, K.; Coulon, F.; Prpich, G. Working towards an integrated land contamination management framework for Nigeria. Sci. Total Environ. 2016, 571, 916–925. [Google Scholar] [CrossRef] [PubMed]
  15. Brown, D.M.; Bonte, M.; Gill, R.; Dawick, J.; Boogaard, P.J. Heavy hydrocarbon fate and transport in the environment. Q. J. Eng. Geol. Hydrogeol. 2017, 50, 333–346. [Google Scholar] [CrossRef]
  16. Robichaud, K.; Lebeau, M.; Martineau, S.; Amyot, M. Bioremediation of engine-oil contaminated soil using local residual organic matter. PeerJ 2019, 7, e7389. [Google Scholar] [CrossRef] [Green Version]
  17. Yu, Y.; Liu, L.; Yang, C.; Kang, W.; Yan, Z.; Zhu, Y.; Wang, J.; Zhang, H. Removal kinetics of petroleum hydrocarbons from low-permeable soil by sand mixing and thermal enhancement of soil vapor extraction. Chemosphere 2019, 236, 124319. [Google Scholar] [CrossRef]
  18. Ngene, S.; Tota-maharaj, K. Environmental technologies for remediation of contaminated lands in the Niger Delta region of Nigeria: Opportunities for ecosystem services to host. In Proceedings of the Environmental Design and Management International Conference, Ile-Ife, Nigeria, 2–22 May 2019; pp. 1–12. [Google Scholar]
  19. Okoye, A.U.; Chikere, C.B.; Okpokwasili, G.C. Isolation and Characterization of Hexadecane Degrading Bacteria from Oil-polluted soil in Gio Community, Niger Delta, Nigeria. Sci. Afr. 2020, 9, e00340. [Google Scholar] [CrossRef]
  20. Scanferla, P.; Ferrari, G.; Pellay, R.; Volpi-Ghirardini, A.; Zanetto, G.; Libralato, G. An innovative stabilization/solidification treatment for contaminated soil remediation: Demonstration project results. J. Soils Sediments 2009, 9, 229–236. [Google Scholar] [CrossRef] [Green Version]
  21. Ossai, I.C.; Hamid, F.S.; Hassan, A. Micronised keratinous wastes as co-substrates, and source of nutrients and microorganisms for trichoremediation of petroleum hydrocarbon polluted soil. Biocatal. Agric. Biotechnol. 2002, 43, 102346. [Google Scholar] [CrossRef]
  22. Cipullo, S.; Negrin, I.; Claveau, L.; Snapir, B.; Tardif, S.; Pulleyblank, C.; Prpich, G.; Campo, P.; Coulon, F. Linking bioavailability and toxicity changes of complex chemicals mixture to support decision making for remediation endpoint of contaminated soils. Sci. Total Environ. 2019, 650, 2150–2163. [Google Scholar] [CrossRef] [Green Version]
  23. Abdulyekeen, K.A.; Umar, A.A.; Patah, M.F.A.; Daud, W.M.A.W. Torrefaction of biomass: Production of enhanced solid biofuel from municipal solid waste and other types of biomass. Renew. Sustain. Energy Rev. 2021, 150, 111436. [Google Scholar] [CrossRef]
  24. Aghalibe, C.; Igwe, J.; Obike, A. Studies on the removal of petroleum hydrocarbons (PHCs) from a crude oil impacted soil amended with cow dung, poultry manure and npk fertilizer. Chemrj. Org. 2017, 2, 22–30. [Google Scholar]
  25. Lee, C.T.; Hashim, H.; Ho, C.S.; Fan, Y.V.; Klemeš, J.J. Sustaining the low-carbon emission development in Asia and beyond: Sustainable energy, water, transportation and low-carbon emission technology. J. Clean. Prod. 2017, 146, 1–13. [Google Scholar] [CrossRef] [Green Version]
  26. Ngene, S.; Tota-Maharaj, K. Effectiveness of Sand Filtration and Activated Carbon in Oilfield Wastewater Treatment. Int. J. Chem. Eng. Res. 2020, 7, 13–23. [Google Scholar] [CrossRef]
  27. Smidt, E.; Tintner, J.; Böhm, K.; Binner, E. Transformation of Biogenic Waste Materials through Anaerobic Digestion and subsequent composting of the residues. A case study. Dyn. Soil Dyn. Plant 2011, 5, 63–69. [Google Scholar]
  28. Peng, W.; Pivato, A. Sustainable Management of Digestate from the Organic Fraction of Municipal Solid Waste and Food Waste Under the Concepts of Back to Earth Alternatives and Circular Economy. Waste Biomass Valorization 2019, 10, 465–481. [Google Scholar] [CrossRef]
  29. Fernández-Bayo, J.D.; Achmon, Y.; Harrold, D.R.; McCurry, D.G.; Hernandez, K.; Dahlquist-Willard, R.M.; Simmons, C.W. Assessment of Two Solid Anaerobic Digestate Soil Amendments for Effects on Soil Quality and Biosolarization Efficacy. J. Agric. Food Chem. 2017, 65, 3434–3442. [Google Scholar] [CrossRef]
  30. Nkoa, R. Agricultural benefits and environmental risks of soil fertilization with anaerobic digestates: A review. Agron. Sustain. Dev. 2014, 34, 473–492. [Google Scholar] [CrossRef] [Green Version]
  31. Vaneeckhaute, C.; Meers, E.; Michels, E.; Christiaens, P.; Tack, F.M.G. Fate of macronutrients in water treatment of digestate using vibrating reversed osmosis. Water Air Soil Pollut. 2012, 223, 1593–1603. [Google Scholar] [CrossRef] [Green Version]
  32. Gielnik, A.; Pechaud, Y.; Huguenot, D.; Cébron, A.; Esposito, G.; van Hullebusch, E.D. Bacterial seeding potential of digestate in bioremediation of diesel contaminated soil. Int. Biodeterior. Biodegrad. 2019, 143, 104715. [Google Scholar] [CrossRef]
  33. Bustamante, M.; Durán, N.; Diez, M.C. Biosurfactants are useful tools for the bioremediation of contaminated soil: A review. J. Soil Sci. Plant Nutr. 2012, 12, 667–687. [Google Scholar] [CrossRef] [Green Version]
  34. Gielnik, A.; Pechaud, Y.; Huguenot, D.; Esposito, G.; Guibaud, G.; van Hullebusch, E.D. Potential Use of Waste-to-Bioenergy By-Products in Bioremediation of Total Petroleum Hydrocarbons (TPH)-Contaminated Soils. In Environmental Soil Remediation and Rehabilitation; Springer: Berlin/Heidelberg, Germany, 2020; ISBN 978-3-030-40347-8. [Google Scholar]
  35. Silva, F.B.; Pereira, F.L.; Le-Hyaric, M. A Comparison of the physicochemical properties and fatty acid composition of Indaiá (Attalea dubia) and Babassu (Orbignya phalerata) oils. Sci. World J. 2012, 2012, 532374. [Google Scholar] [CrossRef] [Green Version]
  36. Andrew, R. Using quality anaerobic digestate to benefit crops Nutrients in digestate are valuable. Soil Crops 2012, 9, 1–12. [Google Scholar]
  37. Yu, A.I.; Geletukha, G.G.; Kucheruk, P.P. Digestate Potential to Substitute Mineral Fertilizers: Engineering Approaches. J. Eng. Sci. 2022, 9, 1–10. [Google Scholar]
  38. Opatokun, S.A.; Strezov, V.; Kan, T. Product based evaluation of pyrolysis of food waste and its digestate. Energy 2015, 92, 349–354. [Google Scholar] [CrossRef]
  39. Sung, K.; Kim, K.S.; Park, S.; Sung, K.; Kim, K.S.; Park, S. Enhancing degradation of total petroleum hydrocarbons and uptake of heavy metals in a wetland microcosm planted with phragmites communis by humic acids addition. Int. J. Phytoremediation 2013, 15, 536–549. [Google Scholar] [CrossRef]
  40. Wang, X.; Sun, L.; Wang, H.; Wu, H.; Chen, S.; Zheng, X. Surfactant-enhanced bioremediation of DDTs and PAHs in contaminated farmland soil. Environ. Technol. Taylor Fr. 2018, 39, 1733–1744. [Google Scholar] [CrossRef]
  41. Cheng, M.; Zeng, G.; Huang, D.; Yang, C.; Lai, C.; Zhang, C.; Liu, Y. Tween 80 surfactant-enhanced bioremediation: Toward a solution to the soil contamination by hydrophobic organic compounds. Crit. Rev. Biotechnol. 2018, 38, 17–30. [Google Scholar] [CrossRef] [PubMed]
  42. Seo, Y.; Bishop, P.L. Influence of nonionic surfactant on attached biofilm formation and phenanthrene bioavailability during simulated surfactant enhanced bioremediation. Environ. Sci. Technol. 2007, 41, 7107–7113. [Google Scholar] [CrossRef]
  43. Ceschia, E.; Harjani, J.R.; Liang, C.; Ghoshouni, Z.; Andrea, T.; Brown, R.S.; Jessop, P.G. Switchable anionic surfactants for the remediation of oil-contaminated sand by soil washing. RSC Adv. 2014, 4, 4638–4645. [Google Scholar] [CrossRef]
  44. Nduka, J.K.C.; Orisakwe, O.E.; Ezenweke, L.O.; Ezenwa, T.E.; Chendo, M.N.; Ezeabasili, N.G. Acid rain phenomenon in Niger Delta region of Nigeria: Economic, biodiversity, and public health concern. Sci. World J. 2008, 8, 811–818. [Google Scholar] [CrossRef] [Green Version]
  45. Onu, P.U.; Quan, X.; Ling, X. Acid rain: An analysis on the cause, impacts and abatement measures Niger Delta perspective, Nigeria. Int. J. Sci. Eng. Res. 2014, 5, 1214–1219. [Google Scholar]
  46. Chidinma Peace Okafor, N.L.; Chikere, C.B.; Akaranta, O.; Ntushelo, K. Indigenous microbial strains as bioresource for remediation of chronically polluted Niger Delta soils. Sci. Afr. 2021, 11, e00682. [Google Scholar]
  47. Ugochukwu, U.C.; Ochonogor, A.; Jidere, C.M.; Agu, C.; Nkoloagu, F.; Ewoh, J.; Okwu-delunzu, V.U. Exposure risks to polycyclic aromatic hydrocarbons by humans and livestock (cattle ) due to hydrocarbon spill from petroleum products in Niger-delta wetland’, Environment International. Elsevier 2018, 115, 38–47. [Google Scholar] [CrossRef] [PubMed]
  48. Fubara-Manuel, I.; Igoni, A.H.; Jumbo, R.B. Performance of irrigated maize in a crude-oil polluted soil remediated by three nutrients in Nigeria’s Niger Delta. Am. J. Eng. Res. 2017, 6, 180–185. [Google Scholar]
  49. Nwankwo, C.A. Using Compost to Reduce Oil Contamination in Soils. Chindo Anulika Nwankwo Submitted in Accordance with the Requirements for the Degree of Doctor of Philosophy; The University of Leeds School of Civil Engineering: Leeds, UK, 2014. [Google Scholar]
  50. Trinchera, A.; Baratella, V. Use of a non-ionicwater surfactant in lettuce fertigation for optimizingwater use, improving nutrient use efficiency, and increasing crop quality. Water 2018, 10, 613. [Google Scholar] [CrossRef] [Green Version]
  51. British Standard (BS), 7755: Section 3.1; Soil Quality—Determination Dry Matter and Water Content on a Mass Basis by a Gravimetric Method. British Standards Institution Publications: London, UK, 1994.
  52. British Standard, EN 13039; Determination of the Organic Matter Content and Ash. British Standards Institution Publications: London, UK, 2000.
  53. British Standard BS 7755 Section 5.5; Water Retention Characteristics. British Standards Institution Publications: London, UK, 1999.
  54. British Standard BS 11277; Determination of Particle Size Distribution in Mineral Soil Material. British Standards Institution Publications: London, UK, 2009.
  55. International Organization for Standardization. ISO Standard No 11277:2009; Soil Quality Determination of Particle Size Distribution in Mineral Soil Material: Method by Sieving and Sedimentation. International Organization for Standardization: Geneva, Switzerland, 2009.
  56. British Standard, 7755: Section 3.6; Determination of Phosphorus. British Standards Institution Publications: London, UK, 1995.
  57. British Standard, 3882: (Annexes D, E & G); Determination of Potassium and Magnesium. British Standards Institution Publications: London, UK, 1994.
  58. British Standard, 7755 Section 3.8; Determination of Organic and Total Carbon after Dry Combustion. British Standards Institution Publications: London, UK, 1995.
  59. He, L.; Xu, X. Mapping soil microbial residence time at the global scale. Glob. Change Biol. 2021, 27, 6484–6497. [Google Scholar] [CrossRef]
  60. Pawlett, M.; Ritz, K.; Dorey, R.A.; Rocks, S.; Ramsden, J.; Harris, J.A. The impact of zero-valent iron nanoparticles upon soil microbial communities is context dependent. Environ. Sci. Pollut. Res. 2013, 20, 1041–1049. [Google Scholar] [CrossRef] [Green Version]
  61. Ritz, K.; Harris, M.; Pawlett, M.; Stone, D. Catabolic profiles as an indicator of soil microbial functional diversity. In Environment Agency Science Report, SC040063/R; Environment Agency: Bristol, UK, 2006. [Google Scholar]
  62. Frostegård, A.; Bååth, E. Phospholipid fatty acid composition, biomass, and activity of microbial communities from two soil types experimentally exposed to different heavy metals. Appl. Environ. Microbiol. 1993, 59, 3605–3617. [Google Scholar] [CrossRef] [Green Version]
  63. Dowling, N.J.E.; White, D.C. Phospholipid ester linked fatty acid biomarkers of acetate-oxidising sulphate reducers and other sulphate forming bacteria. J. Gen. Microbiol. 1986, 132, 1815–1825. [Google Scholar]
  64. Quideau, S.A.; McIntosh, A.C.S.; Norris, C.E.; Lloret, E.; Swallow, M.J.B.; Hannam, K. Extraction and analysis of microbial Phospholipid fatty acids in soils. J. Vis. Exp. 2016, 114, 54360. [Google Scholar] [CrossRef]
  65. Varjani, S.; Upasani, V.N. Influence of abiotic factors, natural attenuation, bioaugmentation and nutrient supplementation on bioremediation of petroleum crude contaminated agricultural soil. J. Environ. Manag. 2019, 245, 358–366. [Google Scholar] [CrossRef] [PubMed]
  66. Risdon, G.C.; Pollard, S.J.T.; Brassington, K.J.; McEwan, J.N.; Paton, G.I.; Semple, K.T.; Coulon, F. Development of an analytical procedure for weathered hydrocarbon contaminated soils within a UK risk-based framework. Anal. Chem. 2008, 80, 7090–7096. [Google Scholar] [CrossRef] [PubMed]
  67. British Standard, BS 7755: Section 3.13; Determination of Elements Soluble in Aqua Regia. British Standards Institution Publications: London, UK, 1998.
  68. US EPA Method 3051; Determination of Elements Soluble in Aqua Regia. U.S. Environmental Protection Agency: Washington, DC, USA, 2007.
  69. Baek, K.; Kim, H.; Oh, H.; Yoon, B.; Kim, J.; Lee, I. Effects of Crude Oil, Oil Components, and Bioremediation on Plant Growth. J. Environ. Sci. Health 2004, 39, 2465–2472. [Google Scholar] [CrossRef] [PubMed]
  70. Maliszewska-Kordybach, B.; Smreczak, B. Habitat function of agricultural soils as affected by heavy metals and polycyclic aromatic hydrocarbons contamination. Environ. Int. 2003, 28, 719–728. [Google Scholar] [CrossRef]
  71. Nyagumbo, I.; Mkuhlani, S.; Pisa, C.; Kamalongo, D.; Dias, D.; Mekuria, M. Maize yield effects of conservation agriculture based maize–legume cropping systems in contrasting agro-ecologies of Malawi and Mozambique. Nutr. Cycl. Agroecosystems 2016, 105, 275–290. [Google Scholar] [CrossRef]
  72. Masoni, A.; Mariotti, M.; Ercoli, L. Maize growth and nutrient uptake as affected by root zone volume. Ital. J. Agron. 2002, 1, 95–102. [Google Scholar]
  73. Chen, X.; Chen, H.Y.H. Plant mixture balances terrestrial ecosystem C:N:P stoichiometry. Nat. Commun. 2021, 12, 4562. [Google Scholar] [CrossRef]
  74. US EPA 5401R; A guide for corrective action plan reviewers, land and emergency management. United States Environmental Protection Agency: Washington, DC, USA, 1994.
  75. Griffiths, B.S.; Spilles, A.; Bonkowski, M. C:N:P stoichiometry and nutrient limitation of the soil microbial biomass in a grazed grassland site under experimental P limitation or excess. Ecol. Process. 2012, 1, 6. [Google Scholar] [CrossRef] [Green Version]
  76. Chintala, R.; Mollinedo, J.; Schumacher, T.E.; Malo, D.D.; Julson, J.L. Effect of biochar on chemical properties of acidic soil. Arch. Agron. Soil Sci. 2014, 60, 393–404. [Google Scholar] [CrossRef]
  77. Ning, D.; Liang, Y.; Liu, Z.; Xiao, J.; Duan, A. Impacts of steel-slag-based silicate fertilizer on soil acidity and silicon availability and metals-immobilization in a paddy soil. PLoS ONE 2016, 11, e0168163. [Google Scholar] [CrossRef] [Green Version]
  78. Abu, G.O.; Dike, P.O. A study of natural attenuation processes involved in a microcosm model of a crude oil-impacted wetland sediment in the Niger Delta. Bioresour. Technol. 2008, 99, 4761–4767. [Google Scholar] [CrossRef] [PubMed]
  79. Idzi, A.A.; Saleh, S.A.; Igboanusi, P. Chemical composition analysis of soil from selected oil producing communities in the Niger delta region of Nigeria. Int. J. Basic Appl. Chem. Sci. 2013, 3, 84–92. [Google Scholar]
  80. Kaur, A.; Chaudhary, A.; Kaur, A.; Choudhary, R.; Kaushik, R. Phospholipid fatty acid—A bioindicator of environment monitoring and assessment in soil ecosystem. Curr. Sci. 2005, 89, 1103–1112. [Google Scholar]
  81. Sándor, Z. Comparison of effects exerted by bio—Fertilizers, npk fertilizers, and cultivation methods on soil respiration in c hernozem soil. Rev. Cienc. Vida 2020, 32, 8–18. [Google Scholar]
  82. Henryson, K.; Sundberg, C.; Kätterer, T.; Hansson, P.A. Accounting for long-term soil fertility effects when assessing the climate impact of crop cultivation. Agric. Syst. 2018, 164, 185–192. [Google Scholar] [CrossRef]
  83. St.Clair, S.B.; Lynch, J.P. The opening of Pandora’s Box: Climate change impacts on soil fertility and crop nutrition in developing countries. Plant Soil 2010, 335, 101–115. [Google Scholar] [CrossRef]
  84. Song, X.; Zhu, Y.; Chen, W. Dynamics of the soil respiration response to soil reclamation in a coastal wetland. Sci. Rep. 2021, 11, 2911. [Google Scholar] [CrossRef]
  85. Jiang, Y.; Brassington, K.J.; Prpich, G.; Paton, G.I.; Semple, K.T.; Pollard, S.J.T.; Coulon, F. Insights into the biodegradation of weathered hydrocarbons in contaminated soils by bioaugmentation and nutrient stimulation. Chemosphere 2016, 161, 300–307. [Google Scholar] [CrossRef] [Green Version]
  86. Lazaroaie, M.M. Multiple responses of gram-positive and gram-negative bacteria to mixture of hydrocarbons. Braz. J. Microbiol. 2010, 41, 649–667. [Google Scholar] [CrossRef]
  87. Zhang, X.; Chen, Q.; Wang, C.; Zhang, H.; Zhao, Y.; Zhang, L.; Zhou, Q. Characteristic analysis of phospholipid fatty acids (PLFAs) in typical nutrient polluted lake sediment in Wuhan. Int. J. Sediment Res. 2021, 36, 221–228. [Google Scholar] [CrossRef]
  88. Dunfield, K.E. Lipid-Based Community Analysis. In Soil Sampling and Methods of Analysis; Carter, M.R., Gregorich, E.G., Eds.; CRC Press: Boca Raton, FL, USA, 2007; p. 587. [Google Scholar]
  89. Lewe, N.; Hermans, S.; Lear, G.; Kelly, L.T.; Thomson-laing, G.; Weisbrod, B.; Deslippe, J.R. Phospholipid fatty acid (PLFA) analysis as a tool to estimate absolute abundances from compositional 16S rRNA bacterial metabarcoding data. J. Microbiol. Methods 2021, 188, 106–271. [Google Scholar] [CrossRef] [PubMed]
  90. Fischer, J.; Schauer, F.; Heipieper, H.J. The trans/cis ratio of unsaturated fatty acids is not applicable as biomarker for environmental stress in case of long-term contaminated habitats. Appl. Microbiol. Biotechnol. 2010, 87, 365–371. [Google Scholar] [CrossRef]
  91. Frostegård, Å.; Tunlid, A.; Bååth, E. Soil Biology & Biochemistry Use and misuse of PLFA measurements in soils. Soil Biol. Biochem. 2011, 43, 1621–1625. [Google Scholar] [CrossRef]
  92. Trögl, J.; Pavlorková, J.; Packová, P.; Seják, J.; Kuráň, P.; Popelka, J.; Pacina, J. Indication of importance of including soil microbial characteristics into biotope valuation method. Sustainability 2016, 8, 253. [Google Scholar] [CrossRef]
  93. Feng, L.; Jiang, X.; Huang, Y.; Wen, D.; Fu, T. Petroleum hydrocarbon-contaminated soil bioremediation assisted by isolated bacterial consortium and sophorolipid. In Environmental Pollution, 273; Elsevier Ltd.: Amsterdam, The Netherlands, 2021; p. 116476. [Google Scholar]
  94. Wei, Z.; Wang, J.J.; Gaston, L.A.; Li, J.; Fultz, L.M.; DeLaune, R.D.; Dodla, S.K. Remediation of crude oil-contaminated coastal marsh soil: Integrated effect of biochar, rhamnolipid biosurfactant and nitrogen application. J. Hazard. Mater. 2020, 396, 122595. [Google Scholar] [CrossRef]
  95. Wartell, B.; Boufadel, M.; Rodriguez-Freire, L. An effort to understand and improve the anaerobic biodegradation of petroleum hydrocarbons: A literature review. Int. Biodeterior. Biodegrad. 2021, 157, 105156. [Google Scholar] [CrossRef]
  96. Gielnik, A.; Pechaud, Y.; Huguenot, D.; Cébron, A.; Esposito, G.; van-Hullebusch, E.D. Functional potential of sewage sludge digestate microbes to degrade aliphatic hydrocarbons during bioremediation of a petroleum hydrocarbons contaminated soil. J. Environ. Manag. 2021, 280, 381–397. [Google Scholar] [CrossRef]
  97. Jin, C.E.; Kim, M.N. Change of bacterial community in oil-polluted soil after enrichment cultivation with low-molecular-weight polyethylene. Int. Biodeterior. Biodegrad. 2017, 118, 27–33. [Google Scholar] [CrossRef]
  98. Powell, S.M.; Ferguson, S.H.; Bowman, J.P.; Snape, I. Using real-time PCR to assess changes in the hydrocarbon-degrading microbial community in Antarctic soil during bioremediation. Microb. Ecol. 2006, 52, 523–532. [Google Scholar] [CrossRef]
  99. Iqbal, M.K.; Shafiq, T.; Ahmed, K. Characterization of bulking agents and its effects on physical properties of compost. Bioresour. Technol. 2010, 101, 1913–1919. [Google Scholar] [CrossRef]
  100. Huang, L.; Ye, J.; Jiang, K.; Wang, Y.; Li, Y. ‘Oil contamination drives the transformation of soil microbial communities: Co-occurrence pattern, metabolic enzymes and culturable hydrocarbon-degrading bacteria. Ecotoxicol. Environ. Saf. 2021, 225, 112–140. [Google Scholar] [CrossRef] [PubMed]
  101. Sierra, J.; Noël, C.; Dufour, L.; Ozier-Lafontaine, H.; Welcker, C.; Desfontaines, L. Mineral nutrition and growth of tropical maize as affected by soil acidity. Plant Soil 2003, 252, 215–226. [Google Scholar] [CrossRef]
  102. Khaled, H.; Fawy, H. Effect of different Levels of humic acids on the nutrient content, plant growth, and soil properties under conditions of salinity. Soil Water Res. 2011, 6, 21–29. [Google Scholar] [CrossRef] [Green Version]
  103. Wang, L.; Li, F.; Zhan, Y.; Zhu, L. Shifts in microbial community structure during in situ surfactant-enhanced bioremediation of polycyclic aromatic hydrocarbon-contaminated soil. Environ. Sci. Pollut. Res. 2016, 23, 14451–14461. [Google Scholar] [CrossRef] [PubMed]
  104. Nwankwegu, A.S.; Orji, M.U.; Onwosi, C.O. Chemosphere Studies on organic and in-organic biostimulants in bioremediation of diesel-contaminated arable soil. Chemosphere 2016, 162, 148–156. [Google Scholar] [CrossRef] [PubMed]
Figure 1. Cumulative respiration (CO2 µg/g soil) per day for various mesocosms. (a) Soil cumulative respiration per day for FWAD mesocosms; (b) Soil cumulative respiration per day for TW80 mesocosms.
Sustainability 14 16568 g001
Figure 2. Soil microbial communities’ dynamics based on PLFA abundance changes. (a) FWAD mesocosms; (b) TW80 mesocosms.
Sustainability 14 16568 g002
Figure 3. Cis/trans ratio for FWAD and TW80 mesocosms.
Sustainability 14 16568 g003
Figure 4. Total and bioavailable hydrocarbon fractions degradation. (a) Total TPH degradation for TW80 mesocosms; (b) Total TPH degradation for FWAD mesocosms; (c) Available TPH for TW80 mesocosms; (d) Available TPH for FWAD mesocosms.
Sustainability 14 16568 g004
Figure 5. Mean germination of maize crops and bioavailable HCs for various mesocosms. (a) Mean initial germination and bioavailable PAHs for FWAD; (b) Mean final germination and bioavailable PAHs for FWAD; (c) Mean initial germination and bioavailable alkanes for FWAD; (d) Mean final germination and bioavailable PAHs for FWAD; (e) Mean initial germination and bioavailable PAHs for TW80; (f) Mean final germination and bioavailable PAHs for TW80; (g) Mean initial germination and bioavailable alkanes for TW80; (h) Mean final germination and bioavailable alkanes for TW80.
Sustainability 14 16568 g005aSustainability 14 16568 g005b
Table 1. Overview of the biostimulation treatments evaluated along with the controls.
Mesocosm ConditionsAbbreviations
Pristine soil (freshly collected from field)Control
Pristine soil acidified at pH 5.8 (using HNO3)Acidified
Pristine soil acidified at pH 5.8 and spiked at 50,000 mg/kg with crude oilCrude oil
Pristine soil acidified at pH 5.8 and spiked at 50,000 mg/kg with crude oil + 10% (w/w) FW digestate10% FWAD
Pristine soil acidified at pH 5.8 and spiked at 50,000 mg/kg with crude oil + 20% (w/w) FW digestate20% FWAD
Pristine soil acidified at pH 5.8 and spiked at 50,000 mg/kg with crude oil + 30% (w/w) FW digestate30% FWAD
Pristine soil acidified at pH 5.8 and spiked at 50,000 mg/kg with crude oil + 10% (w/w) Tween 8010% TW80
Pristine soil acidified at pH 5.8 and spiked at 50,000 mg/kg with crude oil + 20% (w/w) Tween 8020% TW80
Pristine soil acidified at pH 5.8 and spiked at 50,000 mg/kg with crude oil + 30% (w/w) Tween 8030% TW80
Table 2. Physical characteristics of the pristine soil used in the mesocosm experiment.
Soil Physicochemical Characteristics
Soil Moisture content (%)13.75
Loss on ignition (%)3.66
Dry matter content (%)86.25
Water holding capacity (%)54.54
TOC (%)3.09
Org C (%)2.25
TN (%)0.12
TP (mg/kg)5.58
TK (mg/kg)236.00
Soil Particle size distribution
Sand (%)46.67
Silt (%)45.89
Clay (%)7.44
FWAD characteristics
TOC (%)17.22
Org C (%)4.97
TN (%)0.98
TP (mg/kg)300.25
TK (mg/kg)8107.50
C:N: P250:13:1
Table 3. Mean chemical properties and bacteria count of soils in the various triplicate mesocosms.
MesocosmTreatmentK (mg/kg)C: N: PBacteria Count
(×105 CFU/g)
FWAD10% FWAD1310.00 ± 2.1128:9:120 ± 0.48
20% FWAD1694.17 ± 2.3167:10:110 ± 0.4
30% FWAD1806.67 ± 2.9180:9:130 ± 0.47
TW8010% TW80224.75 ± 1.660:2:11 ± 0.32
20% TW80151.58 ± 1.9865:2:13 ± 0.48
30% TW80141.50 ± 1.775:3:14 ± 0.48
ControlsControl236.00 ± 2.260:2:1102 ± 0.8
Acidified243.83 ± 3.158:4:12 ± 0.4
Crude oil157.08 ± 1.660:2:17 ± 0.48
Table 4. Soil basal respiration versus PAHs degradation models and degradation rates.
MesocosmsTreatmentSlope equationR2Degradation Rates (mgCO2/mg PAHs/Day)
FWAD10% FWADy = −0.2741x + 513.830.98−0.27
20% FWADy = −0.3282x + 688.550.97−0.33
30% FWADy = −0.45x + 819.330.97−0.45
TW8010% TW80y = −0.3672x + 721.460.92−0.37
20% TW80y = −0.412x + 726.830.97−0.41
30% TW80y = −0.5206x + 867.580.98−0.52
ControlAcidified HCsy = −0.2433x + 469.520.90−0.24
Where y = basal respiration rate and x = PAH degradation rate.
Table 5. Soil basal respiration versus alkanes degradation models and degradation rates.
MesocosmsTreatmentSlope EquationR2Degradation Rates
(mgCO2/mg Alkanes/Day)
FWAD10% FWADy= −0.2x + 744.60.97−0.2
20% FWADy= −0.31x + 1182.30.97−0.31
30% FWADy= −0.416x + 1363.70.91−0.42
TW8010% TW80y= −0.18x + 789.10.95−0.18
20% TW80y= −0.32x + 1022.40.94−0.32
30% TW80y= −0.34x + 1421.10.96−0.34
ControlAcidified HCsy= −0.15x + 752.40.96−0.15
Where y = basal respiration rate and x = alkanes degradation rate.
Table 6. Baseline mean concentrations of metal and metalloid and standard deviation in triplicates soil samples.
Metal (Loid) (mg/kg)ControlAcidifiedCrude OilFWAD
Mo0.93 ± 0.081.27 ± 0.131.21 ± 0.071.20 ± 0.49
Cr45.24 ± 1.2359.56 ± 2.9450.87 ± 1.5036.05 ± 2.17
Ni29.65 ± 1.2442.60 ± 0.9335.25 ± 0.7923.79 ± 1.58
As14.83 ± 0.9820.21 ± 0.7417.18 ± 0.7810.13 ± 0.52
Cd0.59 ± 0.090.83 ± 0.090.73 ± 0.070.72 ± 0.10
Pb17.00 ± 0.9123.31 ± 0.4521.41 ± 0.815.62 ± 0.94
Hg0.29 ± 0.010.12 ± 0.010.12 ± 0.020.14 ± 0.04
Table 7. Correlation between basal respiration and TPH degradation.
TreatmentSpearman Coefficient (ɤ)Prob > |p|Correlation Strength
Control0.8104<0.0001++++++++
Acidified0.87<0.0001+++++++++
Crude oil0.8805<0.0001+++++++++
10% TW800.8395<0.0001++++++++
20% TW800.8732<0.0001+++++++++
30% TW800.8949<0.0001+++++++++
10% FWAD0.8588<0.0001+++++++++
20% FWAD0.8358<0.0001++++++++
30% FWAD0.8327<0.0001++++++++
Table 8. Mean alkanes concentrations (c) and percentage degradations for C11–C18 alkanes.
Alkane GroupInitial AlkanesPercentage Degradation (%) on Day 112
C11–C18(mg/kg)Crude
Oil
10%
FWAD
20%
FWAD
30%
FWAD
10%
TW80
20%
TW80
30%
TW80
Undecane2339.093.799.799.899.899.799.799.8
Dodecane1226.259.899.399.599.799.399.499.6
Tridecane1710.574.899.799.799.899.699.799.8
Tetradecane1658.968.599.699.699.799.599.599.6
Pentadecane1669.267.499.599.599.599.399.499.6
Hexadecane1597.162.899.299.299.398.299.299.3
Heptadecane1648.675.198.798.799.398.798.298.8
Octadecane1576.565.298.298.298.598.498.498.5
Overall % degradation 70.999.299.399.599.199.299.4
Table 9. Mean alkanes concentrations and percentage degradations for C19–C39 alkane groups.
Alkane GroupInitial Alkanes Percentage Degradation (%) on Day 112
C19–C37(mg/kg)Crude
Oil
10%
FWAD
20%
FWAD
30%
FWAD
10%
TW80
20%
TW80
30%
TW80
Pristane1100.080.090.891.796.491.894.996.3
Phytane1151.882.591.092.296.490.495.596.6
Nonadecane1296.975.891.994.696.191.493.896.7
Eicosane1416.375.591.792.395.691.394.397.2
Heneicosane1714.981.293.093.695.389.594.596.5
Docosane1808.875.490.493.296.690.694.395.0
Tricosane1798.979.490.292.496.190.094.495.0
Tetracosane1775.777.789.892.693.189.395.096.5
Pentacosane1743.979.389.693.094.589.194.295.9
Hexacosane1890.377.388.793.294.286.594.494.9
Heptacosane1070.969.771.887.890.568.990.592.3
Octacosane1936.879.583.191.794.180.089.894.9
Nonacosane1953.878.483.587.789.774.589.394.9
Triacontane1612.567.774.879.287.367.386.293.8
Hentriacontane1569.966.973.975.381.065.077.084.7
Dotriacontane1313.945.260.662.681.855.461.681.0
Tritriacontane1058.022.351.152.872.743.551.678.0
Tetratriacontane1183.638.656.558.781.244.648.565.0
Pentatriacontane1245.735.658.660.081.145.750.355.9
Hexatriacontane1176.432.356.257.778.942.343.944.9
Heptatriacontane1254.620.459.361.768.444.346.648.1
Overall % degradation 63.877.981.188.672.980.085.4
Table 10. Mean alkanes concentrations and percentage degradations for C10–C18 PAH groups.
PAH GroupInitial PAHsPercentage Degradation (%) on Day 112
C10–C18(mg/kg)Crude
Oil
10%
FWAD
20%
FWAD
30%
FWAD
10%
TW80
20%
TW80
30%
TW80
Naphthalene224.191.499.999.999.999.999.999.9
Fluorene458.591.699.199.999.999.999.999.9
Phenanthrene931.195.599.999.999.999.999.999.9
Anthracene297.296.799.799.999.999.399.199.9
Pyrene67.987.998.599.999.997.098.199.9
Benz(a)anthracene212.390.498.699.999.998.198.999.5
Chrysene356.688.898.699.999.998.099.499.0
Overall % degradation 91.899.299.999.998.999.199.7
Table 11. Mean alkanes concentrations and percentage degradations for C19–C22 PAH groups.
PAH GroupInitial PAHsPercentage Degradation (%) on Day 112
C19–C22(mg/kg)Crude
Oil
10% FWAD20% FWAD30% FWAD10% TW8020%
TW80
30% TW80
Benzo[b]fluoranthene334.893.099.199.999.999.099.999.9
Benzo[k]fluoranthene18693.599.399.699.799.099.299.9
Benz(a)pyrene176.787.399.199.799.998.499.499.9
Benzo(ghi)perylene818.489.499.199.799.798.199.199.6
Benzo[b)triphenylene604.589.899.399.499.798.099.199.7
Indeno(123)[cd]pyrene344.186.598.599.299.897.998.999.1
Overall % degradation 89.999.199.699.898.499.399.7
Publisher’s Note: MDPI stays neutral with regard to jurisdictional claims in published maps and institutional affiliations.

