1. Introduction
The financial crisis of 2008–2009 and the Great Recession profoundly shook the world and shaped the economic, political, and social development in the following years. One of the fields that felt the repercussions was football. Nominally, “the beautiful game” sailed unscathed through the recession, with European top-division clubs growing revenues by 28% between 2007 and 2012 [
1]. Nevertheless, it opened up a new, more critical viewpoint on financial accountability and sustainability of the world’s most popular sport.
Amidst the carnage in the economy, Europe’s leading football organization and governing body, the Union of European Football Associations (UEFA), was forced to take a more realistic look at how clubs manage their finances. The conclusion was sobering: football clubs were losing a lot of money and carelessly piling up debt [
2]. To address this issue, UEFA announced in 2009 the Financial Fair Play regulations (FFP), which essentially summed up that clubs have to stay solvent (i.e., they have to pay their debts in time—the overdue payables rule), and they need to spend only as much as they earn (i.e., the total loss of 3 years cannot exceed 5 million EUR—the break-even requirement). The penalty for non-compliance is scaled from warnings, fines, and prohibition of the registration of new players to disqualification and exclusion from UEFA competitions [
3].
In practice, FFP turned out to be more controversial and harder to implement than anticipated [
4,
5]. Nevertheless, the rules had a positive influence on clubs’ finances: the operating profitability of top-division European clubs went from a 113 million EUR loss in 2012 to a 906 million EUR profit in 2019 (with consistent profits since 2013); net equity increased from 3.3 billion EUR in 2011 to 10.3 billion EUR in 2019, and net debt as a percentage of revenue declined from 65% in 2009 to 40% in 2018 [
6,
7].
In 2020, the football landscape and its financial framework were suddenly shattered by COVID-19 and worldwide lockdowns. During the pandemic, UEFA first loosened FFP limitations and replaced them with the new Club Licensing and Financial Sustainability Regulations (FSR) in April 2022. The current financial sustainability rules have three pillars: solvency, stability, and cost control [
8]. Solvency rules will ensure better protection of creditors; controls will be performed quarterly, and there will be less tolerance towards late payers. The stability rule will allow clubs to lose a maximum of 60 million EUR over three years, and clubs will be allowed an extra 10 million EUR in losses a year if they are considered financially sound. The most revolutionary change is the squad cost rule, akin to the salary cap in US sports, limiting spending on wages, transfers, and agent fees to 70% of club revenue. The squad cost rule will only apply to clubs with total employee expenses above 30 million EUR. Just like with FFP, non-compliance with new regulations will have many consequences, from mild ones such as warnings to severe ones such as expulsion from UEFA tournaments. The new rules came into force in mid-2022 but will be gradually implemented over three years to allow clubs to adapt.
We use this broader financial regulatory environment to evaluate the financial health of Croatian top-flight clubs, locate their primary source of funding, and assess their capacity for self-sustainability. The top Croatian football division, colloquially the
1. HNL (
Hrvatska nogometna liga) but officially
SuperSport Hrvatska nogometna liga after one of the main sponsors (hereinafter: 1. HNL or HNL), is not considered a major European league; the UEFA association coefficient ranking places it on the 19th spot in mid-2022 [
9]. Still, it is the league where the vast majority of players that won World Cup silver in 2018 started and spent a good part of their (early) careers. Even the generation that won World Cup bronze in 1998, although developing their early football skills in former Yugoslavia, significantly participated in the HNL at some point in their career. It is pretty remarkable that a small country with a total population of around 3.9 million consistently produces world-class players (currently, e.g., Modrić, Brozović, Perišić, Kovačić, or Boban, Šuker, Bokšić, Prosinečki, in the past), and regularly participates in major UEFA and FIFA tournaments. Since becoming a UEFA member in 1993, Croatia has missed only one Euro (2000) and one World Cup (2010). The national football team is constantly present in the highest echelon of FIFA ranking (12th spot in November 2022 [
10]). Croatia is also a steady producer of top football talent—Dinamo Zagreb ranks 4th of teams having trained the most footballers active in 31 top divisions of UEFA member associations, and Hajduk Split is 19th. Training clubs are those where footballers have played for at least three years between the seasons of their 15th and 21st birthday [
11].
With HNL being the launching pad for producing this extraordinary talent, the league should be financially stable. Every financial problem, especially among top-tier Croatian clubs, can have dire consequences on player development. We will examine the financial health of Croatian top-division clubs according to standards set by UEFA. By comparing selected financial categories and ratios for HNL clubs from 2018 to 2021 with UEFA benchmarks, we will conclude the current financial condition and long-term sustainability of Croatian club football.
2. Brief Literature Overview
The importance of finances for football clubs in Europe has long been the subject of academic research. From the vast amount of literature, we will here mention only a small section that we consider most relevant for our research efforts.
Examining English professional football, Szymanski [
12] asserts two well-established relationships in the football literature: between player investment (wages) and team performance (league position), as well as between team performance and revenue. Football clubs find it compelling to invest heavily first, primarily in the form of player wages and transfer fees, in the pursuit of sporting success because more successful clubs will generate larger revenues later (through ticket sales, merchandising, broadcast income, and prize money). Moreover, fans exert significant pressure on managers to enhance sporting success, and, therefore, managers are willing to pay exorbitant salaries and transfer fees to improve the club’s roster competitiveness. However, the goal of sporting success cannot always be achieved, bestowing on the investment in players high risk, leading to an increase in costs and debt levels [
13]. According to UEFA, 56% of European clubs participating at the highest level of national competition were loss-making in 2010 and 36% reported negative net equity [
14].
Intriguingly, the constant running on the verge of financial collapse does not lead to a widespread liquidation of football clubs. Storm and Nielsen [
15] argue that clubs’ ability to operate under soft budget constraints explains this apparent paradox. Ahtiainen and Jarva [
16] think that clubs (especially the most prestigious ones) acknowledge ex ante that they will be rescued in case of financial trouble ex post, which affects their behavior. Andreff [
17] notes that club owners are not concerned with maximizing profits and are pursuing prestige and sporting success (utility maximization) under a soft budget constraint instead, which results in lax financial management and overspending on player wages. Szymanski [
12] takes another view: “Clubs exist in a hypercompetitive environment due to the incentives of the promotion and relegation system. In a competitive environment, firms generate negligible profits and are always close to insolvency. A sequence of negative shocks can drive a club over the edge, no matter how rational or disciplined the owners”.
UEFA intended to stop the increasing loss-making spiral and improve the financial health of European football with the FFP regulation in 2010. D’Andrea and Masciandaro [
18] reviewed studies that have investigated the impact of FFP regulations. Four of the five reviewed papers are skeptical about introducing FFP, while just one—Franck [
19]—presents arguments in favor of such rules. Criticism falls into three categories: (a) through the introduction of FFP, UEFA forgoes potential benefits stemming from unlimited injections of external capital into football payroll (Madden [
20]); (b) FFP limits competition in the player market and puts downward pressure on salaries without achieving benefits from increased competitiveness (Peeters and Szymanski [
21]); and (c) FFP rules tend to freeze and ossify the existing hierarchy of European football, creating important barriers to entry (Sass [
22] and Vöpel [
23]).
Franck [
19], however, says that by introducing hard budget constraints, FFP restores the incentives for “good management” in an industry that has degenerated into a “zombie race” with an ever-increasing number of technically bankrupt participants, which relies on getting rescued by state subventions and/or private money injections year after year. He also states that the wealthiest benefactors are attracted by a higher probability of winning. Since bigger clubs, with their extraordinary history of success, are those with higher probabilities of winning, a vicious circle is in place. Benefactors are more inclined to invest capital in top clubs and, finally, “money comes to money”.
In a later study, Frank [
24] shows that European club football underwent a quick financial recovery after the introduction of FFP, but one that went hand in hand with further polarization. Absolute revenue growth has been much more robust at the top of the football pyramid, further entrenching the sportive dominance of the “big clubs”, but Frank argues that this cannot necessarily be attributed to FFP. FFP was not specifically designed as a remedy against polarization, and polarization is likely the result of the concurrence of several factors, such as digital technologies, globalization, and the “winner-take-most” dynamic in many entertainment markets.
Plumley et al. [
25] examine competitive balance in the big five European leagues before and after FFP. They find a significant decline in competitive balance in Spain, Germany, and France but not in England and Italy. Gallagher and Quinn [
26] conclude that FFP further entrenches the financial and sporting power of elite clubs and potentially undermines competitive intensity in a league by shifting the relative focus of clubs away from sporting productivity toward financial productivity.
Ahtiainen and Jarva [
16] examine whether FFP’s break-even rule has increased the profitability of football clubs. Using data from the top five European football leagues (England, France, Germany, Italy, and Spain) over the period 2008–2016, they provide evidence that the FFP has been only moderately successful. They find that football clubs are less likely to report a loss in the post-FFP period (2012–2016) than in the pre-FFP period (2008–2011). In addition, overall profitability has increased. However, country-specific analysis reveals that the estimated positive effect is significant only in Spain, while for England and Germany, there is only weak evidence. For French and Italian clubs, the effect of FFP is insignificant.
Based on these findings, we perform our financial analysis of the top-flight Croatian football division, which, to the authors’ knowledge, has not yet been conducted to this extent in Croatian football.
3. Methodology
This analysis covers the period from 2018 to 2021. We selected only major Croatian clubs that played in the 1. HNL in the four seasons from 2018/19 to 2021/22. Clubs that were relegated were not considered. This choice has a particular bias (four teams were relegated in this period), but we deem our decision still relevant for long-term analysis. Since the 2013/14 season, the 1. HNL comprises ten teams playing each other in four rounds. The selected eight clubs are long-term members of the Croatian top division: Dinamo, Hajduk, Rijeka, and Osijek participated from the start of HNL in 1992, Slaven Belupo since 1997, and Lokomotiva and Istra 1961 since 2009. Gorica is the only newcomer, being promoted in 2018. Neither club was ever relegated since the last time they joined the 1. HNL.
The selected clubs give an overall representative profile of the highest rank of Croatian football, whether observed from the social, financial, or competitive achievement perspective. All data is taken from the audited financial statements for the calendar years from 2018 to 2021, published on the clubs’ official web pages [
27,
28,
29,
30,
31,
32,
33,
34,
35,
36,
37,
38]. For our analysis, we recalculated all the monetary amounts from the national currency, Croatian Kuna (HRK) to Euro (EUR) by using the fixed official exchange rate of 7.53450 HRK per 1 EUR, at which Croatia will join the Eurozone on 1 January 2023 [
39]. The audited statements are standardized and compiled according to UEFA licensing regulations at that time [
40], enabling and facilitating comparison across the diverse European footballing landscape.
We performed a horizontal financial analysis of the following items from the audited reports: operating revenues and the structure of revenues, operating expenses and wages, operating profits/losses and net profits/losses, net transfer volumes and transfer sales, cash flow sources, and net debt ratios. We present the results in two forms: the aggregate league and individual club level. Dinamo Zagreb is the dominant Croatian club not only in the number of trophies won (16-time champion in the last 17 seasons) but also in financial matters—it accounts for roughly 40% of total HNL revenue and expenses. With such a significant weighting, the analysis could be skewed not to reflect HNL reality but the influence of only one club. Hence, we included the financial development on the individual club-level. Figures and ratios obtained this way will be compared to other leagues, averages, and UEFA recommendations to determine the financial position of the HNL and leading Croatian clubs as precisely as possible in the broader context.
4. Analysis and Results
4.1. Brief Overview of 1. HNL History and Structure
The first season of HNL was played in the spring of 1992 amidst the raging Croatian war for independence from former Yugoslavia. The league experimented with many formats in the past but seemed to have settled for a four-round schedule with a total of 36 match days. Traditionally, clubs with the largest fan bases on the national level are Dinamo Zagreb and Hajduk Split, based in the Croatian capital and second-largest city, respectively. Rijeka (third largest city) and Osijek (fourth largest city) enjoy more regional support—Rijeka in Kvarner, Primorje, and Gorski Kotar, and Osijek in the area of Slavonia. Slaven Belupo, Istra 1961, Gorica, and Lokomotiva have a much smaller local fan base. Hajduk Split is the oldest club that has played continuously under the same name since it was founded in 1911. Dinamo Zagreb is, with 23 titles and 16 cup wins, the most successful Croatian club in domestic competitions from 1992 to 2022, followed by Hajduk (6 titles and 7 cup wins), Rijeka (1 title and 6 cups win), Zagreb with 1 title, and Osijek and Inter Zaprešić with 1 cup win.
There are two main types of ownership structures in the 1. HNL: member associations (MA) and sport joint stock companies (SJSC). The Croatian Sports Act of 2008 enabled the transformation of MAs into SJSCs, primarily to foster the privatization of football clubs. Hajduk was the first club to change its legal status to an SJSC in 2009, with the majority of shares held by the city of Split (65.92%) and the member association Naš Hajduk. The city of Split later transferred its controlling (but not ownership) rights to Naš Hajduk (75,000 members by mid-2022). The member association organizes elections every four years when members elect the supervisory board of Hajduk Split, which then appoints the management board that runs the club’s day-to-day operations. The other three SJSCs—Rijeka, Osijek, and Istra—have a dominant private majority shareholder. Dinamo, Lokomotiva, Gorica, and Slaven Belupo decided to remain MAs, run by management boards appointed by the general assemblies of the clubs.
4.2. Operating Revenue
UEFA frequently stresses (e.g., in their regular annual Club Licensing Benchmark reports) that operating revenue is the sum of “core” football activities such as gate receipts, TV broadcasting, sponsorship, merchandising, and UEFA prize money. The income from transfer sales is not included in operating revenue because transfers are, by nature, highly volatile and unpredictable. UEFA tracks 711 European football clubs playing in 55 top-tier member association leagues. From 1999 to 2019, the aggregate revenue of top-division clubs increased from 4.8 billion to 23 billion EUR, on average 8% annually [
41]. Not many industries experience continuous growth for such prolonged periods, which was not hampered even by the recessions of 2001 and 2007/2009. However, COVID-19 temporarily stopped this impressive growth: revenue dropped to 20.6 billion EUR in 2020 and is projected not to grow in 2021 [
6].
Aggregate HNL revenue grew from 45.66 million EUR in 2018 to 64.16 million EUR in 2021, on average 12% annually. There was a massive decrease in revenues of almost 30 percent in 2020 (i.e., from 64.16 to 45.11 million EUR) due to COVID-19 restrictions, which is not unexpected considering the ubiquitous lockdowns. However, what was striking was the lightning-fast recovery that happened in 2021. In contrast to European football, which remains 10% below the record highs of 2019, aggregate HNL revenue quickly returned to pre-pandemic levels.
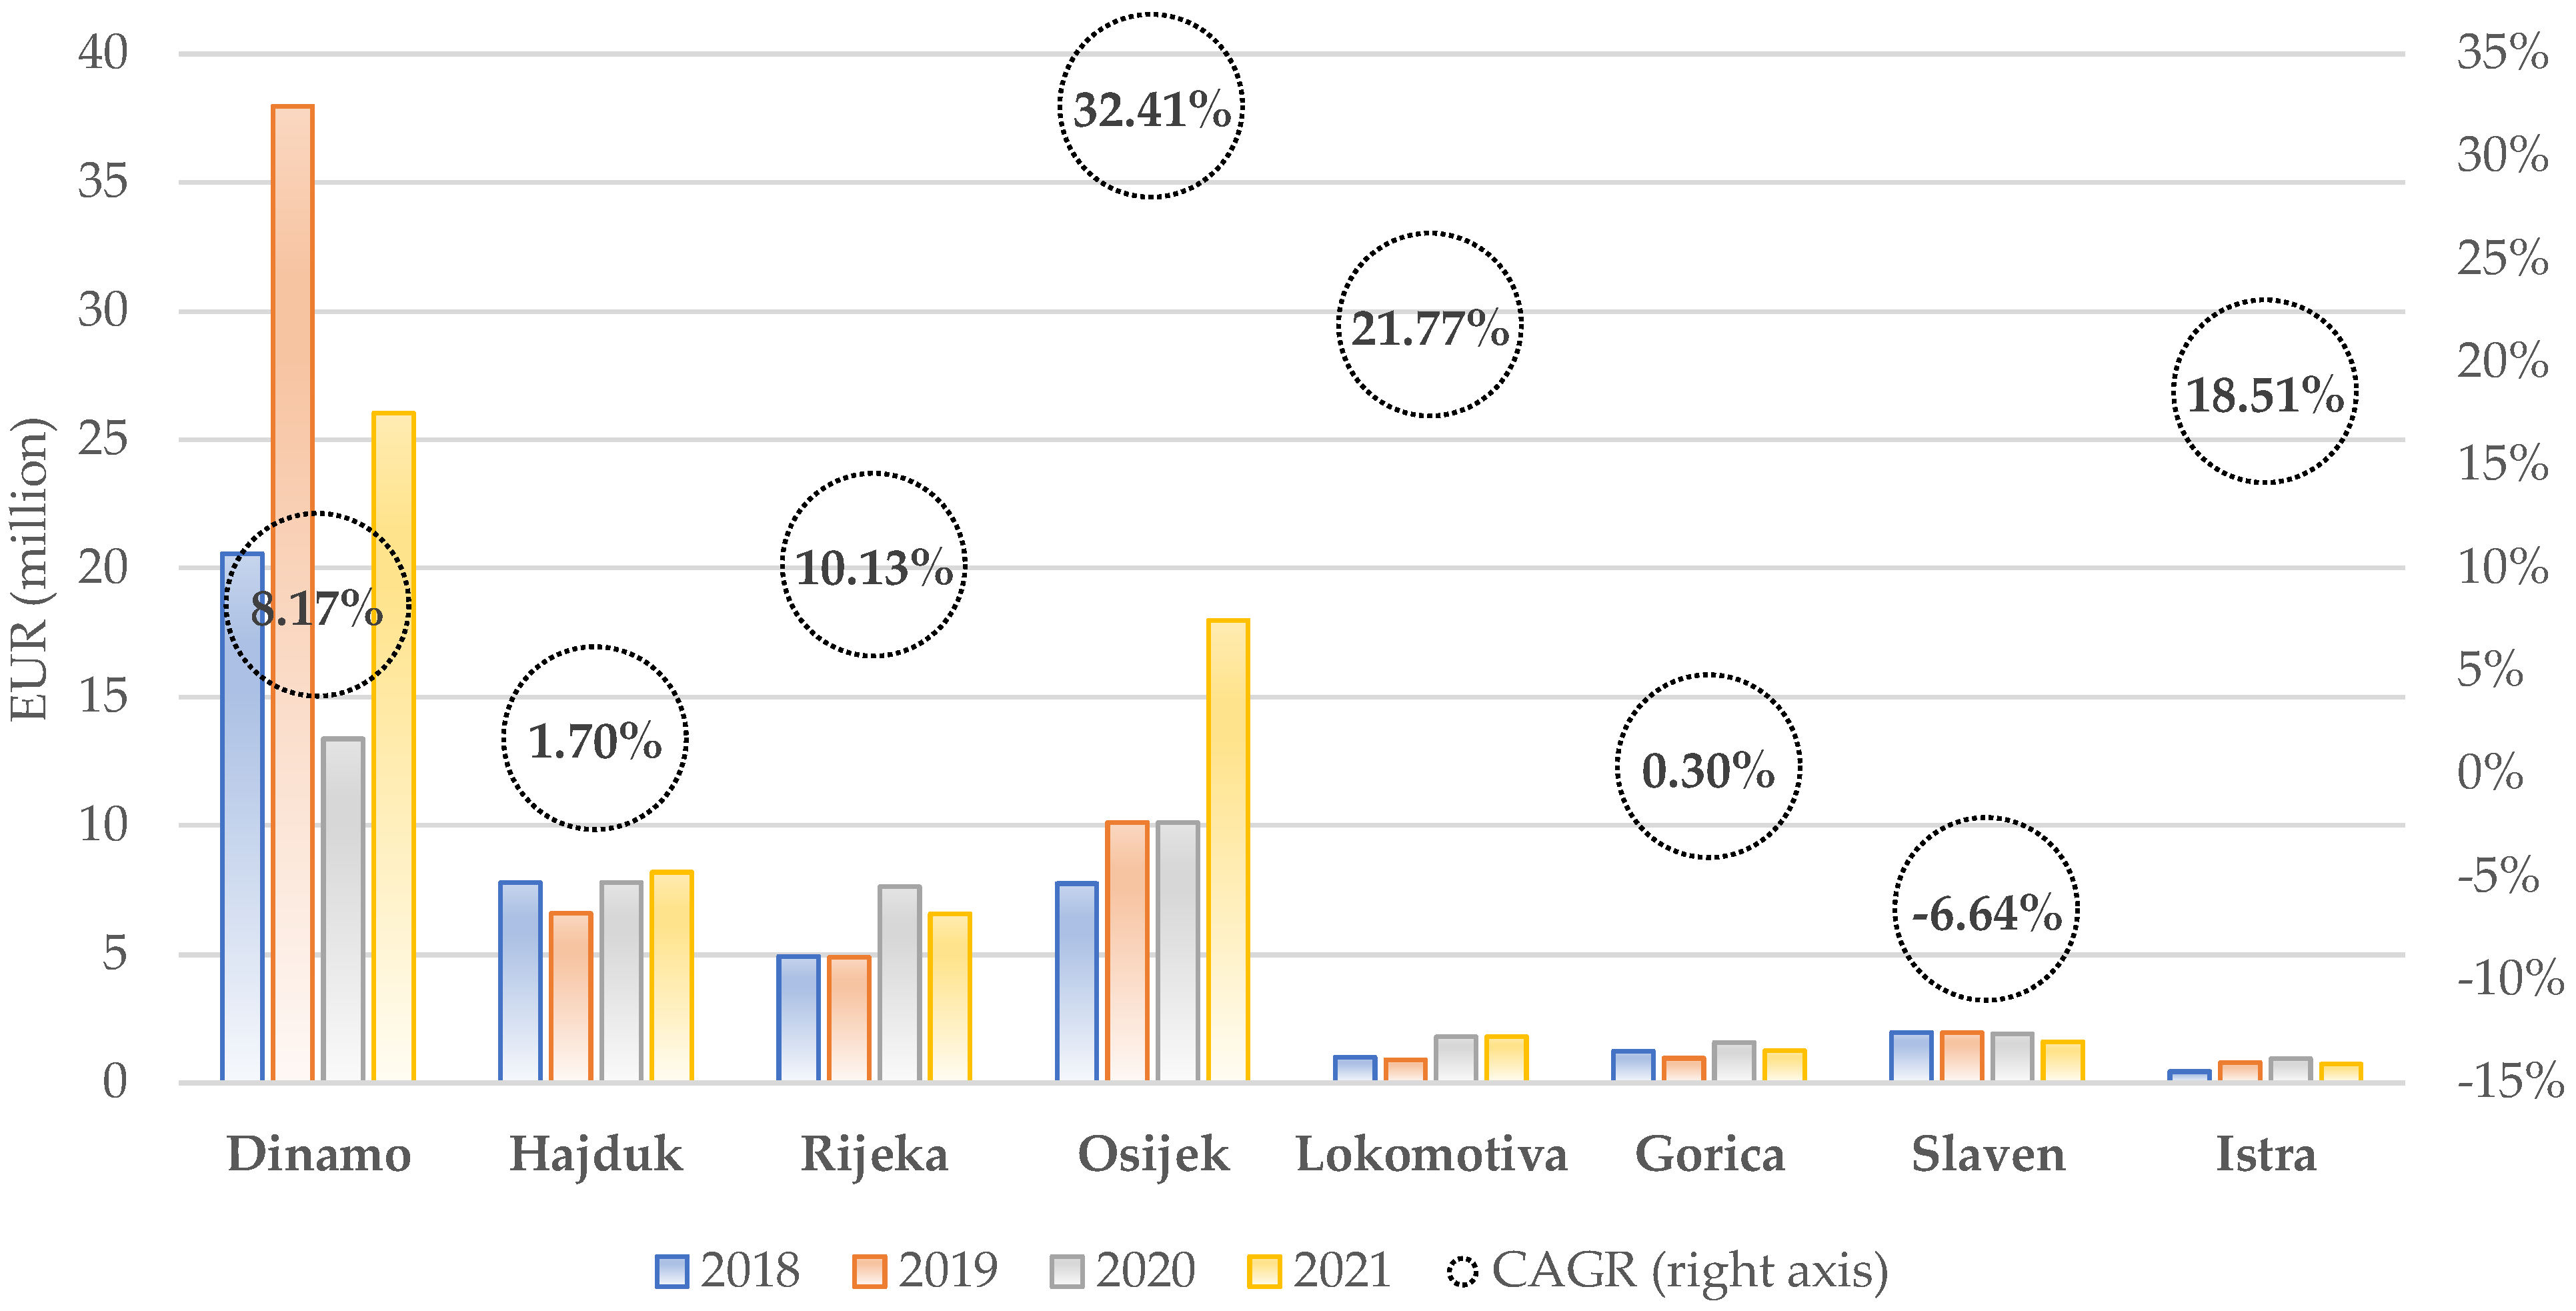
Figure 1 presents revenue development for each of the eight major clubs, highlighting the competitive and financial relationships in Croatian football. It clearly shows the vast chasm that separates two (or even three) distinct categories within the 1. HNL. The first group is the “Big Four”: Dinamo, Hajduk, Rijeka, and Osijek, i.e., the most popular Croatian clubs with the largest fan base, silverware collection, and revenues. The second group (Lokomotiva, Gorica, Slaven, and Istra) has neither of that;
Figure 1 shows the stark difference in their revenue streams compared to the “Big Four”. One could additionally argue that Dinamo Zagreb is in a league of its own because its revenues are, on average, 80% of the revenues of Hajduk, Rijeka, and Osijek combined.
HNL grew on aggregate 12% annually in the observed period, but since Dinamo has such a vast weighting in total revenues, we also checked the median growth rate of individual clubs. We arrived at the figure of 10%, which is not too far from the aggregate 12%, meaning that the revenue growth tendency in the last four years was, on average, positive for HNL clubs (Slaven Belupo was the only club that showed slightly decreasing revenues). Osijek increased revenues the most from 7.75 million EUR in 2018 to 17.98 million in 2021, primarily through aggressive new sponsorship deals with its Hungarian majority shareholders. As part of the long-term efforts of the majority owners to make Osijek a serious challenger to Dinamo’s dominance, sponsorship grew from 6.37 million EUR in 2018 to 13.54 million EUR in 2021.
The average share of different revenue sources for the aggregate 1. HNL in the period 2018–2021 is presented in
Figure 2. To get a better perspective on the sources of income in Croatian football, we compare it with the aggregate revenue structure of European football by using data compiled by UEFA for the same period [
6,
7,
41]. Additionally, we depict the average revenue structure for individual HNL clubs on an equally weighted basis.
In the period 2018–2021, the two primary sources of revenue for HNL on the aggregate level were UEFA prize money (40%) and sponsorships (29%). Revenues from gate receipts and broadcasting were relatively low (6% and 3%, respectively); income from commercial activities (merchandising) was 7%, and other revenues (comprised of various donations and exceptional and unclassified income) were 15% of total revenues. In European football, commercial and sponsorship revenues comprise, on average, 32% of total revenues, similar to HNL figures (36%). However, this is where the similarities end. Gate receipts are twice as important as a revenue source for European than Croatian teams (11% vs. 6%). Were it not for the pandemic, the difference would be even more significant, because lockdowns had a more pronounced impact on European leagues than the HNL.
The most significant difference is TV broadcasting, which has an average share of 36% in Europe and a negligible 3% in Croatia. The pitiful amount of TV money that is distributed to 1. HNL clubs (in total, only 1.6 million EUR annually) were the subject of much criticism from clubs and the public over the years, implying questionable practices and a complete lack of transparency in signing the deal in 2015 [
42]. The Croatian football association (
HNS—Hrvatski nogometni savez) signed a new TV broadcasting agreement in 2022 with mobile operator
Hrvatski telekom and sports betting agency
SuperSport. This time, the procedure was less controversial, and the new deal in effect for the next four seasons (from 2022/23 to 2025/26) will significantly increase the amount 1. HNL clubs will split among themselves annually (9.3 million EUR). Every club will receive a fixed allocation of 464,500 EUR and an additional amount depending on the final league position, ranging from 1.23 million EUR annually for the champion to 650,300 EUR for the last-placed team [
43]. Relative to aggregate HNL revenues of 64.16 million EUR in 2021, this would imply an increase of 7.7 million EUR annually and a future share of TV broadcasting of 13% of total operating revenue. Although this will be a massive increase over the 3% distributed on average from 2018 to 2021, it is still pale compared to the 36% European clubs receive from TV broadcasting.
The lack of broadcasting money in Croatia was offset by UEFA prize money and solidarity payments (40% in HNL vs. 13% in European leagues), as well as other revenues, i.e., primarily various donations and exceptional income (15% in Croatia vs. 8% in Europe). However, the only Croatian club that regularly plays in UEFA competitions, accumulating the lion’s share of UEFA revenue, is Dinamo Zagreb. To eliminate this effect, we calculated the equally weighted revenue structure for HNL clubs by using a simple average of the percentage share of revenue sources for individual clubs. It reveals that the “average” HNL club depends much less on UEFA revenue—only 24% instead of 40%. To compensate, they receive more on average through other revenues (donations and exceptional income), i.e., 26% instead of 15%. The share of broadcasting money in total revenue is also higher for the “average” HNL club (7% instead of 3%) since the nominal amount of funds each club receives has a higher relative share in clubs with smaller budgets. Smaller clubs will be the ones to benefit the most from the new TV deal signed in 2022.
4.3. Operating Expenses
Operating expenses include all day-to-day costs of running a football club: wages, material costs, amortization, ground maintenance, etc. Operating expenses do not include funds spent on player registrations because UEFA does not recognize transfers as “basic” football activities.
We have seen that aggregate HNL operating revenue grew from 2018 to 2021 at around 10–12% annually. In these four years, aggregate HNL operating costs increased as well, from 84.2 million EUR in 2018 to 110.45 million EUR in 2021, but at a slightly lower rate than revenues, on average 9.47% annually. This is quite a positive development, especially considering the COVID-19 pandemic.
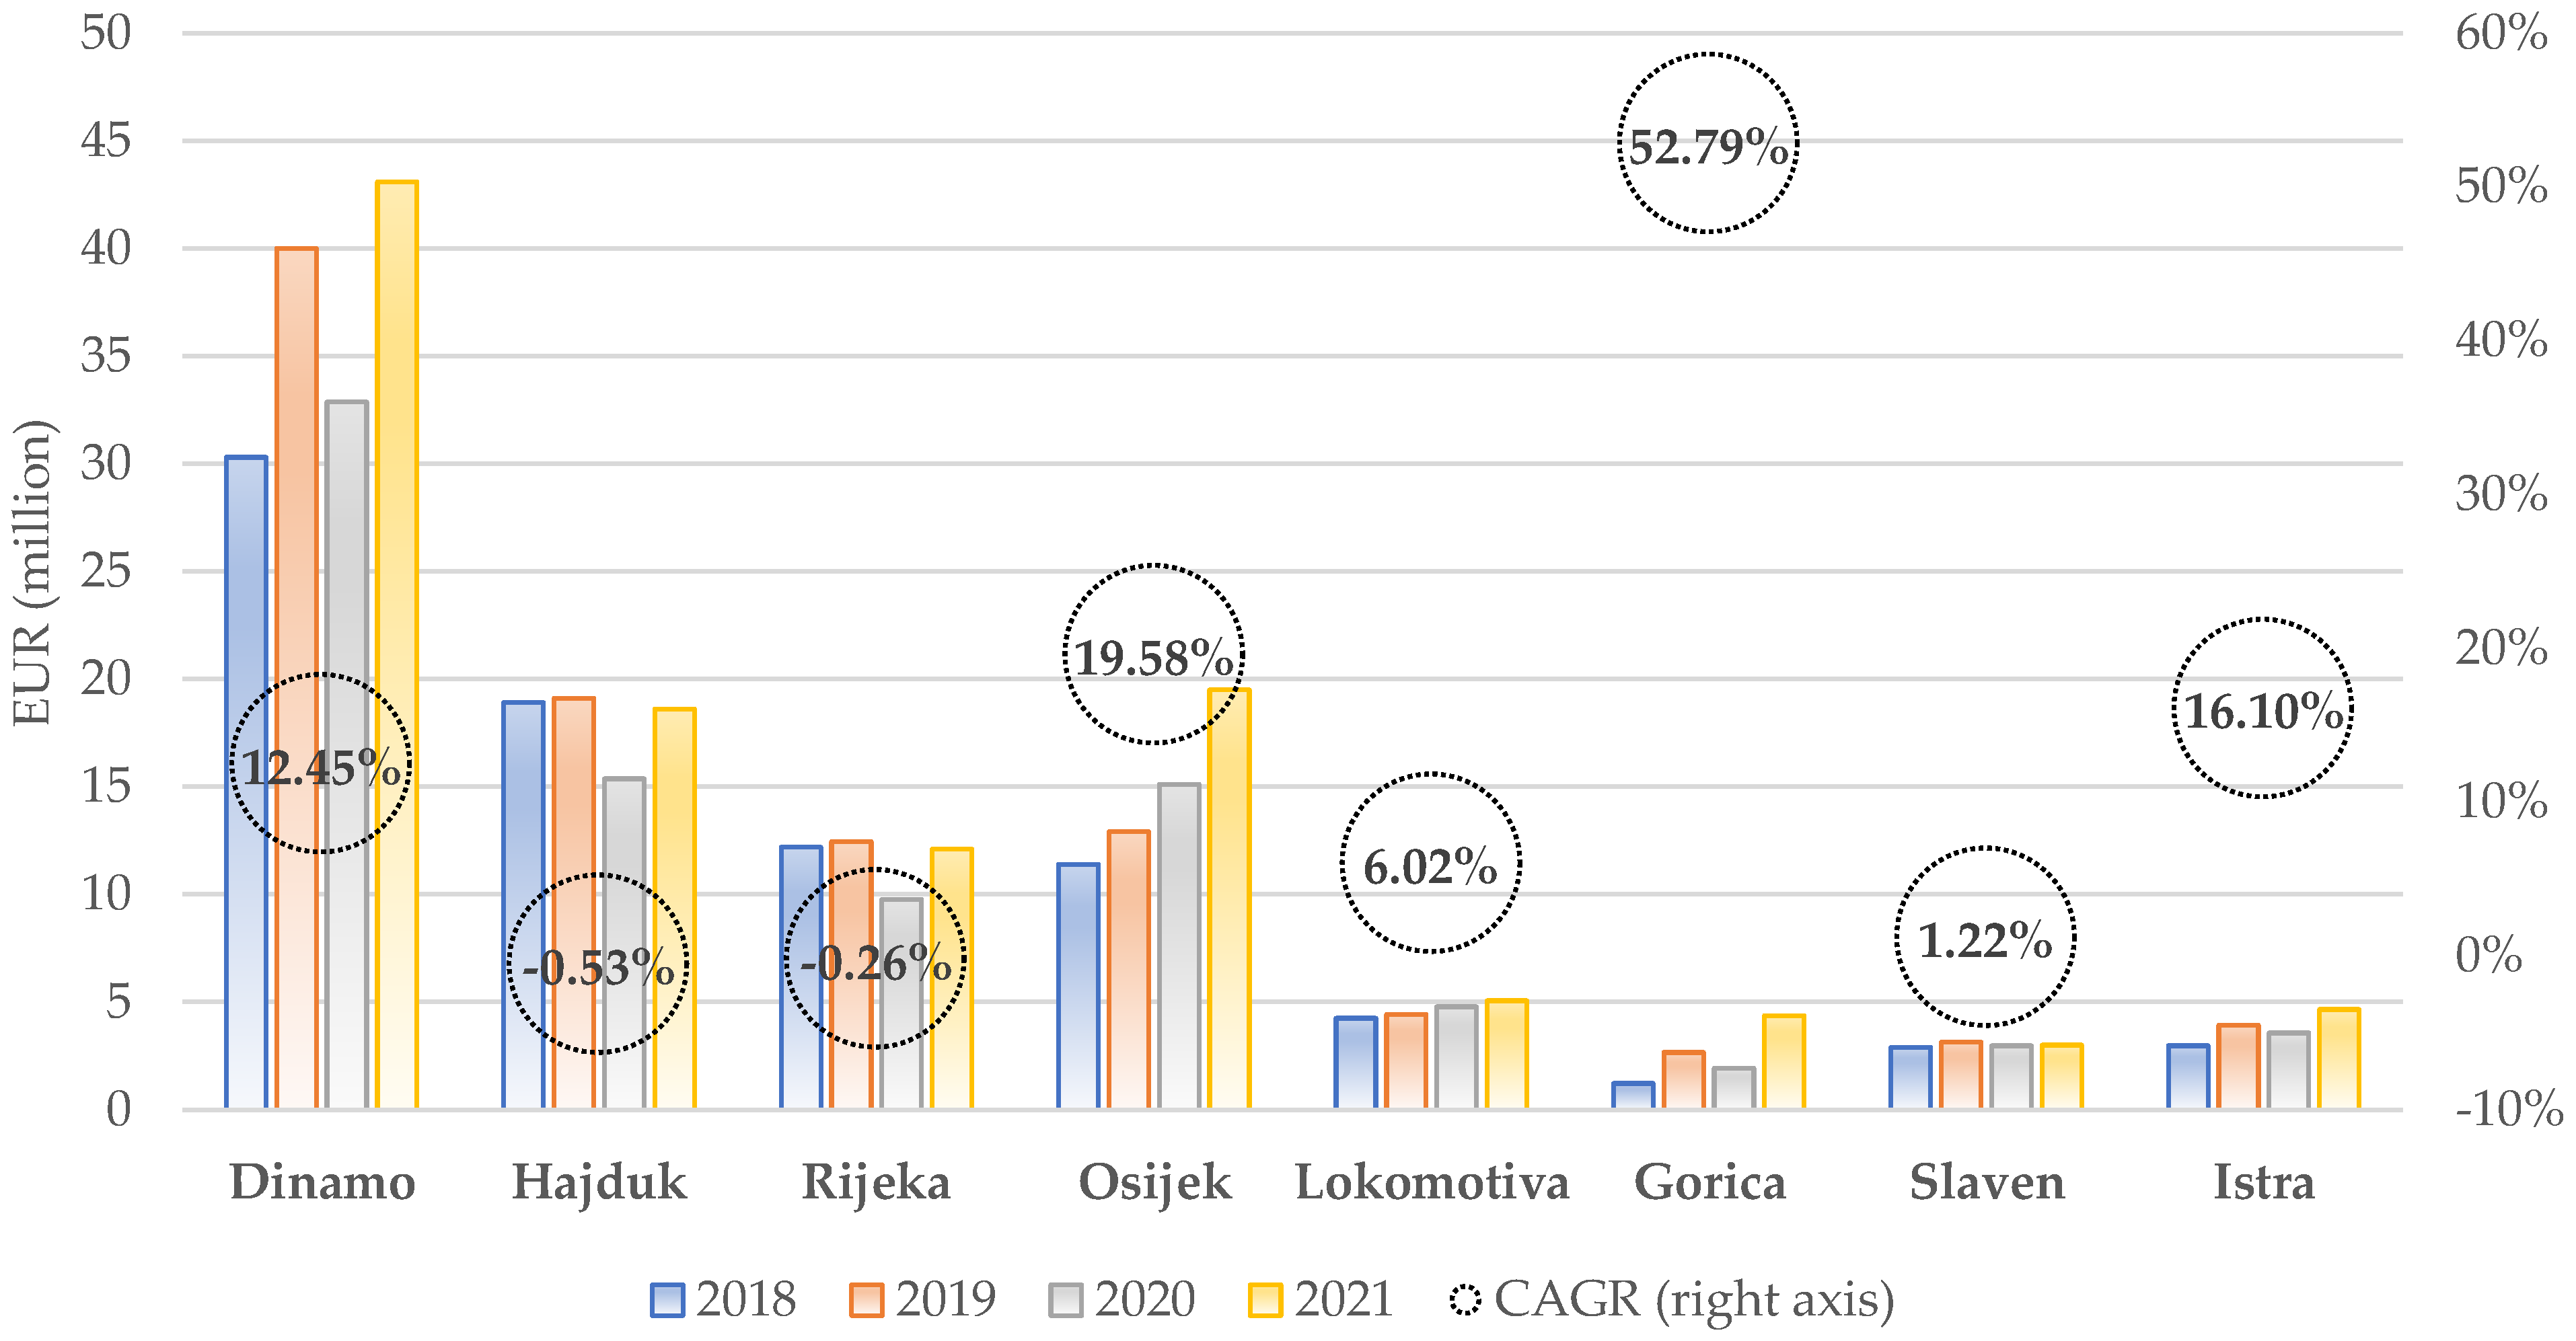
Figure 3 shows the trend of operating expenses for each of the eight major clubs in 2018–2021 and their respective CAGR. It (again) highlights the two-tier (or even three-tier) structure of the HNL, with the “Big Four” clubs’ expenses accounting for 84% of total HNL expenses in 2021 and Dinamo Zagreb expenses being 86% of Hajduk, Rijeka, and Osijek expenses combined.
The median CAGR of all clubs is 9.24%, practically the same as the aggregate HNL CAGR of 9.47%. Hajduk, Rijeka, and Slaven stabilized their costs, while most clubs recorded an increase. This is especially pronounced for Gorica (CAGR of 52.8%), but the club had to bolster its expenses after entering the 1. HNL in 2018 to stay competitive. Dinamo is increasing its costs at a higher CAGR than its revenues (12.5% vs. 8.2%), while Osijek is doing the opposite—expenses grew on average by 19.6% and revenues by 32.4%. It is the same with Lokomotiva and Istra, which also increased expenses at average annual rates lower than revenues: 6% vs. 21.7% and 16.1% vs. 18.5%, respectively. So, except for Dinamo and (understandably) Gorica, other major clubs have succeeded in keeping the growth of expenses below the increase in revenues, a desirable long-term relationship.
Wages
The highest cost in football is wages; to stay competitive, clubs must spend on talent, coaching, and administrative/technical expertise off the field. There are significant differences between football and other industries regarding profit maximization. Most businesses strive to profit for their shareholders, but in football, the ultimate objective is winning titles, which leads them to spend relatively more on acquiring talented players (and staff) [
6].
In 2021, player (56%) and non-player wages (17%), as well as net transfer costs (18%) across European leagues, absorbed 91% of operating revenue [
6]. This is much higher than in other business fields, e.g., the trucking industry is often used as an example where wages comprise a significant amount of revenues—around 60%. In other industries, wages typically absorb much less of revenues—about 35–50%. Because of falling revenues during the pandemic, the share of wages and net transfer costs in European football has increased tremendously since 2019, from 66% of revenue to 91% [
6]. This ratio is a broader one—UEFA usually focuses on total wages (player and administrative/technical wages). For years, UEFA has reminded clubs to keep their total wages under 70% of revenue to sustain long-term financial stability. This was not mandatory under FFP and carried no penalties. Still, with the new FSR of 2022, it will be gradually applied for clubs in UEFA competitions with annual employee benefit expenses above EUR 30 million. We will also concentrate on the wages-to-revenue ratio in the remainder of this section.
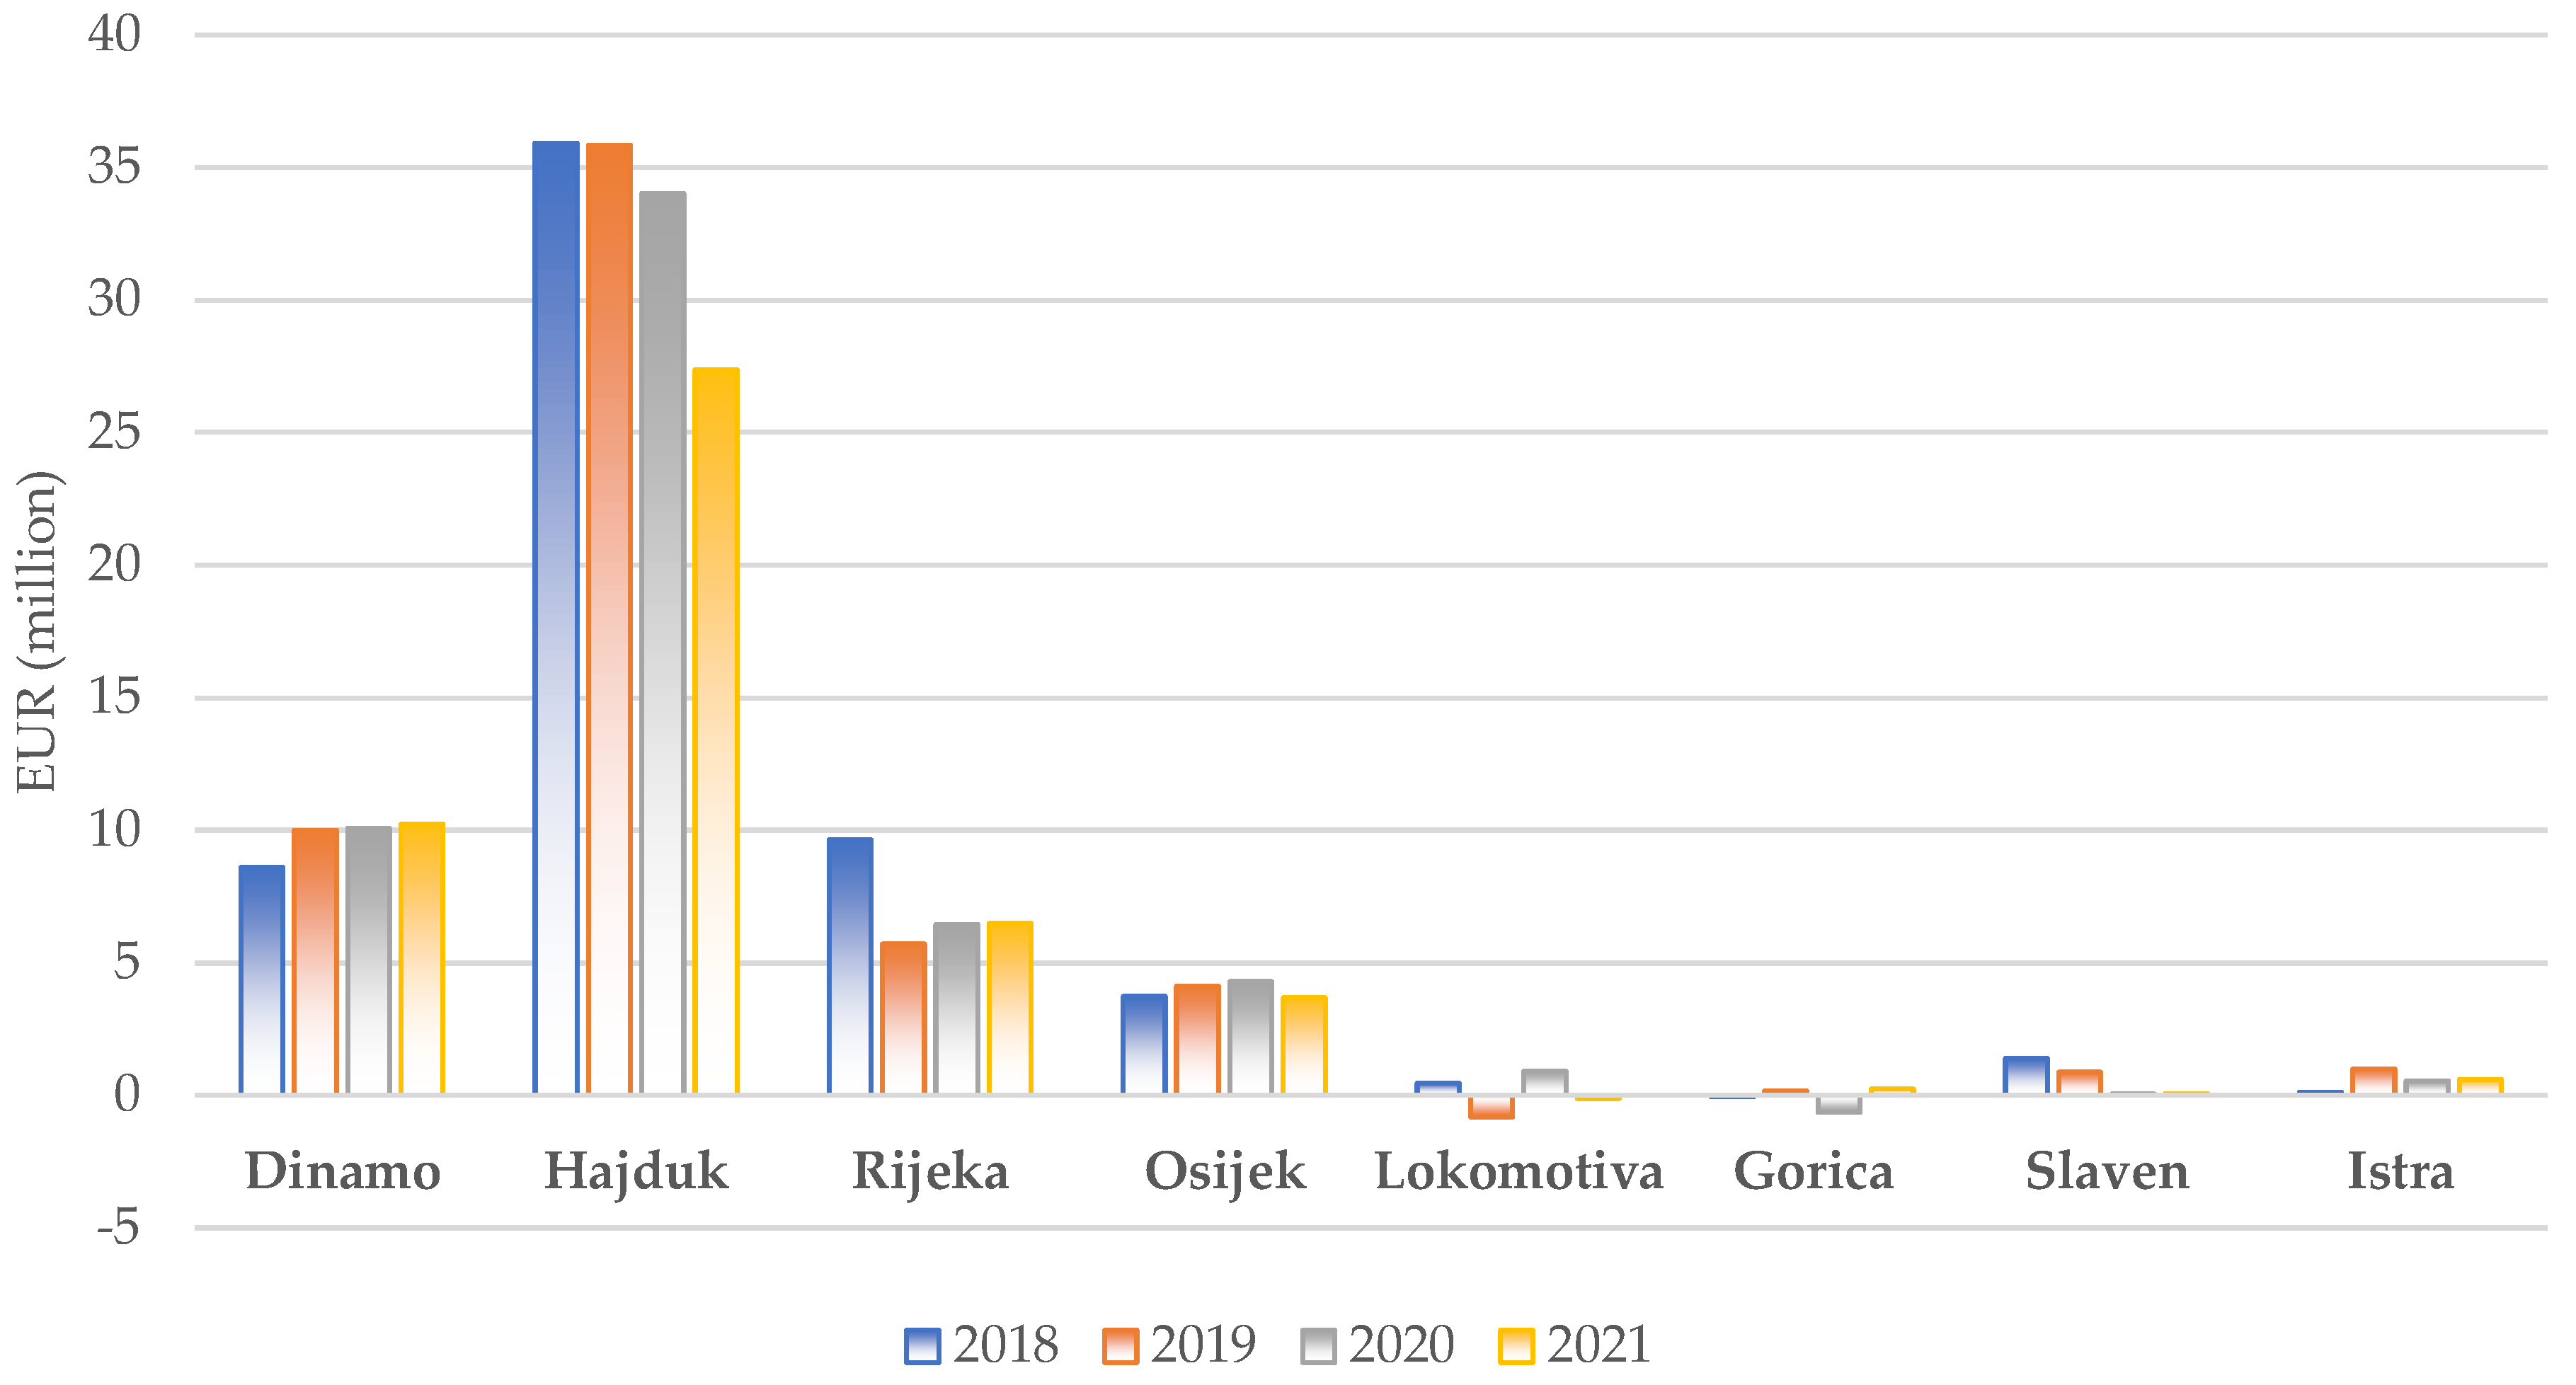
From 2012 to 2021, the increase in nominal player wages across top-division European leagues is steadfastly consistent, almost doubling during the ten years, from 6.3 billion EUR to 11.9 billion EUR. Wages continue to grow and are now at the highest level in relation to revenue recorded in European football [
6]. The international trend of increasing wages did not bypass the 1. HNL: from 2018 to 2021, total wages grew by 14.3% annually, player wages by 15.6%, and staff wages by around 11.3% annually (
Figure 4).
One of the reasons why football became the world’s most popular sport is the role of chance and luck. In any single game, anything can happen; the odds of the most expensive team winning are only 50%, so an underdog has a good chance to come away with a tie or even a win (especially at home) against a much richer opponent [
44]. However, in the long term, the most substantial factor that explains league position and success on the field is the amount clubs spend on wages relative to competitors. Szymanski [
1] estimated that 80–90% of the variation in average league position in the 1958–2012 period could be attributed to relative wages spent on players. No other factor comes even close to explaining the outcome. In the long run, luck and chance average out, and the most expensive club with the best players with the highest salaries will win the most titles.
However, Anderson and Sally [
44] found that in a single season, less expensive clubs still have a decent fighting chance because the correlation between league position and wages in a single campaign is “only” 59%. So, 41% of position variation can be attributed to something else, which can give less expensive teams an incentive to develop an edge, such as manager talent, football tactics, business strategy, new scouting/analytical techniques, etc.
In this light, we can easily explain the long-term supremacy of Dinamo Zagreb in the HNL—the club has a wage bill that is more than 70% of the total wages of all other major clubs combined (
Figure 5). This has been a constant in Croatian elite football for years.
Gorica joined the 1. HNL in 2018 and increased wages from 190,000 EUR to 1.7 million EUR in 2019, hence the substantial CAGR. Osijek is rapidly expanding its wage bill; the club started 4th in terms of total wages in 2018 (behind Hajduk and Rijeka) and is currently only behind Dinamo. This again underscores the desire of its management to participate more competitively in the race for the Croatian national title, which was until recently a one-sided affair.
To check the relationship between wages and league position in HNL, we compared clubs’ average wage bills and league position for the last four seasons and financial reporting years (
Table 1). Dinamo used its wage advantage over the rest of the league and took four titles in a row. Surprisingly, the biggest overachiever in terms of final league position in relation to the average wage bill is newcomer Gorica. Rijeka outperformed Osijek and Hajduk when one accounts for wage spending. Hajduk fans were disappointed with results on the field not reflecting investments in the squad, also evident in consistent big underperformer Istra. This comparison is only a cursory one, but it validates the conclusions from more relevant international research: wages are undeniably significant in determining final league position, but in the short term, a club can as easily underperform as it can outperform when it comes to the wage bill. That leaves every team with enough incentive to develop innovative strategies to outsmart richer competition.
As mentioned at the beginning of this section, UEFA recommends keeping total wages below 70% of revenue to sustain long-term financial stability. However, UEFA also projects that in 2021, the wage-to-revenue ratio for all reporting clubs will reach a record high of 77% [
6]. This, of course, is the pandemic’s effect—revenues are declining, but wages are long-term legal commitments that cannot be easily lowered in times of crisis. The picture looked differently in 2019, before COVID, when the average wage-to-revenue ratio for all clubs in European top divisions was at 64% [
41]. As seen in
Figure 4, wages in HNL are consistently way above the ratios for European football and above UEFA recommendations, raising questions about long-term financial sustainability. We get similar results compared to pre-pandemic levels in 2019 and with leagues more of a peer to HNL. In 2019, the wage-to-revenue ratio of Central and Southern European (64%), Eastern European (71%), and the Balkans leagues (85%) were all below the HNL ratio of 95% [
41]. Total wages in HNL are consistently around 100% of revenue or higher, which means that Croatian clubs can barely cover employees’ wages with their operating revenues, let alone pay for all other operating costs in running a football club. The financial burden wages carry on individual HNL clubs is even worse than the aggregate level (
Figure 6).
Some clubs consistently have an extreme wage-to-revenue ratio, such as Lokomotiva and Istra. Rarely do we find teams with salaries below 100% of revenues, especially in the last couple of years; the only notable exception is Osijek, which manages to keep its wages to 70–80% of revenues. All other clubs are in a precarious position where any major disruption domestically or abroad (particularly on the transfer market) can significantly impede their ability to pay out wages regularly.
4.4. Profit Margins
4.4.1. Operating Profitability
Operating profitability is the difference between operating revenue and operating expenses. It does not include volatile items such as transfer income and transfers spending, thus indicating the profitability of “core” football activities such as gate receipts, merchandising, TV broadcasting, etc. Because of the pandemic-induced lockdowns, 2020 was the first year that European top-division clubs recorded aggregate operating losses since introducing the FFP rule in 2013. Operating profits are essential if clubs want to maintain financial health because they cover for net transfer, net financing, and all other costs [
6]. In order to compare operating profitability across leagues and clubs, they have to be expressed relatively. Operating profit margins are used for this: operating profits (losses) divided by operating revenue. The operating margin of top-division European clubs in 2019 was 4%, which turned into a −5% margin in 2020 [
6]. Before the pandemic, the average annual operating profit margin for top-division European clubs from 2013 to 2019 was 4.3% (authors’ calculation based on [
41]).
In stark contrast to European football, HNL clubs consistently operate with losses. Even before the pandemic, aggregate operating losses were the standard for HNL. While FFP rules were important in leading European clubs from losses in 2012 to continuing operating profits (at least before COVID-19), nothing of this sort happened in Croatian football.
Figure 7 shows aggregate operating losses and operating margins for the HNL.
HNL operating margins are highly negative in any comparison. Many European leagues also have negative operating margins [
6]. Still, even when we consider only European leagues that operate with negative margins, we arrive at average margins of −14% in 2019 and −18% in 2020, which are much higher than those of HNL. The result is the same when HNL is compared to leagues outside the top 20, i.e., the average operating profit margin for 397 clubs outside the top 20 leagues was −28% in 2018 and −23% in 2017 [
7]. HNL aggregate operating margins are far below any of these figures, whether in pre-pandemic periods or later.
Figure 8 presents the operating results of individual HNL clubs from 2018 to 2021. None of the eight major Croatian clubs ever reported operating profits in this period. On a relative basis, average operating margins are also very negative for most teams, especially for Istra and Lokomotiva. Osijek is the only HNL club with negative margins within more or less tolerable limits. What is somewhat surprising is the low operating margin of Dinamo Zagreb since it is the only Croatian club that receives significant amounts of UEFA prize money year in and year out. Because of that, Dinamo’s operating margins should be higher and more in line with European peer groups. Perhaps more intuitively, the average annual operating loss (AAOL) of individual clubs in
Figure 8 tells us how much additional funds each club must acquire from other, non-operating sources (primarily through transfer sales) every year on average. Croatian clubs would quickly go bankrupt if they relied solely on “core” football activities.
4.4.2. Net Profits before Taxes
If football clubs are utility maximizers, as is suggested by a large part of the literature, we would not expect profit-maximizing strategies such as in other businesses, where shareowners aim for significant dividends and (or) high stock market prices. Nevertheless, the objective of FFP was to force football clubs to keep their financial books in relative order and not sink too deep into red when pursuing their ultimate goal—winning trophies. European football generally managed to improve aggregate net profitability (profits after net transfer and financing costs, but before taxes) in the decade before the pandemic, coming up from an average loss of 1.65 billion EUR (2010–2011) to a 742 million EUR average profit before taxes in 2017–2018. However, the pandemic had a devastating effect on net profitability. Total top-division losses in 2020 were around 3.1 billion EUR, the most significant losses since 2010. A decade ago, huge losses were one reason FFP regulations were introduced in European football. UEFA forecasts further mounting losses in 2021, to more than 4 billion EUR. The indicator for relative comparison is the net profit margin: net profit/loss before taxes divided by revenue. The net profit margin before taxes dropped from −2% for European top-division clubs in 2019 to −15% in 2020 [
6]. In 2019, the net profit margins of more comparable leagues to HNL, such as Central and Eastern Europe, Eastern Europe, and the Balkans, were all −7% [
41].
As shown in
Figure 9, the HNL fared relatively well in the 2018–2021 period regarding net profitability. After a record in 2018, due to Dinamo Zagreb’s huge transfer sales and a net profit margin of 57%, HNL showed aggregate net losses in the following years. However, this was not much different from the surrounding international environment. Interestingly, in the pandemic years of 2020 and 2021, HNL had aggregate net margins of −9.2% and −7%, respectively, and performed relatively better than European leagues.
On the individual club level (
Figure 10), Dinamo is the only club that showed net profits consistently, which is quite remarkable even in a broader context. Additionally, in contrast to meagre operating profitability, net profitability looks much better for top-tier Croatian clubs (except for Istra); the reason is high net transfers, to which we will turn to in the next section.
4.5. Transfer Activity
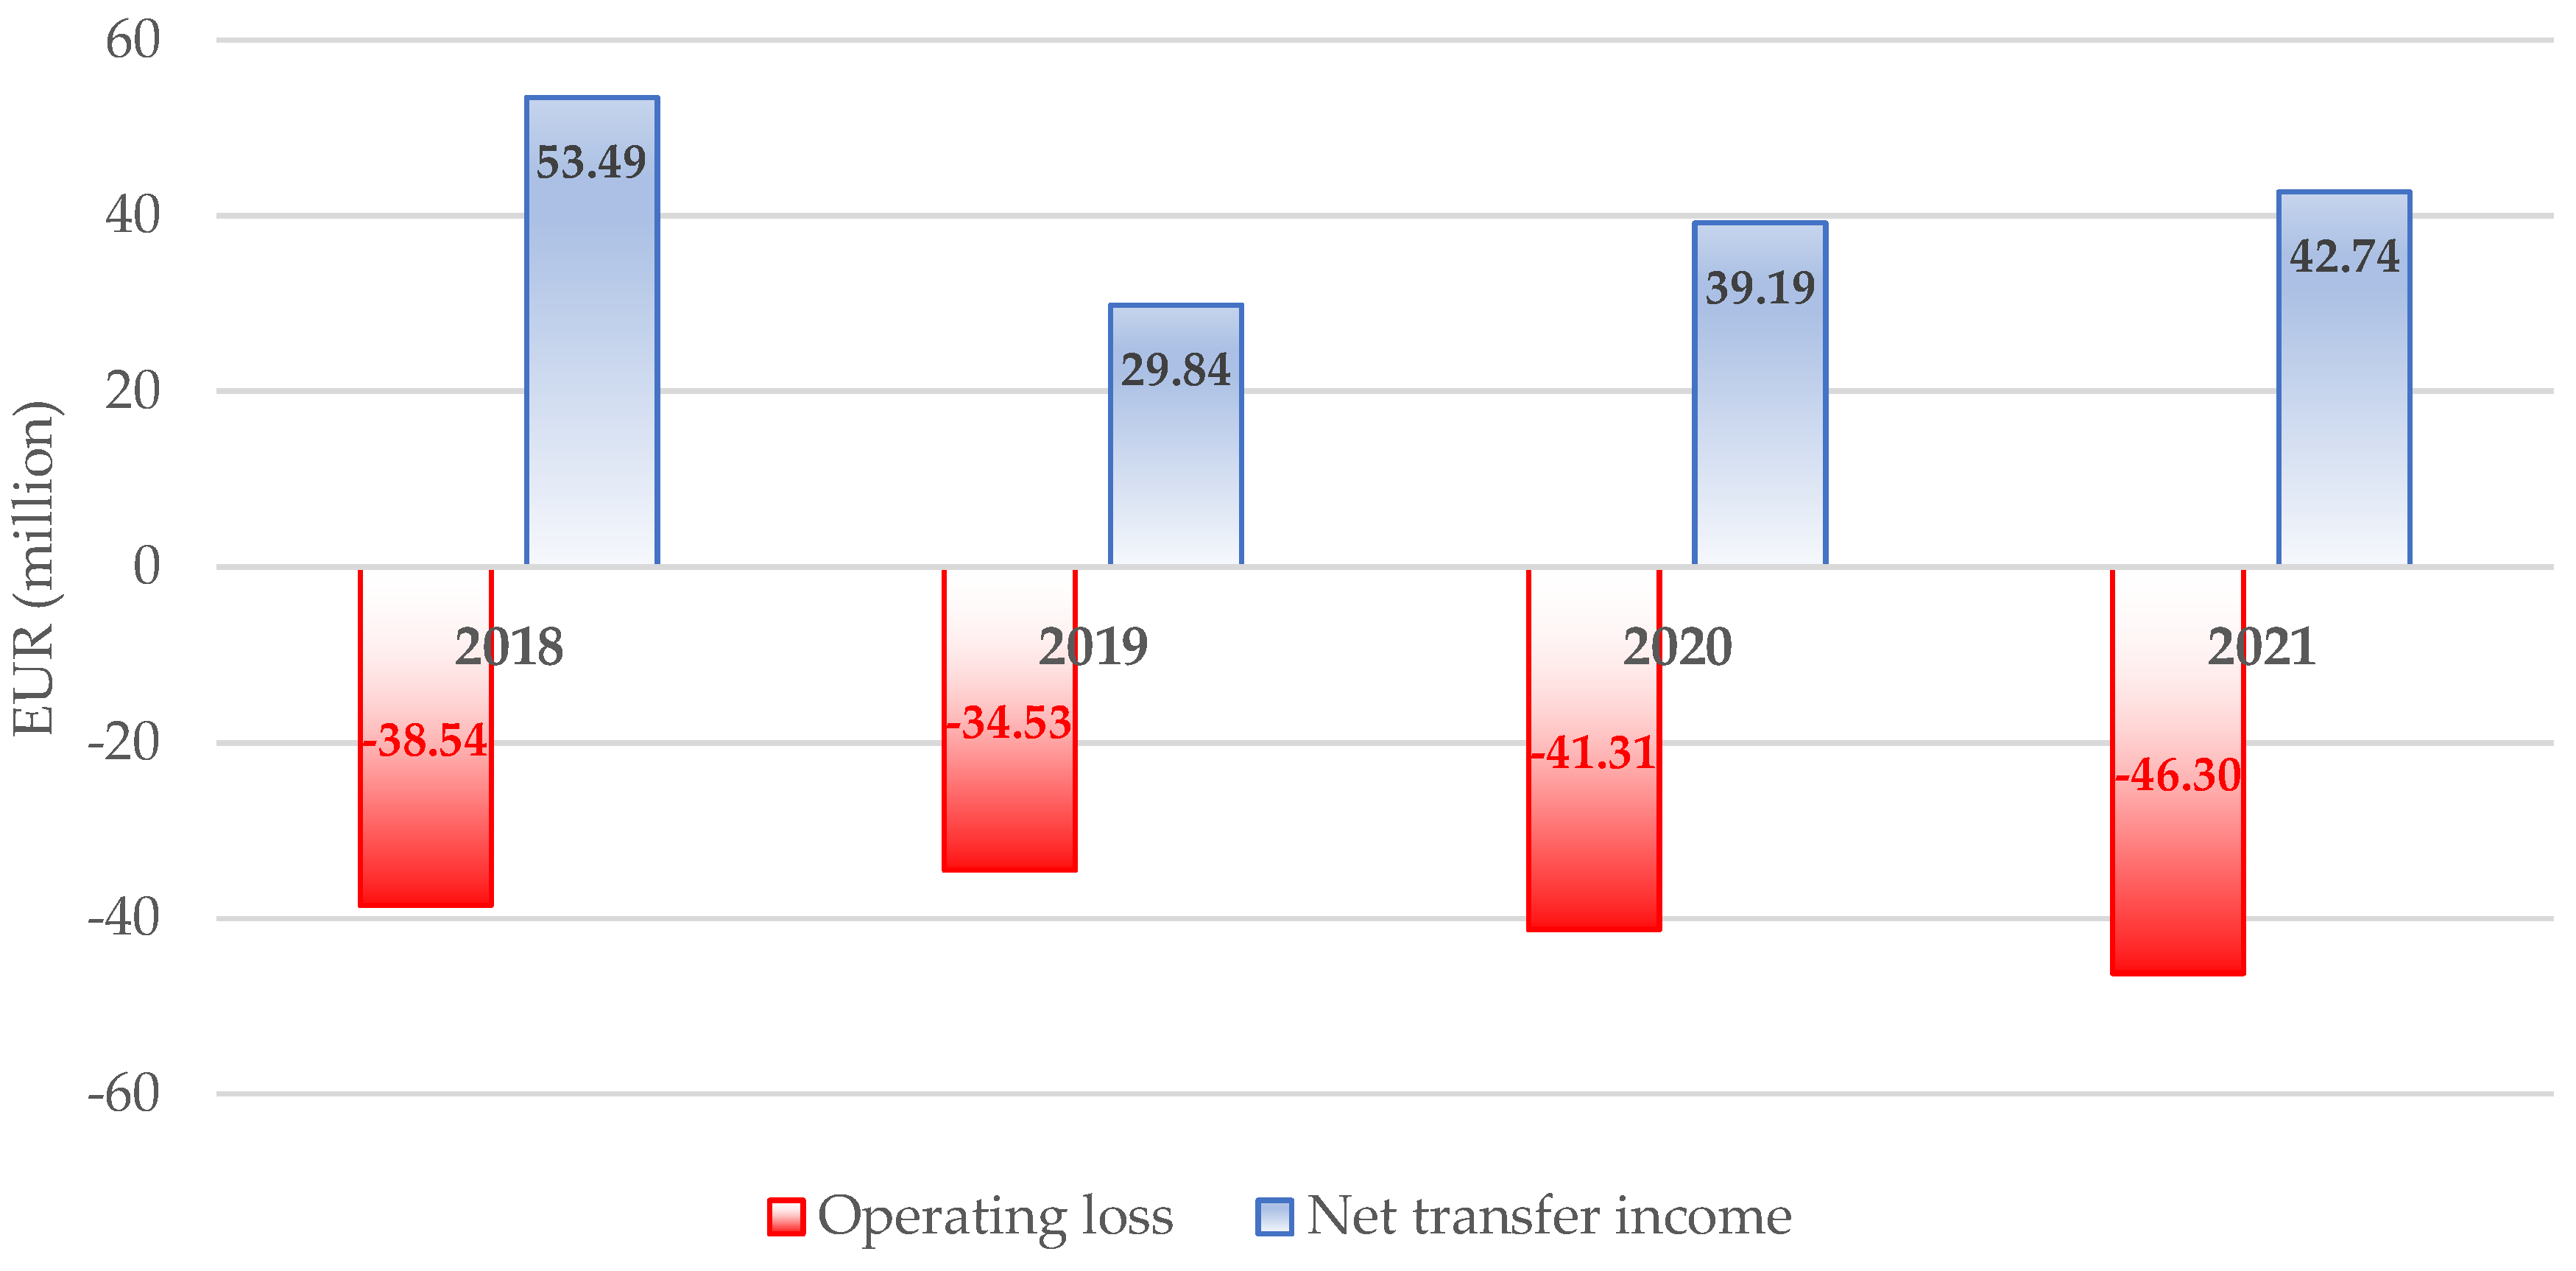
Transfer sales are the chief source of income for Croatian football clubs. Without transfer sales, most HNL clubs would quickly become insolvent or be forced to scale down their budgets substantially. We can see this in
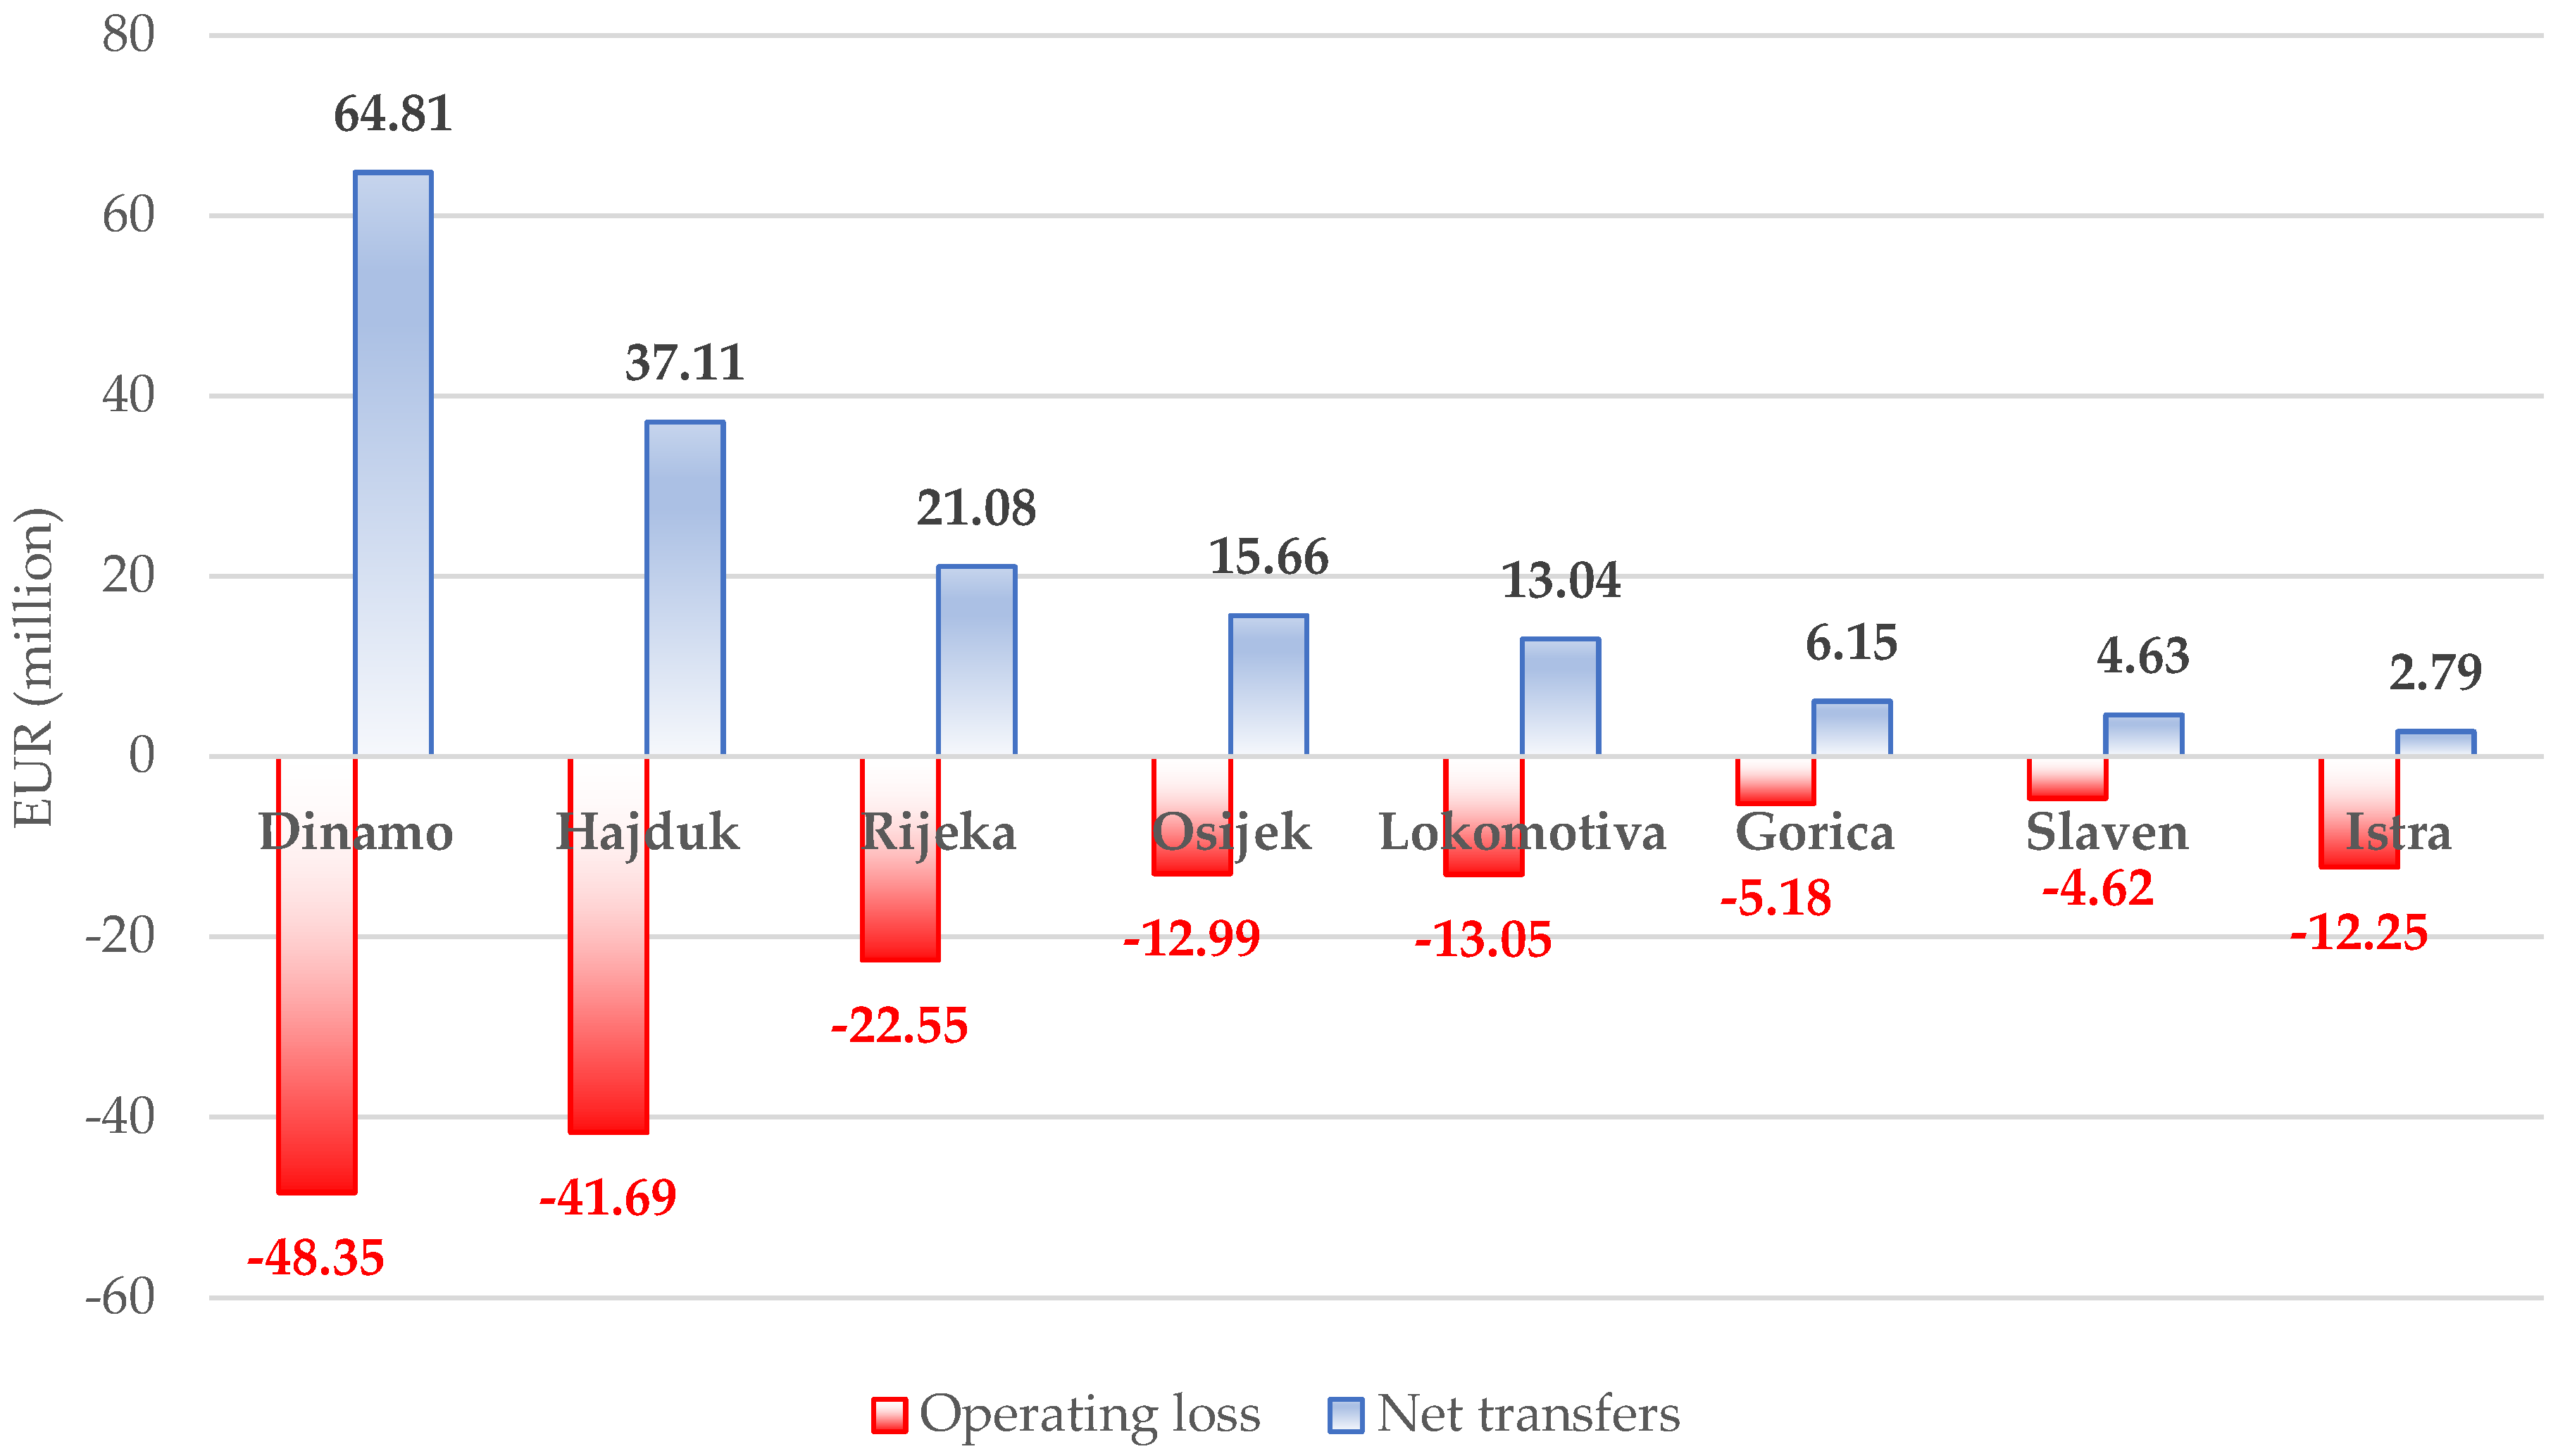
Figure 11, where we compare aggregate operating losses from 2018 to 2021 to aggregate net transfer income (transfer sales minus transfer costs, i.e., the difference between how much clubs receive when selling player registrations and the amount they pay for acquiring new player registrations).
Aggregate net transfer income exceeded aggregate operating losses in this period by 4.6 million EUR. The same relationship is shown in
Figure 12 but on the individual club level.
Except for Istra, all other clubs are trying to balance most of their negative operating result with net transfer income. This business model is not unknown to clubs playing outside major European divisions. Clubs in smaller leagues and markets without a large sponsorship base and TV broadcasting revenues frequently turn to the one relevant source of funding that keeps them running: net transfers. For example, without transfers, even the most successful Croatian club, Dinamo Zagreb, would be unable to finance its annual budget of around 40 million EUR. With a smaller budget, it would be challenging to stay competitive, especially on the international stage (Dinamo is a regular group phase participant in UEFA competitions). The transfer reliance of domestic clubs has been facilitated by the fact that Croatian football seems to enjoy a comparative advantage in producing quality football players. The enduring success of the national team in FIFA and UEFA tournaments and the consistent stream of players that perform important roles in major European football clubs support this notion.
Revenues of top-division European clubs steadily increased in the last 20 years, primarily because of the strong inflow of broadcasting money in the “Big Five” major leagues. This led elite clubs to increase their spending on player acquisition. For example, transfer spending in European football in the summer window increased from 2.5 billion in 2011 to 6.5 billion EUR in 2019. The traditionally less frantic January transfer window doubled from 529 million in 2012 to 1.06 billion EUR in 2020 [
41]. The major leagues’ significant rise in revenue trickled down to smaller leagues that develop the “raw material”: talented young players, usually transferred at ages 18–22. HNL is one of such development leagues that regularly “feed” major European clubs with promising talents.
Although TV revenues will increase substantially in the next four years, the Croatian market and sponsorship potential are just too small to support the existing budgets of top Croatian clubs, so they will continue to rely heavily on transfers. While having a fertile base for producing top players certainly gives Croatia an edge in international football, it is also a double-edged sword because there is no guarantee that clubs will be able to create and transfer quality players on a steady basis to finance their enormous operating losses. One can easily imagine a “dry spell” of less available talent, which would hugely impact the financial health of HNL clubs.
To determine and compare the relative transfer dependency of Croatian clubs, we need to divide transfer sales by operating revenues. Transfer sales is the amount of funds received for selling player registrations. UEFA calculated this ratio for 2020 for 20 European leagues, and HNL is the most dependent on transfer sales: income from selling player registration was 113% of operating revenue in 2020. This is significantly higher than the second and third-placed Czech (81%) and Portuguese (79%) top divisions and way above the 35% average of the other 19 leagues on the list [
6].
For individual HNL clubs, we summed up the annual transfer sales of each club from 2018 to 2021 and divided them by their aggregate yearly operating revenue for this period (
Table 2). Again, on the individual club level, the ratios demonstrate the vast importance of transfers as a source of income. Only Osijek and Slaven Belupo have relatively lower percentages, but even those are high in European comparison. Any significant disruption in the European transfer market or talent production would severely hit all HNL clubs. To assess the viability of the current business model based on transfers, we compared the market value of players and the club’s average annual operating losses (AAOL). Squad market values are taken from Transfermarkt, the world’s largest public football database [
45], an unofficial but widely used source for current player values. However, drawing on these values, one has to be careful. Claessens and Keppel [
46] found that, on average, Transfermarkt’s estimated market value differs by some 60 percent from a player’s actual transfer fee, and more than half of Transfermarkt’s calculations are lower than the actual transfer price.
Nonetheless, since almost everyone in the football world observes Transfermarkt’s values, they most certainly exhibit a firm “anchoring” effect on all parties involved. Research in social psychology has long ago demonstrated that any number, however random and unrelated, influences participants’ decisions. In an extensive 2021 study, Coates and Parshakov [
47] estimate that Transfermarkt values differ by around ±10% from transfer fees. In
Table 2, we divided current squad Transfermarkt values (as of mid-July 2022) with average annual operating losses (AAOL). We constructed the operating loss coverage (OLC) ratio, which indicates how many years of losses a club can finance with potential transfer sales if everything else stays the same—the higher the ratio, the higher the margin of financial safety. This is purely theoretical, but it can still give a rough assessment of the viability of the transfer-based business model.
For example, Dinamo has an OLC of 8.46 which means it can theoretically finance more than eight years of operating losses based solely on its current squad market value. Osijek, Gorica, and Dinamo have the highest operating loss coverage ratio. We see now that one of the reasons Dinamo can relatively quickly cover its operating losses is the high market value of its squad. On the other side, Istra has a low market value regarding its average annual operating losses. They would face a much harder time remaining afloat were it not for the regular yearly loans they receive from their owners. However, what are the benchmark levels for our operating loss coverage ratio? Much more research is needed, especially for leagues and clubs similar to HNL, which have a history of operating losses. As a crude rule of thumb, we carefully estimate that an operating loss coverage ratio in the high single digits and above would give clubs a relatively good buffer against severe financial problems.
In contrast, levels toward the low single digits might indicate a more precarious financial position susceptible to sudden changes in the market environment. In this regard, Hajduk and Rijeka—as clubs competing for top positions in the HNL and a place in UEFA competitions—have much less room for operating blunders. Lokomotiva, for which we earlier remarked about extreme negative operating margins, does have more leeway than initially thought since squad value covers average annual losses seven times over.
4.6. Cash Flow
Analyzing the cash flow picture can give an even better insight into the financial well-being of clubs than the profit and loss account because it includes only actual cash coming in and going out of the club and ignores non-cash accounting items such as amortization. The aggregate HNL cash balance remained relatively stable throughout the 2018–2021 period, despite the pandemic (
Figure 13). However, are those levels sufficient? Coming into 2021, HNL clubs had around 9.2 million EUR in cash: since aggregate salaries for 2021 were 5.9 million EUR on average monthly, clubs had only enough funds to pay for players’ and other employees’ wages for the next 1.6 months. We find very similar figures when we perform this calculation for every fiscal year of the observed period. The cash balance at the end of the reporting period might not be a good representative of cash balances throughout the year. Still, it is evident that Croatian clubs are very low on funds at the end of every calendar year.
The structure of cash flows also paints an interesting picture. Croatian clubs have consistent negative cash flows from their operating activities, i.e., their essential football business. Most of these negative operating cash flows are offset with positive cash flows from investing activities (primarily cash flows from selling player registrations). This correlates with our finding from the previous section that operating accounting losses are balanced with net transfer income. Cash flows from financing activities (e.g., bank loans, borrowing from shareholders and related parties, shareholder equity financing) are less important. It is not easy for Croatian clubs to get bank financing. The collateral required is either hard assets such as stadiums (clubs generally do not own the stadiums they play on, local governments do) or signed TV and sponsorship deals.
This is also visible on the individual club level (
Figure 14). The cash needed to finance the running of a 1. HNL club is primarily acquired through investing activities, i.e., cash income from selling player registrations.
There are two exceptions: Osijek and Istra. Both clubs have aggregate cash flows from financing activities that considerably exceed aggregate cash flows from investing activities. Both clubs also have foreign majority shareholders that heavily financed their assets in this period. Istra received annual loans from its owner, the Spanish group Baskonia Alaves. The majority owner of Osijek, the Hungarian tycoon Lőrinc Mészáros, and its various related businesses finance the building of the clubs’ new stadium and training facilities [
48].
In
Table 3, we see the cash HNL clubs need on average annually from investing and financing activities to fund their negative operating cash flows. Despite more than 70 million EUR in income from UEFA prize money in the last four years, Dinamo still needs 17 million in cash in net transfers and (or) financing activities (bank loans) to manage the “average” year. So far, this has not been a problem because, due to its financial might, Dinamo has built almost a monopoly in acquiring and developing the best national young talent. As the 34th club in Europe, according to the UEFA coefficient ranking for season 2021/22 [
49], Dinamo can thus reliably cash in this talent at premium prices. Hajduk has a high hurdle to tackle, with 11 million EUR cash missing on average annually for normal operations. To fund such a large cash outflow, at the very minimum, Hajduk needs to play regularly in UEFA competition group stages, which the club has failed to do until now (mid-2022). Hajduk does not use bank financing and currently relies heavily on player sales to fund its annual budget, and doing that consistently for 11 million EUR every year without UEFA revenue can prove very risky in the long term. Much of the same can be said for Rijeka; they also need a high amount of cash on average, but they were able to play occasionally in UEFA group stages, and they have a Croatian private owner who intermittently helps the club to bridge financial gaps with loans. Lokomotiva, the fifth HNL club in budget size, must finance its negative operating cash with 4.6 million EUR annually from net transfers and (or) bank loans. This is a high amount considering Lokomotiva has not been able to compete for the national title or UEFA group stages, so selling player registration will probably remain the principal option to fund their budget. The question is also how long the Spanish owners are prepared to finance Istra 1961 on an ongoing basis since the club apparently has no ambition beyond consistently battling to avoid relegation.
We will now divide Transfermarkt squad values with average negative operating cash flows to construct our operating cash coverage (OCC) ratio. The higher the ratio, the higher the “cushion” in terms of market value a club can rely on when offsetting negative operating cash flows.
For instance, with a 6.08 OCC ratio, Dinamo can theoretically (ceteris paribus) cover six years of negative operating cash flows with its current squad market value. The OCC ratio tends to be generally lower than the OLC ratio from the previous section (except for Slaven and Osijek), indicating a lower margin of safety in this department. The interpretation remains the same: regarding operating cash requirements, Osijek, Gorica, and Slaven are probably sufficiently covered with market value, Dinamo and Lokomotiva walk the middle ground, while Hajduk, Rijeka, and especially Istra are at the lower end. We weigh the importance of operating cash more than operating profits (losses); even a small-scale liquidity issue in the day-to-day business might unhinge HNL clubs significantly due to their low cash balances. Since the margin of safety in the OCC ratio is generally lower than the market coverage for operating losses, clubs should be even more attentive in their cash management and planning.
4.7. Balance Sheet
In European football, balance sheet health significantly improved from 2011 to 2019: net equity—the difference between assets and liabilities—increased three-fold. However, then the pandemic hit, and net equity for early-reporting clubs decreased by 25% from 2019 to 2021 (i.e., from 7.05 to 5.3 billion EUR, respectively). Still, the equity of early-reporting clubs provides a robust financial foundation at the end of 2021 since the difference between the value of aggregate assets and aggregate liabilities has more than doubled from 2011 [
6].
We examined the balance sheet health of HNL and present in
Figure 15 the aggregate net equity and debt from 2018 to 2021, as well as the respective annual debt/equity ratios.
Although aggregate net equity decreased by almost 20% between 2018 and 2021, this happened in a pandemic-stricken broader environment, so HNL was no exception. However, as net equity decreased, a positive development occurred with the aggregate debt (short- and long-term debt) of HNL clubs. The pandemic did not increase debt, as one might assume, but quite the opposite—on the aggregate level, debt decreased by 10%. Dividing aggregate debt with aggregate equity gives the debt/equity ratio that enables us to evaluate the balance sheet health of Croatian football on a relative basis. The ratio fluctuated narrowly between 47% in 2018 and 51.8% in 2021. Overall, the debt/equity ratio indicates that HNL has twice as much equity as debt, which is very satisfactory, and the aggregate balance sheet condition could be deemed stable. However, the problem with the aggregate approach is the vast disproportion of equity size among HNL clubs. For example, Hajduk Split has (by far) the highest amount of equity: 60% of total HNL equity in 2018 and 52% in 2021 (
Figure 16).
When we zoom in, we see that the drop in aggregate HNL equity of 20% from 2018 to 2021 can be mainly attributed to just two clubs with a high share in aggregate equity: Hajduk and Rijeka. In 2019, Rijeka had a net loss of 3.9 million EUR written off against equity. In 2020 and 2021, Hajduk Split wrote off net losses of 2.9 million EUR and 3.6 million EUR, respectively, against equity. Lokomotiva and Gorica are recording negative equity on and off, and Slaven Belupo, with equity of just 69,000 EUR in 2021, is not far from dropping into negative territory.
Debt/equity ratios on the individual club level have the same weighting issue. The relatively low debt/equity ratio of the aggregate HNL (51.8% in 2021) is the result of no debt of Hajduk Split, the club with the highest net equity, and low debt of Dinamo Zagreb (debt/equity of 34% in 2021), the club with the second highest amount of equity in the league (
Figure 17).
All other clubs are not in such a comfortable position. Rijeka stands out as a major competitor with a high debt/equity level, and Osijek is progressively getting worse in that department. Add the highly volatile equity positions in Lokomotiva, Gorica, and Slaven, and the balance sheet health of HNL clubs on the individual level suddenly looks less rosy than on the aggregate. Although FFP requires positive equity, no serious sanctions were considered for non-compliance. Reporting negative equity would only trigger obligations for the club to deliver future financial information to demonstrate the ability to continue as a going concern. However, a new net equity rule is set by FSR that will come into effect on 1 June 2023, though for the first two seasons of its existence, non-compliance with this rule will not lead to license refusal, but to a sanction to be determined by UEFA [
50].
We need to notice that asset values on the balance sheet typically do not reflect their actual value in most businesses. For instance, the market value of corporations on stock exchanges is usually higher than their net equity value because accounting practices book assets at historical prices and omit various intangibles such as brand value, customer loyalty, etc. In Croatia, where local municipalities typically own the stadiums, player registration rights are the most important asset of any football club. The market value of players is probably better captured on mass participation platforms such as Transfermarkt (see
Table 2 and
Table 3) than on the club’s balance sheets. Therefore, the capability of HNL clubs to service total debt is, in all likelihood, much better than what
Figure 17 indicates.
5. Discussion
Our analysis revealed one financial aspect of the 1. HNL football, common to many smaller leagues: significant operating losses, which are covered with net transfer income. HNL and the limited size of the Croatian market do not have the necessary commercial, sponsorship, and TV potential to bring in sufficient revenues to run operating profits. Intending to live within their means (within the scope of their essential football revenues), HNL clubs would need to significantly cut their expenses, which would immediately undermine their competitiveness. In a time where player wages are constantly growing, this would practically push Croatian football back into amateurism, which is not something anybody wants to see.
At first, competing for quality players at ever-increasing wages and a relatively limited market for generating revenue growth seems poised to be fatal in the long term. Luckily for clubs from non-major European leagues, this story has a positive side. The new football ecosystem that emerged in the last two decades is characterized by substantial revenue increases in major European leagues (mainly driven by TV deals), which leads to higher player wages and spending on acquiring talented players. Many smaller “development” leagues with a good track record of producing quality players profit from this. They can use transfer income to cover operating losses and reinvest them into squad building to remain relatively competitive.
However, despite operating losses being quite common in Europe outside of the “Big Five” majors, the size of these losses for HNL clubs is disconcerting, regardless of the peers we compared it to. Top Croatian clubs are currently enjoying favourable conditions in the international transfer market; they manage to sell talent “upstream” to stronger leagues and cover their operating losses relatively painlessly. We also noticed that, except for Istra, they probably have a sufficient safety margin in squad market value for the operating losses and negative operating cash flows they regularly register, at least in ordinary circumstances.
Nevertheless, they should be on the lookout. Operating losses are high because wages are high; by any comparative yardstick, wages in HNL stick through the roof. In some regard, this resembles chasing one’s tail. For example, for Dinamo to retain its high ranking and market value, it must keep winning national titles and playing in the UEFA competition group stages. To be able to do that, they have to acquire caliber players. Quality players demand relatively high wages, which only keep getting bigger due to the international trend of rising wages. This, in turn, increases Dinamo’s wage bill and total expenses. Generally, no matter how much they increase their revenues, expenses (salaries) will also grow, keeping the operating loss approximately the same. Operating losses are funded with transfer sales, and everything is back at the beginning.
The trend of increasing wages internationally and domestically by Dinamo prompts its main competitors—Hajduk, Rijeka, and Osijek—to increase wages for quality players too, and not just to challenge Dinamo, but merely to stay in the same place. The result is an arms race in wages that is ultimately very risky for every club involved, regardless of its current stature. Wages are long-term, relatively inflexible commitments, and any internal or external shock can impede the ability of clubs to service them.
Major league clubs can compete for elite players and increase their wage bills. They do that from a position of operating profits generated because of the size and growth of the football industry in their markets. This is a world away from the Croatian situation. The initiated arms race resembles a game of musical chairs. When the music stops (for whatever macro reasons mentioned: recessions, transfer market freezes, stricter regulations, transitory or permanent reduction of talent in Croatia), there will be losers, both in sporting and financial terms. Croatian elite clubs willingly participating in the arms race are perhaps unaware of the strange paradox that could wait at the end of the line—even the winner could end up financially worse and with a much higher need from future transfer proceeds.
What can be done to decrease operating losses and lessen transfer dependency? The obvious answer for all major Croatian clubs except Dinamo is to start regularly appearing in UEFA competition group stages, where the real money that makes a difference lies. The prize money for reaching Conference League and Europa League group stages in season 2022/23 is 2.8 and 3.4 million EUR, respectively [
51]. (We take a cautious stance here and do not consider regular participation in Champions League group stages a realistic scenario). UEFA prize money would give a tremendous boost to operating revenues. For example, Osijek and Lokomotiva could eliminate the need for transfer sales, and Gorica would even record operating profits. Although their financials would significantly improve, Hajduk and Rijeka would still need millions of euros of net transfer income annually.
However, there are a few caveats when counting solely on UEFA revenue to increase operating margins. First, all evidence points to the fact that this is no easy feat to achieve. Besides Dinamo, a UEFA regular, Rijeka is the only Croatian club that managed to enter the Europa League group stages—four times in the last nine seasons. Since UEFA introduced the Champions Path in the Champions League in 2009, national title winners can reach the competition group stages much easier than their domestic rivals that ended up in second or third place or even won the national cup. On their road to group stages, Croatian clubs other than the national champion are often pitted against strong international opposition with a higher club coefficient ranking, leaving much of their possible financial success to the luck of the annual draw.
Being left to the mercy of the draw directly relates to the second caveat—the necessity of regularly appearing in group stages. One-time participation is all but meaningless (and sometimes even harmful) in the mid and long term. It would only give a club a temporary financial boost in operating revenue that would quickly be expended but signed player commitments would still linger on for some time.
The third caveat is a more disturbing one—regular participation in UEFA competitions group stages did nothing to decrease operating losses and stabilize the transfer dependency of Dinamo. It did nothing for Rijeka, too, as an irregular participant. The reason is the one labelled earlier as chasing one’s tail. As UEFA prize money starts pouring in, lifting revenues, expenses rise too (especially wages) along with club management ambitions. However, since costs (wages) are relatively inflexible, expenses and club ambitions usually remain unrealistically elevated when revenues take a dive.
Nevertheless, reaching the UEFA group stages is a desirable goal to aim for. Still, it is clear that to achieve self-sustainability, it needs to go hand-in-hand with more scrutiny on the expenses part of the financial equation. Because of the relative size of operating losses, we do not believe they can be balanced sustainably anytime soon. However, clubs should undertake financial efforts to mitigate operating losses, at least in the midterm.
First, clubs should commit to bringing down—gradually and orderly—the unacceptable high wage-to-revenue ratio from above 100% to a more manageable 70–80% level in the next 5 to 7 years. Only a more permanent stabilization near the 70–80% range (e.g., three years in a row) should be counted as a success (ignoring possible one-time hits because of windfall gains).
Second, clubs should commit to increasing operating margins—gradually and orderly—from the current absurd low levels of −70% to −90% towards a more acceptable range of −20% to −30%. Even if revenues stay the same, operating margins will increase automatically if the first recommendation of cautiously lowering the wage-to-revenue ratio is implemented, since this will result in lower costs. More effort can still be exerted to increase revenues besides UEFA money. For example, while we do not have financial data for 2022 yet, it seems that new, innovative marketing approaches in Hajduk Split succeeded in squeezing more financial potential from existing commercial and merchandising revenue sources. Thinking outside the box in HNL clubs will undoubtedly be a prerequisite for increasing operating revenue. As with our first recommendation, we consider one-time achievements meaningless; only a more permanent stabilization near the −20% to −30% levels (e.g., three years in a row) should qualify as a pass.
To ensure the implementation (regardless of possible management changes), clubs should include these or similar measurable indicators in their strategies and long-term business plans. We do not see why this prudent and easily supervised approach should not be attainable in the midterm. Ultimately, it would result in Croatian clubs being more financially stable and more resilient to future vagaries of the domestic and international economic and football landscape.
In addition to financial goals, clubs should laboriously work on long-term internal development objectives as well. Financial and development goals should not be considered unrelated or competing but complementary. In reality, most Croatian clubs will rely on transfer income to various degrees for quite some time in the future. The transfer market values young players the highest. Therefore, long-term plans and strategies of HNL clubs should focus on investing in youth development and promoting young players. That does not mean fielding eleven youngsters in the first XI, which would undoubtedly negatively affect current results, but consistently employing a few of the most talented youths from the age bracket with the highest development and selling price potential (18–22 years). A mix of more experienced players and a few youth gems can satisfy the need for competitiveness and financial sustainability.
The focus on internal, organic development yields another bonus for clubs—the continuous production of quality home-grown players will, in time, lower their relative wage bill since clubs will be less pressed to participate in the wage arms race for talented outside players. Thus, it will support their efforts to achieve the stated financial goals in the mid and long term.
To counterbalance the inherent drive of management to invest in immediate success at the expense of long-term development, club strategies and plans should include mandatory provisions that a certain percentage of every transfer sale (e.g., 3–7%) must be reinvested back into youth academies, infrastructure, and other development fostering segments (staff, state-of-the-art training gear and facilities, education, science, and technology) to ensure a constant and sustainable flow of football talent. For illustrative purposes, we stress one example among many: the investment in advanced data analytics is a practice seriously underused in Croatia, yet one that can help assess the strengths and weaknesses of current in-house squads more objectively and streamline the screening, evaluation, and acquisition of possibly underrated outside talent.


