Article

Cyclic True Triaxial Tests on Aeolian Sand Considering Initial Shear Effect

1
School of Physics and Electronic-Electrical Engineering, Ningxia University, Yinchuan 750021, China
2
Solid Mechanics Institute, Ningxia University, Yinchuan 750021, China
3
School of Civil and Hydraulic Engineering, Ningxia University, Yinchuan 750021, China
4
Ningxia Center for Research on Earthquake Protection and Disaster Mitigation in Civil Engineering, Yinchuan 750021, China
5
Key Laboratory of Geotechnical and Underground Engineering of Ministry of Education, Department of Geotechnical Engineering, Tongji University, Shanghai 200092, China
*
Author to whom correspondence should be addressed.
Sustainability 2022, 14(24), 16730; https://doi.org/10.3390/su142416730
Submission received: 22 November 2022 / Revised: 9 December 2022 / Accepted: 12 December 2022 / Published: 13 December 2022
(This article belongs to the Special Issue Soil Dynamics and Earthquake Engineering in Sustainability)

Abstract

:
Under traffic loading, the soil elements in subgrade are subjected to a complex 3D stress path. To investigate the cyclic behavior of desert subgrade under initial shear stress conditions, the number of cyclic true triaxial tests were implemented on aeolian sand from the Tengger Desert. A large range of initial shear stress levels and different cyclic stress paths (various combinations of cyclic major and intermediate principal stresses) were designed in the experiments. The results show that the initial shear stress level significantly influences the cyclic response, and the response mode of aeolian sand under initial shear stress is incremental failure and elastic shakedown, while it is critical failure without initial shear stress. With the increase in initial shear stress, the permanent strain increases first and then decreases, with the maximum permanent strain occurring at q0 = 50 kPa. Moreover, by comparing the test data under different cyclic stress paths, it is found that the cyclic resistance decreases with the increase in the coefficient of cyclic intermediate principal stress bcyc. Compared to the limiting pore pressure criterion, the conventional 5% axial strain failure criterion may overestimate the cyclic resistance, leading to unsafe evaluation and design. Therefore, by using the pore pressure criterion, the relationship between the limit pore pressure ratio and the initial stress condition was investigated and it was found that the limit pore pressure ratio decreased linearly when the initial shear stress increased.

1. Introduction

In practical engineering, soil is usually in a complex three-dimensional static and dynamic state, so it is of great practical significance to study the mechanical behavior of soil under three-dimensional stress state. Slope, foundation pit, and subgrade in the construction stage are mainly under static loading, while the long-term use and maintenance should consider the combining action of dynamic and static loads, especially for the subgrade under long-term traffic loading. For safety design, a full understanding of the static liquefaction, cyclic liquefaction, and shakedown of sandy soils are very important. Those phenomena have been studied through geotechnical investigations, model tests, and laboratory experiments [1,2,3]. Conventional triaxial tests are used extensively to measure the static and cyclic characteristics of soil because of the convenient operation [4,5,6]. However, in the conventional triaxial test, the cylindrical specimen is under an axisymmetric stress state, as a static test can only control the principal stress in two directions independently, and a dynamic test can only apply one or two cyclic loads, which is quite different from the actual three-dimensional stress state [7,8]. Therefore, some researchers began to carry out cyclic true triaxial tests [9,10], and the deformation characteristics of soil under two cyclic principal stresses were studied.
During the process of natural deposition, gravitational force leads to anisotropic consolidation and results in initial shear stress q0. The cyclic triaxial tests were conducted on anisotropic consolidated samples to measure the dynamic behavior of sand under non-zero q0, wherein the cyclic stress was superimposed on the initial shear stress. Tests results illustrate that there is a significant difference in the cyclic response of sand between non-zero and zero initial shear stress [11,12,13]. Lee and Seed [14] implemented a large number of cyclic triaxial tests, and they indicate that the existence of q0 may improve the liquefaction resistance of sand. However, Ma [15] shows that the effect of q0 on liquefaction resistance depends on the level of q0, and the liquefaction resistance is increased by a lower q0, while it is decreased by a higher q0. Vaid and Chern [16,17] also obtain similar conclusions, and it is shown that the resistance of liquefaction might show an increase or decrease trend with the existence of q0, which depends on the relative density of the sand. A possible explanation for the above conflicting observations by Harder and Boulanger [18] is that the q0 plays different roles of in loose sand and dense sand. For dense sand, the q0 may improve its liquefaction resistance, while for loose sand, it becomes damaged when the q0 is higher. Recently, a unified relationship between state parameter ψ [19] and liquefaction resistance of Toyoura sand was established by Yang and Sze [20,21], which considered the influence of initial density and confining pressure. However, most of the existing studies use axisymmetric triaxial tests or hollow torsional shear tests to investigate the cyclic behaviors of sand under initial shear stress conditions, where the cyclic loading is confined to one-dimensional loading and the test range is limited.
The true triaxial apparatus can load independently on three orthogonal planes of a cubic soil specimen, and the static and dynamic characteristics of soil can be measured in true three-dimensional space [22,23,24]. Three orthogonal principal stress loading proportions are controlled by the coefficient of intermediate principal stress (b = (σ1σ3)/(σ2σ3)) [25,26]. Based on a series of true triaxial tests, Li et al. [25,26] studied the mechanical behavior of saturated aeolian sand under true triaxial conditions, and found that the b had a significant influence on stress–strain, pore pressure, and critical state. Shi et al. [22] investigated the influence of b on the stress–strain relationship and strength behavior of coarse-grained soil, and a shape function g(b) on π-plane was introduced. However, the cyclic tests under true triaxial conditions are rarely studied, only Wang et al. [10] implemented the number of axial and lateral cyclic triaxial tests to study the deformation characteristics of gravel under different lateral cyclic conditions. The results suggest that the intermediate principal stress has a significant influence on the strain behavior of the specimen.
As the subgrade soils are subjected to large numbers of load (104–105 cycles) at a stress level lower than its shear strength [27], the deformation characteristics of soil under long-term cyclic loading are particularly important. The shakedown theory was proposed by Melan [28] firstly, and it has been extensively used to describe the cyclic response of subgrade soils under traffic loading. For pavement design [29,30,31] and railway track foundation design [32,33,34], the critical dynamic stress is used as the design load to distinguish the stable state from the unstable state of the pavement or track foundation. Mamou et al. [32,33,34] observed that once the critical dynamic stress was exceeded, the rate of stiffness degradation, excess pore pressure generation, and axial strain accumulation grew significantly, leading to the eventual failure of the soil. Based on a series of cyclic triaxial tests under different stress paths, the permanent deformation model with the loading cycles can be classified into three types: plastic shakedown, plastic creep, and incremental failure, according to the value of εp5000εp3000 that are the permanent strain obtained at the 5000th and 3000th loading cycles during tests. Nevertheless, some researchers [35,36,37] state that this method is problematic because the classification results based on this method do not match the real test results.
Moreover, a large number of tests found that the characteristic of pore pressure in the specimens could not reach the initial mean stress, and there may be a limiting value far below the initial mean stress. Therefore, the effective stress can never reach zero [38,39]. Hyodo et al. [40] reveal that the limiting value of pore water pressure decreases with the increase in initial shear stress. It is also found that the direction of initial shear stress also influences the development of pore pressure. To quantitatively describe the development of pore pressure under cyclic loading, some methods have been put forward on the basis of cyclic triaxial tests. Based on Seed’s pioneering work [41], an empirical model was developed and the relationship between cycle number and pore pressure was derived. The model has been used extensively for the prediction of the pore pressure development with the number of loading cycles [42,43]. For example, based on the above model, Pan et al. [44,45,46] proposed a modified pore pressure accumulation model, which can be used to describe the development of pore pressure under different initial shear stress conditions. Although there are many models that can be applied to predict the development of cyclic pore pressure, the following discussion should be considered. All the above studies are based on the cyclic triaxial test under an axisymmetric state, without considering the influence of three-dimensional cyclic stress path on pore pressure. Recent work by Zhang et al. [9] observed that the limiting values of pore pressure are highly related to the level of cyclic intermediate principal stress.
To investigate the cyclic behavior of desert subgrade under initial shear stress conditions, a large number of cyclic true triaxial tests were implemented on aeolian sand from the Tengger Desert. At the same time, the construction of the Wuma highway was used as the background, which is located at the southern edge of the Tengger Desert. The effect of the interaction between the two cyclic principal stresses on the cyclic behavior of anisotropic consolidated specimens was taken into account. The differences in strain and pore pressure development under different initial shear stress levels were emphasized, in which the factors of cyclic shear stress amplitude qampl, and the coefficient of cyclic intermediate principal stress bcyc were considered. The applicability of strain failure criterion and limiting pore pressure criterion under three-dimensional stress conditions were compared.

2. Test Procedures

2.1. Test Apparatus and Specimen Preparation

The automated true triaxial apparatus developed by GDS Corporation in England was employed in this study. It can perform many functions, including isotropic and anisotropic consolidation, as well as various loading modes (see [47] for details). The most prominent merits of this device are: (1) the cyclic major principal stress (vertical direction) and the cyclic intermediate principal stress (horizontal direction) can be applied simultaneously; (2) the rigid–flexible mixed boundary control is adopted, the major and intermediate principal stresses are applied by metal plates, and the minor principal stress σ3 is commonly provided by confining pressure, loaded with water (flexible loading).
Aeolian sand was used in all tests, which is a uniform fine sand taken from a depth of 1 m below the southern edge of the Tengger Desert [48]. The primary properties of the aeolian sand are shown in Table 1.
Dry deposition method was used to prepare the cubic specimens of 75 mm × 75 mm × 150 mm, which can simulate the formation process of aeolian sand and make the specimens have an initial fabric closer to the field environment (see [47] for details). The aeolian sand specimens used in this test were all medium-dense sand with a relative density of 50%. The specimens were saturated with back pressure. All the specimens were completely saturated in this study, and the Skempton’s B value was higher than 0.96.

2.2. Test Program

Isotropic consolidation was performed on saturated specimens first, and then the initial shear stress was applied. The samples were anisotropically consolidated by applying initial shear stress while keeping σ2 = σ3, considering that the depositional plane of specimens is transverse isotropy. The initial shear stress q0 can be calculated as follows:
q 0 = 2 2 σ 1 σ 2 2 + σ 1 σ 3 2 + σ 2 σ 3 2 = σ 1 σ 2
Figure 1 shows the consolidation and cyclic stress paths of the specimen in the cyclic true triaxial test. In a cyclic test, sine wave load with constant amplitude is applied, that is, only compressional stress without extensional stress, and there is no phase difference between the cyclic major and intermediate principal stresses. Different planar cyclic stress paths are applied by controlling the proportion of cyclic major principal stress Δσ1 and intermediate principal stress Δσ2. A parameter named the coefficient of cyclic intermediate principal stress bcyc is used to represent the interaction between Δσ1 and Δσ2, as follows:
b cyc = σ 2 ampl σ 3 ampl σ 1 ampl σ 3 ampl = σ 2 ampl σ 1 ampl
where σ 1 ampl , σ 2 ampl , and σ 3 ampl are the amplitudes of cyclic major, intermediate, and minor principal stresses, respectively. The minor principal stress σ3 is kept constant during the cycles (i.e., σ 3 ampl = 0) because considering that σ 3 ampl is small enough, it can be neglected in the stress field induced by traffic loading [27]. Therefore, the slope of the stress path in the σ1-σ2 plane is exactly the value of bcyc. Under three-dimensional stress state, the cyclic stress state of soil is described by the cyclic shear stress amplitude qampl, which is expressed as follows.
q ampl = 2 2 σ 1 ampl σ 2 ampl 2 + σ 1 ampl σ 3 ampl 2 + σ 2 ampl σ 3 ampl 2 = σ 1 ampl 1 b cyc + b cyc 2
For comparison, the initial effective confining pressure of all specimens were 100 kPa. In cyclic shear, the number of cycles for cyclic loading was set to 10,000 (the test terminates prematurely if the specimens fail before that). The frequency was 1 Hz, which was regarded as representative for real traffic [49]. Considering the high loading speed of traffic loading, all tests were carried out under undrained condition. Table 2 summarizes all of the test conditions, which include 36 cyclic true triaxial tests under various combinations of q0, bcyc, and qampl. Four values of q0 (0, 50, 100, 150 kPa), which cover both isotropically and anisotropically consolidated samples, were considered in this study. Three values of bcyc (0, 0.4, and 0.8) were employed to represent different cyclic stress paths. When bcyc = 0, it is actually the one-dimensional cyclic loading that is only loaded in the vertical direction of the specimen deposition plane. By comparing the experimental results of bcyc = 0.4 and bcyc = 0.8, the different cyclic behavior of planar and one-way cyclic loading can be measured. qampl values ranging from 20 kPa to 40 kPa were considered for studying the cyclic behavior of aeolian sand in different cyclic response modes.

3. Test Results and Discussion

3.1. Strains Development under One-Dimensional Cyclic Loading

Figure 2 shows the typical strain development under one-dimensional cyclic loading, including q0 = 0 kPa, lower q0, and higher q0. In each figure, the time–history curves of axial strains (ε1) and horizontal strains (ε2) are presented. Three different cyclic response modes can be observed in the test: critical failure, incremental failure, and elastic shakedown.
Figure 2a shows the critical failure for the isotropically consolidated specimen. It can be seen that the strain starts to develop slowly under cyclic loading. The increase in strain is accelerated when it comes to 400 cycles, and, thereafter, tends to approach a large value, resulting in the failure of the specimen. Figure 2b illustrates the typical results of the aeolian sand with a small q0. In this figure, a typical behavior of the incremental failure can be observed, which is different from the critical failure shown in Figure 2a. The strain of the specimen develops rapidly at the beginning of loading, and the rate of strain accumulation decreases gradually with the cyclic loading, as observed in Figure 2b. Figure 2c shows the elastic shakedown of the aeolian sand with a large initial shear stress. In the figure, an abrupt increase in the strain is evident in the first cycles, while, in the following cycles, the strain does not rise. The plastic deformation is no longer developed (εp5000εp3000 < 1%), and the whole specimen presents elastic characteristics. Although the experimental phenomena in Figure 2b, and c are similar, significantly differences still exist. For example, in the beginning cycles, the rate of strain increase in Figure 2c is faster than that in Figure 2b, whereas the rate of strain increase is almost 0 in Figure 2c at the end of loading, while in Figure 2b the strain is still increasing at a slow rate.
To make a comparison among different kinds of cyclic behavior about the cyclic resistance, Hyodo et al. [50] and Ishihara [51] proposed the failure criterion based on strain. This approach uses the 5% single-amplitude axial strain to determine the liquefaction or failure state of sand. In Figure 2, the number of cycles when the axial strain reaches 5% is also shown. It should be noted that for the elastic shakedown response mode, the deformation of the specimen tends to be stable after 1000 cycles, and the failure criterion of axial strain 5% is not reached after 10,000 cycles, as shown in Figure 2c.
In order to analyze the effect of q0 on the deformation of specimen, Figure 3 depicts the variation of axial and horizontal strains with loading cycles under different q0 in the bcyc = 0 test. In general, the q0 has a significant effect on the deformation mode of the specimen, and with the increase in q0, the ultimate deformation mode of the specimen is elastic shakedown.
Figure 3a shows a comparison between different q0 under small cyclic stress (qampl = 20 kPa) about the cyclic response of the specimen. The strain that occurs in all tests is less than 0.1%, except for the test under q0 = 150 kPa. For the test of qampl = 30 kPa, the deformation of the specimen is the largest in the q0 = 50 kPa test and the smallest in the q0 = 150 kPa test, as shown in Figure 3b. Figure 3c shows the cyclic response under qampl = 40 kPa. With the increase in q0, the cyclic response of the specimen is close to critical failure, incremental failure, and elastic stability. The maximum deformation is observed in the q0 = 50 kPa test.

3.2. Strains Development under Two-Dimensional Cyclic Loading

This part mainly illustrates the test results of strains under the interaction of two cyclic principal stresses. Figure 4 shows time–history curves of axial and horizontal strain under different bcyc. Overall, with the increase in bcyc, the cyclic resistance is decreasing. Under the condition of q0 = 0 kPa, the failure mode of aeolian sand is critical failure, and under the condition of non-zero q0, the cyclic response is incremental failure and elastic shakedown.
The interaction of these two cyclic principal stresses has a significant effect on the development of strains, and the effect is related to both qampl and q0. For the test of q0 = 0 kPa, as bcyc increases, the number of cycles in which it reaches critical failure increases, which means that its cyclic resistance decreases, as shown in Figure 4a. For the test of q0 = 50 kPa, the cyclic response for all tests is incremental failure, that is, the strain increases rapidly during the early stages of cycling, which is shown in Figure 4b. When bcyc = 0.8, because of the influence of the cyclic intermediate principal stress, a large axial strain is produced in the beginning cycles, resulting in a significant degradation of stiffness and the specimens reach failure in 400 cycles. For the test of q0 ˃ 50 kPa, the cyclic response of all specimens is elastic shakedown, and the values of strain components are obviously decreased, as shown in Figure 4c,d. In the case of bcyc = 0.8, at N = 5000, the axial strain when q0 = 100 kPa is approximately 1.5 times that of q0 = 150 kPa (7.1% vs. 4.6%). Furthermore, the existence of q0 would change the direction of horizontal strain. For example, in the test of bcyc = 0.4 and 0.8 in Figure 4a, the horizontal strain is positive, which is the opposite of the characteristics reflected in the other figure.
To show the effects of q0 on permanent deformation of specimen more clearly, the ε1p at N = 100 and 1000 under different q0 are replotted in Figure 5. It is clear that the ε1p is the largest in the q0 = 50 kPa tests, which corresponds to the bcyc = 0 tests. It can be concluded that the lower q0 could increase the deformation of the specimen while the higher q0 could reduce the deformation. In addition, Figure 5 shows that ε1p tends to increase with increasing qampl, whereas qampl has little influence on the trend of ε1p-q0 curves. This is inconsistent with the conclusions obtained in previous studies [15,16,17]. This indicates that saturated sand has different properties under true triaxial conditions.
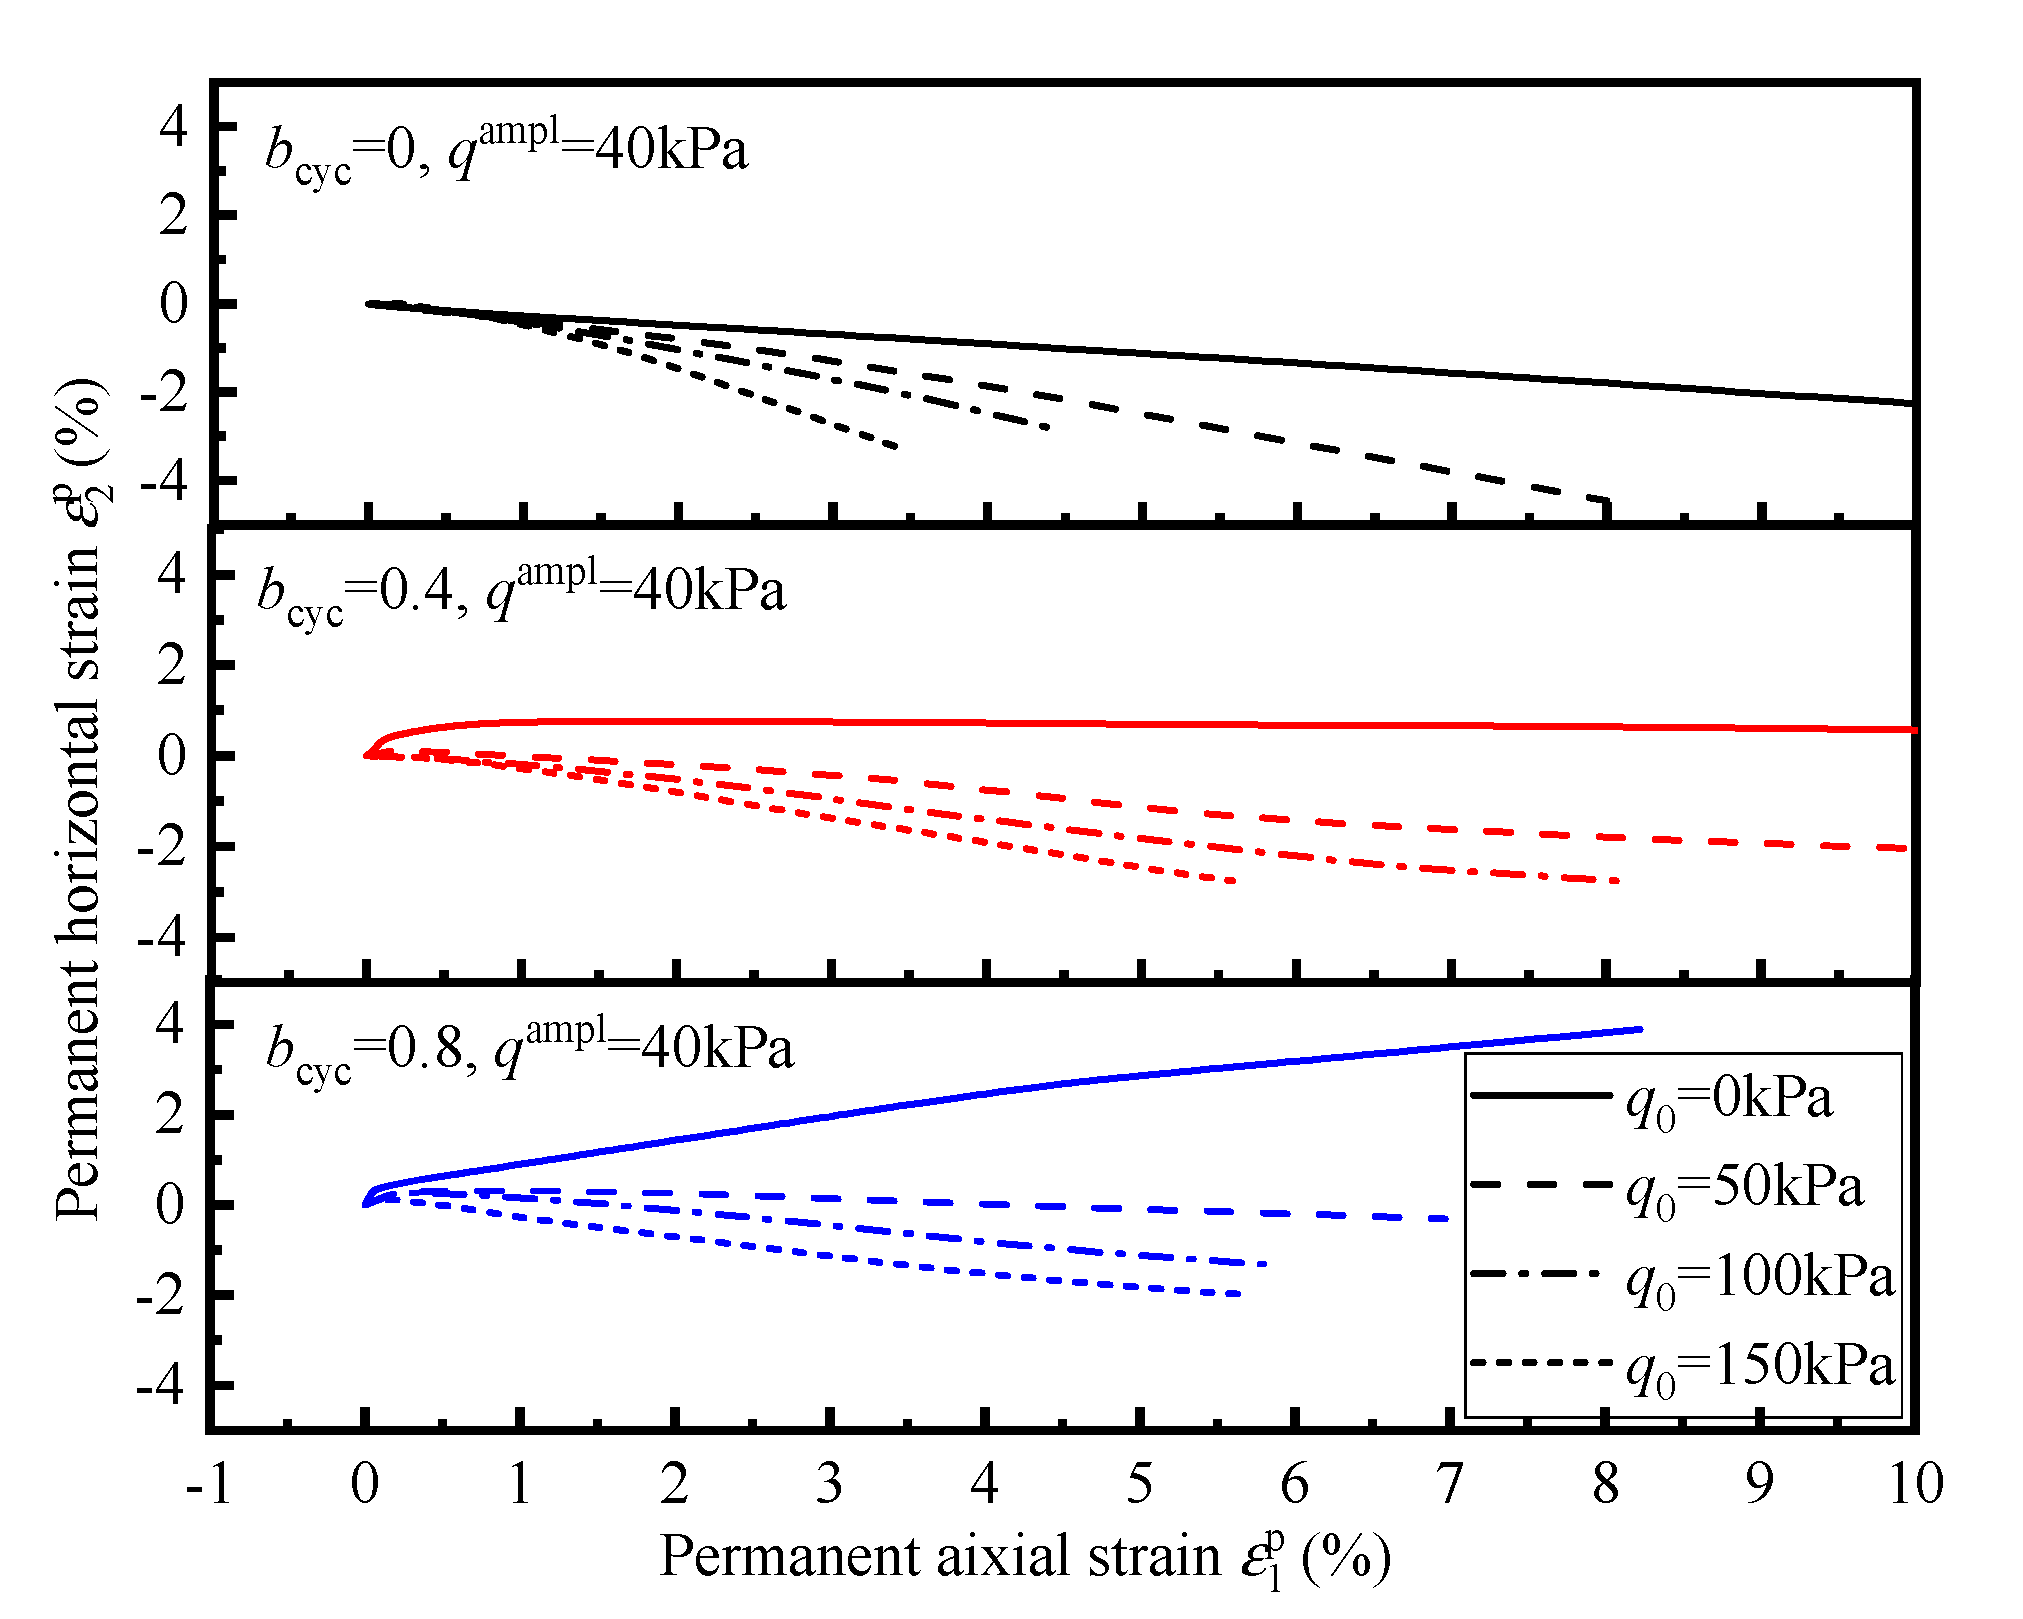
Figure 6 compares ε1p-ε2p curves under different level of q0. The slope of the ε1p-ε2p curves indicates the direction of its permanent strain path. The figure shows that the ε1p-ε2p curves have a similar trend under different q0, with the increase in q0, the length of ε1p-ε2p curves decreases and the direction of ε1p-ε2p curves rotates counterclockwise. For the test of bcyc = 0, all of the ε1p-ε2p curves are below horizon, which means that ε2p is always negative. For the test of bcyc = 0.4 and 0.8, the ε1p-ε2p curves are above the horizon line only at q0 = 0 kPa. Moreover, the slope of the ε1p-ε2p curves increases with the increase in bcyc, implying that the increase in bcyc leads to the increase in ε2p.
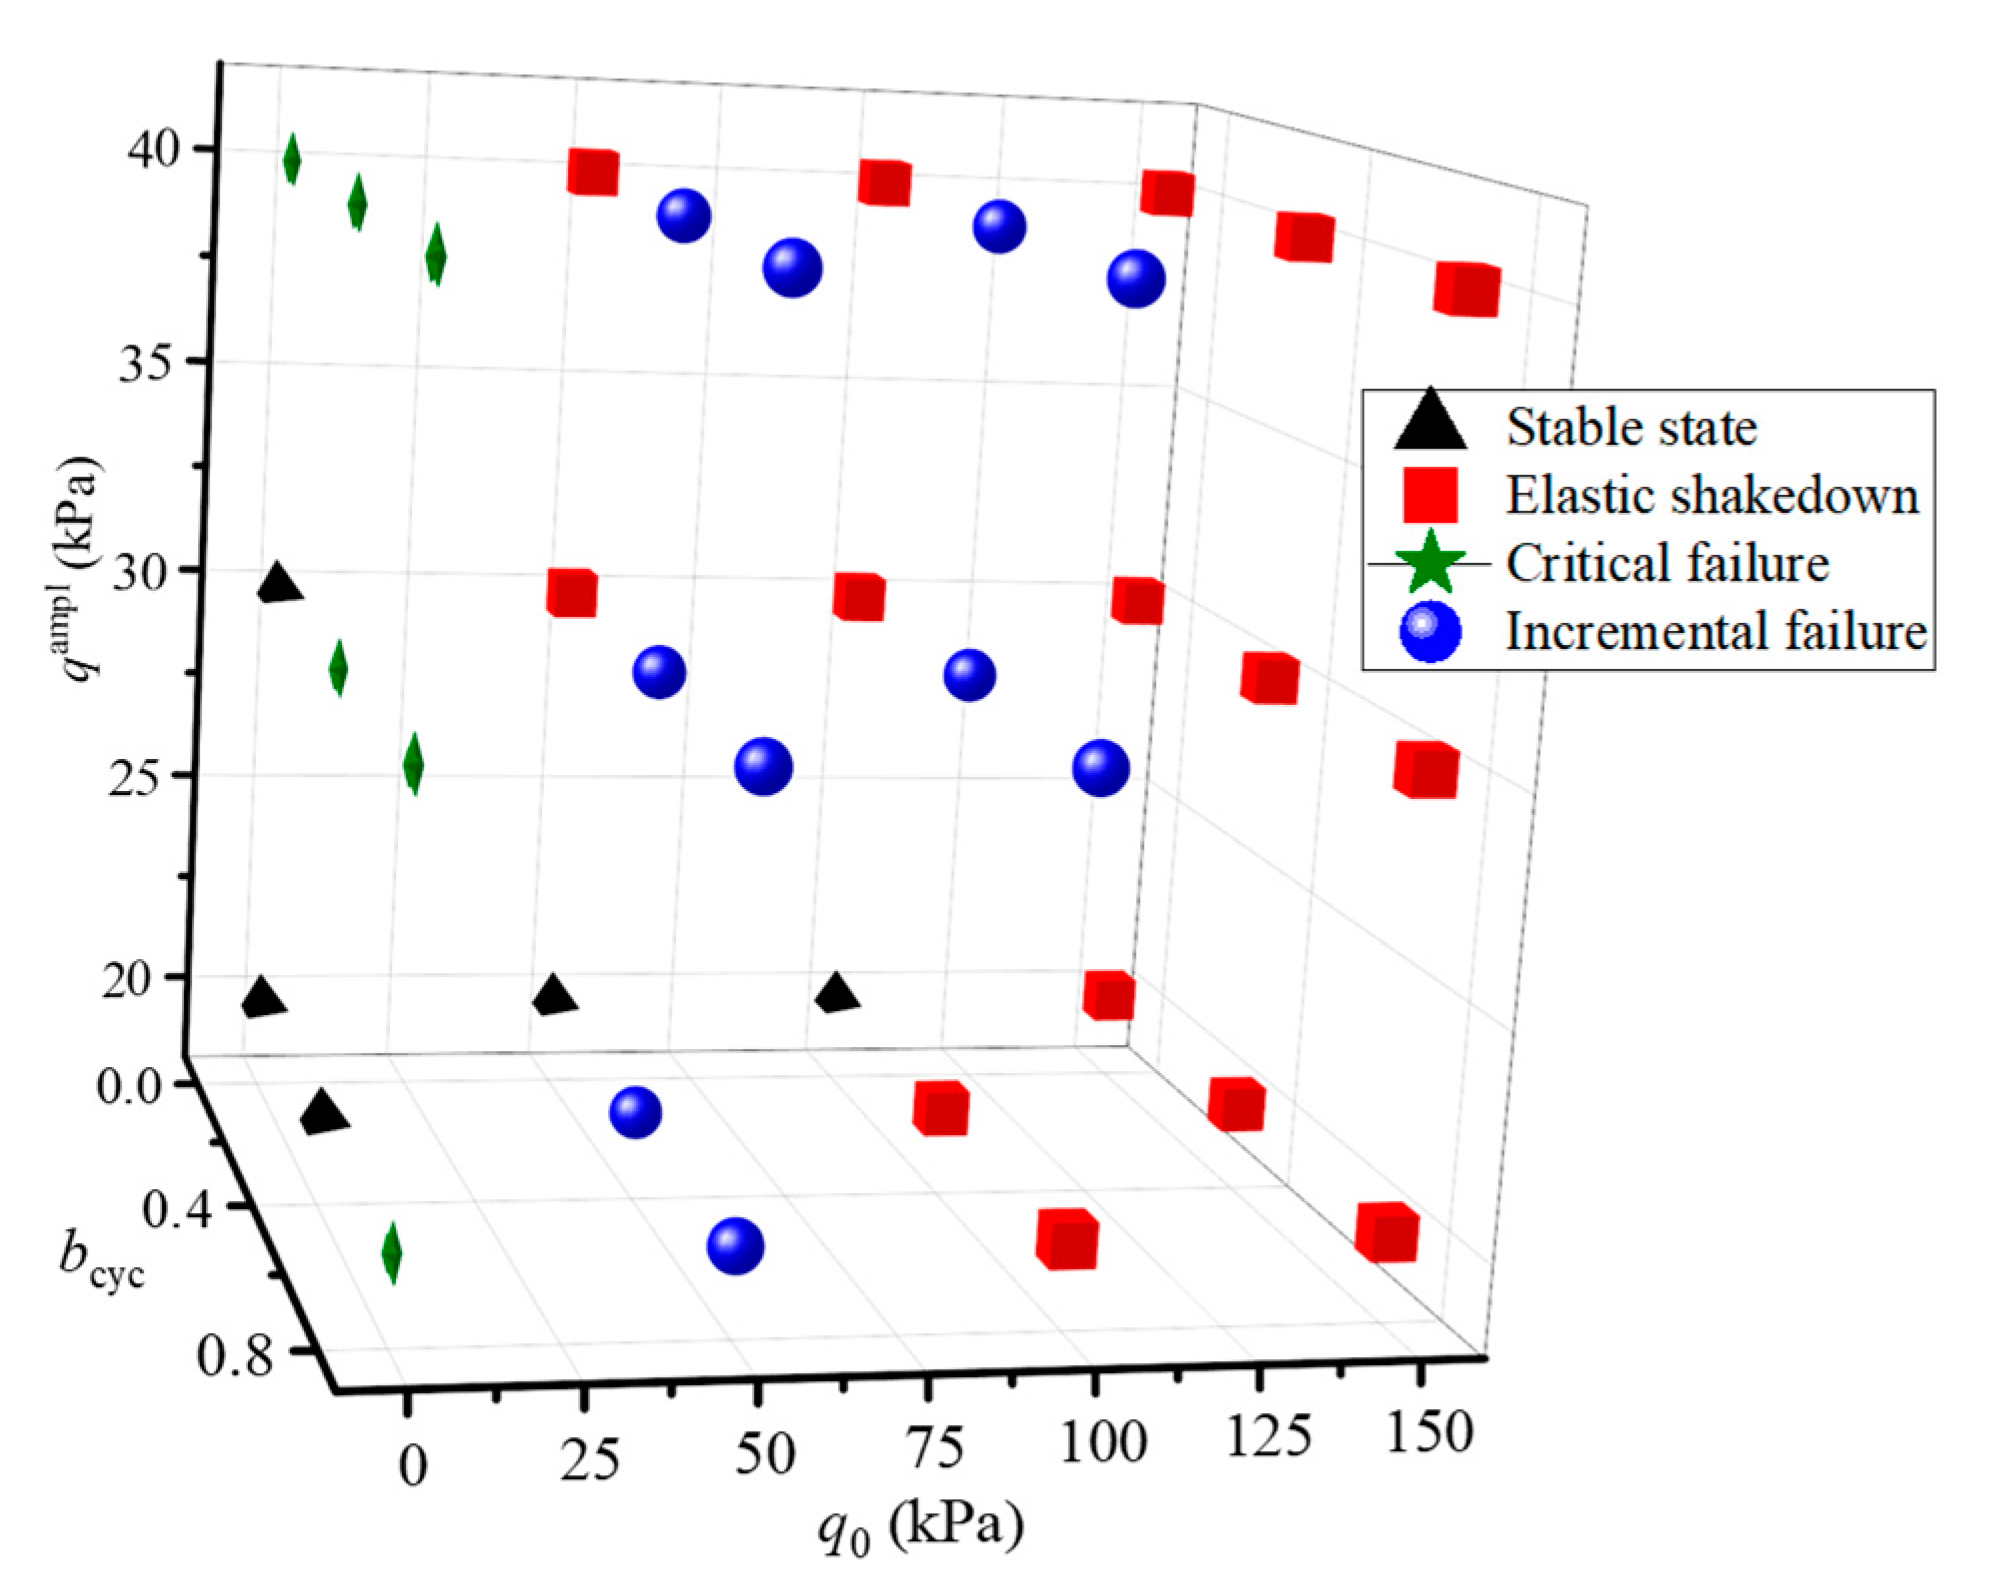
The above results show that the cyclic response of saturated aeolian sand depends on qampl, bcyc, and q0. Figure 7 summarizes the cyclic response of the tests under different stress conditions. In this figure, in addition to the three response modes for larger deformations, there is a stable mode with minimal permanent strain (<0.1%). It can be seen from the figure that the cyclic response of all specimens is elastic shakedown type at q0 = 150 kPa. Under the condition of q0 = 50 kPa, the cyclic response of specimens is mainly incremental failure. In particular, all the critical failures occur at q0 = 0 kPa.

3.3. The Development of Pore Pressure

Under the dynamic loading, the excess pore pressure of saturated soils can be classified into two parts: transient and residual pore pressure. The transient pore pressure is the real-time pore pressure during loading and unloading, which has a relatively weaker effect on the variation of effective stress in soil. However, the residual pore pressure directly affects the effective stress in soil, which is the accumulated pore pressure at the end of each cycle.
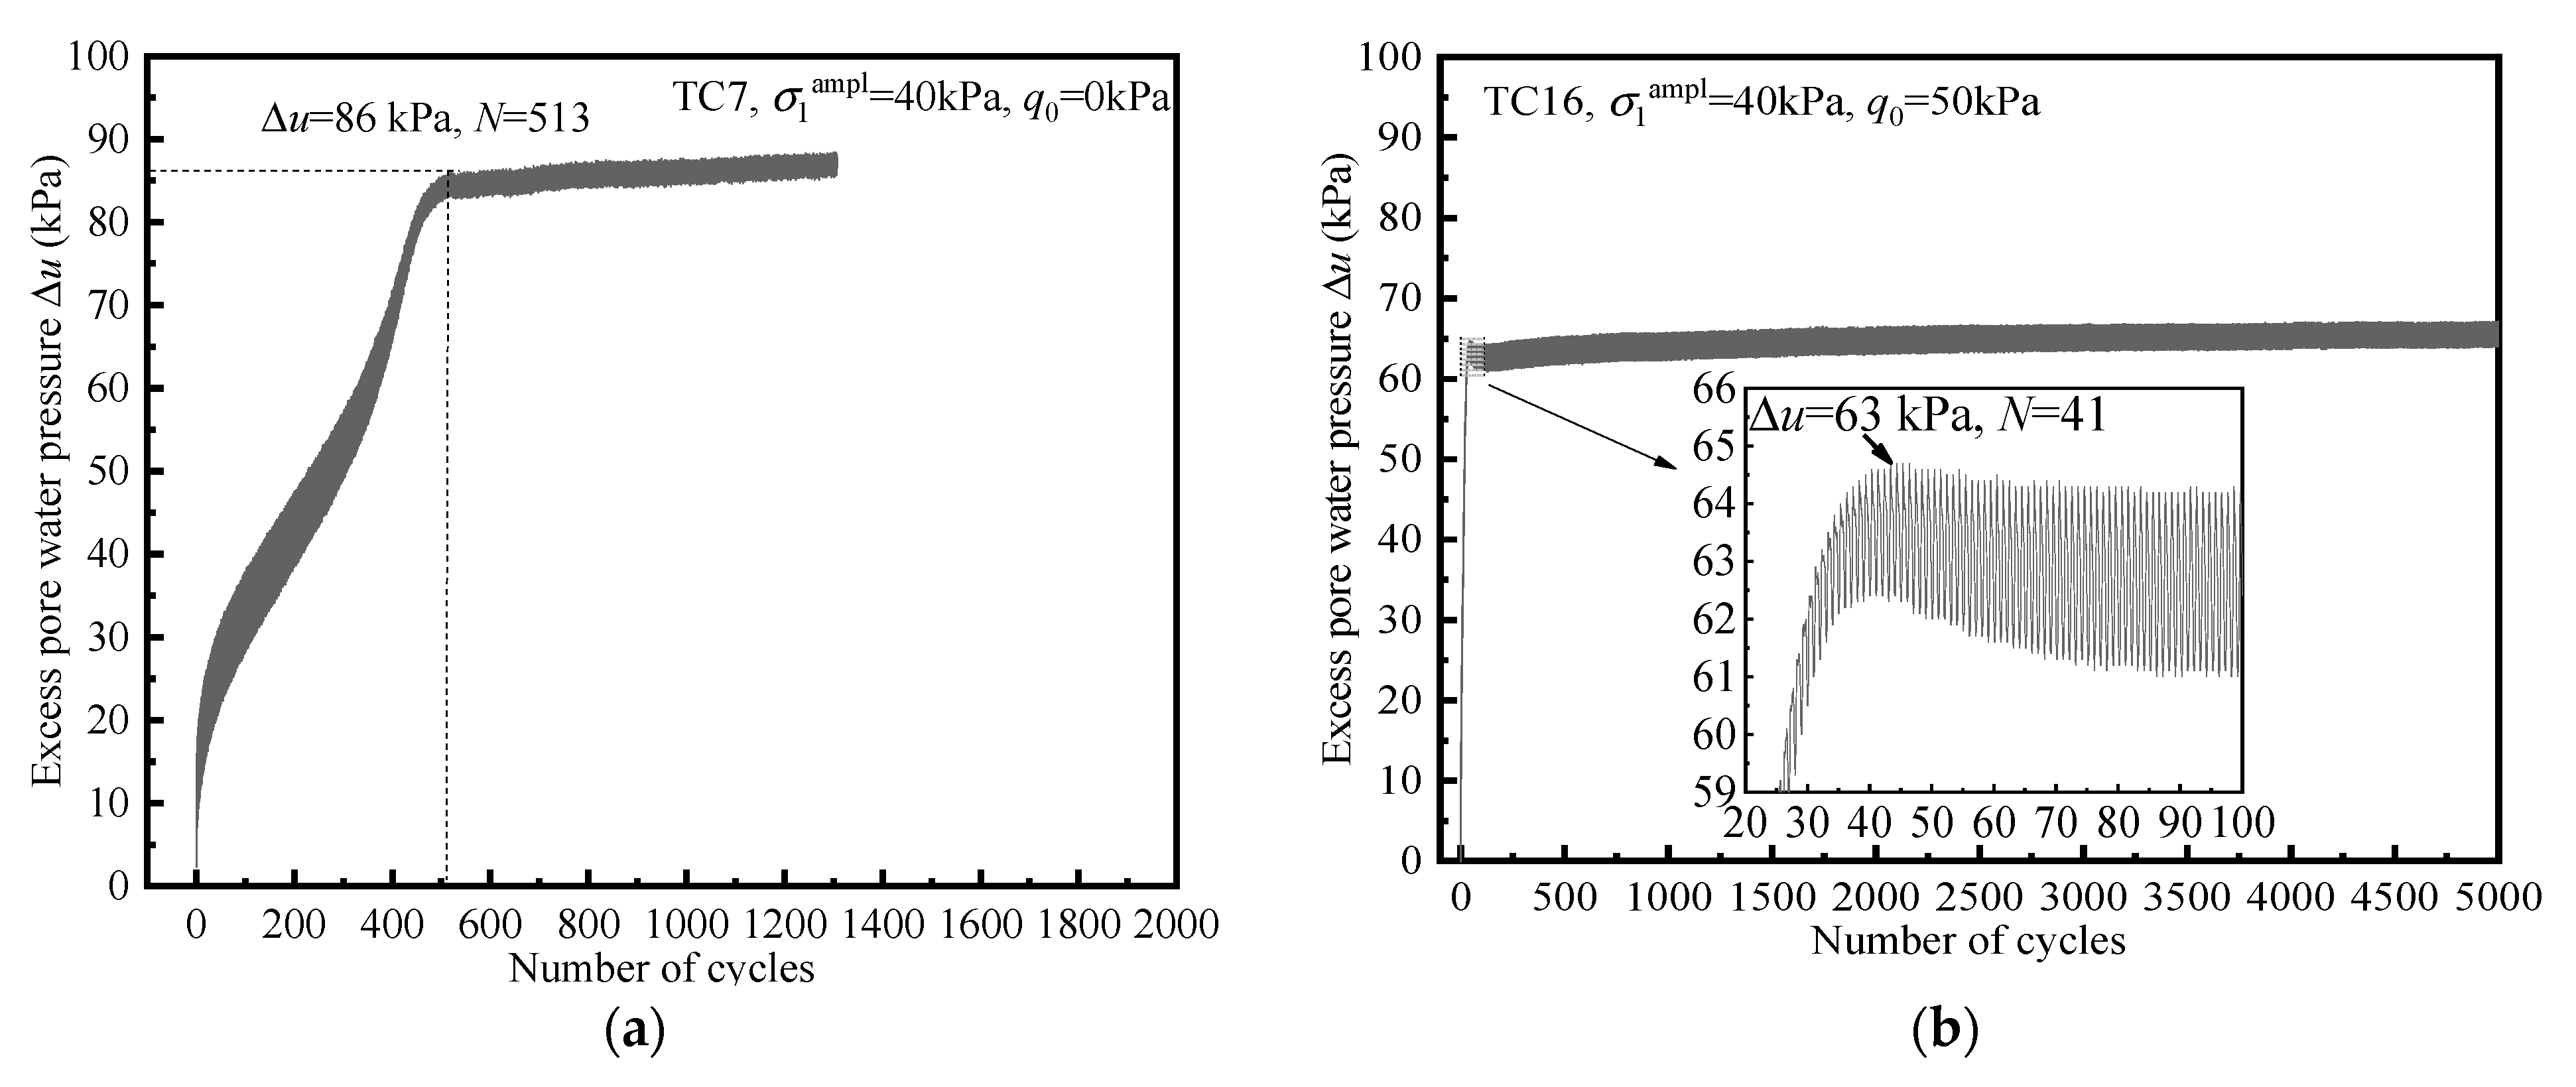
Typical developments of excess pore pressure Δu in undrained tests are presented in Figure 8. Figure 8a shows the development of Δu without initial shear stress, the cyclic response is critical failure, and the strain development is shown in Figure 2a. It can be seen that Δu rapidly accumulates during the beginning cycles, and Δu reaches the limiting value of 86 kPa at 513 cycles. This is the exact opposite of the characteristic of strain development shown in Figure 2a. Figure 8b shows the development of Δu in the existence of initial shear stress. As can be seen that Δu rises vertically at the beginning of loading and reaches 90% of the limit pore pressure in 20 cycles. Notably, Δu reaches the limiting value of 63 kPa at 41 cycles, whereas the strain begins to stabilize after 1000 cycles (Figure 2b).
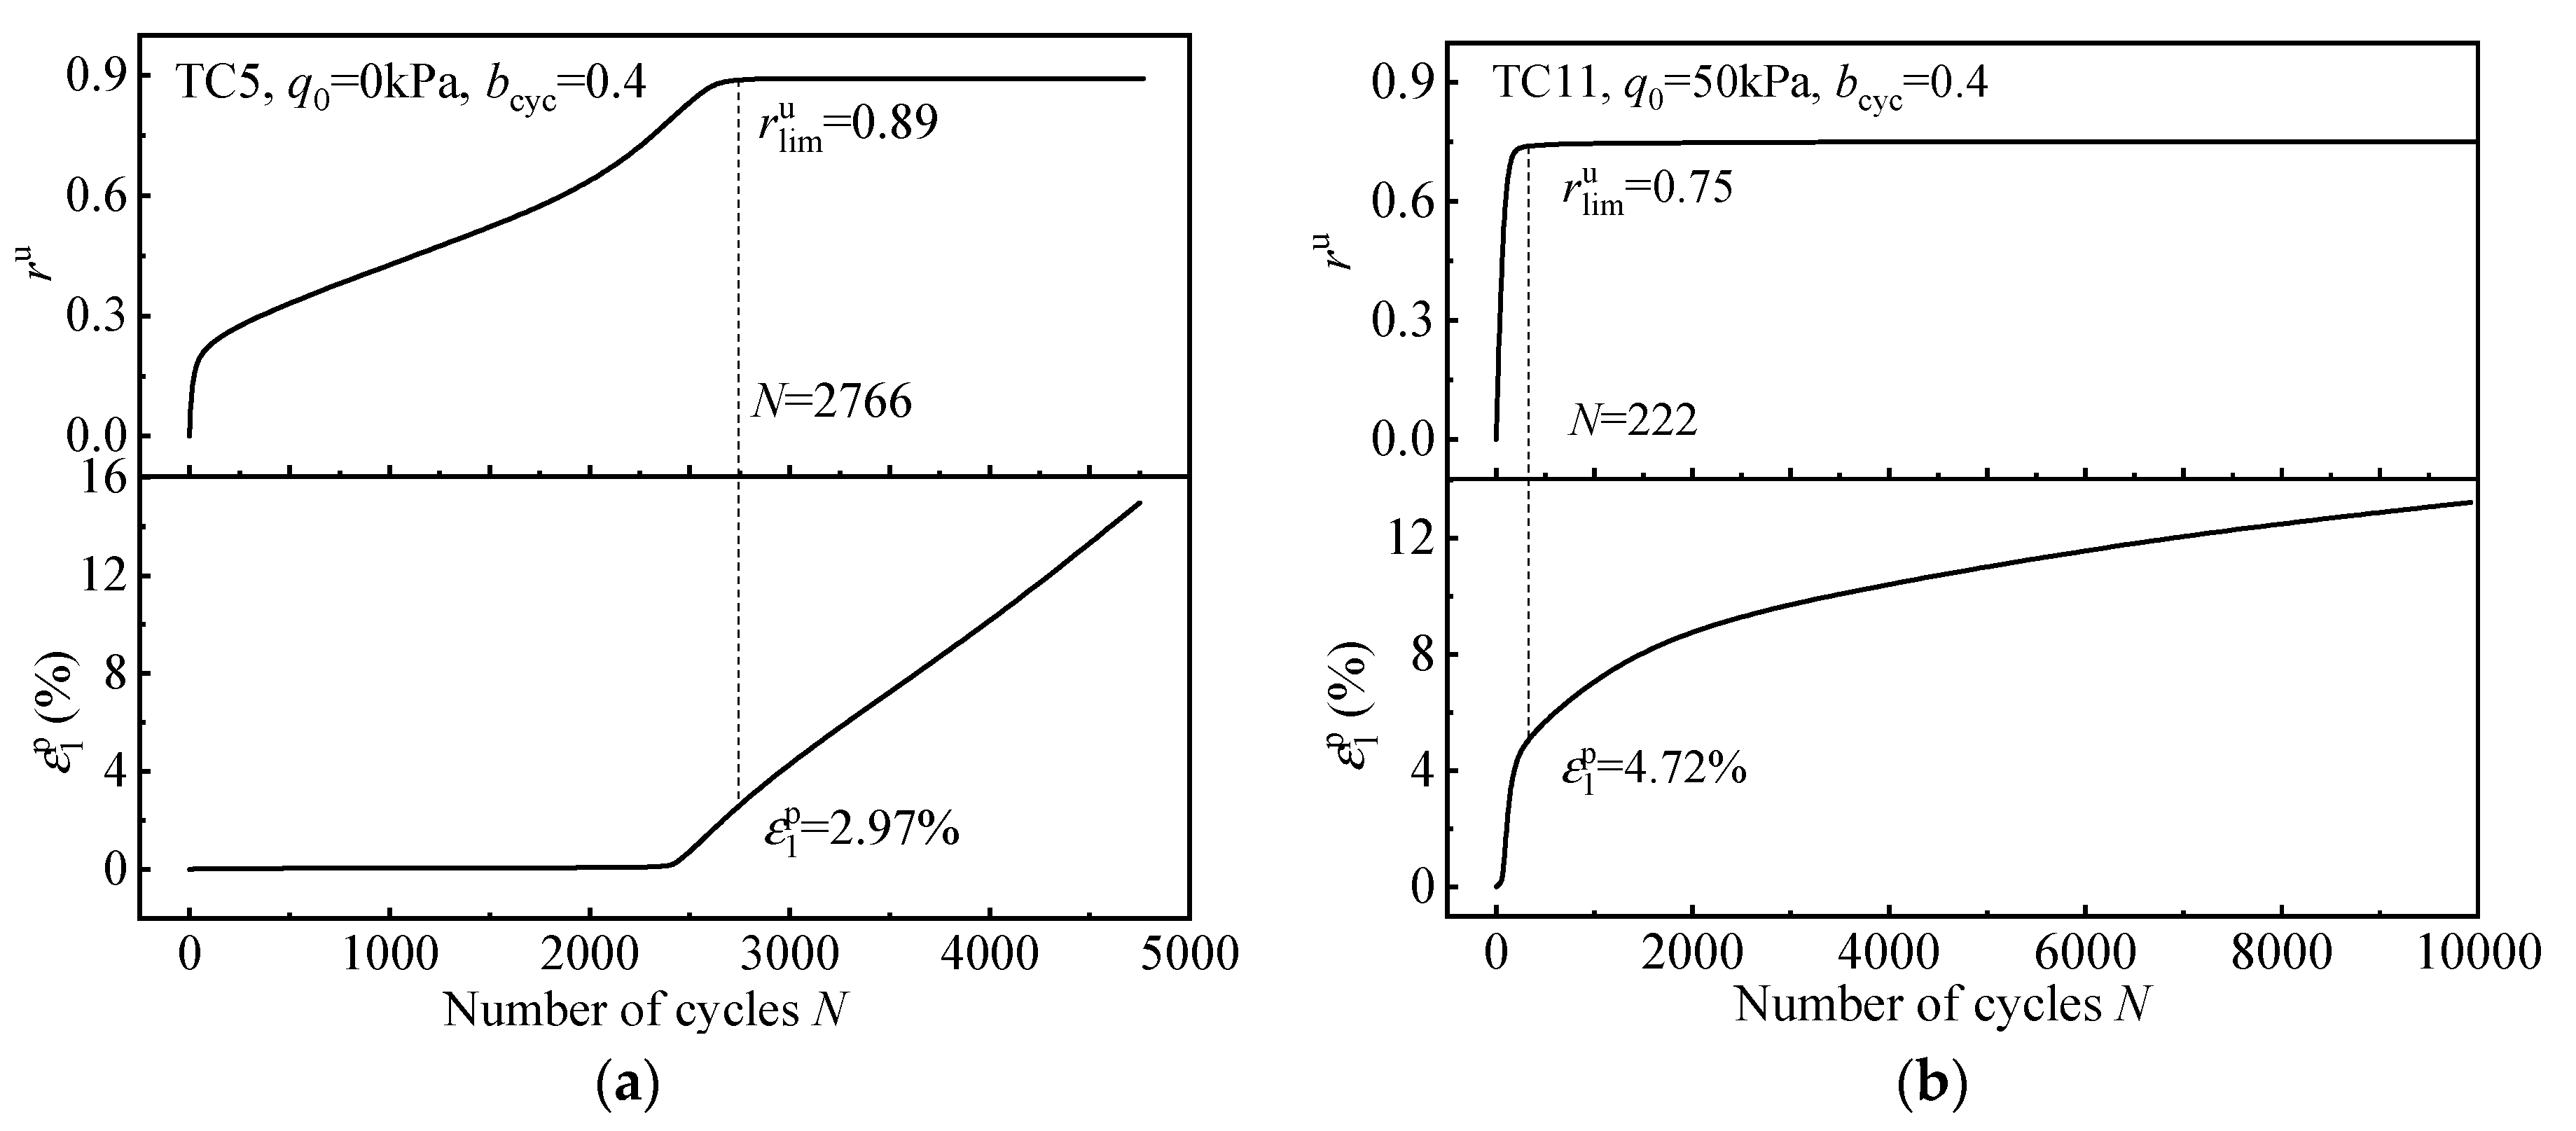
Figure 9 shows the relationship between residual pore pressure and permanent deformation under different stress conditions, where residual pore pressure ratio ru is defined as the ratio of residual pore pressure to initial effective confining pressure. Figure 9a presents the results without initial shear stress with bcyc = 0.4. As the number of cycles increases, ru and ε1p increase gradually. Furthermore, ru reaches the limiting value of rulim = 0.89 at N = 2766, with a permanent strain of approximately 2.67%. With the loading process, ru remains constant, while ε1p continues to increase until reaching 5% at 3099 cycles, that is, the strain-based failure criterion. Figure 9b shows the results with initial shear stress (q0 = 50 kPa), ru and ε1p increase sharply in the incipient cycles, and the rate of increase in ru is significantly faster than that in Figure 9a. The limiting value of rulim = 0.75 is approached at N = 222 with ε1p = 4.72%. In subsequent cycles, ru remains constant, while ε1p continues to increase moderately until the failure criterion is reached at 376 cycles.
Obviously, the constant accumulation of permanent strain is associated with the development of residual pore pressure, and the limit value of residual pore pressure ratio depends on the initial shear stress. Figure 10 shows the relation between the limiting value of rulim and q0 at qampl = 40 kPa. It can be seen that rulim decreases linearly with the increase in q0 and reaches its maximum at q0 = 0 kPa, indicating that the residual pore water pressure of saturated aeolian sand under isotropic consolidation is closest to the initial effective confining pressure, as critical failure dominates. In addition, it can be seen that rulim increases with the increase in bcyc.
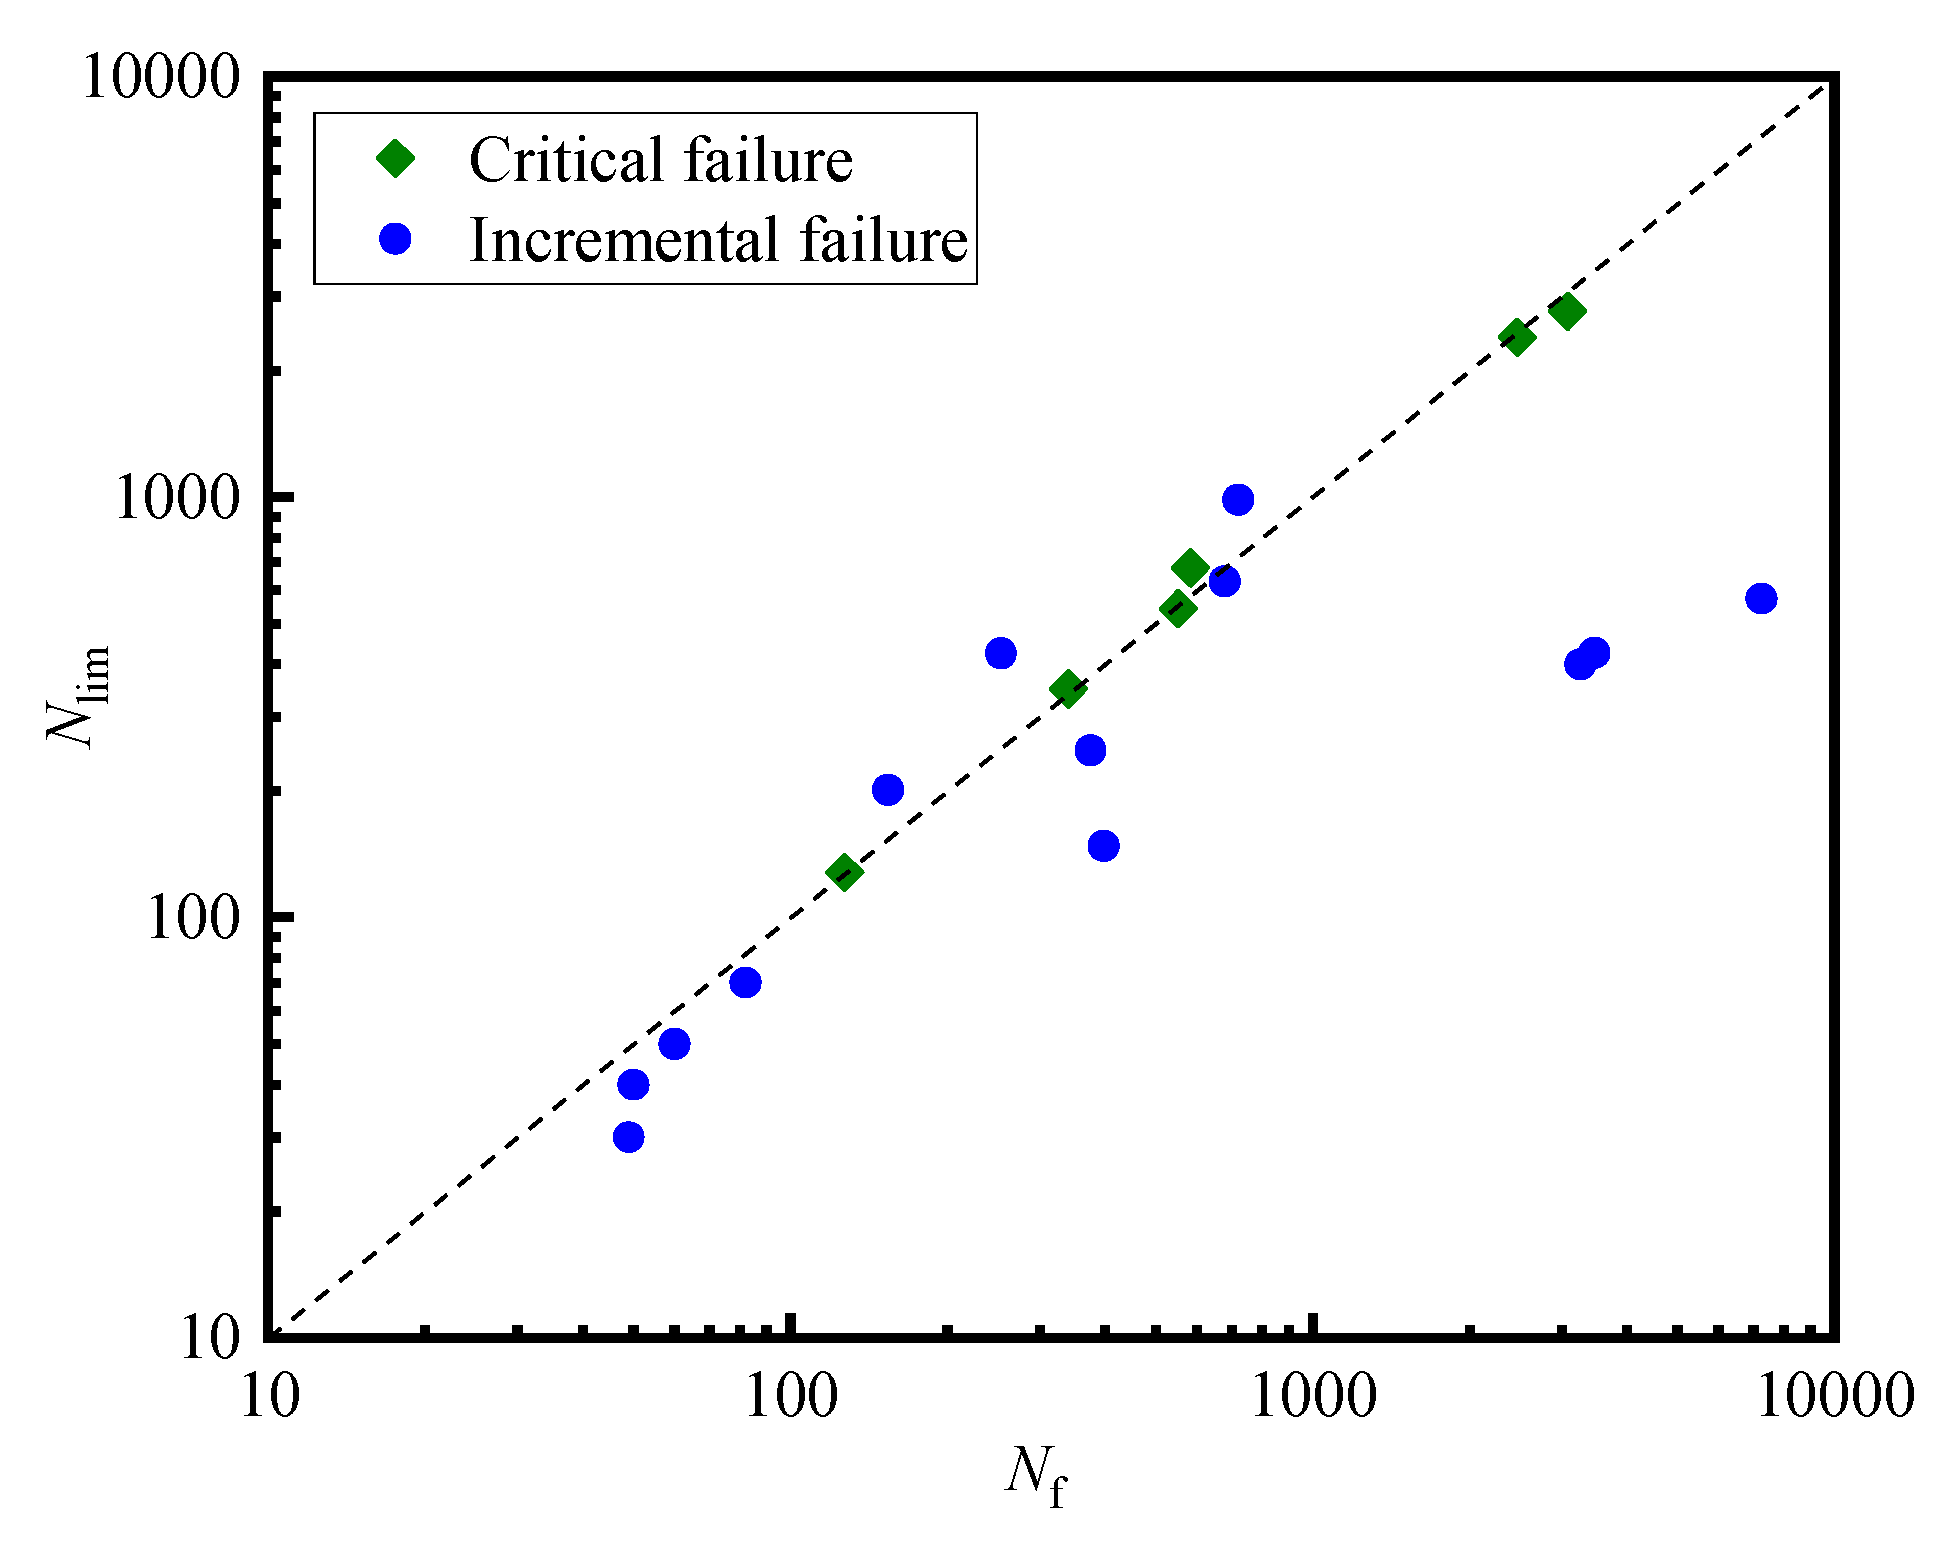
Figure 11 make a comparison between the required cycles for reaching limiting pore pressure (Nlim) and that for permanent axial strain reaching 5% (Nf). When the specimens show critical failure behavior, the test data all fall on the diagonal line of the image, which indicates that Nlim (pore pressure criterion) and Nf (strain criterion) are close. However, in the response to incremental failure, the Nlim is generally smaller than Nf, which is mainly because the axial permanent deformation continues to increase after the pore pressure reaches its limit. The scenario indicates that the pore pressure criterion can be used to estimate the failure of saturated aeolian sand in a safe way.

4. Conclusions

This paper presents a series of cyclic true triaxial tests at various levels of initial shear stress. The combined effect of the two-dimensional cyclic stress and initial shear stress on the cyclic behavior of saturated aeolian sand is investigated. The characteristics of strain development and pore pressure are analyzed, and the experimental results of different initial stress states are compared. The main conclusions can be given as follows:
The cyclic response of saturated aeolian sand in a three-dimensional stress state can be identified in three distinct types: critical failure, incremental failure, and elastic shakedown. The critical failure dominates for specimens under q0 = 0 kPa conditions, while the incremental failure and elastic shakedown are observed with the existence of a non-zero q0.
With the increase in q0, the permanent strain increases first for lower q0 and then decreases, and the maximum permanent strain occurs at q0 = 50 kPa. In addition, the increase in bcyc and qampl lead to the growth of permanent strain.
The rulim decreases linearly with the increase in q0, and increases moderately with the increase in bcyc. Under the critical failure response, the value of rulim is the highest.
The pore pressure criterion is conservative in estimating the failure of saturated aeolian sand compared to the strain failure criterion (5%). The results from these two failure criteria are well-matched when q0 = 0 kPa, but they deviate when initial shear stress is in existence.

Author Contributions

Conceptualization, W.X. and X.L. (Xuefeng Li); methodology, W.X.; software, W.X.; validation, W.X. and X.L. (Xuefeng Li); formal analysis, W.X.; investigation, X.L. (Xilin Lü); resources, X.L. (Xuefeng Li); data curation, W.X.; writing—original draft preparation, W.X.; writing—review and editing, W.X. and X.L. (Xuefeng Li); visualization, X.L. (Xilin Lü); supervision, W.Y.; project administration, X.L. (Xuefeng Li); funding acquisition, X.L. (Xuefeng Li) All authors have read and agreed to the published version of the manuscript.

Funding

This work was financially supported by the Projects for Leading Talents of Science and Technology Innovation of Ningxia (No. KJT2019001), the National Natural Science Foundation of China (No. 12162028), the innovation team for multi-scale mechanics and its engineering applications of Ningxia Hui Autonomous Region (2021), and the Key R&D Project of Ningxia Hui Autonomous Region (No. 2021BEG03118), and these supports are gratefully acknowledged.

Institutional Review Board Statement

Not applicable.

Informed Consent Statement

Not applicable.

Data Availability Statement

Not applicable.

Conflicts of Interest

The authors declare no conflict of interest.

References

  1. Idriss, I.M.; Boulanger, R.W. Soil Liquefaction during Earthquakes; Earthquake Engineering Research Institute (EERI): Oakland, CA, USA, 2008. [Google Scholar]
  2. Dong, T.; Zheng, Y.; Liang, K.; Liu, C. Shear strength and shear bands of anisotropic sand. Acta Geotech. 2022, 17, 2841–2853. [Google Scholar] [CrossRef]
  3. Xiu, Z.; Wang, S.; Ji, Y.; Wang, F.; Ren, F. Experimental investigation on liquefaction and post-liquefaction deformation of stratified saturated sand under cyclic loading. Bull. Eng. Geol. Environ. 2020, 79, 2313–2324. [Google Scholar] [CrossRef]
  4. Pan, K.; Xu, T.; Liao, D.; Yang, Z. Failure mechanisms of sand under asymmetrical cyclic loading conditions: Experimental observation and constitutive modelling. Géotechnique 2022, 72, 162–175. [Google Scholar] [CrossRef]
  5. Xu, Z.; Pan, L.; Gu, C.; Cai, Y. Deformation behavior of anisotropically overconsolidated clay under one-way cyclic loading. Soil Dyn. Earthq. Eng. 2020, 129, 105943. [Google Scholar] [CrossRef]
  6. Yang, J.; Yang, A.; Shan, Y.; Yang, M.; Zhao, J.; Yu, H. Experimental Study on Mechanical Behavior of Lean Cemented Sand and Gravel Material in Unloading and Reloading Paths. Adv. Mater. Sci. Eng. 2021, 2021, 8893840. [Google Scholar] [CrossRef]
  7. Ye, B.; Ni, X.; Ye, G.; Huang, Y.; Lu, P. Prediction of the initial point of the last cycle in undrained cyclic triaxial tests on flow liquefaction. Soil Dyn. Earthq. Eng. 2019, 120, 12–22. [Google Scholar] [CrossRef]
  8. Ding, Z.; He, S.; Sun, Y.; Xia, T.; Zhang, Q. Comparative study on cyclic behavior of marine calcareous sand and terrigenous siliceous sand for transportation infrastructure applications. Constr. Build. Mater. 2021, 283, 122740. [Google Scholar] [CrossRef]
  9. Zhang, Y.; Gu, C.; Wang, J.; Cai, Y. Three-dimensional cyclic behavior of saturated clays: Comparison between undrained and partly drained conditions. Can. Geotech. J. 2021, 58, 1716–1729. [Google Scholar] [CrossRef]
  10. Wang, Y.; Yu, Y.; Wu, Y.; Zhang, B.; Lv, H.; Sun, X. Development and application of a large-scale static and dynamic true triaxial apparatus for gravel. Int. J. Geomech. 2018, 18, 04018004. [Google Scholar] [CrossRef]
  11. Yoshimine, M.; Ishihara, K.; Vargas, W. Effects of principal stress direction and intermediate principal stress on undrained shear behavior of sand. Soils Found. 1998, 38, 179–188. [Google Scholar] [CrossRef]
  12. Sivathayalan, S.; Vaid, Y.P. Influence of generalized initial state and principal stress rotation on the undrained response of sands. Can. Geotech. J. 2002, 39, 63–76. [Google Scholar] [CrossRef]
  13. Shibuya, S.; Hight, D.W.; Jardine, R.J. Local boundary surfaces of a loose sand dependent on consolidation path. Soils Found. 2003, 43, 85–93. [Google Scholar] [CrossRef] [PubMed] [Green Version]
  14. Lee, K.L.; Seed, H.B. Dynamic strength of anisotropically consolidated sand. J. Soil. Mech. Found. Div. 1967, 93, 169–190. [Google Scholar] [CrossRef]
  15. Ma, Y. Effect of initial consolidation shear stress on dynamic strength of saturated sand. Water Conser. Water Transp. Res. 1988, 1988, 63–68. [Google Scholar]
  16. Vaid, Y.P.; Chern, J.C. Cyclic and monotonic undrained response of saturated sands. In Advances in the Art of Testing Soils under Cyclic Conditions; ASCE: Reston, VA, USA, 1985; pp. 120–147. [Google Scholar]
  17. Vaid, Y.P.; Stedman, J.D.; Sivathayalan, S. Confining stress and static shear effects in cyclic liquefaction. Can. Geotech. J. 2001, 38, 580–591. [Google Scholar] [CrossRef]
  18. Harder, L.F.; Boulanger, R.W. Application of Kσ and Kα correction factors. In Proceedings of the NCEER Workshop on Evaluation of Liquefaction Resistance of Soils; National Center for Earthquake Engineering Research, State University of New York: Buffalo, NY, USA, 1997; pp. 167–190. [Google Scholar]
  19. Been, K.; Jefferies, M.G. A state parameter for sands. Géotechnique 1985, 35, 99–112. [Google Scholar] [CrossRef]
  20. Yang, J.; Sze, H.Y. Cyclic behaviour and resistance of saturated sand under nonsymmetrical loading conditions. Géotechnique 2011, 61, 59–73. [Google Scholar] [CrossRef] [Green Version]
  21. Yang, J.; Sze, H.Y. Cyclic strength of sand under sustained shear stress. J. Geotech. Geoenviron. Eng. 2011, 137, 1275–1285. [Google Scholar] [CrossRef] [Green Version]
  22. Shi, W.; Zhu, J.; Chiu, C.; Liu, H. Strength and deformation behaviour of coarse-grained soil by true triaxial tests. J. Cent. South Univ. 2010, 17, 1095–1102. [Google Scholar] [CrossRef]
  23. Xiao, Y.; Liu, H.; Chen, Y.; Zhang, W. Particle size effects in granular soils under true triaxial conditions. Géotechnique 2014, 64, 667–672. [Google Scholar] [CrossRef]
  24. Huang, W.; Sun, D.; Sloan, S.W. Analysis of the failure mode and softening behaviour of sands in true triaxial tests. Int. J. Solids. Struct. 2007, 44, 1423–1437. [Google Scholar] [CrossRef]
  25. Li, X.; Ma, Z.; Lu, W.; Wang, Y. True-triaxial drained test of tengger desert sand. Adv. Civil. Eng. 2020, 2020, 8851165. [Google Scholar] [CrossRef]
  26. Li, X.; Lu, W.; Ma, Z.; Tuo, N. The undrained characteristics of tengger desert sand from true triaxial testing. Adv. Civil. Eng. 2021, 2021, 6320397. [Google Scholar] [CrossRef]
  27. Chazallon, C.; Hornych, P.; Mouhoubi, S. Elastoplastic model for the long-term behavior modeling of unbound granular materials in flexible pavements. Int. J. Geomech. 2006, 6, 279–289. [Google Scholar] [CrossRef]
  28. Melan, E. Theorie statisch unbestimmter Systemeaus aus idealplastischen Baustoffen. Sitzungsber. Akad. Wiss. Wien Math.-Naturwiss. Kl. Abt. IIA 1936, 145, 195–218. [Google Scholar]
  29. Rahman, M.S.; Erlingsson, S. Moisture influence on the resilient deformation behaviour of unbound granular materials. Int. J. Pave. Eng. 2016, 17, 763–775. [Google Scholar] [CrossRef]
  30. Guo, L.; Cai, Y.Q.; Jardine, R.J.; Yang, Z.; Wang, J. Undrained behavior of intact soft clay under cyclic paths that match vehicle loading conditions. Can. Geotech. J. 2018, 55, 90–106. [Google Scholar] [CrossRef] [Green Version]
  31. Xia, P.; Deng, W.; Shao, L.; Zhang, X. Role of Elastic Upper Limit in Shakedown Study for Granular soils. Transp. Geotech. 2022, 34, 100746. [Google Scholar] [CrossRef]
  32. Mamou, A.; Powrie, W.; Priest, J.A.; Clayton, C. The effects of drainage on the behaviour of railway track foundation materials during cyclic loading. Géotechnique 2017, 67, 845–854. [Google Scholar] [CrossRef] [Green Version]
  33. Mamou, A.; Priest, J.A.; Clayton, C.R.I.; Powrie, W. Behaviour of saturated railway track foundation materials during undrained cyclic loading. Can. Geotech. J. 2018, 55, 689–697. [Google Scholar] [CrossRef] [Green Version]
  34. Mamou, A.; Clayton, C.; Powrie, W.; Priest, J. The role of clay content on the response of railway track foundations during free-to-drain cyclic changes in principal stress rotation. Transp. Geotech. 2019, 20, 100246. [Google Scholar] [CrossRef]
  35. Werkmeister, S.; Dawson, A.R.; Wellner, F. Permanent deformation behavior of granular materials and the shakedown concept. Transp. Res. Rec. 2001, 1757, 75–81. [Google Scholar] [CrossRef]
  36. Werkmeister, S.; Dawson, A.R.; Wellner, F. Pavement design model for unbound granular materials. J. Transp. Eng. 2004, 130, 665–674. [Google Scholar] [CrossRef]
  37. Werkmeister, S. Permanent Deformation Behaviour of Unbound Granular Materials in Pavement Constructions. Ph.D. Thesis, Department of Civil Engineering, Dresden University of Technology, Dresden, Germany, 2004. [Google Scholar]
  38. Flora, A.; Lirer, S.; Silvestri, F. Undrained cyclic resistance of undisturbed gravelly soils. Soil Dyn. Earthq. Eng. 2012, 43, 366–379. [Google Scholar] [CrossRef]
  39. Sivathayalan, S.; Ha, D. Effect of static shear stress on the cyclic resistance of sands in simple shear loading. Can. Geotech. J. 2011, 48, 1471–1484. [Google Scholar] [CrossRef]
  40. Hyodo, M.; Tanimizu, H.; Yasufuku, N.; Murata, H. Undrained cyclic and monotonic triaxial behavior of saturated loose sand. Soils Found. 1994, 34, 19–32. [Google Scholar] [CrossRef] [Green Version]
  41. Seed, H.B.; Martin, P.P.; Lysmer, J. The Generation and Dissipation of Pore Water Pressures during Soil Liquefaction; College of Engineering, University of California: Berkeley, CA, USA, 1975. [Google Scholar]
  42. Polito, C.P.; Green, R.A.; Lee, J. Pore pressure generation models for sands and silty soils subjected to cyclic loading. J. Geotech. Geoenviron. Eng. 2008, 134, 1490–1500. [Google Scholar] [CrossRef]
  43. Chiaradonna, A.; Flora, A.; d’Onofrio, A.; Bilotta, E. A pore water pressure model calibration based on in-situ test results. Soils Found. 2020, 60, 327–341. [Google Scholar] [CrossRef]
  44. Pan, K.; Yang, Z.X. Effects of initial static shear on cyclic resistance and pore pressure generation of saturated sand. Acta Geotech. 2018, 13, 473–487. [Google Scholar]
  45. Pan, K.; Cai, Y.; Yang, Z.; Pan, X. Liquefaction of sand under monotonic and cyclic shear conditions: Impact of drained preloading history. Soil Dyn. Earthq. Eng. 2019, 126, 105775. [Google Scholar] [CrossRef]
  46. Pan, K.; Zhou, G.; Yang, Z.; Cai, Y. Comparison of cyclic liquefaction behavior of clean and silty sands considering static shear effect. Soil Dyn. Earthq. Eng. 2020, 139, 106338. [Google Scholar] [CrossRef]
  47. Li, X.; Xu, W.; Chen, Q.; Yang, W. Cyclic behavior of saturated aeolian sand under true triaxial conditions. Geofluids 2022, 2022, 1–17. [Google Scholar]
  48. Li, X.; Xu, W.; Chang, L.; Yang, W. Shear behaviour of aeolian sand with different density and confining pressure. Appl. Sci. 2022, 12, 3020. [Google Scholar] [CrossRef]
  49. Powrie, W.; Yang, L.A.; Clayton, C.R.I. Stress changes in the ground below ballasted railway track during train passage. Proc. Inst. Mech. Eng. F J. Rail Rapid Transit. 2007, 221, 247–262. [Google Scholar] [CrossRef]
  50. Hyodo, M.; Murata, H.; Yasufuku, N.; Fujii, T. Undrained cyclic shear strength and residual strain of saturated sand by cyclic triaxial tests. Soils Found. 1991, 31, 60–76. [Google Scholar] [CrossRef]
  51. Ishihara, K. Soil Behavior in Earthquake Geotechnics; Clarendon Press: Oxford, UK, 1996. [Google Scholar]
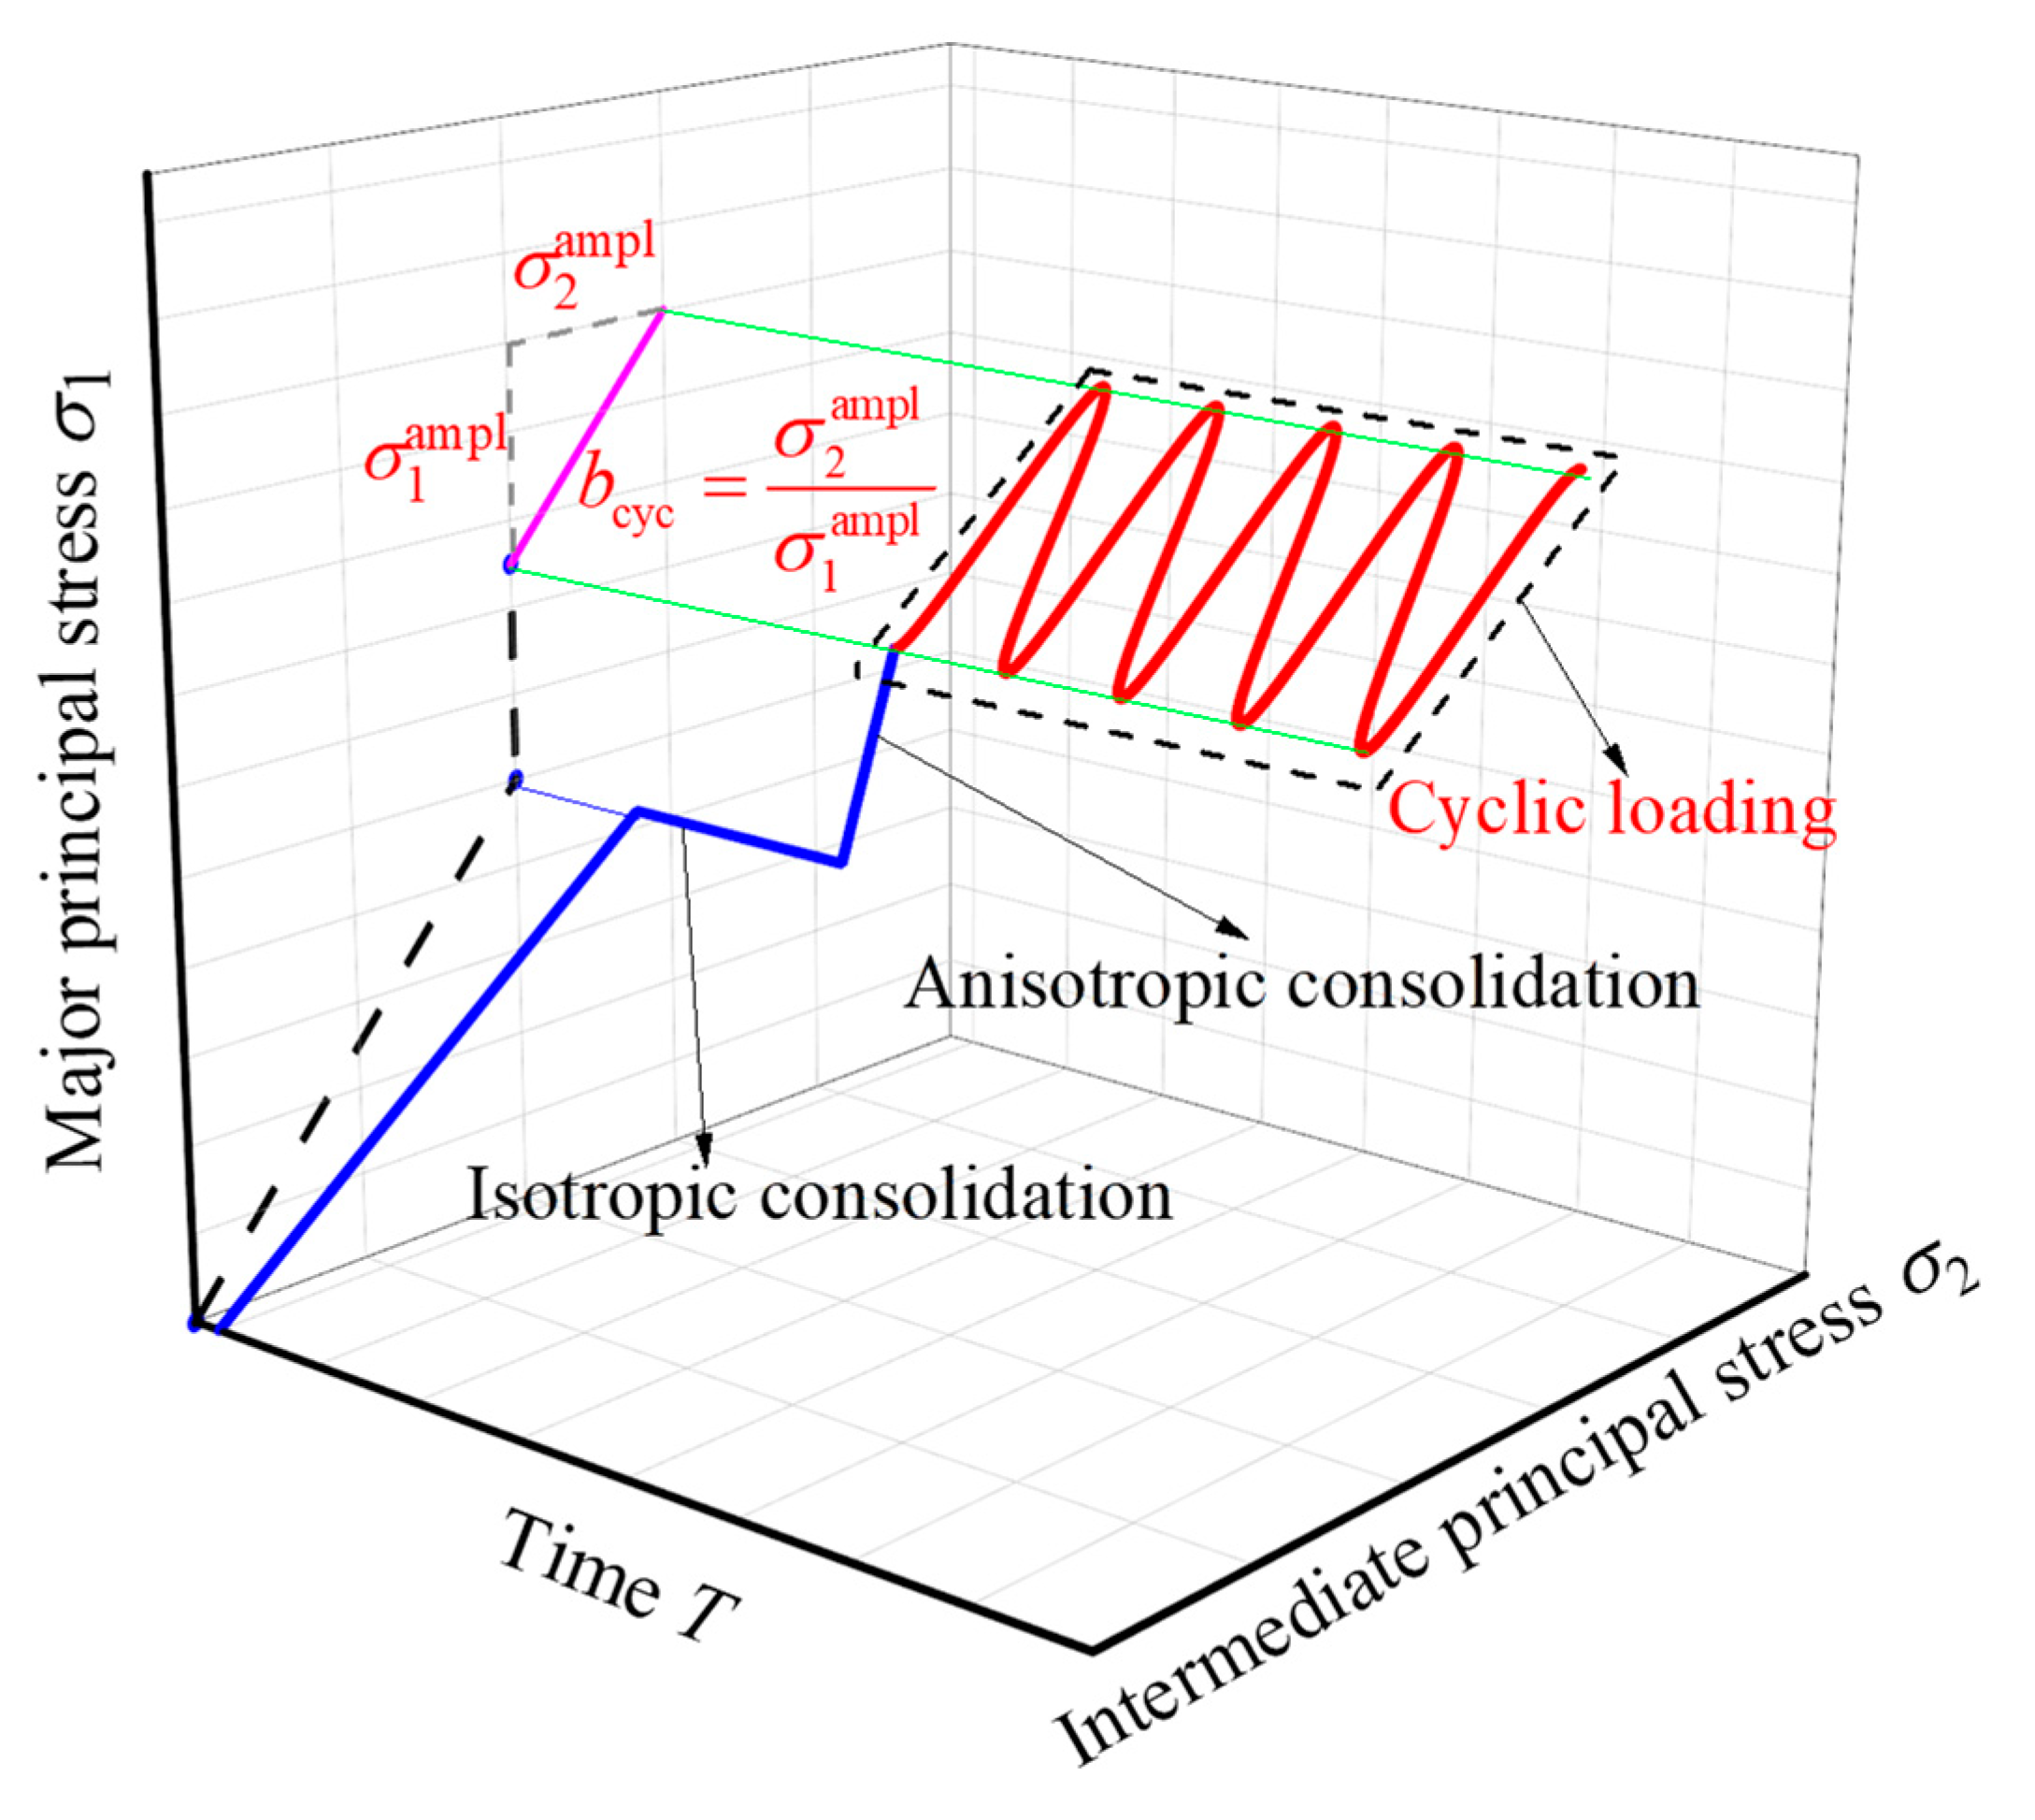
Figure 1. Stress path in cyclic true triaxial test.
Sustainability 14 16730 g001
Figure 2. Typical time–history curves under one-dimensional cyclic loading: (a) zero initial shear stress (q0 = 0 kPa); (b) small initial shear stress (q0 = 50 kPa); (c) large initial shear stress (q0 = 100 kPa).
Sustainability 14 16730 g002
Figure 3. Typical time–history curves of axial and horizontal strain under one-dimensional cyclic loading: (a) qampl = 20 kPa; (b) qampl = 30 kPa; (c) qampl = 40 kPa.
Sustainability 14 16730 g003
Figure 4. Typical time–history curves of axial and horizontal strain under two-dimensional cyclic loading: (a) q0 = 0 kPa; (b) q0 = 50 kPa; (c) q0 = 100 kPa; (d) q0 = 150 kPa.
Sustainability 14 16730 g004
Figure 5. The relationship between ε1p and q0 under a certain cycle. (a) bcyc = 0.4; (b) bcyc = 0.8.
Sustainability 14 16730 g005
Figure 6. The ε1p-ε2p curves under different q0.
Sustainability 14 16730 g006
Figure 7. Summary of cyclic response modes under different stress conditions.
Sustainability 14 16730 g007
Figure 8. Typical developments of excess pore pressure. (a) Non-zero initial shear stress (q0 = 0 kPa); (b) initial shear stress (q0 = 50 kPa).
Sustainability 14 16730 g008
Figure 9. ru and ε1p during cyclic loading. (a) No initial shear stress (q0 = 0 kPa, bcyc = 0.4); (b) initial shear stress (q0 = 50 kPa, bcyc = 0.4).
Sustainability 14 16730 g009
Figure 10. Relationship between limiting pore pressure ratio and initial shear stress.
Sustainability 14 16730 g010
Figure 11. The number of cycles to reach pore pressure (Nlim) and axial permanent strain of 5% (Nf).
Sustainability 14 16730 g011
Table 1. Primary properties of aeolian sand.
Coefficient of Uniformity
Cu
Coefficient of Curvature
Cc
Specific Gravity
Gs
Mean Particle Diameter
d50
Void Ratio
maxmin
2.11.02.670.17 mm0.9070.589
Table 2. Scheme of cyclic tests.
Number of Tests σ 1 ampl
(kPa)
σ 2 ampl
(kPa)
qampl
(kPa)
bcycq0
(kPa)
TC12002000
TC222.99.2200.40
TC321.817.44200.80
TC43003000
TC534.413.8300.40
TC632.726.2300.80
TC74004000
TC845.618.4400.40
TC943.734.9400.80
TC1020020050
TC1122.99.2200.450
TC1221.817.44200.850
TC1330030050
TC1434.413.8300.450
TC1532.726.2300.850
TC1640040050
TC1745.618.4400.450
TC1843.734.9400.850
TC19200200100
TC2022.99.2200.4100
TC2121.817.44200.8100
TC22300300100
TC2334.413.8300.4100
TC2432.726.2300.8100
TC25400400100
TC2645.618.4400.4100
TC2743.734.9400.8100
TC28200200150
TC2922.99.2200.4150
TC3021.817.44200.8150
TC31300300150
TC3234.413.8300.4150
TC3332.726.2300.8150
TC34400400150
TC3545.618.4400.4150
TC3643.734.9400.8150
Publisher’s Note: MDPI stays neutral with regard to jurisdictional claims in published maps and institutional affiliations.