Article

Sensitivity Analysis of Factors Affecting the Stability of Deep Buried Tunnel

1
School of Civil Engnineering, Suzhou University of Science and Technology, Suzhou 215000, China
2
State Key Laboratory of Geomechanics and Geotechnical Engineering, Institute of Rock and Soil Mechanics, Chinese Academy of Sciences, Wuhan 430071, China
*
Author to whom correspondence should be addressed.
Sustainability 2023, 15(1), 381; https://doi.org/10.3390/su15010381
Submission received: 14 November 2022 / Revised: 20 December 2022 / Accepted: 23 December 2022 / Published: 26 December 2022
(This article belongs to the Special Issue Soil Dynamics and Earthquake Engineering in Sustainability)

Abstract

:
The excavation of deep tunnels has significant spatial and temporal effects on the stress distribution of the surrounding rock. Accurately describing the distribution characteristics of the surrounding rock stress state is a key issue in analyzing the failure mechanism of the surrounding rock. Based on the numerical analysis, a study on the influencing factors of the surrounding rock stress state during the excavation of deep tunnels was conducted. The results show that (i) the surrounding rock was divided into stress mutation, disturbed, and stables zones using the quantitative index: the peak and stable value of the stress triaxiality, which can reflect the influence of the principal stress orientation; (ii) the evolution law of the stress path of the surrounding rocks in different areas was obtained, and the detailed loading method of laboratory test is proposed, which could consider the influence of the principal stress magnitude and orientation during tunnel excavation; and (iii) five variable indices were used to conduct sensitivity analysis on the influencing factors of the surrounding rock stress state. Specifically, the direction of in situ stress and lateral pressure coefficient considerably influences the disturbance range, and the depth the tunnel is buried affects the deformation and failure characteristics of the surrounding rock. This paper provides a modified and quantified test method for tunnel stability analysis.

1. Introduction

With the enhancement of the economy and society, the scale of development and utilization of underground space is increasing, followed by a large number of deep tunneling projects involving transportation, energy extraction and water conservancy hydropower. The increasingly complex geological environment causes frequent disasters, which presents a considerable threat to engineering construction. Surrounding rock has an apparent stress path correlation under the complex stress condition. Therefore, analyzing the stress state and stress redistribution process of the surrounding rock and evaluating the stability of the surrounding rock is essential [1,2,3,4,5,6]. It is believed that excavation disturbances under high stress conditions cause deformation and damage to the surrounding rock in rock engineering. To obtain the fracture evolution characteristics of the surrounding rock under disturbance, many scholars have conducted a lot of research. In situ monitoring is the most direct way to obtain the stress of the surrounding rock. K.F.B. et al. emphasized results concerning development and evolution of the excavation-damaged zone in the rock around the tunnel obtained by complex measuring equipment [7]. Malmgren et al. assessed the excavation disturbed zone with acoustic emission and micro-seismic events [8]. Ding et al. obtained the behavior of the surrounding rocks under the original support measures from safety monitoring and field testing [9]. Liang et al. obtained the microcrack evolution process inside the surrounding rock based on the micro-seismic monitoring technology and found that the change law of b values of micro-seismic events could be used to predict the activity state inside the surrounding rock effectively [10]. Li et al. proposed a novel re-oriented core acoustic emission method for in situ stress measurement without excessive complex operations [11].
Although there is a certain understanding of tunnel excavation through in situ monitoring, the complexity and uncertainty of the construction site environment often make it difficult to carry out on-site studies, and similar laboratory model tests become an effective means to simulate tunnel excavation [12,13,14,15,16]. Chen et al. used the self-developed large-scale three-dimensional (3D) underground comprehensive model test system to simulate the excavation and support process of underground engineering, and found that the stress and deformation of the surrounding rock have nonlinear characteristics after excavation [17]. Zhu et al. obtained the failure mechanism of deep hard rock spalling in horseshoe-shaped tunnels by conducting a physical model experiment and found that the high in situ stress is an important factor for severe spalling failure of rock mass [18]. Zhang et al. developed a true three-dimensional geo-mechanical model test loading system, and found that the excavation-induced perturbation reaches approximately 1.5–2.0 times the cave diameter [19]. Zhu et al. conducted a model test focusing on the creep deformation and failure characteristics of the surrounding rock and analyzed the evolution law of the contact force between the lining and arch [20]. Many scholars rely on the true triaxial test system to simulate the failure process of surrounding rock in deep tunnels, revealing the failure characteristics of tunnel plate cracks [21,22,23]. Considering that it is difficult to realize the stress loading and reproduction tunnel excavation process of surrounding raw rocks in physical model experiments, numerical analysis methods have been widely used in recent years. At the beginning of the 21st century, Eberhardt used finite element software to study the stress change law of the surrounding rock on the tunnel face during tunnel excavation [24]. Cai and Kaiser used a micromechanical model to analyze the excavation damage zone [25]. Chen et al. simulated the excavation-induced disturbance effects in the surrounding rocks of the Jinping-I underground powerhouse caverns with an elastoplastic model [26]. Meng et al. studied the evolution law of roadway surrounding rock displacements, plastic zone, and stress distribution under different conditions using numerical simulation [27]. Chen et al. simulated the spalling failure of rock surrounding a deep buried tunnel based on the discrete element method (DEM) and Particle Flow Code (PFC3D, version 5.0) and found that the in situ intermediate principal stress influenced the depth and range of spalling failure [28]. The study of the stress path and failure mode of the surrounding rock during tunnel excavation has also attracted the attention of various researchers. Jiang et al. studied the change of stress direction in the stress redistribution of surrounding rocks [29].
In general, all the current research works have obtained fruitful results and provided abundant data for the construction of deep engineering. However, it should also be noted that the stress field of the surrounding rock in the excavation of underground caves adjusts dynamically, which has significant complexity and is spatiotemporal. First, the change of the stress field of the rock mass is not limited to the change of stress magnitude, and the stress orientation also affects the mechanical properties of the rock mass. Second, the change of the surrounding rock stress field is also affected by various factors, including the initial in situ stress direction, rock mass type, the depth the tunnel is buried, and lateral pressure coefficient. With an increasingly complex geological environment, obtaining the real stress state of the surrounding rock and a precise law of stress path evolution are key problems to be solved in deep tunnel engineering. This study focuses on the influence of the principal stress orientation on the disturbance of surrounding rock, and the zoning index, which can consider the change of principal stress magnitude and orientation simultaneously, is proposed. Moreover, the stress path evolution law of surrounding rock in different regions is put forward. On this basis, the influence mechanism of various influencing factors on the mechanical properties of surrounding rock is obtained through a sensitivity analysis. The study is expected to contribute to obtaining the influence of principal stress orientation on the mechanical properties of surrounding rock, which is helpful to evaluate the stability of deep buried tunnel accurately.

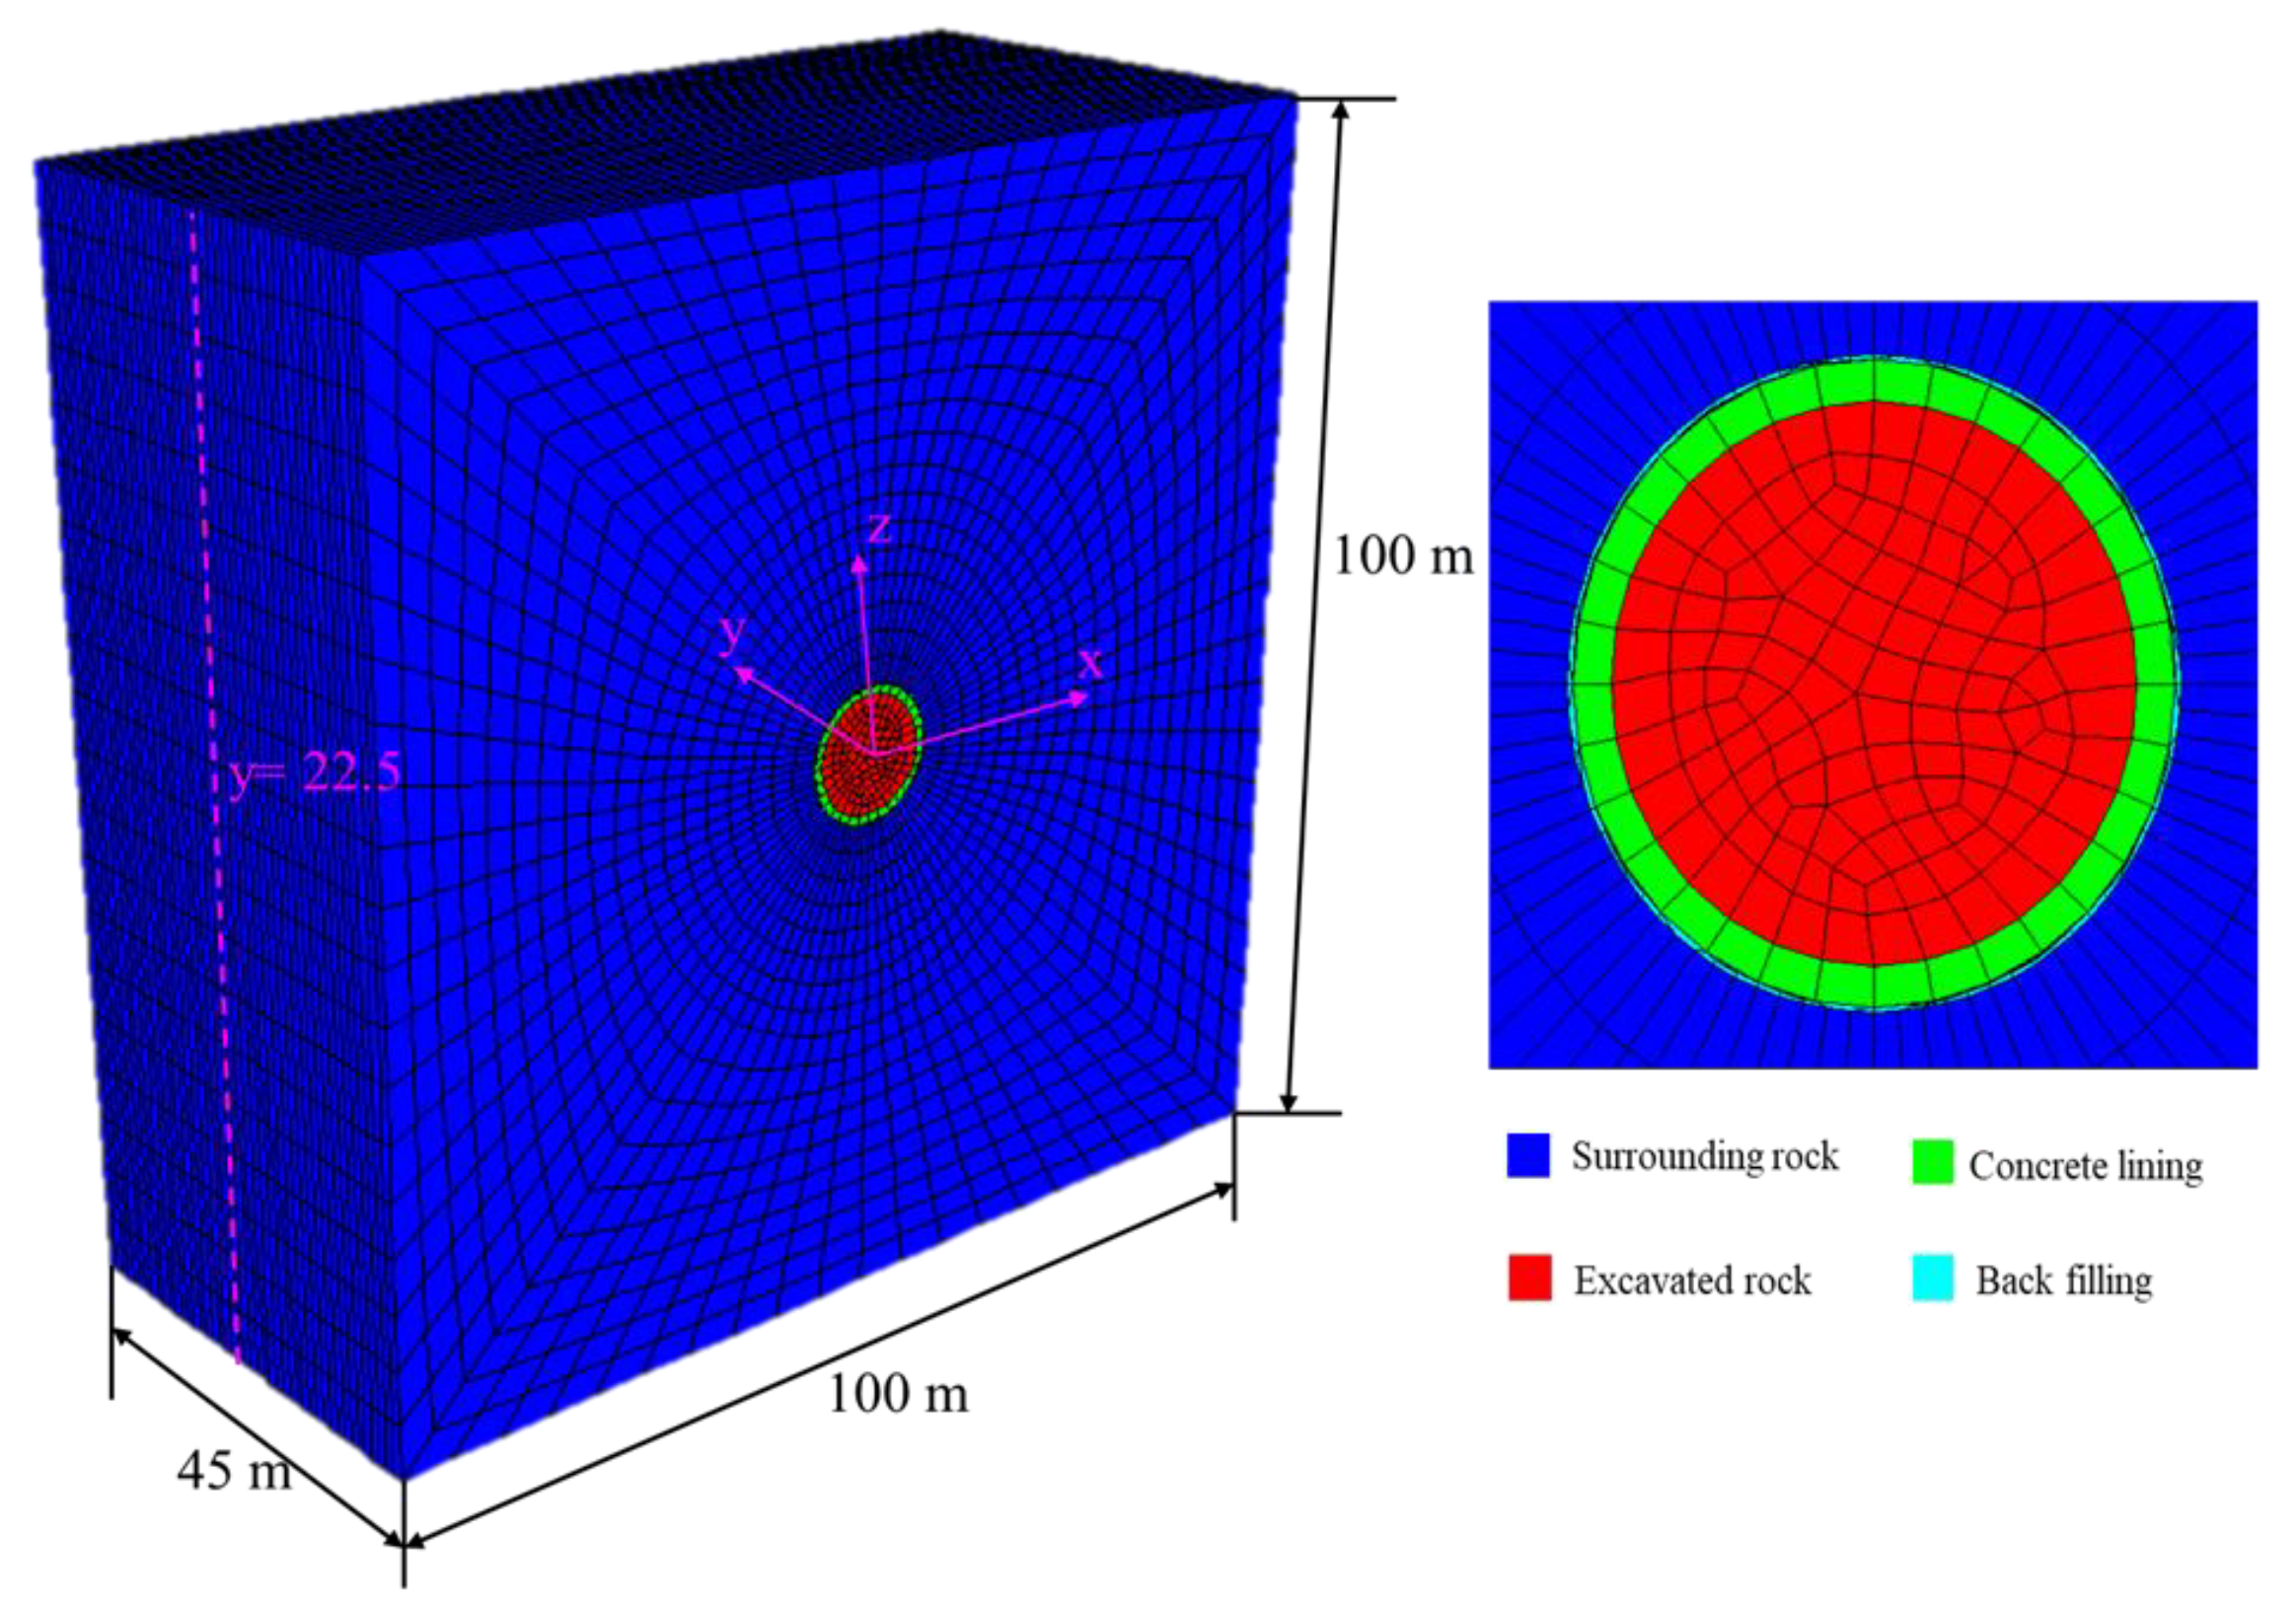
2. Numerical Simulation

2.1. Model Parameters

The water diversion tunnel constructed by the Grade II hydropower station of Jinping was selected as the simulation object and the finite difference software FLAC3D was used to simulate the excavation process of the double shield tunnel boring machine. The excavation diameter D was 12.4 m, and the size of the 3D model was 100 × 45 × 100 m (length × width × height) based on the St. Venant’s principle. In the simulation process, the actual excavation speed is reflected by the length of excavation steps and the number of calculation steps. The length of simulated excavation was 1 m via calculation, and 45 excavation steps were used in the study considering the memory limitation of calculation software. The displacement constraint was applied in the y direction, and the stress gradient constraint considering gravity was applied in the x and z directions, as shown in Figure 1. The buried depth of the project was 2500 m, and the in situ stress was 41.57, 44.18, and 53.11 MPa (σxx, σyy, and σzz), respectively. The specific implementation steps can be found in the literature [29]. The surrounding rock material was assigned according to the Mohr-Coulomb elastoplastic yield criterion and strain-softening model. Table 1 lists the basic parameters of the surrounding rock. The section y = 22.5 m was selected as the monitoring section, and the monitoring points at different positions in the tunnel vault, arch shoulder, and arch waist wall and along the depth direction were arranged to investigate the stress state of the surrounding rock at different depths.

2.2. Calculation Scheme

A total of nine schemes were designed in four groups to study the influence of factors such as the initial in situ stress direction, rock mass type, depth the tunnel is buried, and lateral pressure coefficient on the stress state of the surrounding rock. Specifically, by taking option 1 as the benchmark, Group I only changes the initial in situ stress direction (set schemes 2 and 3), and the benchmark values of other factors remain unchanged to ensure that the influence of this factor on the stress state of the surrounding rock can be found. Similarly, Group II only changed the rock mass classification schemes 4 and 5, Group III only changed the tunnel burial setting schemes 6 and 7, and component IV only changed the lateral pressure coefficient setting schemes 8 and 9. Table 2 lists the specific calculation scheme and model parameters.

3. Results

The stress evolution law of the surrounding rock along the excavation and depth directions during tunnel excavation was obtained by analyzing the results of monitoring points at different positions of the model. On this basis, the influence mechanism of the initial in situ stress direction, rock mass type, depth the tunnel is buried, and lateral pressure coefficient on the magnitude and orientation of principal stress, and the plastic zone of the surrounding rock is further discussed.

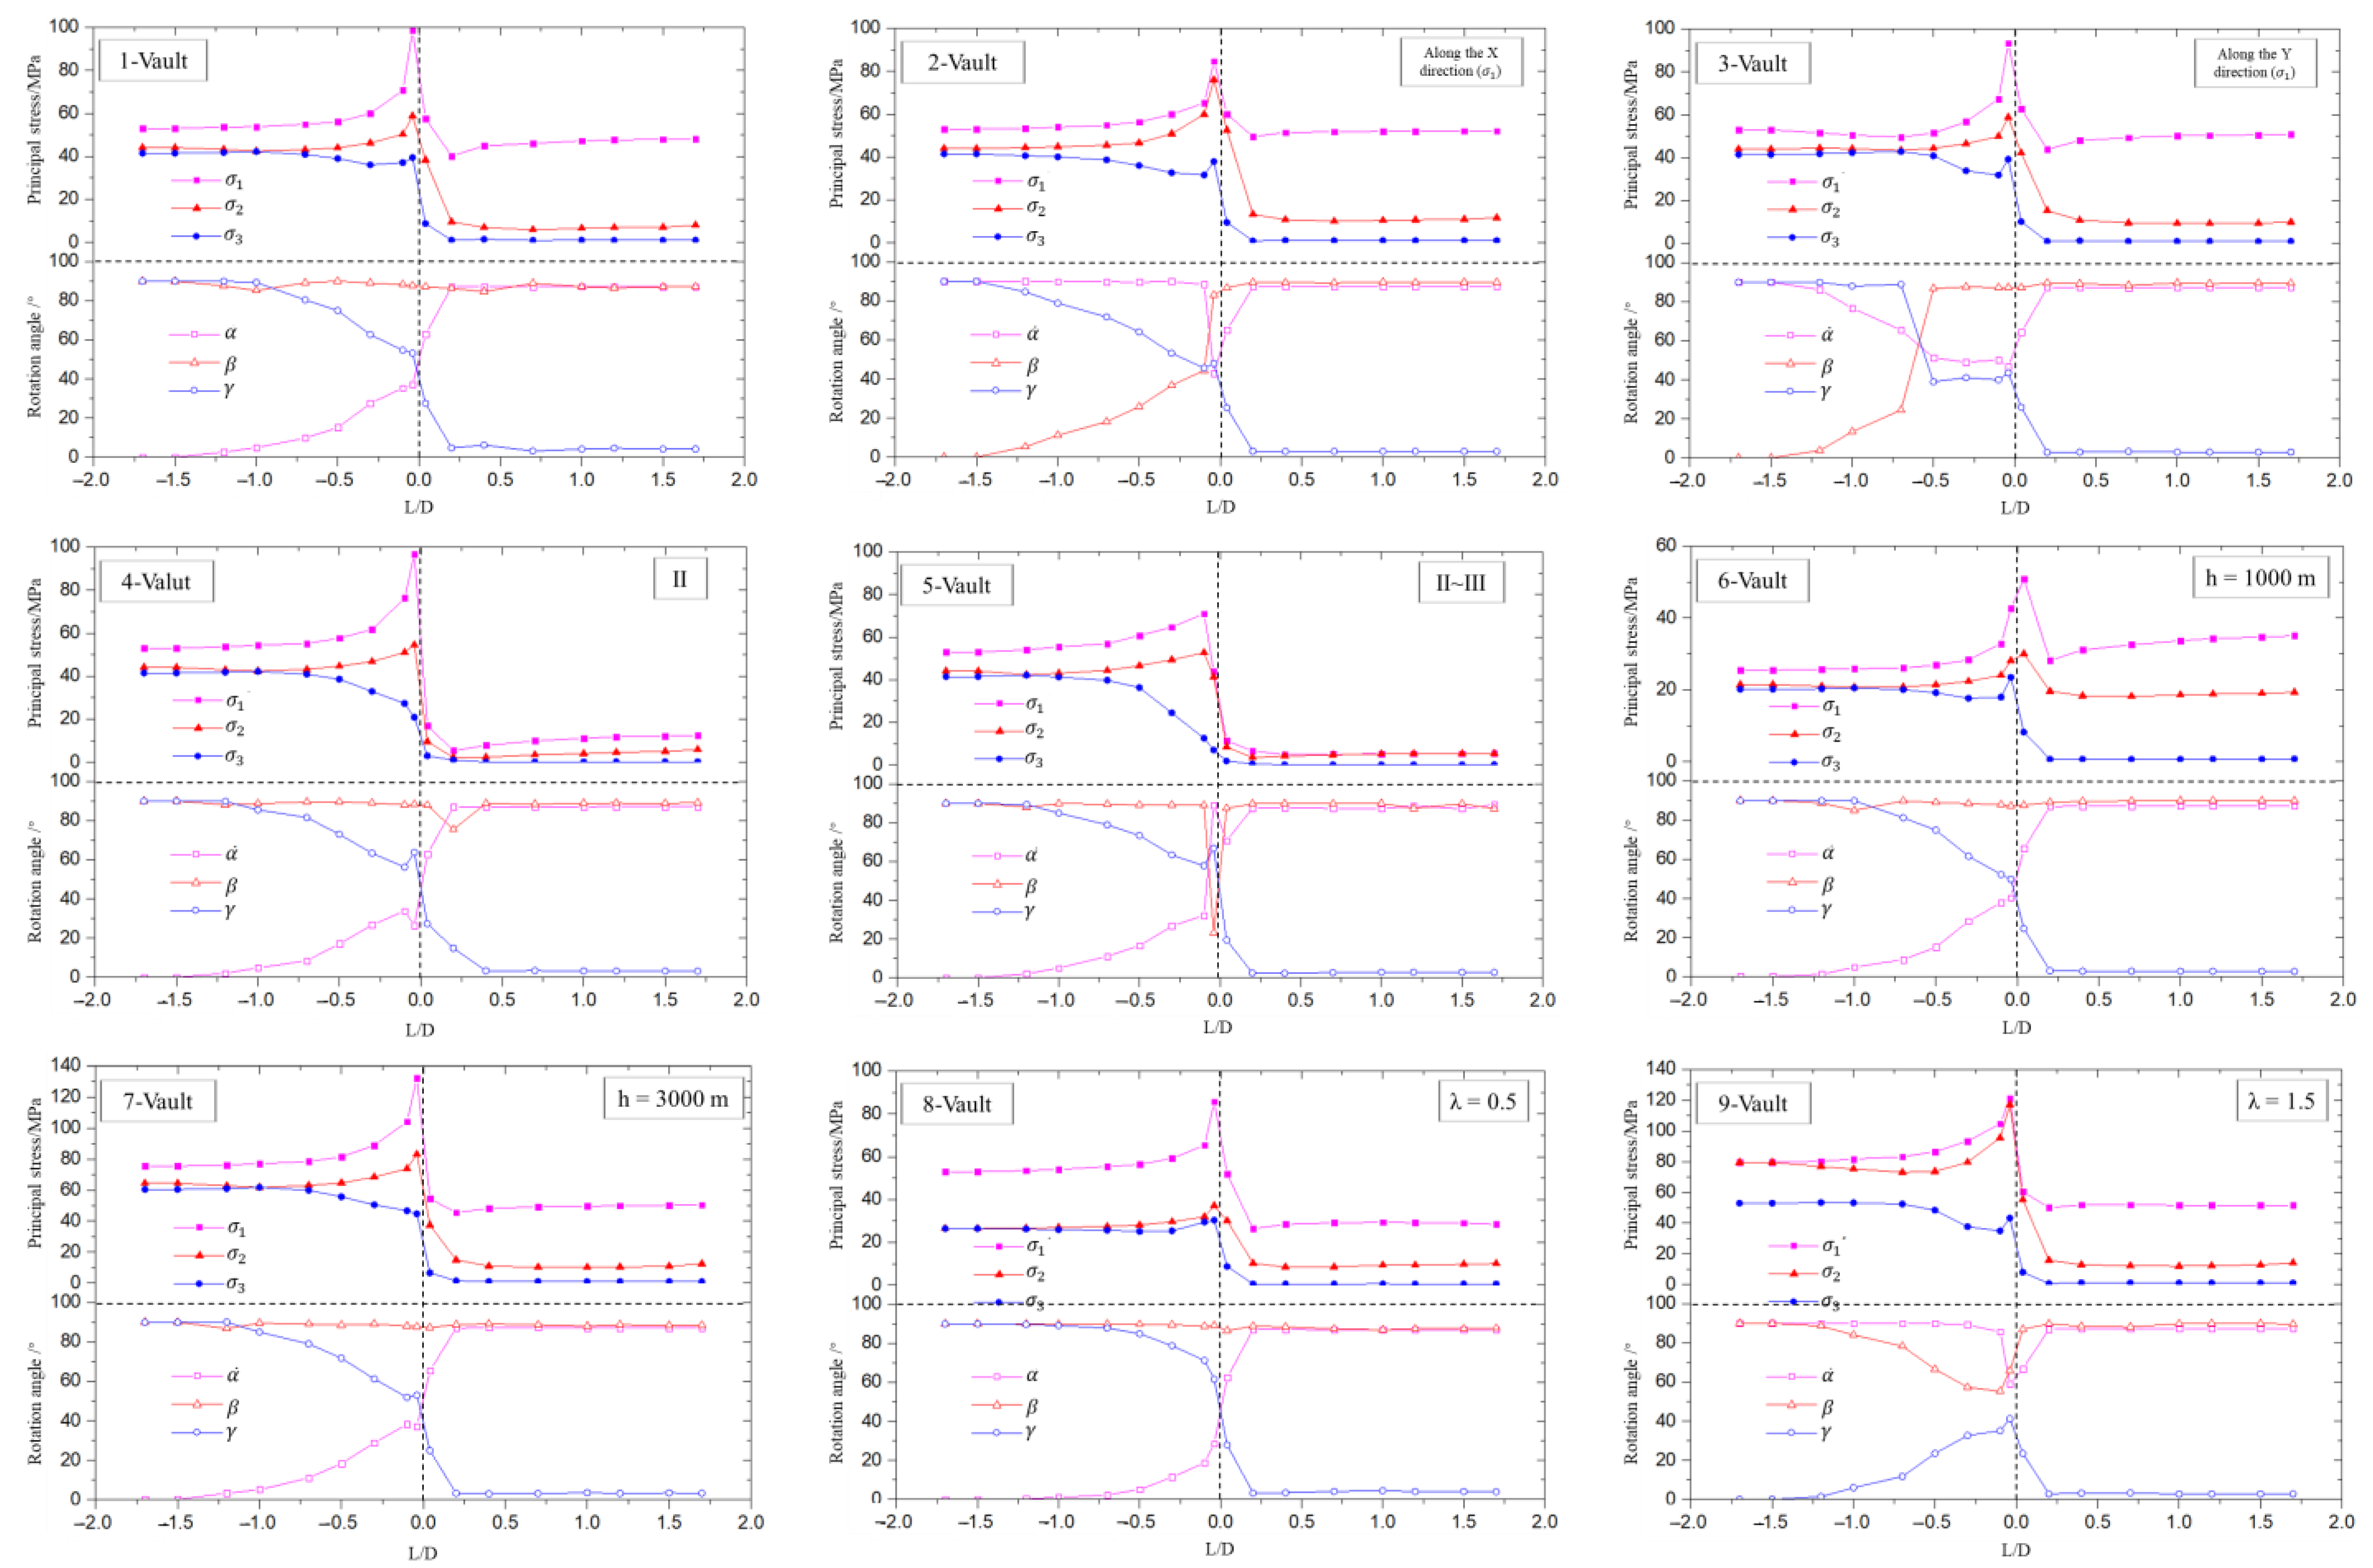
3.1. Distribution of the Stress of the Surrounding Rock

3.1.1. Along the Excavation Direction

The calculation results of schemes 1, 2, and 3 reflect the impact of the initial in situ stress direction. A more detailed analysis of scheme 1 has been carried out [29] and would not be repeated in this article. The distribution of the principal stress magnitude and orientation was illustrated in Figure 2. The horizontal axis L/D represents the position of the tunnel face and the monitoring face. When L/D = 0, it means that the tunnel face reaches the monitoring section. The vertical axis represents the magnitude and orientation of the principal stress, respectively. Due to the limitation of the article, the stress state of the surrounding rock in the tunnel vault was chosen in each scheme. As shown in Figure 2, the principal stress magnitude under the three schemes (1, 2, 3) shows a trend of increasing first and then decreasing until stabilizing (the principal stress peaks at the point where the tunnel face reaches the monitoring face and stabilized at 0.5D from the monitoring face). There is no relationship between the law and initial in situ stress direction, and the position of the monitoring point. However, the variation range of stress is slightly different. An obvious difference was observed between various characteristics of the principal stress orientation under the three schemes. Among them, the changing trend of principal stress orientation in schemes 2 and 3 is consistent. Considering the surrounding rock in the tunnel vault as an example, the maximum principal stress orientation decreases first and then increases (from 90° to 40° and then rises to 90°), and the intermediate principal stress direction increases (from 0° to 90°), and the minimum principal stress direction decreases (from 90° to 0°). In scheme 1, the minimum principal stress orientation changes in the same way while the maximum principal stress orientation increases from 0° to 90°, and the orientation of the intermediate principal stress remains unchanged. Note that the principal stress orientation at the vault in scheme 3 changes at 1D in front of the monitoring face, which is ahead of schemes 1 and 2.
The changes in schemes 1, 4, and 5 are rock mass types, which are realized by setting different basic physical and mechanical parameters, such as elastic modulus, Poisson ratio, cohesion, internal friction angle, and gravity. Taking the surrounding rock at the vault as an example, the magnitude and orientation of the principal stress obtained under the three schemes (1, 4, 5) are all the same, but the variation amplitude is different. The difference of rock mechanical parameters in schemes 1 and 4 is mainly reflected in the elastic modulus, cohesion, and internal friction angle, resulting in a significant difference in the magnitude variation of the maximum principal stress. The variation of the maximum principal stress in scheme 4 reaches 90 MPa, while the variation of the maximum principal stress in scheme 1 is 60 MPa. The Poisson ratio and internal friction angle of rocks in schemes 4 and 5 are different. The peak value of maximum principal stress in schemes 4 and 5 are 100 and 70 MPa, respectively. The cohesion and internal friction angle are the main influencing factors of schemes 1 and 5. The results show that the peak value of the maximum principal stress under scheme 1 is larger than scheme 5. Meanwhile, the maximum principal stress orientation has changed in scheme 5. In summary, the cohesion and the internal friction angle have a more significant impact on the stress state of the surrounding rock than the elastic modulus and Poisson ratio. Furthermore, the cohesion is mainly reflected in the principal stress magnitude, and the internal friction angle has more influence on the principal stress orientation.
The buried depth of the tunnel is closely related to the stress environment. To study the stress state of the surrounding rock under different buried conditions, the variables of schemes 1, 6, and 7 were set to the initial in situ stress for calculation and analysis. The results show that the magnitude and orientation of the principal stress are the same, regardless of the buried depth of the tunnel. When the depth the tunnel is buried is large (i.e., the initial in situ stress is large), the variation amplitude of the principal stress is large, and the unloading effect is apparent. Note that when the tunnel is buried at a shallow depth (scheme 6), the peak value of the principal stress appears at 0.04D behind the tunnel face, which is different from −0.04D in front of the palm of schemes 1 and 7.
The lateral pressure coefficient of schemes 1, 8, and 9 was set to 0.78, 0.5, and 1.5, respectively, to study the influence of horizontal stress on the stress state of the surrounding rock of the tunnel under the same vertical stress. The evolution law of the principal stress of the surrounding rock under the three schemes is consistent. However, the amplitude of the variation is different. The larger the lateral pressure coefficient, the more significant the unloading effect of the surrounding rock. Specifically, the maximum variation amplitude of the maximum principal stress in schemes 1, 8, and 9 is 58.5, 57.2, and 71.3 MPa, respectively. The variation amplitude of the intermediate principal stress change is 52.8, 28.6, and 105 MPa, and the minimum principal stress change amplitude is 38.4, 29.8, and 42.5 MPa. Compared with schemes 1 and 8, the maximum principal stress and minimum principal stress orientation of scheme 9 have changed slightly less while the intermediate principal stress orientation has significantly changed.

3.1.2. Along the Depth Direction

To study the stress state of the surrounding rock at different depths during tunnel excavation, several monitoring points are arranged in the model along the depth direction to visually describe the changes. Limited to the length of the article, the surrounding rock at the vault when the tunnel face reaches the monitoring surface is taken as an example to introduce in detail. Figure 3 shows the curves of the principal stress magnitude and orientation of the surrounding rock at different depths at the vault of each scheme. The y-axis in Figure 3 is the ratio of the distance from the monitoring point to the center of the monitoring face to the diameter D of the excavated hole. The x-axis represents the principal stress magnitude and orientation, respectively, and the pink and yellow shadows indicate the disturbance range of the surrounding rock respectively.
The variation trends of the principal stress magnitudes under schemes 1, 2, and 3 are the same. The maximum principal stress and the intermediate principal stress both gradually decrease from the peak at the cavity wall to stable, and the minimum principal stress decreases first and then increases to stable. The variable region of the principal stress magnitudes is concentrated between 0.5D and 1.4D. Unlike the consistency of the principal stress magnitude variation, the principal stress orientation variation under the three schemes is different. In scheme 1, the maximum principal stress orientation gradually decreases from 40° to 0°, the intermediate principal stress decreases from 90° to 80° and then increases to 90° until it is stable, and the minimum principal stress gradually increases from 50° to 90°, the whole variation region is between 0.5D and 3.4D. In scheme 2, the maximum principal stress increases sharply from 40° to 90° close to the cave wall and then remains stable; the intermediate principal stress decreases sharply by 40° at the cave wall and then gradually decreases to 0°; the minimum principal stress gradually increases from 50° to 90°, the whole variation region is between 0.5D and 3.5D. In scheme 3, the maximum principal stress gradually increases from 45° to 90°, the intermediate principal stress decreases from 90° to 0°, the minimum principal stress decreases from 45° to 15° and then increases to 90°, and the variation region is 0.5D~3D, in which the orientation of the intermediate and the minimum principal stress change abruptly in the range of 1.5D~2D. According to the trend analysis, the magnitude and orientation of the principal stress under all three options gradually recover from the disturbed state at the cave wall to the initial equilibrium state, but the different initial in situ stress directions make the range of perturbation of the surrounding rock different, the range of perturbation of the surrounding rock is the largest in scheme 2 (0.5D~3.5D), and the smallest in scheme 3 (0.5D~3D).
The changing trends of the principal stress magnitude and orientation in the surrounding rock under schemes 1, 4, and 5 are not affected by the rock mass type, and the variability is mainly reflected in the variation range of the principal stress magnitude and orientation. Specifically, the variation of the surrounding rock stress state for schemes 1 and 4 ranges from 0.5D to 3.4D, and for scheme 5 from 0.5D to 4D.
Analyzing the variation law of the principal stress magnitude and orientation of the surrounding rock along the depth direction under different buried depth, it is found that the range of variation of the principal stress magnitude and orientation is the same for schemes 1 and 6, which are between 0.5D~1.4D and 0.5D~3.4D, respectively, while the range of variation is larger in scheme 7, where the principal stress magnitude varies between 0.5D~1.6D and the principal stress direction varies between 0.5D~3.9D.
For schemes 1, 8, and 9, the range of variation magnitude of the principal stress is between 0.5D and 1.5D, while the range of variation in the principal stress orientation is slightly different. Schemes 1, 8, and 9 have a range of variation of 0.5D to 3.4D, 0.5D to 2.5D, and 0.5D to 1.5D respectively. Scheme 8 has a smaller initial horizontal stress, and the range of disturbance to the surrounding rock during excavation is relatively small.

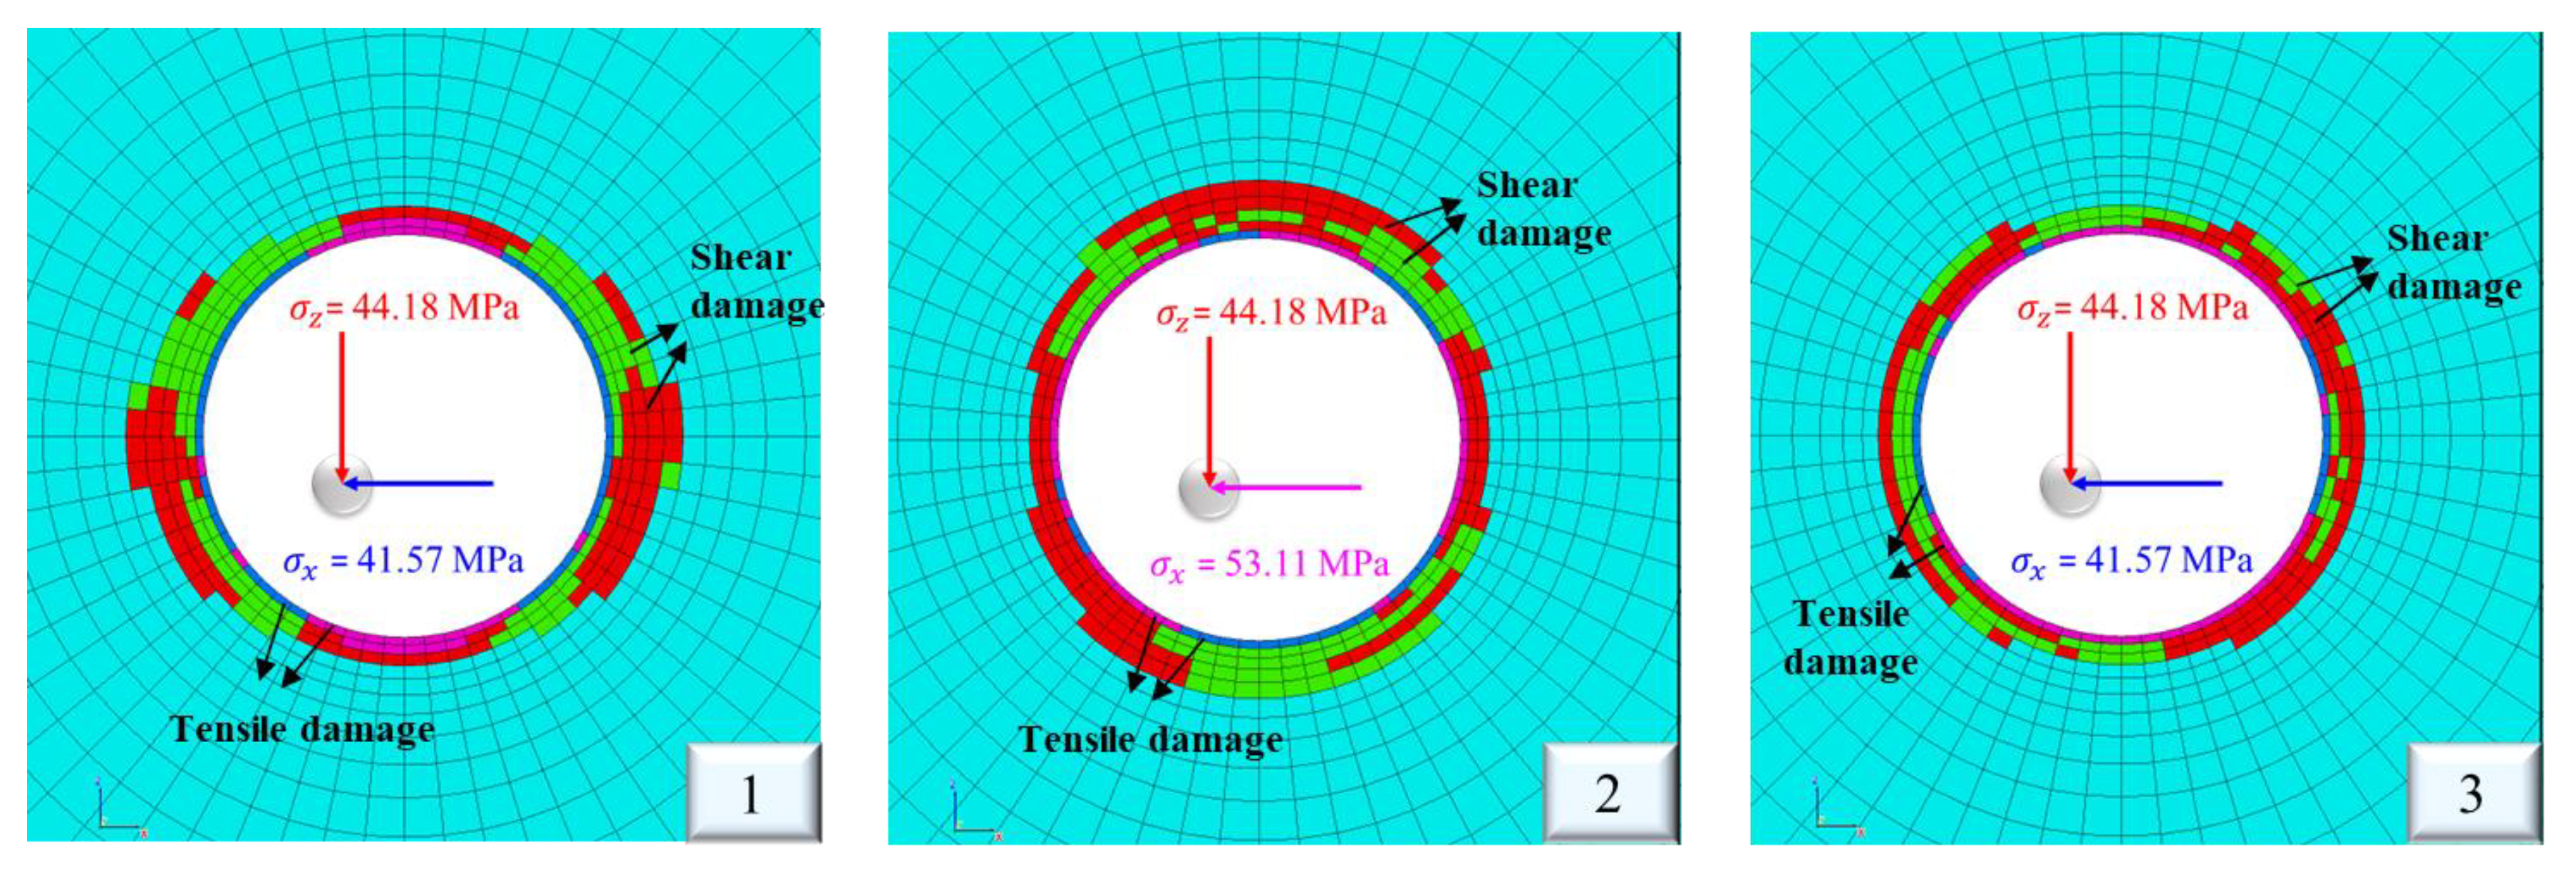
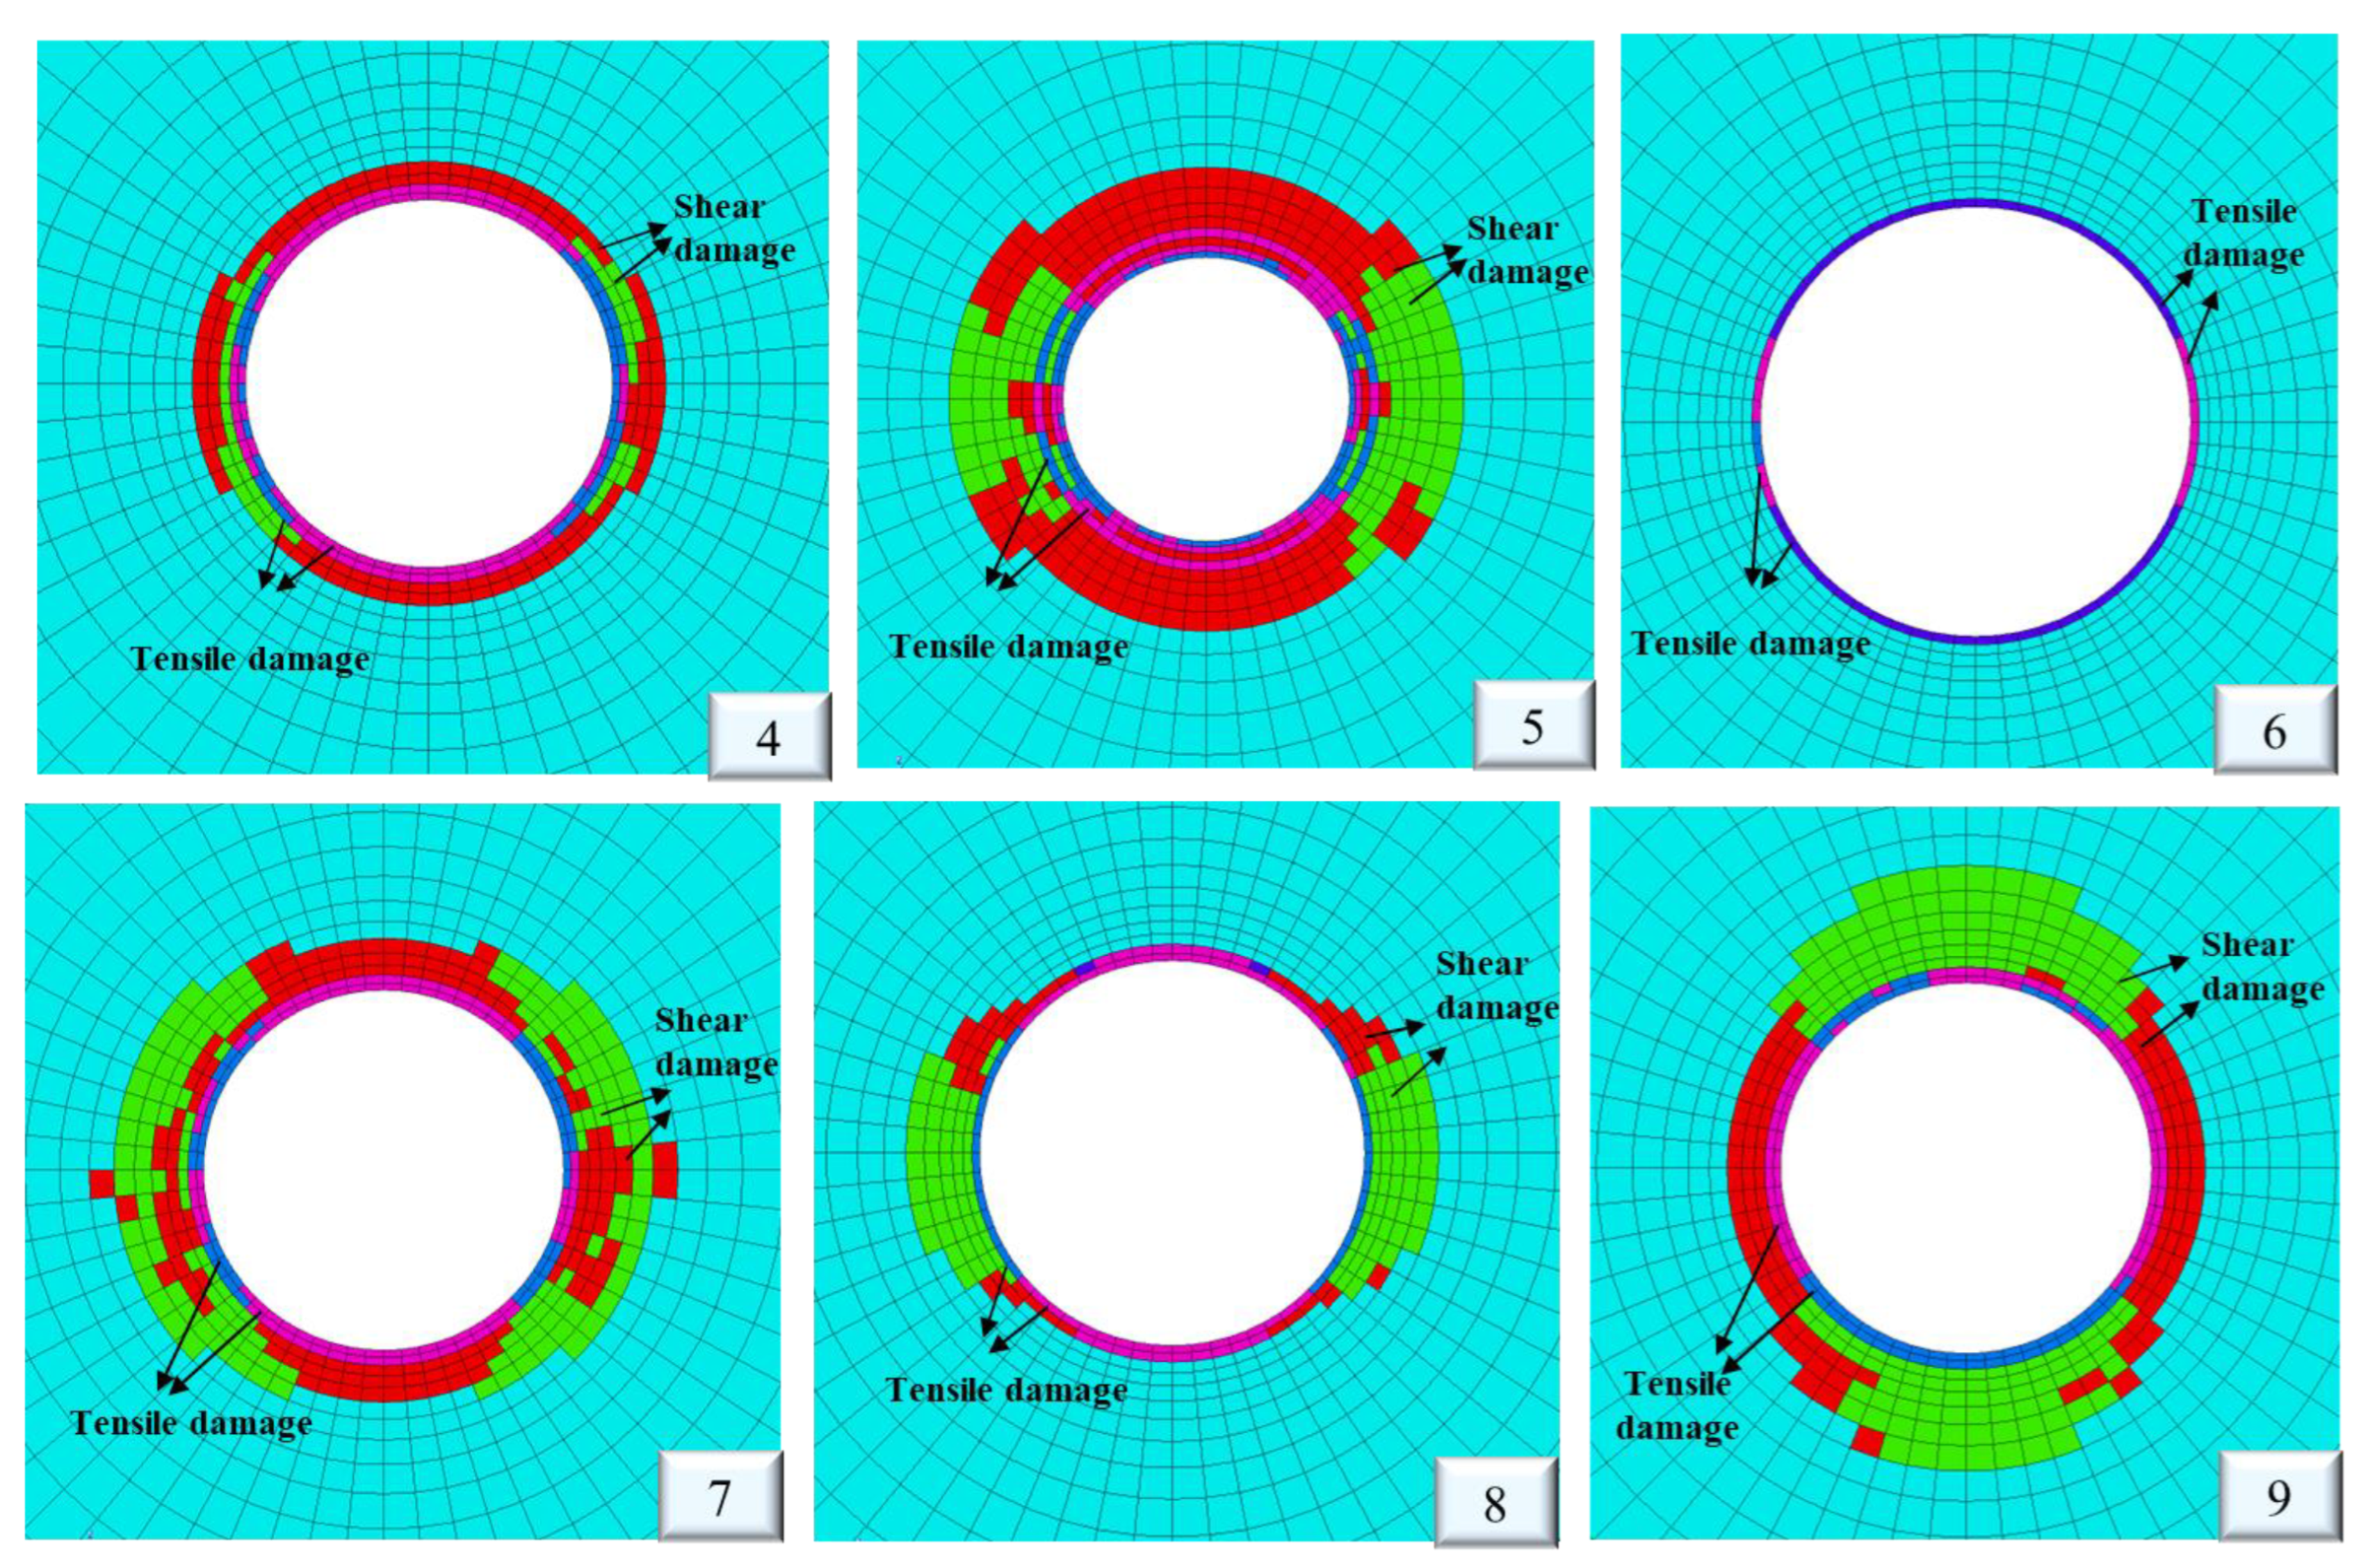
3.2. Distribution of Surrounding Rock Plastic Zones

The distribution cloud map of the plastic zone of schemes 1, 2, and 3 is shown in Figure 4. The surrounding rock of the tunnel transitions from tensile failure to shear failure at the cave’s wall, but the deformation area of the surrounding rock is different due to different initial in situ stress directions. Specifically, the shear damage between the two sides of the tunnel is severe when the maximum principal stress is in the Z-direction. The top and bottom plate of the tunnel is the most affected when the maximum principal stress is in the X-direction. The damaged area of the tunnel is significantly smaller than the two, and the impact of the top and bottom plate and the surrounding rock in the two sides are comparable when the maximum principal stress is in the Y-direction. This law is consistent with the distribution of the stress state of the surrounding rock along the depth direction, which shows that excavating a tunnel along the direction of the maximum principal stress can minimize the disturbance of the surrounding rock, which is conducive to the development of the carrying capacity of the surrounding rock.
The distribution of plastic zones under schemes 1, 4, 5, 6, and 7 are analyzed. Overall, the worse the quality of the rock mass, the deeper the tunnel is buried, and the larger the law of the plastic zone of the surrounding rock, which is consistent with the law of the disturbance range of the surrounding rock obtained above. That is, in the same initial insensitive stress environment, the better the mechanical properties of the rock mass, the stronger the bearing capacity. The change of its stress state during the tunnel is relatively simple. In contrast, the stress state changes are complex and prone to damage, and the surrounding rock is widely disturbed.
The influence of the lateral pressure coefficient on the plastic distribution of the surrounding rock is analyzed. Compared with schemes 8 and 9, the three initials in situ stress values of scheme 1 are not different, indicating that the distribution of the plastic zone is relatively uniform. In scheme 8, the initial vertical stress is greater than the horizontal stress, the plastic shear deformation of the surrounding rocks of the two groups of the tunnel is relatively large, and the surrounding rock on the top and bottom plate has undergone tension failure. In contrast, the initial horizontal stress in scheme 9 is large, resulting in large plastic shear deformation of the surrounding rock on the roof and bottom of the tunnel, and tension failure occurs in the two groups of the tunnel.

4. Discussion

The fracture phenomenon of surrounding rock zoning is a new rock mechanics phenomenon in deep rock mass engineering [31,32]. In view of this research direction, scholars have obtained many results in theory and experiments. Considering the stress distribution characteristics of the surrounding rock and the stress magnitude and orientation evolution law of the surrounding rock, the author intends to use stress triaxiality, Lord parameters, and stress ratio to divide the surrounding rock to obtain the stress path evolution law of the surrounding rock in different areas in the tunnel excavation process. The laboratory test research can be refined, and the stability of the surrounding rock would be accurately evaluated.

4.1. Stress Distribution Characteristics of Surrounding Rocks

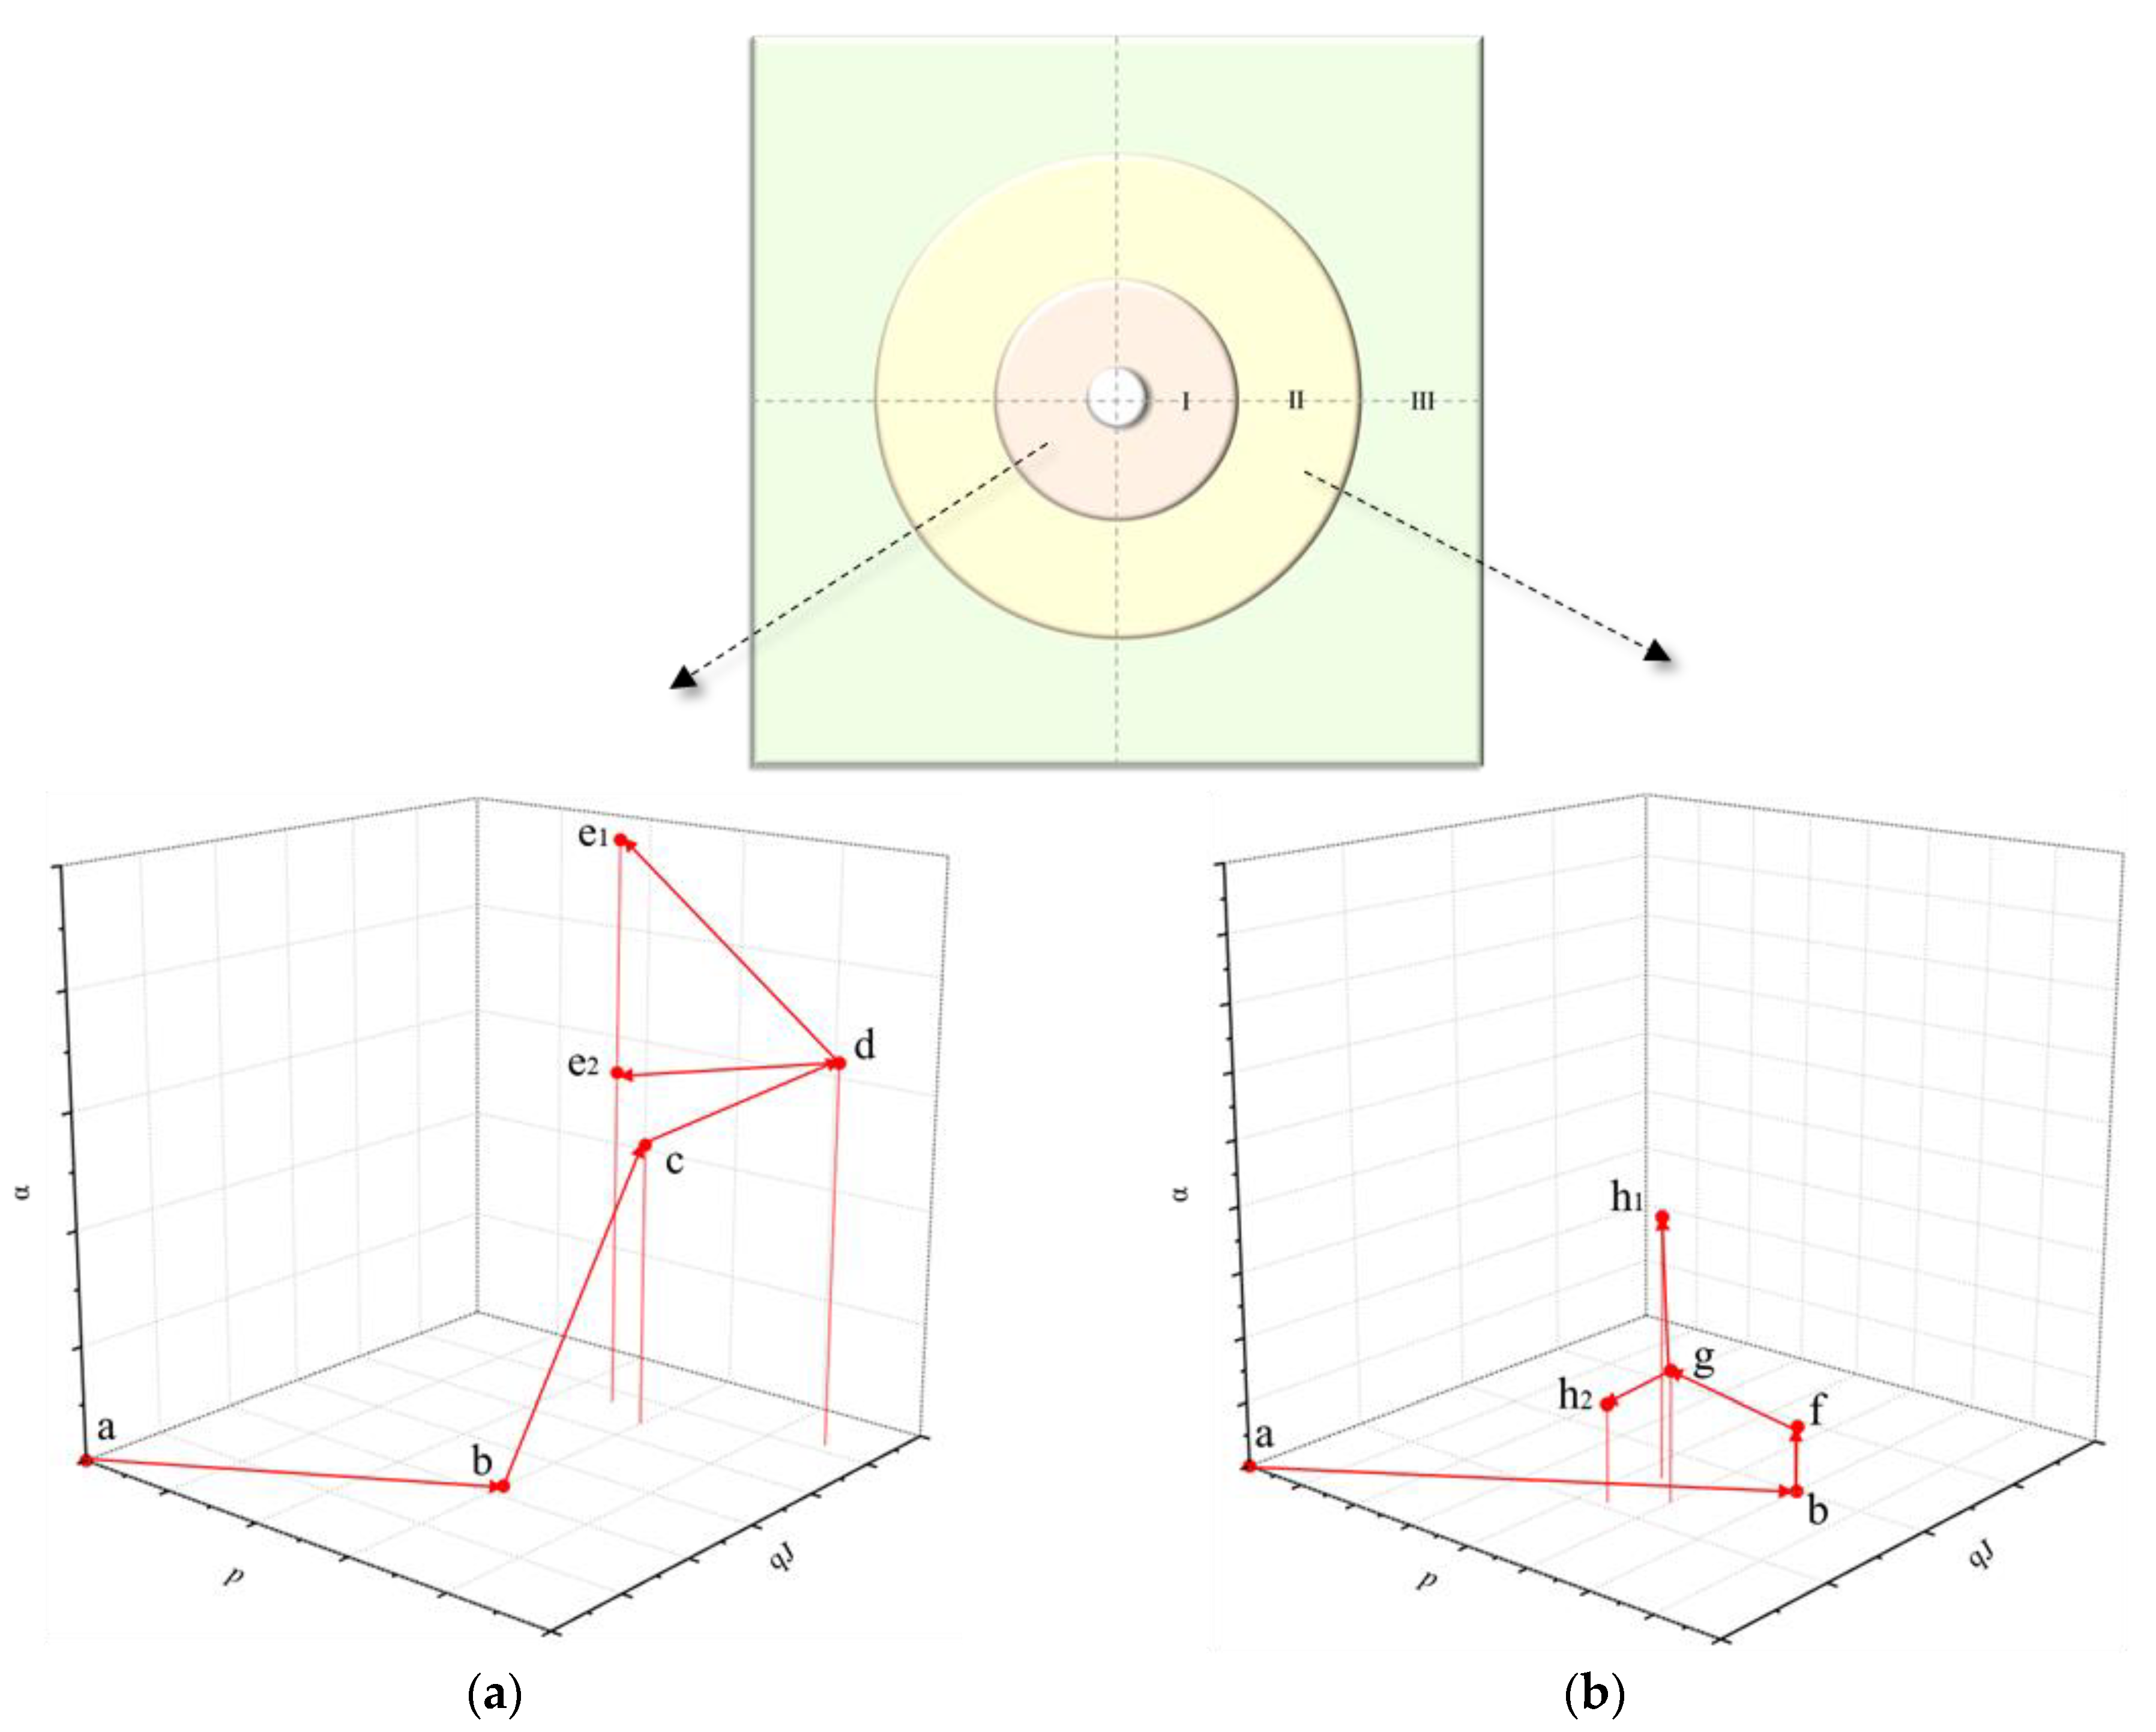
4.1.1. Partition of Surrounding Rock

The stress triaxiality Rσ is the ratio of mean stress to the generalized shear stress, as shown in Equation (1). As described in damage mechanics, Rσ can reflect the restraint ability of the triaxial stress state on material deformation in the stress field and can be used to describe the stress state of the rock mass. Specifically, when Rσ = 1/3, the rock is in a uniaxial compression state, and the triaxial compression state corresponds to Rσ = 4/3. The greater the value of stress triaxiality, the more the stress state of the surrounding rock tends to the hydrostatic stress state. The Lord parameter μσ considers the influence of the intermediate principal stress on the stress state Equation (2), and it can be used to describe the type of plastic strain of the surrounding rock. The surrounding rock is in a shear state when −1 < μσ < 0 while the surrounding rock is in a compression shear state when 0 < μσ < 1. Here, μσ = −1 corresponds to the tensile state, and μσ = 0 is the pure shear state. The stress ratio n is the ratio of the maximum principal stress to the minimum principal stress Equation (3), which can be used to illustrate the expansion of cracks in the rock.
R σ = p q J = 2 ( σ 1 + σ 2 + σ 3 ) 3 ( σ 1 σ 2 ) 2 + ( σ 2 σ 3 ) 2 + ( σ 3 σ 1 ) 2
μ σ = σ 1 + σ 3 2 σ 2 σ 1 σ 3
n = σ 1 σ 3
Figure 5 shows the three stress state parameters along the depth direction of the surrounding rock under different initial in situ stress directions, rock mass type, depth the tunnel is buried, and lateral pressure coefficient. The trend of stress triaxiality Rσ increases first and then decreases until it is stable, reflecting the gradual transformation of the surrounding rock from a two-way compression state near the cave wall to a three-way compression state. In contrast, the trend of Lord parameter μσ decreases first, then increases, and finally decreases until it is stable. Among them, the Lord parameter of the surrounding rock near the cave’s wall is negative, indicating that the surrounding rock is caused by tensile stress. Then, the Lord parameter gradually increases, and the surrounding rock is in a state of compression shear and shear. This phenomenon is consistent with the distribution law of the surrounding rock plastic zone. The stress ratio n peaks at the cave’s wall. The cracks in the surrounding rock significantly expand and gradually decrease to a stable value as the depth increases. In summary, the stress state parameters of the surrounding rock change regionally along the depth direction regardless of the calculation scheme adopted. The stress state parameters of the surrounding rock near the cave’s wall change sharply. The surrounding rock far away from the cave wall is not affected by excavation disturbances; thus, its stress state parameters remain unchanged.
Combined with the range of changes in the principal stress magnitude and orientation of the surrounding rock along the depth obtained, the area where the principal stress magnitude and orientation of the surrounding rock changes coincides with the process of the stress triaxiality Rσ from the low value at the wall of the cave to the peak, indicating that the stress state of the surrounding rock in this area is violent. After the adjustment, the internal energy is sharply released to reach a stable state. At this time, the surrounding rock is prone to rupture. With the change of the principal stress magnitude and orientation, the surrounding rock gradually reaches equilibrium. The stress triaxiality Rσ gradually decreases from the peak value to a stable value, which is consistent with the previous results. In summary, the peak and stability values of stress triaxiality Rσ can be used as the dividing point, and the surrounding rock can be divided into three regions, such as the stress mutation region (pink region I), perturbation region (yellow region II), and stable region (green region III). Among them, the peak of the stress triaxiality Rσ is the boundary between the mutation region and the perturbation region. The stability value of the point is the boundary point between the disturbance and stability zones.
Therefore, the following information can be intuitively obtained from the figure. The tunnel excavation direction is consistent with the maximum initial in situ stress direction. The better the quality of the rock mass, the shallower the tunnel is buried, the smaller the lateral pressure coefficient, the smaller the corresponding surrounding rock mutation area and perturbation area, and the higher the stability of the tunnel.

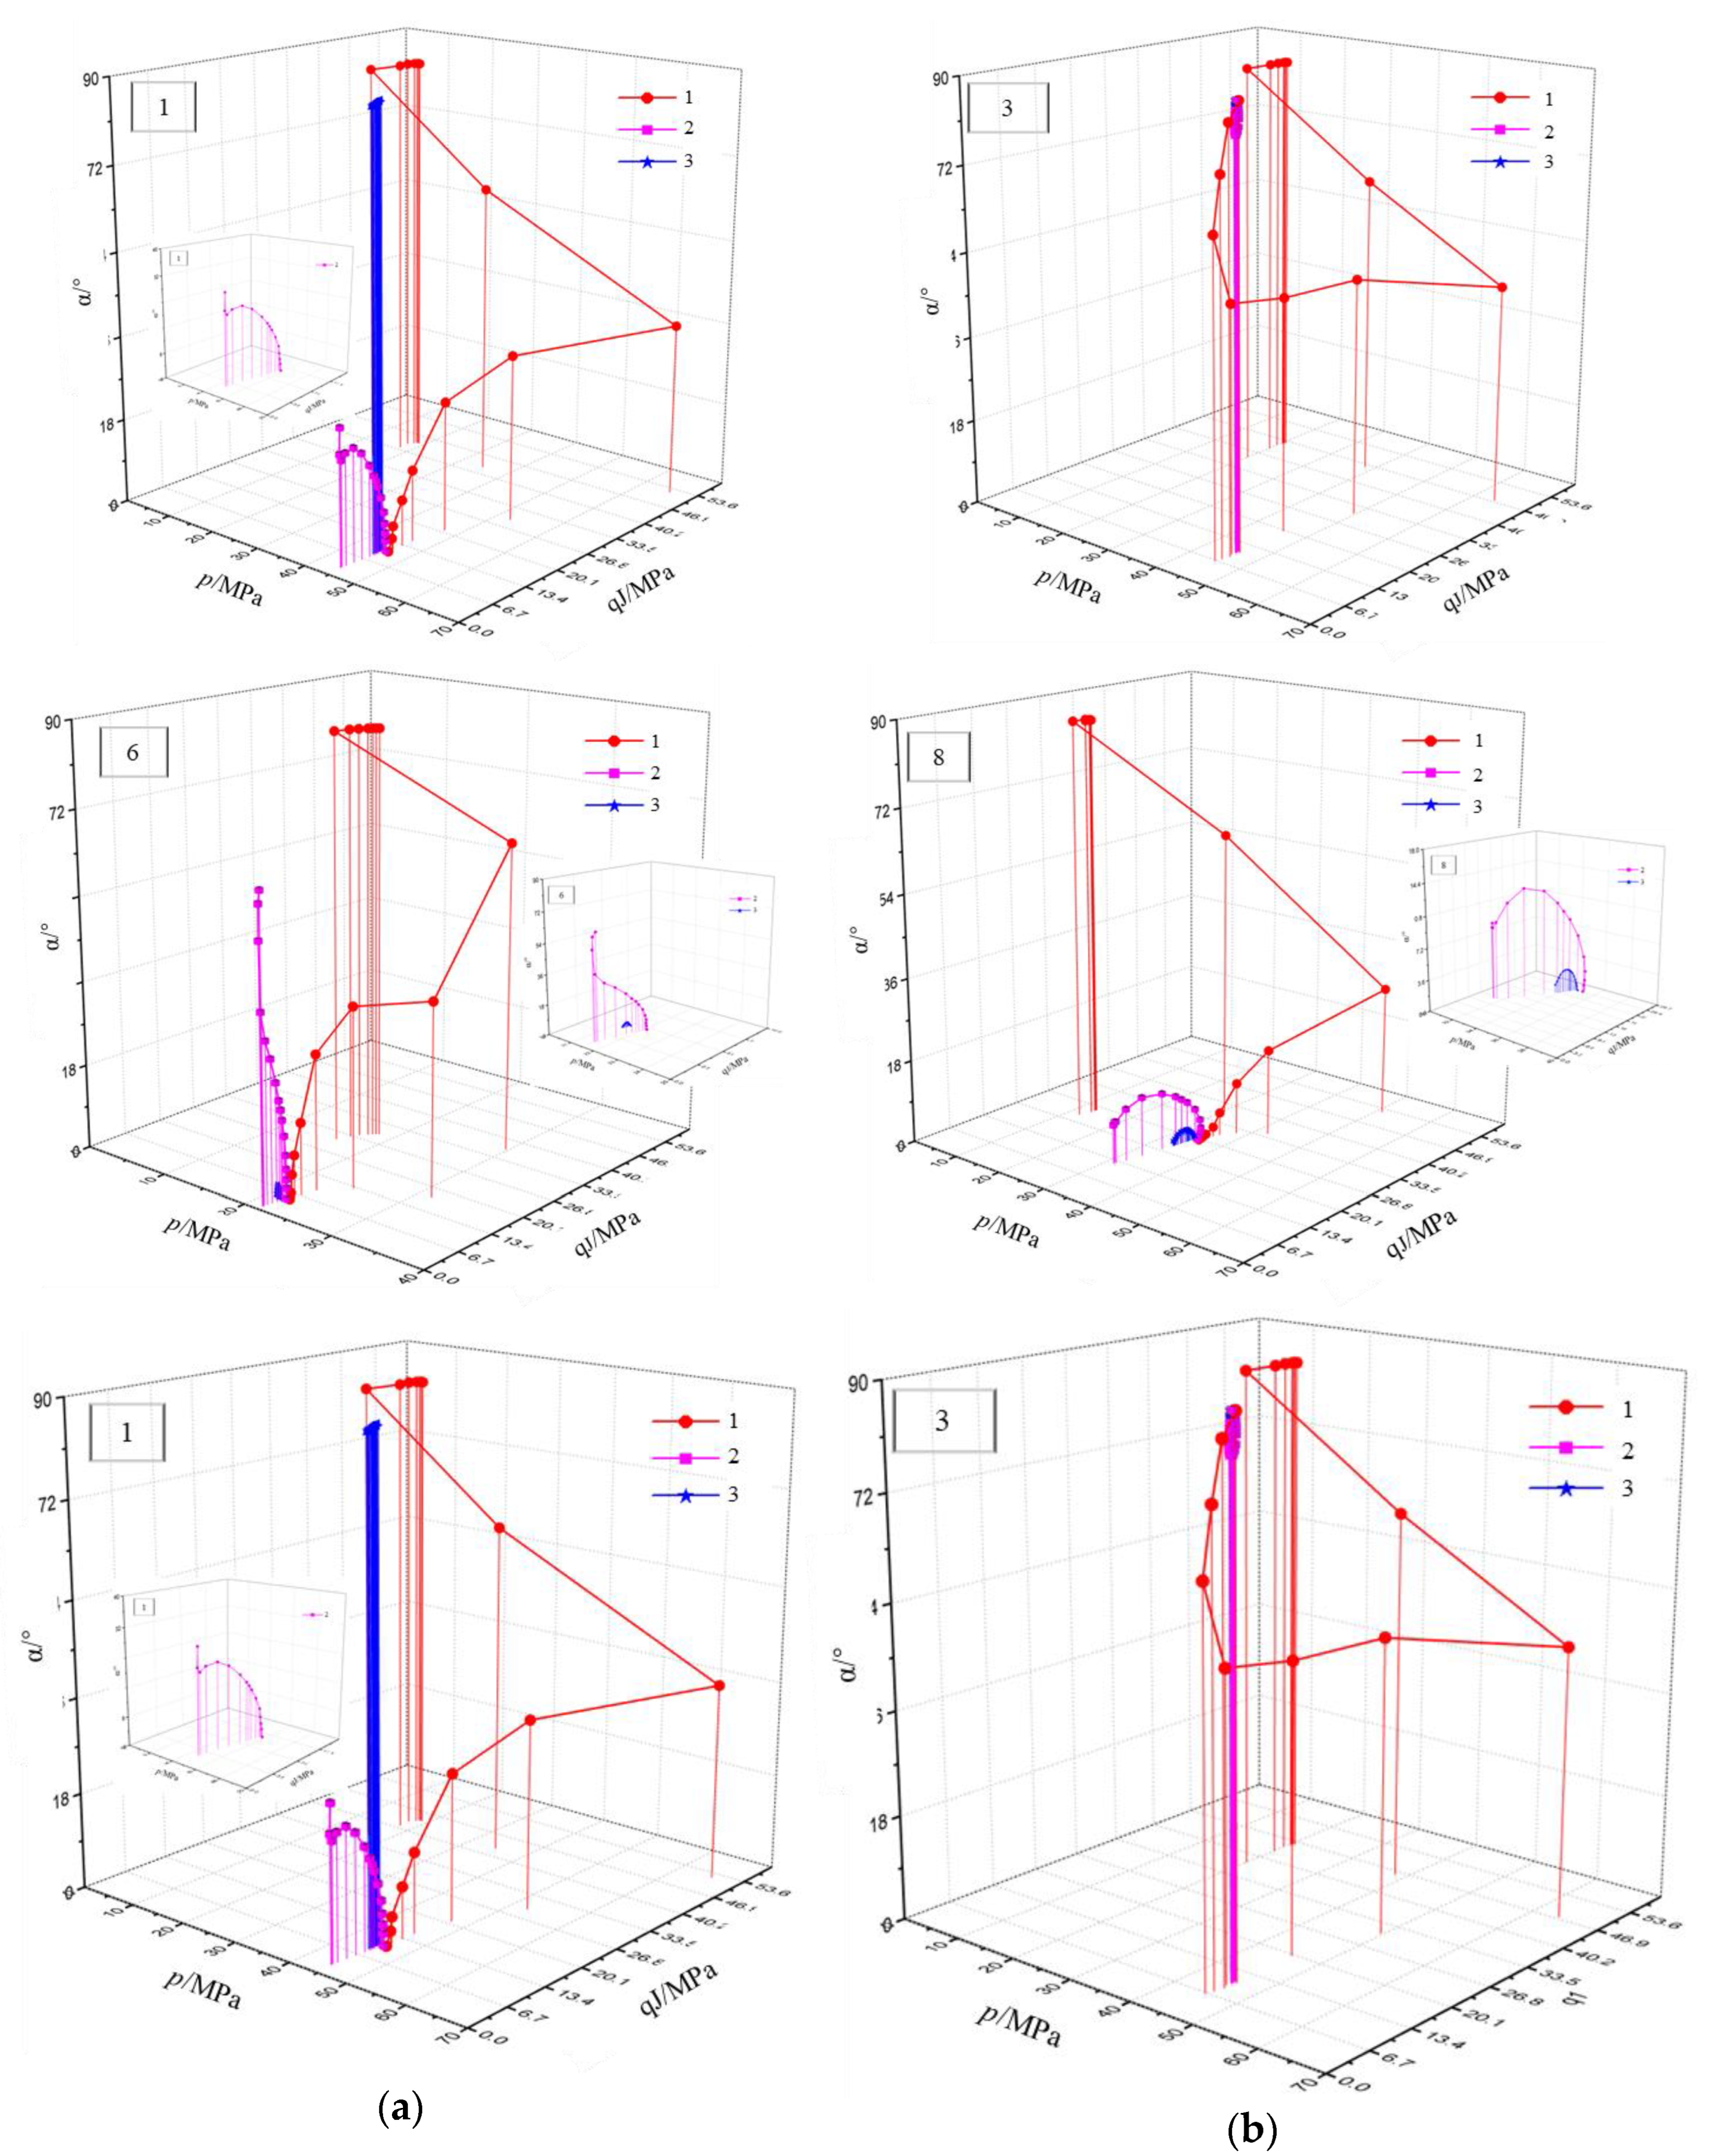
4.1.2. Evolution of the Stress Path of Surrounding Rock

Obtaining the mechanical response of the surrounding rock in the tunnel excavation process is the key to evaluating the stability of the tunnel. The accurate evolution law of the surrounding rock stress path can reproduce the change of the surrounding rock stress state and realize the fine study of rock laboratory test. The stress path evolution law of the surrounding rocks in different regions was obtained based on the above zoning standard. First, according to the aforementioned results, the optimal scheme under each factor (schemes 3, 1, 6, and 8) was determined. Second, the monitoring points of the cave wall corresponding to the peak value of stress triaxiality, and a stable value was selected as the object. Finally, the stress paths of the surrounding rock under different excavation steps were obtained through data analysis and processing (as shown in Figure 6).
Referring to the previous study [29], the principal stress coordinate space was selected to illustrate the stress path evolution law of the surrounding rock. Specifically, the x-axis in the Figure 6 indicates the mean stress p, the y-axis is generalized shear stress qJ, and the z-axis indicates the rotation angle of the principal stress axes α. In Figure 6, “1” represents the surrounding rock (round point) at the wall of the cave, “2” indicates the surrounding rock (square point) at the junction of the stress mutation zone I and the perturbation area II, and “3” is the surrounding rock (star point) at the junction of the stress disturbance area II and the stabilization zone III.
The stress state of the surrounding rock changes from being complex to simple along the depth direction during tunnel excavation, and this law is not affected by other factors. Specifically, the surrounding rock at the wall of the cave suffers the most disturbances, and its stress magnitude and orientation vary considerably before the tunnel face reaches the monitoring face, the generalized shear stress and rotation angle increase as the mean stress increases, and the rotation angle in scheme 3 slightly decreases due to the influence of the initial stress direction. The generalized shear stress peaks when the tunnel face reaches the monitoring surface, and then, the mean stress and generalized shear stress of the surrounding rock decrease and stabilize. Additionally, the rotation angle increases quickly until it stabilizes after the tunnel face passes through the monitoring face. Interestingly, the stress path evolution law of the surrounding rocks under the three calculation schemes (1, 6, 8) is consistent with the author’s previous results, as shown in Figure 7a. With the increase in depth, the stress path of the surrounding rock at the junction of the stress mutation area I and the perturbation zone II becomes relatively simple. The influence of different factors makes the amplitude of stress magnitude and orientation slightly different, but the changing trend is still the same. The stress state of the surrounding rock is unaffected by excavation disturbance when the surrounding rock is far enough from the cave wall (the surrounding rock at the junction of stress disturbance area II and stable zone III).
To simulate the change in principal stress magnitude and orientation, the self-developed hollow cylinder torsional apparatus for rock (HCAR) [33] is selected. The apparatus could apply four loads (axial force, outer confining pressure, inner confining pressure, and torque) independently, and the axial strain, circumferential strain, radial strain, and shear strain can be measured with a deformation measuring system. Based on the theoretical relationship between the mean stress, generalized shear stress, rotation angle, and four loads [33], the general evolution law of the stress path of the surrounding rock during the TBM excavation of the deep buried tunnel was proposed. Figure 7a shows the stress path of the surrounding rock in the stress mutation area, and Figure 7b illustrates the law in the stress disturbance area. The following loading methods can be used to simulate the stress path of the surrounding rock in the stress mutation area. First, apply axial force, inner and outer confining pressure to the predetermined value (a→b); then, maintain the axial force, inner and outer confining pressure constant, and apply torque (b→c); subsequently, maintain the inner and outer confining pressure so that it is constant while increasing the axial force and torque (c→d). Finally, keep the inner and outer confining pressure constant—the torque is constant and the axial force is reduced (d→e1)—while the torque and axial force are reduced simultaneously (d→e2). In a similar way, the stress path of the surrounding rock in the stress disturbance area can be realized. First, apply axial force, inner and outer confining pressure to the predetermined value (a→b); second, increase the axial force, inner and outer confining pressure, and torque simultaneously to achieve the rotation of the principal stress axes (b→f). Then, the axial force decreases with constant inner and outer confining pressure and torque (f→g). Finally, under the condition that the inner and outer pressure is constant, reduce the axial force while maintaining the same torque (g→h1), and reduce the torque and the axial force (g→h2).

4.2. Sensitivity Analysis of Influencing Factors of Stress State of Surrounding Rock

Based on the analysis of the influence of the above factors on the stress magnitude, orientation, and plastic zone of the surrounding rock during tunnel excavation, the sensitivity of the initial in situ stress direction, rock mass type, depth the tunnel is buried, and lateral pressure coefficient on the stress state of the surrounding rock in the tunnel was studied. Five target variables were selected, namely the peak value of stress triaxiality Rσ, the critical value H/D of the surrounding rock stress mutation area, the vertical displacement Sz, the stress ratio n, and the size of the plastic zone. Furthermore, the range coefficient Equation (4) and standard deviation coefficient Equation (5) were analyzed, as shown in Figure 8.
δ = x m a x x m i n x ¯
  V σ = σ x ¯ σ = i = 1 n ( x i x ¯ ) 2 n
where xmax is the maximum value of the target variable, xmin is the minimum value of the target variable, x ¯ is the average value of the target variable, xi is the value of the target variable, δ is the range coefficient, σ is the standard deviation, and Vσ is the standard deviation coefficient.
Based on Figure 8, the distribution of the range coefficient and the standard deviation coefficient of each target variable is the same. The range coefficient was taken as an example and was analyzed in detail. The lateral pressure coefficient has the greatest impact on the peak value of stress triaxiality Rσ, followed by the initial in situ stress direction, and the rock mass type has the least impact. For the critical value H/D in the surrounding rock stress mutation area, the lateral pressure coefficient > rock mass type > initial in situ stress direction > depth the tunnel is buried. The vertical displacement Sz is most affected by the depth the tunnel is buried, followed by the rock mass type. The initial in situ stress direction and lateral pressure coefficient have a similar impact on the vertical displacement. The stress ratio n is also most affected by the depth of tunnel burial, followed by the lateral pressure coefficient, rock mass type, and the initial in situ stress direction. The size of the surrounding rock plastic zone is the most sensitive to the change of the depth the tunnel is buried, followed by the rock mass type and lateral pressure coefficient, and the initial in situ stress direction is the least affected.

5. Conclusions

This study studied the TBM excavation process of deep buried tunnels using the numerical analysis method. The sensitivity analysis of factors affecting the stability of the deep buried tunnel was investigated. The main conclusions of the study are as follows:
  • In the process of tunnel excavation, the surrounding rock stress field redistributes in both the excavation and depth direction, among which the stress magnitude and orientation change significantly.
  • The surrounding rock of the tunnel was divided into a stress mutation area (0.5D~2D), perturbation area (2D~4D), and stability area (exceed 4D), with the peak and stable value of stress triaxiality as the critical point, which can reflect the influence of the principal stress orientation.
  • The evolution law of the stress path of the surrounding rock in different regions was proposed, which can realize the simulation of the stress magnitude and orientation of the surrounding rock by considering the tunnel excavation disturbance in the laboratory test.
  • The sensitivity of each factor was evaluated with the range coefficient and standard deviation coefficient of five target variables. The lateral pressure coefficient is a key factor affecting the peak value Rσ and the critical value H/D of the surrounding rock stress mutation area. The vertical displacement, stress ratio, and plastic zone distribution are most significantly affected by the tunnel’s buried depth.

Author Contributions

Conceptualization, Y.J. and W.Z.; methodology, Y.J.; software, W.Z.; validation, Y.J. and W.Z.; formal analysis, Y.J.; investigation, Y.J.; resources, W.Z.; data curation, W.Z.; writing—original draft preparation, Y.J.; writing—review and editing, Y.J.; visualization, W.Z.; supervision, Y.J.; project administration, Y.J.; funding acquisition, Y.J. All authors have read and agreed to the published version of the manuscript.

Funding

The authors would like to thank the financial supports provided by National Natural Science Foundation of China (NSFC) (42102307); Open Research Fund of State Key Laboratory of Geomechanics and Geotechnical Engineering, Institute of Rock and Soil Mechanics, Chinese Academy of Sciences Grant (Z2019023); Natural Science Foundation of Jiangsu Province (BK20209992); Jiangsu Province High-level Innovative and Entrepreneurial Talent Introduction Plan. Besides, the authors are also grateful to the anonymous reviewers for their careful reading of our manuscript and their many helpful comments.

Institutional Review Board Statement

Not applicable.

Informed Consent Statement

Informed consent was obtained from all participants involved in this study.

Data Availability Statement

Not applicable.

Conflicts of Interest

The authors declare no conflict of interest.

References

  1. Abel, J.F.; Lee, F.T. Stress changes ahead of an advancing tunnel. Int. J. Rock Mech. Min. Sci. Geomech. Abstr. 1973, 10, 673–697. [Google Scholar] [CrossRef]
  2. Hoek, E.; Brown, E.T. Underground Excavations in Rock; The Institution of Mining and Metallurgy: London, UK, 1980. [Google Scholar]
  3. Kelsall, P.; Case, J.; Chabannes, C. Evaluation of excavation-induced changes in rock permeability. Int. J. Rock Mech. Min. Sci. Geomech. Abstr. 1984, 21, 123–135. [Google Scholar] [CrossRef]
  4. Diederichs, M.S.; Kaiser, P.K.; Eberhardt, E. Damage initiation and propagation in hard rock during tunnelling and the influence of near-face stress rotation. Int. J. Rock Mech. Min. Sci. 2004, 41, 785–812. [Google Scholar] [CrossRef]
  5. Read, R.S. 20 years of excavation response studies at AECL’s underground research laboratory. Int. J. Rock Mech. Min. Sci. 2004, 8, 1251–1275. [Google Scholar] [CrossRef]
  6. Martino, J.; Chandler, N. Excavation-induced damage studies at the Underground Research Laboratory. Int. J. Rock Mech. Min. Sci. 2004, 41, 1413–1426. [Google Scholar] [CrossRef]
  7. Bizjak, K.F.; Petkovšek, B. Displacement analysis of tunnel support in soft rock around a shallow highway tunnel at Golovec. Eng. Geol. 2004, 75, 89–106. [Google Scholar] [CrossRef]
  8. Malmgren, L.; Saiang, D.; Töyrä, J.; Bodare, A. The excavation disturbed zone (EDZ) at Kiirunavaara mine, Sweden-by seismic measurements. J. Appl. Geophys. 2007, 61, 1–15. [Google Scholar] [CrossRef]
  9. Ding, X.; Niu, X.; Pei, Q.; Huang, S.; Zhang, Y.; Zhang, C. Stability of large underground caverns excavated in layered rock masses with steep dip angles: A case study. Bull. Eng. Geol. Environ. 2019, 78, 5101–5133. [Google Scholar] [CrossRef]
  10. Liang, Z.; Xue, R.; Xu, N.; Dong, L.; Zhang, Y. Analysis on microseismic characteristics and stability of the access tunnel in the main powerhouse, Shuangjiangkou hydropower station, under high in situ stress. Bull. Eng. Geol. Environ. 2020, 79, 3231–3244. [Google Scholar] [CrossRef]
  11. Li, X.; Chen, J.; Ma, C.; Huang, L.; Li, C.; Zhang, J.; Zhao, Y. A novel in-situ stress measurement method incorporating non-oriented core ground re-orientation and acoustic emission: A case study of a deep borehole. Int. J. Rock Mech. Min. Sci. 2022, 152, 105079. [Google Scholar] [CrossRef]
  12. Li, Z.; Liu, H.; Dai, R.; Su, X. Application of numerical analysis principles and key technology for high fidelity simulation to 3-D physical model tests for underground caverns. Tunn. Undergr. Space Technol. 2005, 20, 390–399. [Google Scholar] [CrossRef]
  13. Zhu, W.; Zhang, Q.; Zhu, H.; Li, Y.; Yin, J.; Li, S.; Sun, L.; Zhang, L. Large-scale geomechanical model testing of an underground cavern group in a true three-dimensional (3-D) stress state. Can. Geotech. J. 2010, 47, 935–946. [Google Scholar] [CrossRef]
  14. Zhu, W.; Li, Y.; Li, S.; Wang, S.; Zhang, Q. Quasi-three dimensional physical model tests on a cavern complex under high in-situ stresses. Int. J. Rock Mech. Min. Sci. 2011, 48, 199–209. [Google Scholar]
  15. Sagong, M.; Park, D.; Yoo, J.; Lee, J. Experimental and numerical analyses of an opening in a jointed rock mass under biaxial compression. Int. J. Rock Mech. Min. 2011, 48, 1055–1067. [Google Scholar] [CrossRef]
  16. Lin, P.; Liu, H.; Zhou, W. Experimental study on failure behaviour of deep tunnels under high in-situ stresses. Tunn. Undergr. Space Technol. 2015, 46, 28–45. [Google Scholar] [CrossRef]
  17. Chen, K. Research on Failure Evolution and Control Mechanism of Surrounding Rock of Deep Roadways and Its Application; China University of Mining and Technology: Xuzhou, China, 2009. (In Chinese) [Google Scholar]
  18. Zhu, G.Q.; Feng, X.T.; Zhou, Y.Y.; Li, Z.W.; Fu, L.J.; Xiong, Y.R. Physical Model Experimental Study on Spalling Failure Around a Tunnel in Synthetic Marble. Rock Mech. Rock Eng. 2020, 53, 909–926. [Google Scholar] [CrossRef]
  19. Zhang, Q.; Liu, C.; Duan, K.; Zhang, Z.; Xiang, W. True three-dimensional geomechanical model tests for stability analysis of surrounding rock during the excavation of a deep underground laboratory. Rock Mech. Rock Eng. 2020, 53, 517–537. [Google Scholar] [CrossRef]
  20. Zhu, Q.; Li, T.; Ran, J.; Du, Y.; Zhang, H.; Jiang, H. Model test on creep deformation and failure characteristics of soft rock roadways. Eng. Fail. Anal. 2022, 141, 106670. [Google Scholar] [CrossRef]
  21. Gong, F.Q.; Si, X.F.; Li, X.B.; Wang, S.Y. Experimental investigation of strain rockburst in circular caverns under deep three-dimensional high-stress conditions. Rock Mech. Rock Eng. 2019, 52, 1459–1474. [Google Scholar] [CrossRef]
  22. Zhang, Q.Y.; Zhang, Y.; Duan, K.; Liu, C.C.; Miao, Y.S.; Wu, D. Large-scale geo-mechanical model tests for the stability assessment of deep underground complex under true-triaxial stress. Tunn. Undergr. Space Technol. 2019, 83, 577–591. [Google Scholar] [CrossRef]
  23. Jiang, J.; Feng, X.-T.; Yang, C.; Su, G. Failure characteristics of surrounding rocks along the radial direction of underground excavations: An experimental study. Eng. Geol. 2021, 281, 105984. [Google Scholar] [CrossRef]
  24. Eberhard, T. Numerical modelling of three-dimension stress rotation ahead of an advancing tunnel face. Int. J. Rock Mech. Min. Sci. 2001, 38, 499–518. [Google Scholar] [CrossRef]
  25. Cai, M.; Kaiser, P. Assessment of excavation damaged zone using a micromechanics model. Tunn. Undergr. Space Technol. 2005, 20, 301–310. [Google Scholar] [CrossRef]
  26. Chen, Y.-F.; Zheng, H.-K.; Wang, M.; Hong, J.-M.; Zhou, C.-B. Excavation-induced relaxation effects and hydraulic conductivity variations in the surrounding rocks of a large-scale underground powerhouse cavern system. Tunn. Undergr. Space Technol. 2015, 49, 253–267. [Google Scholar] [CrossRef]
  27. Meng, Q.; Han, L.; Xiao, Y.; Li, H.; Wen, S.; Zhang, J. Numerical simulation study of the failure evolution process and failure mode of surrounding rock in deep soft rock roadways. Int. J. Rock Mech. Min. Sci. 2016, 26, 209–221. [Google Scholar] [CrossRef]
  28. Chen, L.; Jin, A.; Wu, S.; Chu, C.; Li, X. Numerical study on spalling failure of rock surrounding deep buried tunnel based on DEM. Comput. Geotech. 2022, 145, 104653. [Google Scholar] [CrossRef]
  29. Jiang, Y.; Zhou, H.; Lu, J.; Gao, Y.; Zhang, C.; Chen, J. Analysis of Stress Evolution Characteristics during TBM excavation in Deep Buried Tunnels. Bull. Eng. Geol. Environ. 2019, 78, 5177–5194. [Google Scholar] [CrossRef]
  30. Zhou, H.; Gao, Y.; Zhang, C.; Yang, F.; Hu, M.; Liu, H.; Jiang, Y. A 3D model of coupled hydro-mechanical simulation of double shield TBM excavation. Tunn Undergr Space Technol. 2018, 71, 1–14. [Google Scholar] [CrossRef]
  31. Qi, C.Z.; Qian, Q.H.; Wang, M.Y.; Luo, J. Advance in investigation of zonal disintegration phenomenon. J. PLA Univ. Sci. Technol. (Nat. Sci. Ed. ) 2011, 12, 472–479. (In Chinese) [Google Scholar]
  32. Qian, Q.H.; Li, S.C. A Review of research on zonal disintegration phenomenon in deep rock mass engineering. Chin. J. Rock Mech. Eng. 2008, 27, 1278–1284. (In Chinese) [Google Scholar]
  33. Zhou, H.; Jiang, Y.; Lu, J.; Gao, Y.; Chen, J. Development of a hollow cylinder torsional apparatus for rock. Rock Mech. Rock Eng. 2018, 51, 3845–3852. [Google Scholar] [CrossRef]
Figure 1. Model diagram [29].
Sustainability 15 00381 g001
Figure 2. Distribution of surrounding rock stress state along the excavation direction in tunnel vault with different calculation schemes.
Sustainability 15 00381 g002
Figure 3. Distribution of surrounding rock stress state along the depth direction in tunnel vault with different calculation schemes.
Sustainability 15 00381 g003
Figure 4. Distribution of surrounding rock plastic zone in different calculation schemes.
Sustainability 15 00381 g004aSustainability 15 00381 g004b
Figure 5. Variation curve of the stress state parameters of surrounding rock along the depth direction under various calculation schemes: (a) In-situ stress direction; (b) Rockmass type; (c) Tunnel buried depth; (d) Lateral pressure coefficient.
Sustainability 15 00381 g005
Figure 6. Stress path of surrounding rock in different regions: (a) The stress path in scheme 1; (b) The stress path in scheme 3; (c) The stress path in scheme 6; (d) The stress path in scheme 8.
Sustainability 15 00381 g006aSustainability 15 00381 g006b
Figure 7. Evolution law of stress path of surrounding rock in different regions: (a) stress mutation zone; (b) stress disturbance zone.
Sustainability 15 00381 g007
Figure 8. Distribution of the range coefficient of influencing factors on the stress state of the surrounding rock.
Sustainability 15 00381 g008
Table 1. Basic parameters of surrounding rock [29,30].
Parameters of Surrounding RockValue
Young’s modulus, E/GPa18.9
Poisson’s ratio, υ0.23
Intact cohesion, c/MPa15.6
Intact friction angle, φi25.8
Uniaxial compression strength, σc/MPa49.7
Tensile strength, σt/MPa1.5
Density, ρ/kg/m32630
Residual cohesion, cres/MPa7.4
Residual friction angle, φres39
Equivalent plastic strain threshold for cohesion,/MPa0.45
Equivalent plastic strain threshold for friction angle, /°0.9
The internal variable corresponding to the residual internal friction, κ⁠φ0.6
Table 2. Model parameters of different calculation schemes.
GroupFactorSchemeModel Parameters
In-situ stress direction1along the Z direction ( σ 1 )
2along the X direction ( σ 1 )
3along the Y direction ( σ 1 )
Rockmass type1Ⅰ~Ⅱ
4
5Ⅱ~Ⅲ
Tunnel buried depth12500 m
61000 m
73000 m
Lateral pressure coefficient1λx = λy = 0.78
8λx = λy = 0.5
9λx = λy = 1.5
Disclaimer/Publisher’s Note: The statements, opinions and data contained in all publications are solely those of the individual author(s) and contributor(s) and not of MDPI and/or the editor(s). MDPI and/or the editor(s) disclaim responsibility for any injury to people or property resulting from any ideas, methods, instructions or products referred to in the content.

