Article

Behavioural Change as a Domestic Heat Pump Performance Driver: Insights on the Influence of Feedback Systems from Multiple Case Studies in the UK

1
UCL Institute for Environmental Design and Engineering, London WC1H 0NN, UK
2
UCL Energy Institute, London WC1B 5BP, UK
*
Author to whom correspondence should be addressed.
Sustainability 2022, 14(24), 16799; https://doi.org/10.3390/su142416799
Submission received: 1 October 2022 / Accepted: 7 December 2022 / Published: 14 December 2022
(This article belongs to the Special Issue Energy Efficient Domestic Appliances and Smart Lighting Technologies)

Abstract

:
Heat pumps (HPs) are seen as an increasingly important technology able to contribute significantly towards the decarbonisation of the domestic stock in the UK. However, there appears to be a performance gap between predicted and real-life HP performance, with several studies highlighting the need to include the HP’s interaction with users when examining their performance. This study examines the role of user behaviour in mitigating this performance gap from a systems perspective. A sample of 21 case studies was selected from 700 domestic HPs monitored across the UK via the government’s Renewable Heat Premium Payment Scheme for the collection of qualitative and quantitative socio-technical data. The application of systems thinking facilitated the identification of the underlying interactions between the HP system and its users. The systems analysis revealed that HP performance relies on complex socio-technical system interactions, including behavioural patterns, and that enabling feedback information processes can have a significant impact on user behaviour. The study enabled a deeper perspective on performance influencers relating to behavioural patterns and achieved new insights into the requirements for well-performing HPs. These findings have important implications for policy makers, installers and manufacturers of HP systems and their users.

1. Introduction

The heat pump (HP) can utilise decarbonised electricity to generate multiple times more heat than electricity input. HPs are therefore a key technology [1,2,3] to help deliver the UKs legally binding net-zero emissions target by 2050 [4]. The Climate Change Committee has called for an uptake of 19 million air source heat pumps (ASHPs) and ground source heat pumps (GSHPs) by 2050 [1] and the UK government has committed to the annual deployment of 600,000 HPs in UK houses by 2028 [2]. By 2033, all buildings are expected to be energy efficient, all boiler replacements to be made with low-carbon technologies and the industry is expected to be able to support the installation of over a million domestic HPs annually [1]. Policy is currently focusing largely on the scale-up of the UK HP market, e.g., by offering financial incentives and raising consumer awareness, to help achieve the 2035 carbon budget [3]. However, there seems to be large potential to improve their performance [5].
HPs are a complex but promising technology that impacts the two major forms of energy use in homes, i.e., space heating (SH) and domestic hot water (DHW). They operate by transferring heat from one environment (source) to another (sink) rather than generating heat directly, and thus deliver considerably more heat than the energy required to drive the heat from the source to the sink. The HP working principle relies on the pressure-temperature relationship of a refrigerant, which flows through an evaporation-condensation cycle. The more energy a HP delivers to the heat sink in relation to the work required for the transfer, the more efficient the HP is [6,7]. To maximise efficiency, SH flow temperatures should generally be set at the minimum comfortable temperature allowed by the emitter system [7] while DHW flow temperatures tend to be more standardised and require Legionella control. However, real-life performance relies on a wide range of influencing parameters, including building fabric efficiency, operation patterns and installation quality [8].
HP performance is a representation of the heat output to energy input ratio [9,10]. Its simplest measure is the steady-state coefficient of performance (COP), which only takes into consideration the energy consumed by the compressor and fans, and is typically employed in testing chambers. The seasonal performance factor (SPF) is project-specific [8] and takes into consideration the temperature variation of the heat source. Different system boundaries are often used in calculating the SPF, hence, Zottl et al. [11] set standard boundaries H1–H4 and Gleeson and Lowe [12] set an additional boundary H5, as described in Table 1. These address the need for unified performance reporting through the application of specific boundaries that provide a more reliable comparison of output across field trials [12,13].
Until recently there had been little publicly available data on the performance of HPs in the UK. The Energy Saving Trust (EST) conducted the first large-scale domestic HP field trial in 2009, involving 56 ASHPs and 27 GSHPs [14]. The largest monitored study of both ASHPs and GSHPs in the UK commenced in 2011 was the Renewable Heat Premium Payment (RHPP) field trial, with 699 HPs in total [5]. Both the EST and the RHPP field trials reported a highly variable performance, however as shown in Figure 1, the RHPP performance appears improved in comparison to the EST field trial results, both for ASHPs and GSHPs. Table 2 summarises the largest UK domestic field trials to date alongside their main findings. Most field trials have focused on the performance of HPs in terms of heating provision, running cost and/or energy and carbon savings.
Table 2. The largest domestic air source heat pump (ASHP) and ground source heat pump (GSHP) field trials in the UK.
StudyDescriptionMain Findings
RHPP metering programme2011–2014 monitoring of approximately 700 ASHPs and GSHPs installed under the RHPP scheme to provide insights into their performance and inform the renewable heat policy development.HP performance was found to be highly variable and complex. It was found to be sensitive to its environment, at the building, technical installation and occupant levels. Control optimisation was suggested to avoid the extensive use of resistance heating [5].
CustomerLed Network Revolution Project2013–2014 monitoring to investigate electricity use patterns in 381 domestic ASHP installations.HPs are likely to introduce a significant burden on the electricity grid that could be eased by diversifying heat loads. Users perceived HPs as a complex technology they poorly understand [15].
EST field trial (phases 1
and 2)
Phase 1: Detailed analysis of 56 ASHPs and 27 GSHPs monitored in 2009–2010 on a site-by-site basis [14]. In-depth user surveys from 78 sites to investigate characteristics, behaviour and satisfaction of owner occupiers and social tenants and Phase 2: 2011–2012 monitoring of 44 sites from phase 1 involving interventions to investigate the performance improvement potential. Phases 1 and 2: Follow up research on all field trial data to improve HP installation guidelines.Phase 1: Highly variable performance across sites. Performance can be improved with improved installation practices. Higher efficiencies were linked to better understanding of the system and more continuous operation [16].
Phase 2: Reduced post-intervention efficiencies were often attributed to higher domestic hot water (DHW) heating proportion and extensive use of the backup resistance heater for space heating (SH) or DHW purposes (e.g., due to lack of clarity on “winter” setting that activates resistance heating and sterilisation control patterns) [17]. Phases 1 and 2: Well designed, installed, commissioned and operated HPs can perform extremely well in the UK. High performing HPs may be linked to various control strategies [18].
ETI Micro DE field trial2010–2011 monitoring of 4 ASHPs and 4 GSHP to investigate the potential for energy and carbon reduction through distributed energy technologies [19].Most HPs were underperforming, possibly due to the extensive use of the backup resistance heater, among other reasons. Operating patterns often stemmed from experience with previous heating systems.
Stafford and Lilley GSHP trial2009–2010 monitoring from 10 similar GSHP installations in social houses to explore performance prediction potential.Performance prediction in similar HP case studies is possible providing detailed monitoring of sample installations and limited data gathering for the remainder [20].
Westfield ASHP trial2008–2009 monitoring of 8 retrofit ASHPs to investigate performance variations.Coefficient of Performance (COP) was found to be closely related to external temperature variations as well as occupant behaviour in relation to HP controls, internal gains and ventilation patterns [21,22].
Scottish Renewables Heating pilot2006–2008 pilot of 56 ASHPs and 27 GSHPs to investigate the impact of renewable technologies on fuel poverty.High-performance variation even between similar properties could be due to variations in building fabric performance and occupant behaviour [23].
Harrogate GSHP pilot2007–2011 monitoring of 10 GSHPs in retrofitted social housing occupied by older people.Fuel poverty can be tackled, providing HPs are appropriately designed/installed and users educated to operate the system efficiently [24,25].
Figure 1. Comparative seasonal performance factors (SPF) of ASHPs and GSHPs between European and UK field trials, i.e., the Energy Saving Trust (EST) and Renewable Heat Premium Payment (RHPP) field trials [5,26].
Sustainability 14 16799 g001
Based on the UK EST field trial data [14], HP efficiency appeared to be inferior to that of other European countries [20,26,27], while the more recent RHPP field trial data [5] suggests some UK HPs can perform as well as in other European countries (see Figure 1). However, trial outputs are not completely comparable as their SPF calculation is based on different system boundaries [12]. Efficiency calculation was performed at boundary level H4 and H5 for the RHPP and EST field trials while the German and Swiss field trials took into consideration only the resistance heater and buffer vessel, respectively, in addition to the HP unit and source fans/pumps. Nonetheless, the impact of system boundary on SPF prediction for the EST field trial is expected to be small, i.e., approximately 0.1 [26]. Other likely causes of discrepancy lie in differences in climate (with the British climate being less cold but more humid than most northern European countries [28,29]) building types and thermal qualities [16,30], installer experience [30], SH/DHW proportion [26] and user behaviour [30]. Switzerland, in particular, has invested in end-user education, e.g., in relation to optimum operation whereas EST trial users tended to utilise traditional heating system operational patterns linked to intermittent heating and high flow temperatures [26]. It is also worth noting that the Swiss field trial took place at least one decade earlier than the RHPP and German field trials and thus the SPF of the Swiss HPs are likely to have improved further.
The performance gap between design calculation predictions and on-site performance is partly attributed to poor HP installation and incorrect assumptions about how they are used in practice. Literature places particular emphasis on the need for a solid skills base through improved vocational training to ensure appropriate installation, sizing, setup and controls, which are key to efficiency optimisation [12,30,31]. Several studies have also highlighted the need to examine HP performance from a wider perspective, including environmental and building characteristics, as well the variable/unpredictable nature of user behaviour [6,7,32].
From a behavioural point of view, the literature indicates that user understanding is a strong influencer of HP efficiency. HPs generally present a higher complexity than traditional heating systems, and the higher the complexity, the lower the user understanding [16]. In the EST field trial, higher efficiencies were linked to the simplest designs and controls [16] and there is wider evidence suggesting that perceived complexity may lead to suboptimal control of a HP [15], particularly in low-income housing of older occupants [27,33]. The EST field trial HPs owned by social tenants also presented lower efficiencies in comparison to those of owner occupiers, with the latter showing a higher understanding of the system [16]. Owner occupier systems were also found to be operated more continuously. In line with this, the Customer-Led Network Revolution project revealed that the lack of user understanding in relation to technical and operation aspects, the hesitance to interact with the HP’s controller, as well as the absence of incentives directing towards appropriate operational patterns may have led to suboptimal HP operation [15].
The user’s experience with the previous heating systems has also been identified as a performance influencing parameter [19,30], highlighting the importance of end-user education. The EST trial users were found to operate HPs in the same way they did with their previous heating systems, i.e., intermittently and at high temperatures [26]. The Microgeneration Certification Scheme (MCS) Best Practice Guide also stresses the need to educate occupants who, for example, should be made aware that a dramatic change of the temperature set point will not result in a swift system response that is typical with traditional heating systems, but will rather lead a gradual build-up of excessive room temperature [8]. In addition, Gram-Hanssen et al. [32] stressed that the competencies required to run a HP efficiently should extend to the household as a whole. Indeed, the level of household competences could link to a wide range of parameters influencing the performance of HPs, including building fabric heat loss (e.g., unnecessary window opening may lead to excessive compressor cycling and high flow temperature requirements [8,16,20,26]).
As with many other energy-efficient technologies, the HP rebound effect has also been found to feed the performance gap, with a significant part of its theoretical savings transforming to increased comfort [32,34,35]. While a more continuous operation, linked to a temporal rebound [35], tends to be related to higher efficiencies, there is a trade-off between improved efficiency and additional heat losses resulting from maintaining higher indoor temperatures for longer [36]. Thus, it is not certain which is the most energy efficient practice for HPs [35]. In support of this, the EST field trial findings showed that high-performing HPs can be linked to different control strategies [18].
Overall, existing studies examining performance from a wider perspective, usually included users, however both the qualitative and quantitative data collected presented limited capacity in uncovering the range of behaviour-related parameters influencing HP performance and, thus, the insights offered in terms of practical solution strategies was also limited. Given the important role of HPs in a net-zero future and the potential to improve their performance through behaviour-related interventions, there is a clear need for a detailed investigation of the interrelationships between user behaviour and HP efficiency. The aim of this study is to address this literature gap by focusing on the role of users and how performance could be improved from a systems perspective. This paper was undertaken in the specific context of domestic HPs monitored under the RHPP field trial [5]. It intended to gain a deeper perspective on behavioural influencers and achieve new insights into the requirements for well-performing HPs in the UK through the in-depth investigation of case studies.
This manuscript is based on the author’s PhD thesis. We refer the reader to that document [37] for a more detailed exposition.

2. Materials and Methods

This study investigated the socio-technical drivers influencing the performance of domestic ASHPs and GSHPs in the UK, based on a sample of 21 case studies. Employing multiple-case studies enabled the unique context of each case to be taken into consideration. The findings of multiple cases were grouped to examine the strength of the underlying relationships identified in the sample and explore contrasting perspectives. This approach does not allow generalisation of findings, but it allows a deeper understanding of the subject matter by providing evidence on the existence of complex mechanisms and unchartered phenomena. Thus, the resulting theory could be utilised to challenge established practices and inform future research.

2.1. Case Study Sample and Recruiting

The sample of 21 case studies was selected from 699 domestic HPs monitored across the UK via the government’s RHPP scheme for the collection of qualitative and quantitative socio-technical data. The site visits were implemented as part of the RHPP project and, thus, the decision to involve 20 participating sites was taken jointly by the Department for Business, Energy and Industrial Strategy (BEIS), formerly known as the Department of Energy and Climate Change (DECC), and the RHPP research team, considering time and budget restrictions. An additional case study was utilised as a pilot. The case study sample was not meant to be statistically representative of the overall RHPP sample but to allow investigation primarily of those cases that reside at the two ends of the performance spectrum. The primary metric for the selection of case studies was their SPF at boundary level H3. As shown in Figure 2, the recruitment approach was based on an opt-in basis, with the occupants of 351 sites [38] being invited to take part in the study. The invitation process and the sample inclusion/exclusion criteria are described in detailed elsewhere [38].
As shown in Figure 3, the final selection of the 21 case studies (14 owner-occupied and 7 social houses) covered the whole SPF distribution range but targeted primarily those HPs presenting extreme SPFs. The final sample yielded a good geographical distribution in relation to the population that participated in the RHPP field trial, and the climate conditions in the UK [28]. It also covered: owner occupiers/social tenants, ASHPs/GSHPs, and a variety of heat emitters (primarily radiators and underfloor heating). Excluding newbuilds, the displaced fuel was oil, and occasionally electricity or gas.

2.2. The Mixed Method Approach

The data collection was based on a mixed method approach that involved the collection, analysis and integration of both quantitative and qualitative data. Since the complex reality in which HP technology is applied involves both social and technical aspects, their influence cannot be understood when examined in isolation [38]. The mixed-methods approach enabled a more comprehensive understanding of each HP’s performance within its real-life environment by building on the strengths and minimising the weaknesses of single approaches.
The quantitative data from the RHPP monitoring study [39] were used as the basis for the selection of the 21 case studies [38]. They also complemented the analysis and interpretation of the qualitative data from the interviews and site surveys, described below. The monitored variables were metered for a period of between 1 and 3 years (Nov 2011–Mar 2015), including electricity, heat and flow temperatures recordings every 2 min at various parts of the HP system, as well as installation schematics, MCS certificates and installer photos. Following the data cleaning, filtering and statistical analysis performed by the RHPP team on the 21 case studies [5], their monitoring profiles were visually inspected as part of this work. The visual observation of the time-series complemented the statistical analysis to enable a better understanding of their quality and validity on an individual basis. It also revealed site-specific data patterns and arbitrary structures that could not be identified through the statistical analysis alone. This was in part due to the significant amount of implausible data that remained after the data cleaning and filtering process, e.g., data spikes, and invalid or missing data [5]. However, on several occasions, the data revealed that the observed ‘anomalies’ related to unexpected system features or shed light on aspects of the HP operation that the users were completely unaware of. In other occasions, the data agreed with the findings from the qualitative data, such as the users’ narrative. As shown in Table 3, following the visual inspection, approximately half of the case study SPF estimations obtained through the statistical analysis were deemed to be unreliable.
The qualitative data collection process during the site visits involved in-depth interviews and direct observational methods. The interviews and site investigations took place in winter 2015/16, under the RHPP project [38], within approximately 2 months and lasted between 2 and 3 h in each case. However, the RHPP case study work that concluded in 2017 was limited due to time and resource restrictions. The field data was methodically organised and fully analysed for the purposes of a PhD project [37] only after the end of the RHPP project. This provided the opportunity for a deeper and more extensive understanding of the complexity underlying HP performance. The semi-structured interview guide and site investigation routine were jointly designed by the RHPP project team and BEIS and informed by existing post-occupancy evaluation guides [40]. The use of semi-structured interviews, including both open-ended and fixed-response questions, ensured that it was possible to adapt the interview to the unique nature of each case and, thus, bring out any interesting stories and precedents [38].

2.3. Data Accuracy and Triangulation

The site visits yielded a wide range of qualitative data that were collected through householder interviews, as well as visual/thermal photographic evidence, direct observations, measurements/sketches of the buildings and the HP system and various documentation provided by householders (bills, architectural drawings, etc.). Obtaining data through different sources enabled triangulation. Using a variety of methods to collect data on the same topic increased the validity of results and reduced bias by identifying aspects of complex phenomena more accurately, since they were approached from different perspectives [41]. Throughout the data cleaning, organisation and analytical process, the four basic triangulation types proposed by Denzin [41] were exploited, i.e., between data, investigators, theories and methods. The active involvement of researchers from different disciplines as part of the RHPP project enabled multiple perspectives on the interpretation of a single set of data, known as theory triangulation.

2.4. Inductive Coding and Systems Thinking Analysis

The raw data alongside the researchers’ field notes and images were methodically organised, filtered and corroborated pre-site visit material (monitored data and metadata) to create a structure database or master matrix facilitating the data analysis. The recorded interviews were transcribed in an abridged verbatim format. The themes identified were eventually fed into a complex systems thinking diagram that facilitated the understanding of various variable interactions in relation to the research questions of this study. The data were initially grouped under the six following areas: (a) social information and decision making, (b) dwelling information, (c) technical information, (d) control and usage of heating systems, (e) overall energy cost and (f) occupant perception on comfort and satisfaction. The initial coding framework was based on these predetermined codes. Subsequent coding was done line-by-line using the NVivo qualitative data analysis software [42]. Finally, 16 main themes were identified through thematic analysis, including several descriptive and analytical sub-codes (up to three levels deep) that facilitated the transition from people’s descriptive experiences to their analytical/inductive interpretation. The study adopted an inductive coding approach that served the formulation of a systems thinking integrating framework.
The application of systems thinking to the analysis of the socio-technical data facilitated the identification of the underlying complex interactions between the HP system and its users. This took the form of causal loop diagrams (CLD), implemented in Vensim software [43]. The underlying principles and conventions of CLDs as a systems thinking tool are described in detail by Sterman [44,45]. In this study, systems thinking facilitated (a) a better understanding of the complex interrelationships between the HPs and the wider environment they interact within, (b) hypothesizing/theorizing about the causes of HP system-wide dynamics, and (c) the identification of important behavioural feedback structures that are thought to be responsible for the poor performance of HPs in the UK.
The inductive coding and the systems thinking approach are similar in terms of linking and drawing relationships between factors to build theory [46]. Thus, the coding elicited within the themes also served the generation of CLDs through a number of steps similar to those described by [47,48]. In contrast to the initial thematic analysis phase, this phase was more aligned with a Grounded Theory approach and involved (a) open coding, (b) axial coding/conceptualisation and (c) selective coding/integration. This final stage utilised selective coding by connecting and integrating all identified categories to generate theory. This required all preliminary CLDs to be merged, utilising implicit structures, i.e., decomposing causal relationship further where required. The core of the systems model (both variables and links between variables) was based on existing literature and considered the relevant thermodynamics and building physics. It was then expanded based on the analysis findings of the data acquired on the 21 case studies. Individual case study based CLDs informed a final cumulative CLD, serving the identification of the most prevalent parameters and relationships. This was formed through an iterative process, where the strength of each theme was addressed by counting the instances of each topic in the case study sample and through their corroboration with literature. Overall, the causal maps distinguished between objective and subjective realities, such as between the actual- and perceived- SH availability. Evidence suggests that the gap between objective and subjective reality can be a source of ineffective decisions, as actors act to change their perceived reality [47]. The CLDs make these mental models explicit in order to improve decision making.

3. Results

The interlinked CLDs depicted in Figure 4 and Figure 5 focus on the interaction of occupants with the HP and reveal that performance relies on a complex socio-technical network of underlying interconnections. Variables and arrows in blue represent the linking points between the two CLDs. The underlined text represents those variables identified via literature review. Table 4 summarises the primary feedback loops depicted in Figure 4 and Figure 5. The CLDs are described in detail in the text below, with variable names in italics and feedback loops in brackets for easy identification.
Even though balancing loops appear to be the predominant type of loop in the causal diagram, there are also several secondary reinforcing loops present. These emerge when putting parts of the system together, i.e., through the interaction between one or more of the primary balancing loops and the indirect paths stemming from the HP operation processes. These technical interactions that are often counterintuitive and not obvious to non-experts are represented by dotted-line arrows in Figure 4.
Considering the most prevalent parameters and relationships of the causal map that influence performance, as identified through the analysis of data of the 21 case studies, their influencing paths meet at two points, i.e., compressor power consumption and heat generation by the HP-incorporated resistance heater, which are explained in detail below:
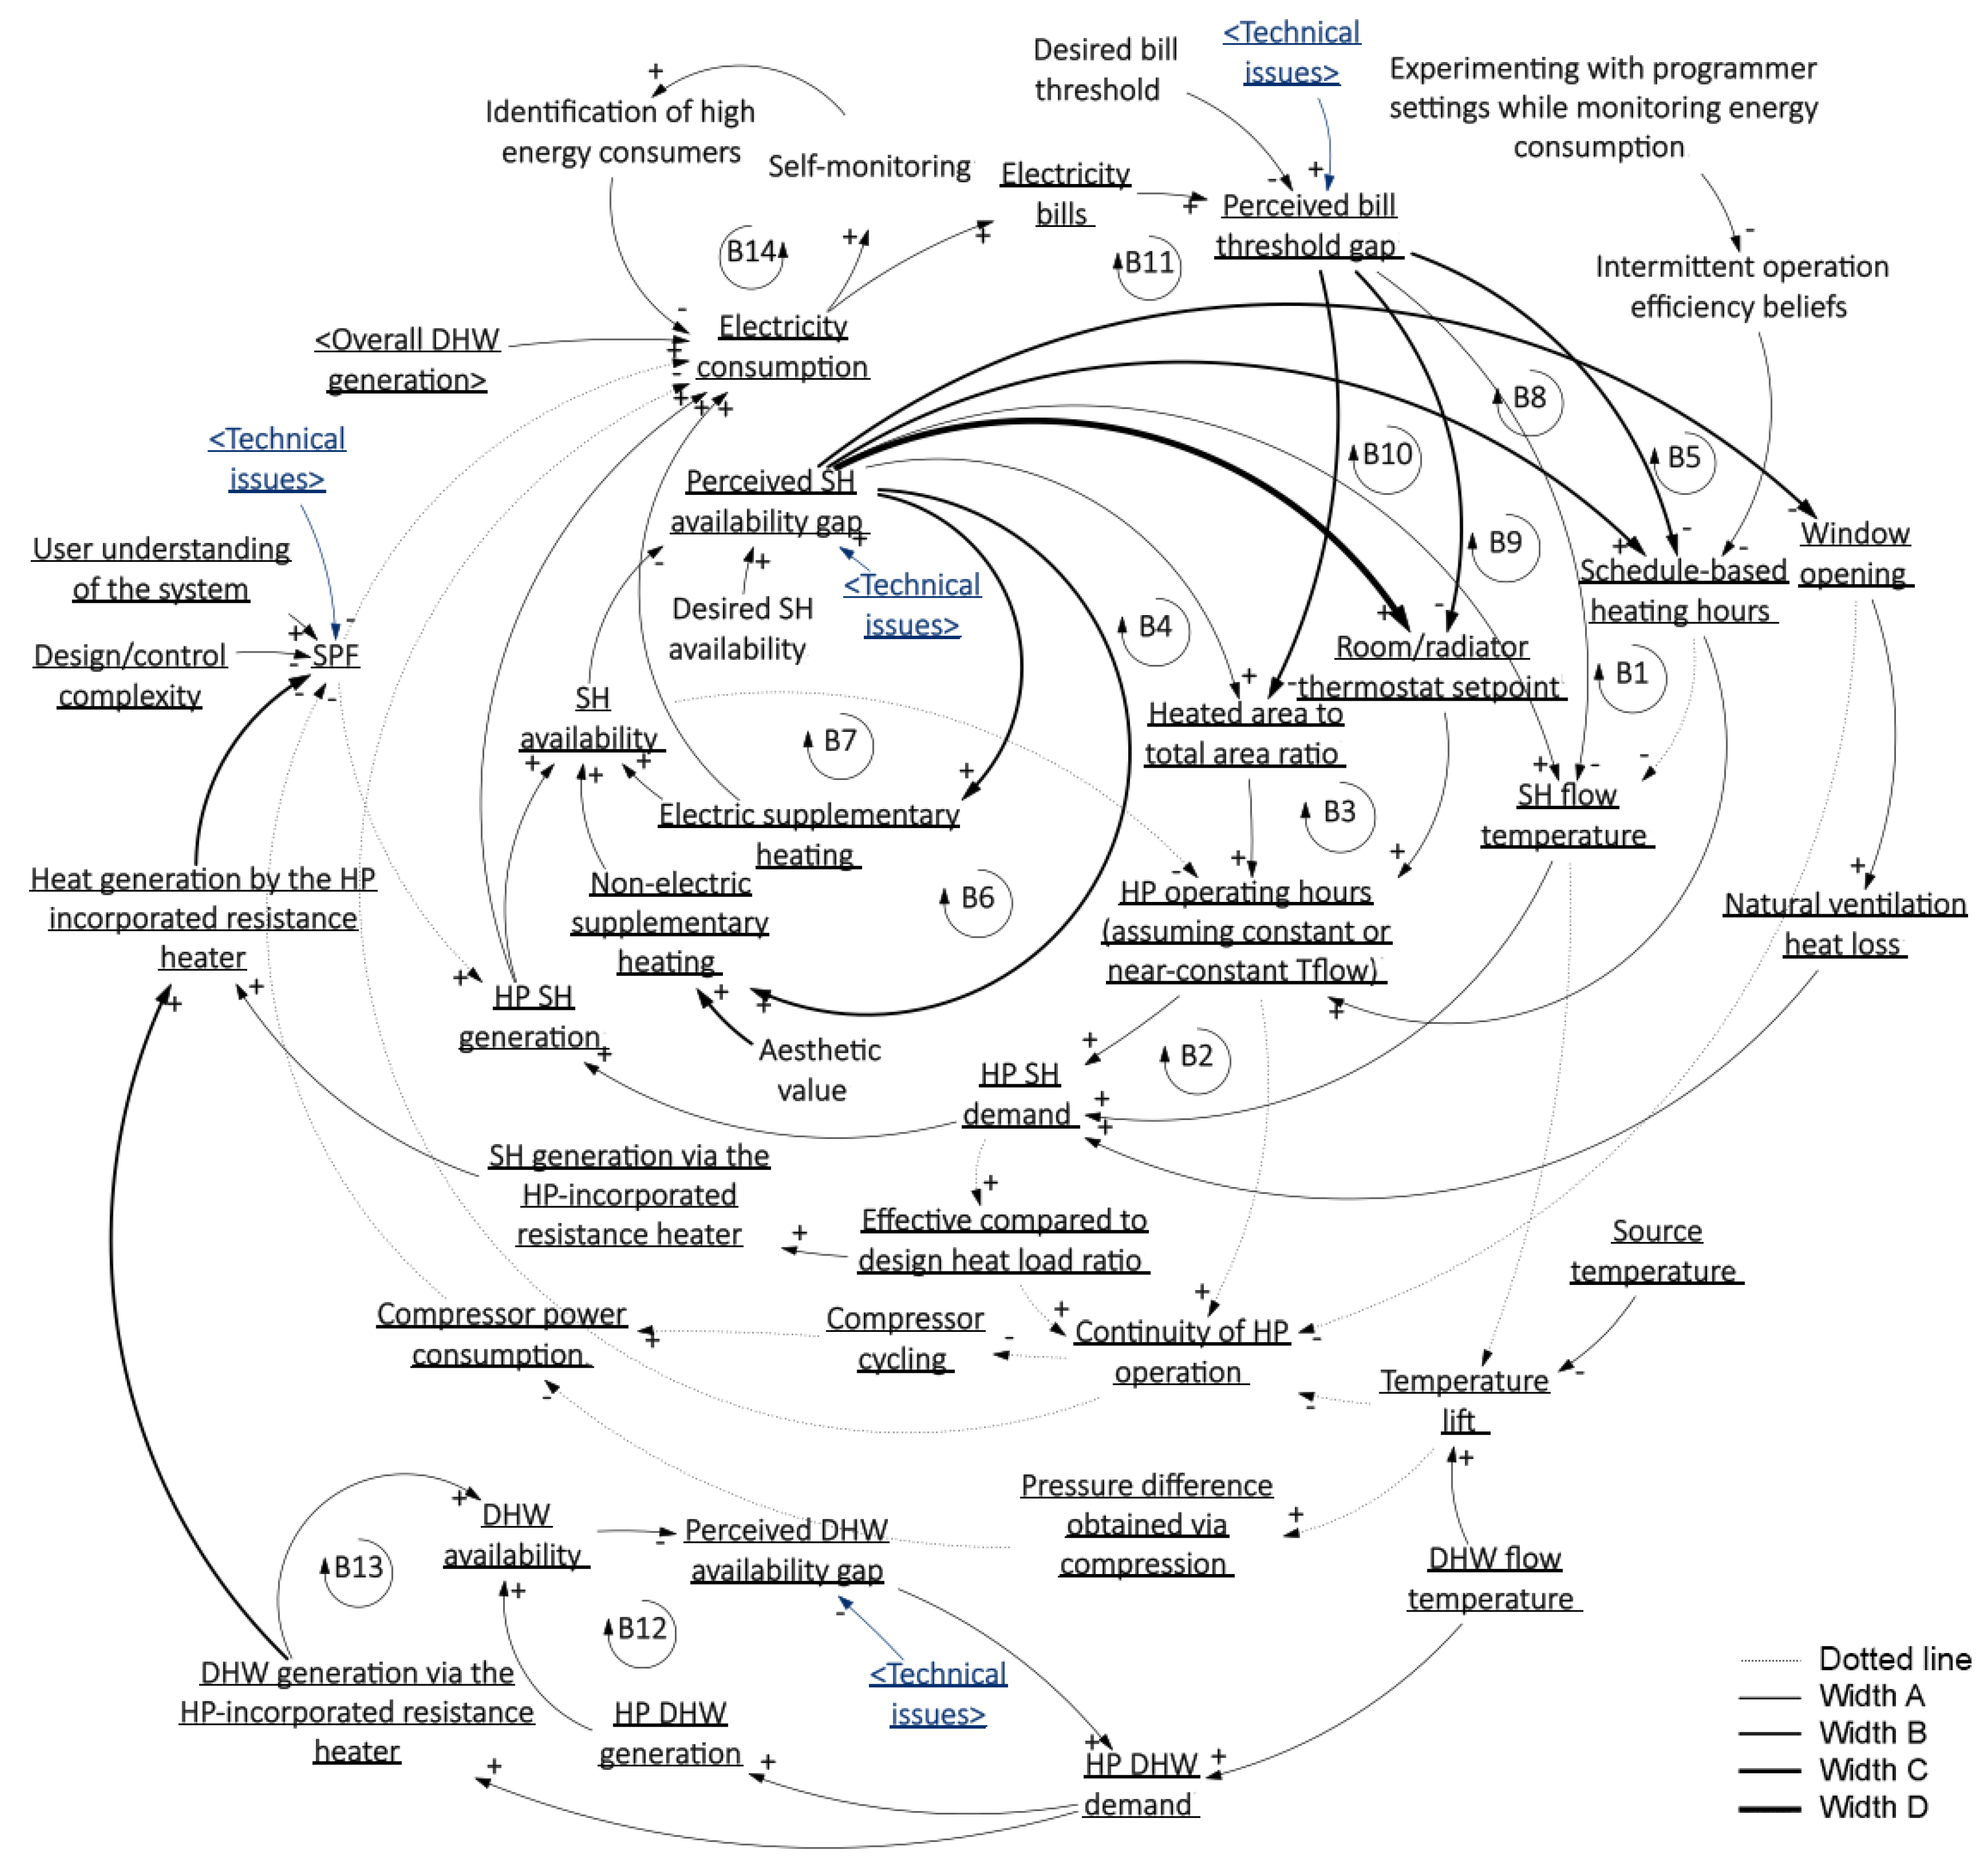
  • Compressor power consumption—There is a wide range of processes that are likely to affect the power consumed by the compressor. These may stem from occupant-related processes (among other reasons) that can significantly alter the HP SH demand in relation to the assumed demand (named effective compared to design heat load ratio for the purposes of the CLD) or interrupt the continuity of HP operation, including adjustments to HP control, extensive use of supplementary heating methods and frequent window opening. Compressor power consumption is directly influenced by compressor cycling and the required pressure difference obtained via compression. The latter depends on the temperature lift, defined as the temperature difference between the source temperature and the sink temperature, i.e., SH flow temperature and/or DHW temperature. The positive link between temperature lift and compressor cycling and temperature lift and the pressure difference obtained via compression represent the positive effect of lower flow temperatures of the system’s SPF. Compressor cycling is also highly dependent on the effective compared to design heat load ratio. Except for the HP-sizing calculations, the latter can also be influenced by occupant behaviour, which can be very different to that assumed during the design stage. A significantly higher or lower HP SH demand can lead to a HP under- or over- sizing effect. This is explained in detail in Table 5.
  • Heat generation by the HP-incorporated resistance heater—The extensive use of any type of a HP-incorporated resistance heater can significantly reduce the HP’s SPF and the monitored data revealed a substantial contribution to heat production, primarily for DHW. Its operation appeared to be regular and lengthy in approximately 35% of the cases. However, their function, operation and existence appeared to be a mystery for many occupants, who were generally unable to tell whether the heat was provided through the refrigeration cycle or the resistance heater. None of them had realised the resistance heater was operating regularly, until it manifested in the form of a significantly higher energy consumption/energy bills. The likely causes were cited as technical problems or an accidental actuation. Other possible triggers could relate to an undersised HP.
The range of actions taken by occupants that are likely to influence compressor power consumption and heat generation by the HP-incorporated resistance heater, as identified in the 21 case studies, are grouped in three categories: actions taken in response to a perceived SH/DHW availability gap, actions taken in response to a perceived bill threshold gap and the self-resolving process of technical issues. These are described in detail below.

3.1. Actions Taken in Response to a Perceived SH and DHW Availability Gap

The perceived SH availability gap is a function of the actual SH availability and the desired SH availability (and similarly for DHW). Of all actions taken by occupants in response to a perceived gap in the SH availability, the adjustment of a room/radiator thermostat setpoint [B3] was by far the most frequently occurring, corresponding to 80% of the case studies. Feedback loops concerning the adjustment of schedule-based heating hours [B1] or the heated area to total area ratio [B4] to meet heating needs seemed to be occasionally activated in 33% of the case studies. Interestingly, experimenting with programmer settings while monitoring energy consumption led to the deconstruction of the occupants’ intermittent operation efficiency beliefs in two cases, whose occupants concluded it is more efficient to run the HP continuously. Balancing loop [B4] appeared to rely predominantly on the occasional increase in the number of occupants (accompanied by an increase of the heated area), and in only a couple of cases on the perceived heat gains by household equipment (accompanied by a decrease of the heated area). The expansion of the heated area was also perceived as a way to reduce the indoor humidity level. SH flow temperature adjustment to meet heating needs [B2] appeared to be the least common control method utilised, which could be due a physical and/or technical difficulty of accessing controls. Social-housing tenants, in particular, were not allowed access to the HP controller and approximately half of the owner occupiers either did not know how to access flow temperature controls or were intimidated by the system’s complexity and any unintended consequences that could arise by such changes. Where SH flow temperature control was utilised, it appeared to be largely associated with the lack of other methods of indoor temperature control (other than thermostatic radiator valves).
In terms of supplementary heating, the occupants’ narrative revealed that approximately 50% of the case studies utilised at least one wood or solid-fuel burner (non-electric supplementary heating [B6]) and 25% some sort of electric supplementary heating [B7]. The adjustment of SH availability through the use of non-electric supplementary heating seems to have been influenced equally by aesthetics and thermal comfort requirements. Window opening [B5] emerged as a cooling-down measure during the heating season in 33% of the cases. The link between the perceived SH availability gap and window opening was further confirmed by the occupants of three cases, who claimed they avoided window opening as a way of keeping their home as warm as possible.
Actions aiming to alter the HP’s DHW production, e.g., in response to a perceived DHW availability gap were rare in the case study sample, as most occupants relied on the DHW pre-set made by the installer. In just three cases, the occupants stated they would occasionally adjust the HP DHW generation in response to a temporary change in the number of occupants. In none of these was it clear to the occupants whether the DHW was produced by the HP [B12] or the HP-incorporated resistance heater [B13].

3.2. Actions Taken in Response to a Perceived Bill Threshold Gap

The difference between the electricity bills and the desired bill threshold is named perceived bill threshold gap. The perceived bill threshold gap was found to be linked to several actions taken by the occupants to moderate their household’s energy consumption. These related predominantly to HP SH control and to a lesser extent to actions limiting the usage of energy consuming appliances other than the HP. Even though the inherent technical and operational principles of a HP are likely to induce a positive temporal and spatial rebound, in the case study sample, more than half the occupants appeared to actively seek to avoid what they perceived as unnecessary energy consumption, predominantly via a negative temporal [B8] and/or spatial rebound [B11], as defined by Winther and Wilhite [35], followed closely by a negative thermostatic temperate rebound [B10]. Flow temperature adjustments [B9] for energy-saving purposes were rarely implemented. Only a few occupants considered parameters, other than the HP, as significantly influencing their electricity bills, e.g., window opening, lights and appliances, and electricity production by renewable energy systems. Since it was impossible for most users to distinguish between the energy consumed and/or produced by individual systems, it is likely that in some cases high household energy consumers might have been concealed.
Identifying high electricity consumption sources is a complicated task for most occupants, especially those without access to dedicated monitoring equipment. This may lead to erroneous assumptions on what might be the reason for the household’s high energy consumption and to subsequent actions that may increase energy consumption even further. This seems to have been the case on at least two occasions, when the occupants dramatically eliminated the HP heat generation [B8,B10,B11] while at the same time increasing the use of supplementary heating [B6,B7]. Self-monitoring, with or without the help of dedicated sensor readings (e.g., through bill surveillance), appeared to have assisted the reduction of energy consumption [B14] in four cases, either by identifying energy-intensive equipment or by improving HP controls. Without the tools supporting the recognition and moderation of energy-intensive processes by either occupants or experts, high electricity bills can trigger occupant responses that may eventually reinforce the initial problem.

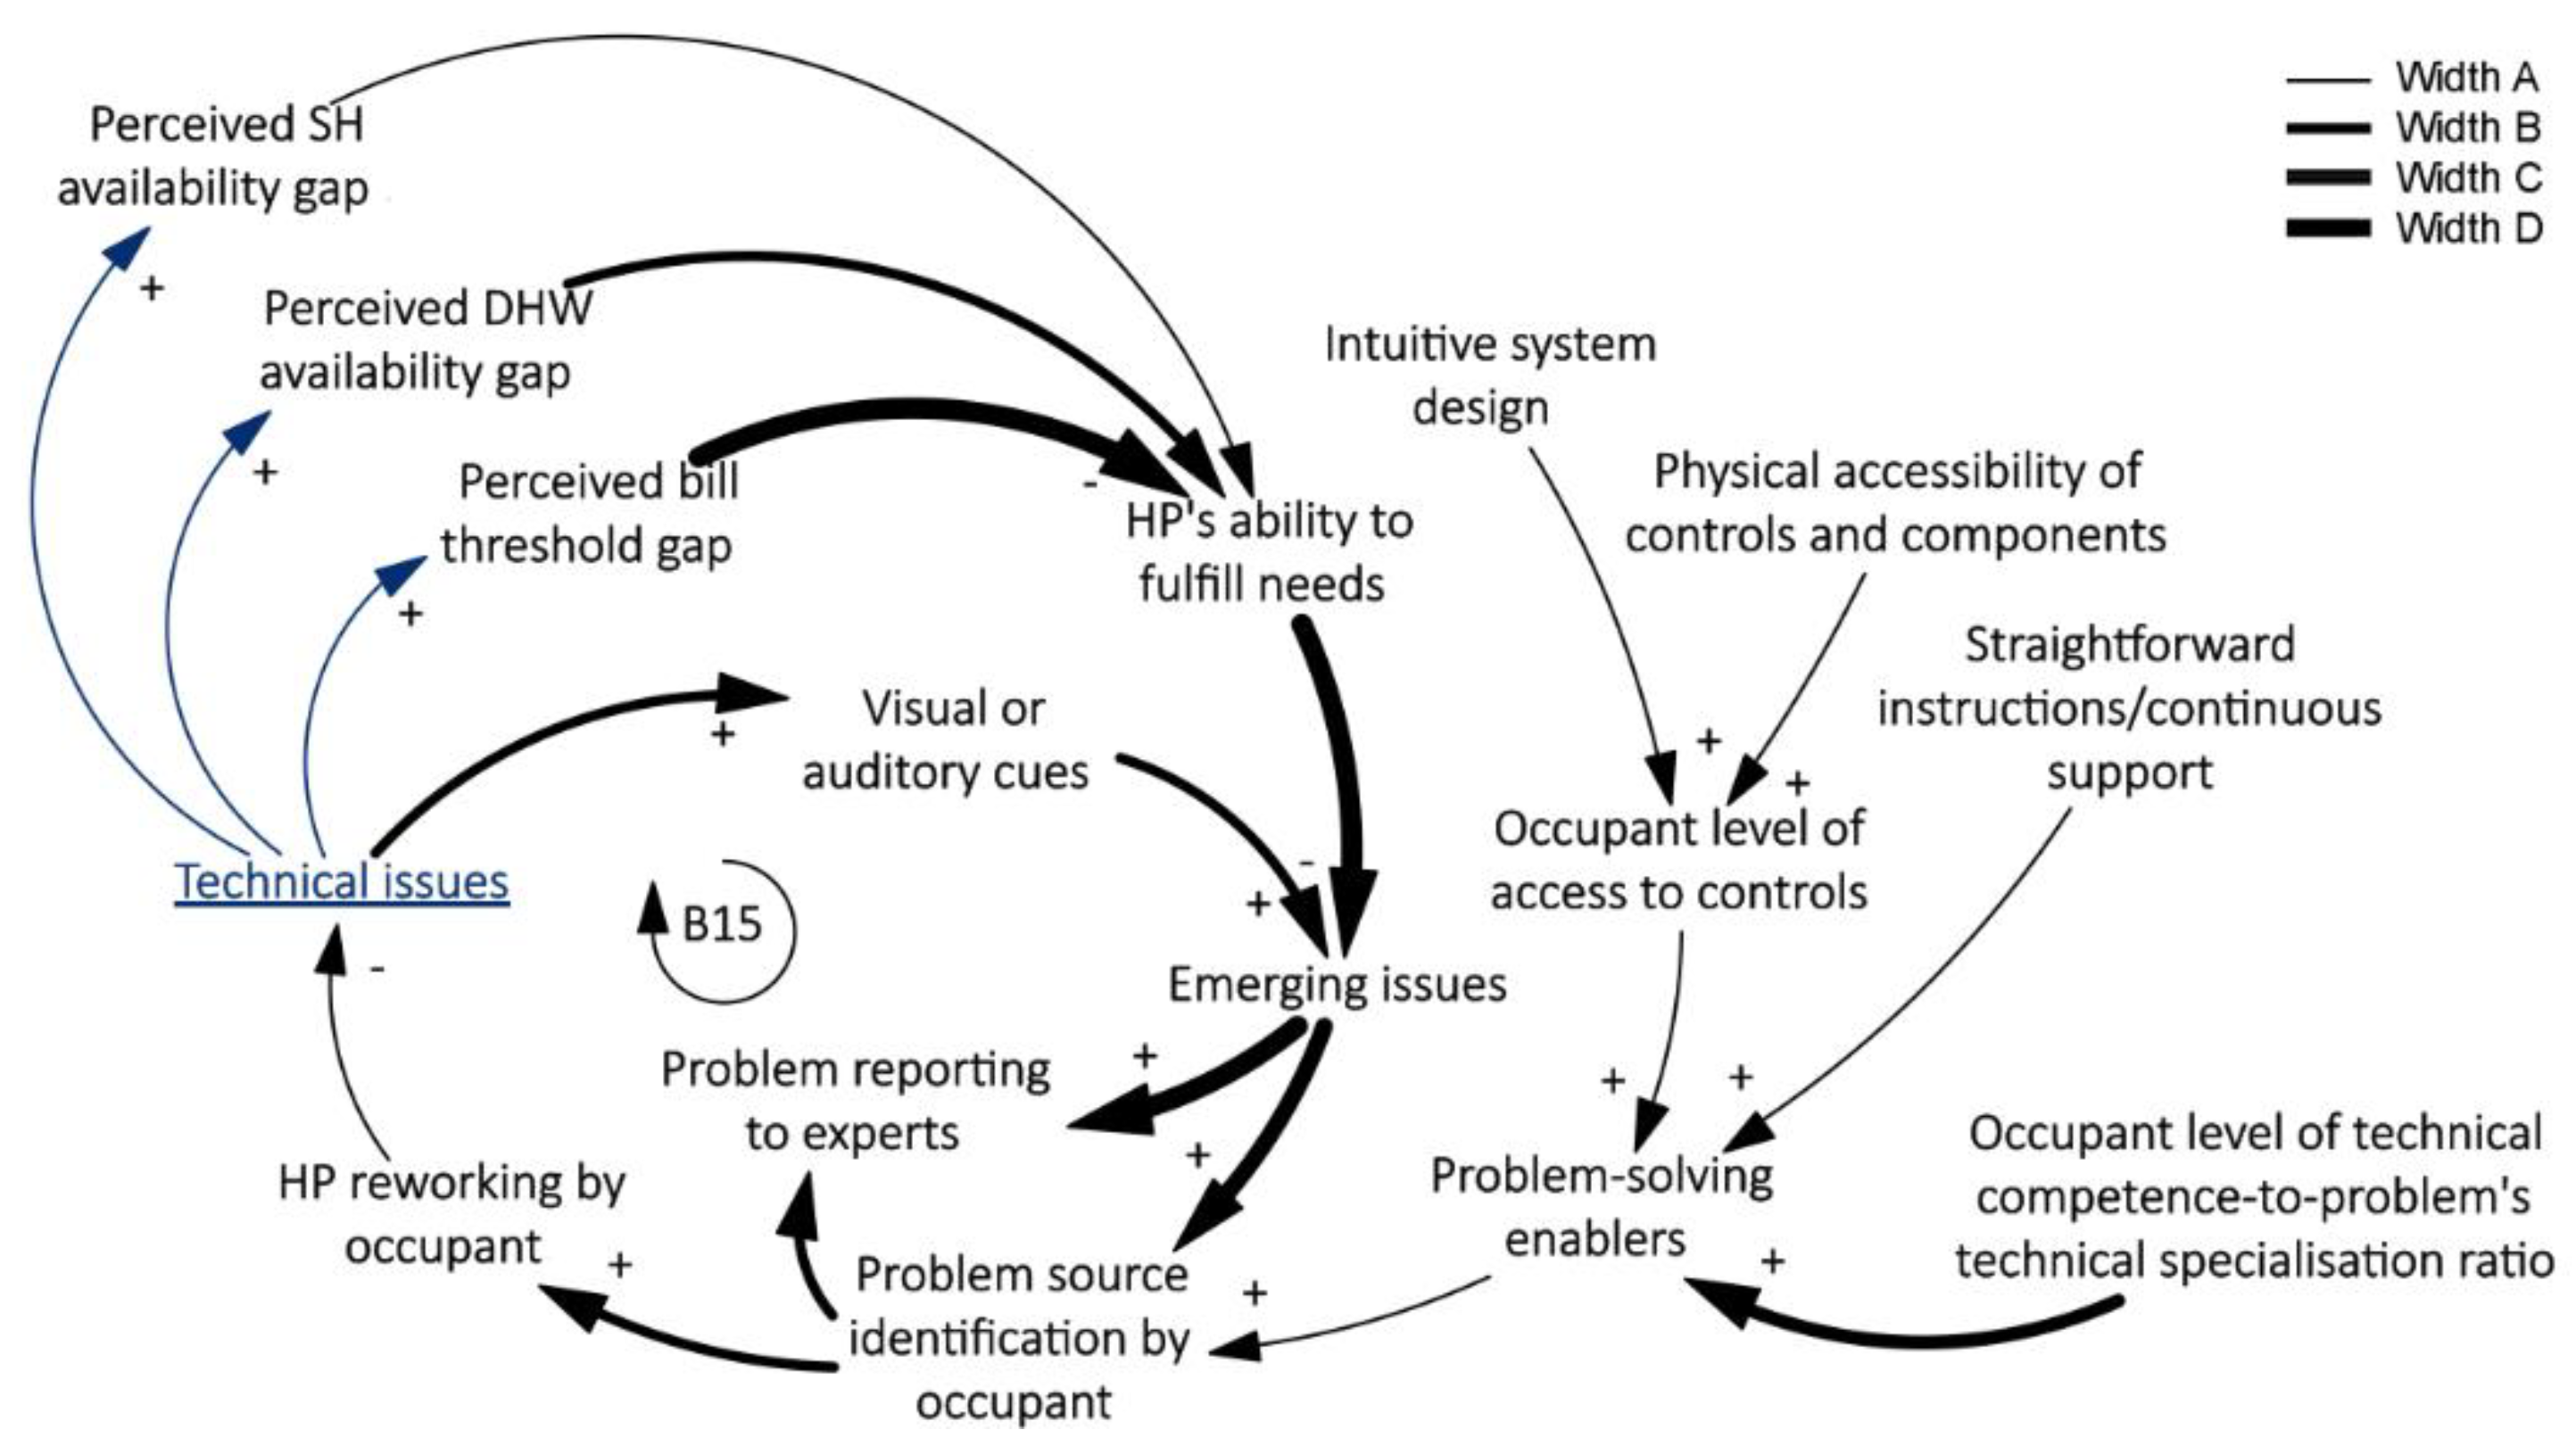
3.3. Self-Resolving Technical Problem Process

Approximately 75% of the case study occupants described one or more technical issues disrupting the HP’s ability to fulfil needs to different extents. The main needs that the occupants of all 21 case studies were expecting their HP to satisfy were having sufficient and uninterrupted SH/DHW availability at an ‘affordable’ energy cost, represented by the perceived SH availability gap, perceived DHW availability gap and perceived bill threshold gap variables. In some cases, visual or auditory cues facilitated the early detection of technical issues, i.e., before it became evident that the HP was unable to meet the occupants’ needs.
In approximately half of these cases, the occupants were able to identify the problem themselves and then either self-resolve it [B15] or refer it to experts (problem reporting to experts). The ability of the occupants to identify and resolve problems themselves appeared to be primarily a function of the occupant level of technical competenceto-problem’s technical specialisation ratio, providing that the occupants were able to access the installation part in question (physical accessibility of controls and components). Access to straightforward instructions/continuous support and an intuitive system design were found to enhance the problem-resolving process and thus lessen the need for an expert’s contribution.

3.4. Result Summary

While actual HP performance (SPF) is an objective estimation, perceived HP performance is a subjective measure that concerns the occupant’s indirect evaluation of HP performance. Based on the data collected from the occupants of the 21 case studies, perceived performance relies on the HP’s ability to fulfil needs, i.e., primarily cost and the provision of heat. There appears to be a gap between what is considered efficient in technical terms and what the occupants experience. Both actual and perceived HP performance appear to influence each other indirectly, with the later relying heavily on occupants’ experiences, views and conceptions. Whenever one of the perceived performance requirements was not satisfied, the occupants proceeded to make system adjustments (e.g., through the HP settings or their lifestyle) to correct the perceived SH/DHW insufficiency or lower the perceived high electricity bills. However, the adjustments made did not always have the desired or expected outcomes, as even small changes can unknowingly, in some cases, cause imbalance in other parts of the system leading to a lowered system efficiency, increased energy consumption or a reinforced initial problem. As an example, occupants employing intermittent over continuous HP operation to reduce running costs may unwittingly lower the HP’s efficiency, thus offsetting any perceived savings due to increased HP cycling.

4. Discussion and Conclusions

The interaction of occupants with HPs and the impact this has on performance is much more complex than anticipated by many and the diverse range of factors influencing performance and their interrelations need to be well understood to identify pathways for improvement. The CLD of the underlying system structure revealed several interconnections that can significantly hinder HP efficiency. These are hard to control, as they often emerge through processes of the HP operation that are invisible to the user and the confounding factors tend to conceal the real impact of actions taken by occupants. The complex nature of HP technology combined with widely adopted and intuitively “logical” practices utilised with traditional heating systems, may lead to unexpected or undesirable outcomes. Contrary to common intuition, several user practices, widely adopted with traditional heating systems, are detrimental to the efficiency of a HP. Such actions may be reinforced by the lack of transparency relating to HP efficiency and the energy consumed or generated by individual household appliances or generated by renewable energy systems.
Many case study occupants seeking to lower their electricity bills resorted to altering one or more of the HP’s SH controls, i.e., by lowering the thermostat temperature, reducing the heated area and/or reducing the HP’s scheduled operating hours. However, the fine balance between the energy saved by the reduced HP operating hours and the increased compressor cycling suggests there is uncertainty as to whether the occupants’ corrective actions will have a positive or negative outcome. Some users also increased the use of standalone resistance heating in an unsuccessful way to lower household energy bills. As well as the low efficiency of resistance heating, the use of any direct heating method, including wood fires that are often extensively used due to their aesthetic value, may significantly reduce the HP’s SH demand (in relation to the design heat load) and thus lower the system’s efficiency.
Users having a better understanding of their system, have been found to achieve higher system efficiencies [16]. This study has associated the potential of higher efficiencies to two types of users: (a) ‘self-monitoring users’ who can identify how to run their HP efficiently through energy bill surveillance and/or by utilising dedicated monitoring equipment, and (b) ‘technical savvies’ who have the skills required to identify or resolve technical problems of varying degrees of complexity. Given that HP users in the UK have generally been found to have a poor understanding of the complex HP technology [15,30] and that the wider evidence correlates higher levels of perceived complexity with suboptimal control [15,16,27,33], great emphasis should be placed on feedback processes and occupant education [16,18].
Occupant education and feedback processes are critical for users that may otherwise not be able to understand the real effects of their changes. The systems analysis revealed that enabling feedback information processes can have a significant impact on user behaviour and facilitate the timely identification of technical issues and actions that are likely to be detrimental to the HP’s efficiency. User feedback, e.g., through user-friendly interfaces displaying information on the system’s efficiency and energy consumption, can be particularly helpful when there is lack of clarity on the optimal HP-running patterns, as well as in situations where technical problems emerge, such as the unintentional use of the system’s backup resistance heater, which was found to be used extensively in the case studies. Users are not expected to be technically skilled to run a HP efficiently, however being adequately educated in order to recognise, prevent and resolve issues of low-level expertise, such as knowing when the HP-incorporated resistance heater is on and how to turn it off, can be a valuable skill. A user-friendly design that enables the easy identification of such issues is equally important. Most technical issues reported by occupants were identified due to the inability of a HP to fulfil needs, often at a later stage and usually manifesting in the form of high energy bills. However, where visual or auditory cues were present in relation to emerging issues, these facilitated their early detection. Given the complicated nature of HPs, there needs to be a fine balance between allowing some user access to controls to assist more efficient operation while preventing actions that may inadvertently lower the system efficiency or cause it to fail.

4.1. Policy Discussion and Recommendations

This study proposes two leverage points in relation to behaviour change [49]. These concern places to intervene within a complex system, where small changes can have big (and sometimes unexpected) impacts. The following feedback process-related leverage points derive from the systems thinking qualitative model and focus on the identification and elimination of key factors impeding domestic HP performance:
  • Enabling feedback information on system performance to raise awareness and enhance existing feedback loops.
  • Allowing the incorporation of smart controls to enable key feedback loops to become dominant.
In this way, a user mental shift will be encouraged by gradually driving users away from practices tied to habits, preconceptions and previous experiences that are generally hard to overcome. Placing focus on behaviour change can induce deep changes to the system’s architecture and this concerns both educational and system feedback processes. Training is traditionally provided through interaction with the installer and the provision of detailed instructions in the form of manuals that are often too lengthy and technical. While the provision of straightforward instructions would still be useful to some extent, generic advice is not likely to be particularly helpful for performance optimisation since it depends on the varied characteristics of each site. User behaviour has been found to be influenced by information display on the energy consumption of appliances [49] and thus users are more likely to benefit from simplified feedback provided through the system’s interface and the promotion of self-monitoring.
This could be achieved through ongoing and real-time system status indicators and displays providing summary reports and statistics on the system’s efficiency and other critical aspects, such as the operation of the backup resistance heater and the likely impact of settings changes and insights through the monitoring of internal temperature (e.g., addressing window opening as the possible cause of temperature fluctuations). Such feedback processes can have a significant impact on user behaviour and facilitate the timely identification of critical system features while restricting the inadvertent actuation of controls. The feedback processes could be further enhanced with simpler and more intuitive design of controls, such as the incorporation of clearly identifiable alerts (e.g., a large button that lights up) when the system backup resistance heater is enabled, and raising consumer awareness about its presence and under which circumstances it is triggered.
In addition to feedback processes, technological advancements, such as optimisation or smart controllers, are extremely useful in hiding complexity and bypassing the user to a certain extent by self-organising and adapting to changing conditions in real time. Smart controls can learn from occupant preferences and the building’s behaviour to allow performance optimisation that suits the individual household preferences while interacting with signals from grid suppliers to achieve demand-side management and offer higher efficiencies at a lower cost.

4.2. Study Contribution and Conclusion

The current study mapped the behavioural parameters that are likely to influence HP performance based on the in-depth investigation of 21 case studies. The study’s novelty lies in the integration and interpretation of sociotechnical data through a systems thinking lens that captured for the first time the complex interactions between HP performance and user behaviour. The study’s contribution to knowledge lies in:
  • the formulation of theory on the causes of dynamic relationships, and, specifically on the user-related structures responsible for the poor HP performance in the UK;
  • the deeper perspective gained on performance influencers relating to behaviour patterns; and
  • the emergence of new insights into the requirements for well-performing HPs, i.e., by highlighting the need to prioritise user-oriented technological advancements and policies supporting behaviour change.
These research outcomes are important as they can help better understand and mitigate the gap between predicted and in situ performance. A HP stock of higher efficiency is of key importance, as it will enable more energy and carbon savings to meet the UK’s emission reduction goals. Higher HP efficiencies, together with grid decarbonisation, smart grids and demand-side management will contribute towards an increasing HP competitiveness in relation to traditional heating systems that are typically more carbon intensive. The findings of this study have important implications for:
  • policy makers, such as Government departments and other regulatory agencies who are responsible for the introduction and development of policies and regulations relating to heat decarbonisation, and domestic HP installations, as well as those involved in the certification of HP products;
  • installers and manufacturers of HP systems and their components, as it is hoped that the practical solutions identified in this study will inform future installer and manufacturer standards; and
  • HP users, who can benefit from the behaviour-related interventions identified in this study, as they are meant to encourage a gradual mental shift that will drive users away from the inefficient practices that are typically used with traditional heating systems. However, this should be expected to be a slow process.
Since the causal relationships identified in this study are specific to the case study sample they derive from, their generalisation potential needs to be investigated through further research, i.e., future deductive research could be informed by the current inductive research. Future work could also focus on the formulation of quantitative relationships that enable a detailed system dynamics simulation to investigate the relative impact of individual variables of the qualitative model developed in this study. Other areas that merit further investigation relate to the impact investigation of the emerging socially induced heat load reduction on HP efficiency, the identification of appropriate SH control strategies depending on building and household type, as well as the identification of HP installation target groups, i.e., user groups that are more likely to operate their HP on higher efficiencies.

Author Contributions

Conceptualisation, E.O., T.O. and N.Z.; methodology, E.O.; formal analysis, E.O.; investigation, E.O.; data curation, E.O.; writing—original draft preparation, E.O.; writing—review and editing, T.O., M.D. and N.Z.; visualisation, E.O.; supervision, T.O., M.D. and N.Z.; project administration, E.O.; funding acquisition, T.O. All authors have read and agreed to the published version of the manuscript.

Funding

This research was part-funded by the UKRI Centre for Research into Energy Demand Solutions (CREDS), grant number EP/R035288/1.

Institutional Review Board Statement

The data collection and analysis conducted as part the RHPP project was in accordance with the Declaration of Helsinki, and approved by the UCL Research Ethics Committee (protocol code 6268/002 and date of approval 16 November 2015). Under the RHPP contract terms, all non-anonymised technical and social case study data collected were erased on 12/12/2017. Subsequent analysis performed for this research was based on anonymised data.

Informed Consent Statement

As part of the RHPP project, informed consent was obtained from all subjects involved in the study.

Data Availability Statement

Part of the data supporting the reported results in this study are openly available in the UK Data Archive at DOI 10.5255/UKDA-SN-8151-1, reference number SN 8151; DOI 10.5255/UKDA-SN-7955-1 reference number SN 7955; and DOI 10.5255/UKDA-SN-8260-1, reference number SN 8260.

Conflicts of Interest

The authors declare no conflict of interest. The funders had no role in the design of the study; in the collection, analysis, or interpretation of data; in the writing of the manuscript; or in the decision to publish the results.

References

  1. CCC. The Sixth Carbon Budget—The UK’s Path to Net Zero. 2020. Available online: https://www.theccc.org.uk/publication/sixth-carbon-budget/ (accessed on 28 November 2022).
  2. HM Government. The Ten Point Plan for a Green Industrial Revolution. 2020. Available online: https://assets.publishing.service.gov.uk/government/uploads/system/uploads/attachment_data/file/936567/10_POINT_PLAN_BOOKLET.pdf (accessed on 28 November 2022).
  3. BEIS. Heat and Buildings Strategy. London, 2021. Available online: https://assets.publishing.service.gov.uk/government/uploads/system/uploads/attachment_data/file/1044598/6.7408_BEIS_Clean_Heat_Heat___Buildings_Strategy_Stage_2_v5_WEB.pdf (accessed on 28 November 2022).
  4. Institute for Government. UK Net Zero Target. 2020. Available online: https://www.instituteforgovernment.org.uk/explainers/net-zero-target (accessed on 28 November 2022).
  5. Lowe, R.; Summerfield, A.; Oikonomou, E.; Love, J.; Biddulph, P.; Gleeson, C.; Chiu, L.; Wingfield, J. Analysis of Heat Pump Data from the RHPP Scheme to DECC: Final Report. London, 2017. Available online: https://assets.publishing.service.gov.uk/government/uploads/system/uploads/attachment_data/file/606818/DECC_RHPP_161214_Final_Report_v1-13.pdf (accessed on 28 November 2022).
  6. Carroll, P.; Chesser, M.; Lyons, P. Air Source Heat Pumps field studies: A systematic literature review. Renew. Sustain. Energy Rev. 2020, 134, 110275. [Google Scholar] [CrossRef]
  7. Staffell, I.; Brett, D.; Brandon, N.; Hawkes, A. A review of domestic heat pumps. Energy Environ. Sci. 2012, 5, 9291. [Google Scholar] [CrossRef]
  8. MCS.; RECC. Domestic Heat Pumps—A Best Practice Guide,” 2018. Available online: https://mcscertified.com/wp-content/uploads/2020/07/Heat-Pump-Guide.pdf (accessed on 28 November 2022).
  9. Dincer, I.; Rosen, M.A.; Ahmadi, P. Modeling and Optimization of Heat Pump Systems. In Optimization of Energy Systems; John Wiley & Sons, Ltd.: Chinchester, UK, 2017; pp. 183–198. [Google Scholar] [CrossRef]
  10. EN 14825:2018; Air Conditioners, Liquid Chilling Packages and Heat Pumps, with Electrically Driver Compressors, for Space Heating and Cooling—Testing and Rating at Part Load Conditions and Calculation of Seasonal Performance. British Standards Institution: London, UK, 2018.
  11. Zottl, A.; Nordmann, R. Project SEPEMO, D4.2./D2.4. Concept for Evaluation of SPF Version 2.2, Heat Pumps with Hydronic Heating Systems. 2012. Available online: http://sepemo.ehpa.org/uploads/media/D4_2_D2_4_Concept_for_evaluation_of_SPF_Hydronic_Version_2_2_2012-05-31.pdf (accessed on 28 November 2022).
  12. Gleeson, C.P.; Lowe, R. Meta-analysis of European heat pump field trial efficiencies. Energy Build. 2013, 66, 637–647. [Google Scholar] [CrossRef]
  13. Miara, M.; Gunter, T.; Lagner, R. Efficiency of heat pumps under real operating condition. IEA Heat Pump Cent. Newsl. 2013, 31, 1–40. Available online: https://heatpumpingtechnologies.org/publications/efficiency-of-heat-pump-systems-under-real-operating-conditions-2/ (accessed on 28 November 2022).
  14. Dunbabin, P.; Wilkins, C. Detailed Analysis from the First Phase of the Energy Saving Trust’s Heat Pump Field Trial. 2012. Available online: https://www.gov.uk/government/publications/analysis-from-the-first-phase-of-the-energy-saving-trust-s-heat-pump-field-trial (accessed on 28 November 2022).
  15. Durham Energy Institute and Element Energy. Insight Report: Domestic Heat Pumps. 2015. Available online: http://www.networkrevolution.co.uk/wp-content/uploads/2015/01/CLNR-L091-Insight-Report-Domestic-Heat-Pumps.pdf (accessed on 28 November 2022).
  16. Caird, S.; Roy, R.; Potter, S. Domestic heat pumps in the UK: User behaviour, satisfaction and performance. Energy Effic. 2012, 5, 283–301. [Google Scholar] [CrossRef] [Green Version]
  17. Dunbabin, P.; Charlick, H.; Green, R. Detailed Analysis from the Second Phase of the Energy Saving Trust’s Heat Pump Field Trial. 2013. Available online: https://www.gov.uk/government/uploads/system/uploads/attachment_data/file/225825/analysis_data_second_phase_est_heat_pump_field_trials.pdf (accessed on 28 November 2022).
  18. EST. The Heat is on: Heat Pump Field Trials Phase 2. 2013. Available online: http://www.energysavingtrust.org.uk/sites/default/files/reports/TheHeatisOnweb%281%29.pdf (accessed on 28 November 2022).
  19. Patterson, M.; Preston-Barnes, H.; Oreszczyn, T. Micro Distributed Energy and Energy Services Management—Project Summary Report. 2011. Available online: https://ukerc.rl.ac.uk/ETI/PUBLICATIONS/DE_DE2003_6.pdf (accessed on 28 November 2022).
  20. Stafford, A.; Lilley, D. Predicting in situ heat pump performance: An investigation into a single ground-source heat pump system in the context of 10 similar systems. Energy Build. 2012, 49, 536–541. [Google Scholar] [CrossRef] [Green Version]
  21. Kelly, N.J.; Cockroft, J. Analysis of retrofit air source heat pump performance: Results from detailed simulations and comparison to field trial data. Energy Build. 2011, 43, 239–245. [Google Scholar] [CrossRef] [Green Version]
  22. Blois-Brooke, S.; Matthews, D.; Willson, C. UK Literature Review for International Energy Agency (IEA) Annex 36 on Investigating the Effect of Quality of Installation and Maintenance on Heat Pump Performance. 2013. Available online: https://assets.publishing.service.gov.uk/government/uploads/system/uploads/attachment_data/file/224060/iea_literature_review.pdf (accessed on 28 November 2022).
  23. Clear Plan UK.; Logan Project Management. Housing, Regeneration and Planning: The Scottish Renewables Heating Pilot; The Scottish Government: Edinburgh, UK, 2008.
  24. Stafford, A.; Bell, M. Evaluation of Heat Pump Installations: Extracting Meaning from Existing Datasets. 2009. Available online: https://www.researchgate.net/publication/242264360_Evaluation_of_Heat_Pump_Installations_Extracting_Meaning_from_Existing_Datasets (accessed on 28 November 2022).
  25. Stafford, A. Long-term monitoring and performance of ground source heat pumps. Build. Res. Inf. 2011, 39, 566–573. [Google Scholar] [CrossRef]
  26. Delta Energy & Environment. Heat Pumps in the UK: How Hot Can They Get? 2011. Available online: https://studylib.net/doc/18093444/heat-pumps-in-the-uk--how-hot-can-they-get%3F (accessed on 28 November 2022).
  27. Boait, P.J.; Fan, D.; Stafford, A. Performance and control of domestic ground-source heat pumps in retrofit installations. Energy Build. 2011, 43, 1968–1976. [Google Scholar] [CrossRef]
  28. European Commission. Directive 2009/125/EC—Establishing a Framework for the Setting of Ecodesign Requirements for Energy-Related Products (Recast). 2009. Available online: https://eur-lex.europa.eu/legal-content/EN/TXT/PDF/?uri=CELEX:32009L0125&from=EN (accessed on 18 November 2022).
  29. Wypych, A.; Bochenek, B.; Rózycki, M. Atmospheric Moisture Content over Europe and the Northern Atlantic. Atmosphere 2018, 9, 18. [Google Scholar] [CrossRef]
  30. Roy, R.; Caird, S.; Potter, S. Getting Warmer: A Field Trial of Heat Pump. 2010. Available online: http://oro.open.ac.uk/31647/ (accessed on 28 November 2022).
  31. HPA. Building the Installer Base for Net Zero Heating. 2020. Available online: https://www.heatpumps.org.uk/wp-content/uploads/2020/06/Building-the-Installer-Base-for-Net-Zero-Heating_02.06.pdf (accessed on 28 November 2022).
  32. Gram-Hanssen, K.; Heidenstrøm, N.; Vittersø, G.; Madsen, L.V.; Jacobsen, M.H. Selling and installing heat pumps: Influencing household practices. Build. Res. Inf. 2017, 45, 359–370. [Google Scholar] [CrossRef]
  33. Owen, A.; Mitchell, G.; Unsworth, R. Reducing carbon, tackling fuel poverty: Adoption and performance of air-source heat pumps in East Yorkshire, UK. Local Environ. 2013, 18, 817–833. [Google Scholar] [CrossRef]
  34. Gram-Hanssen, K.; Christensen, T.; Petersen, P. Air-to-air heat pumps in real-life use: Are potential savings achieved or are they transformed into increased comfort? Energy Build. 2012, 53, 64–73. [Google Scholar] [CrossRef] [Green Version]
  35. Winther, T.; Wilhite, H. An analysis of the household energy rebound effect from a practice perspective: Spatial and temporal dimensions. Energy Effic. 2014, 8, 595–607. [Google Scholar] [CrossRef] [Green Version]
  36. Pollard, A. Heat Pump Performance; Building Energy End-Use Project View Project; BRANZ Ltd.: Porirua, New Zealand, 2018. [Google Scholar] [CrossRef]
  37. Oikonomou, E. Understanding the Drivers Affecting the In-Situ Performance of Domestic Heat Pumps in the UK. Ph.D. Thesis, UCL (University College London), London, UK, 2022. Available online: https://rps.ucl.ac.uk/viewobject.html?cid=1&id=1963073 (accessed on 28 November 2022).
  38. Lowe, R.; Chiu, L.F.; Oikonomou, E.; Gleeson, C.; Love, J.; Wingfield, J.; Biddulph, P. Analysis of Heat Pump Data from the RHPP Scheme to DECC: Case Studies Report from the RHPP Heat Pump Monitoring Campaign. 2017. Available online: https://assets.publishing.service.gov.uk/government/uploads/system/uploads/attachment_data/file/607085/DECC_RHPP_161214_Case_Studies_v15_from_docx_.pdf (accessed on 28 November 2022).
  39. Wickins, C. Preliminary Data from the RHPP Heat Pump Metering Programme. 2014. Available online: https://assets.publishing.service.gov.uk/government/uploads/system/uploads/attachment_data/file/276612/Preliminary_Report_on_the_RHPP_metering_programme_2014-01-31.pdf (accessed on 28 November 2022).
  40. Chiu, L.F.; Lowe, R.; Raslan, R.; Altamirano-Medina, H.; Wingfield, J. A socio-technical approach to post-occupancy evaluation: Interactive adaptability in domestic retrofit. Build. Res. Inf. 2014, 42, 574–590. [Google Scholar] [CrossRef] [Green Version]
  41. Denzin, N.K. The Research Act; Routledge: New York, NY, USA, 2017. [Google Scholar] [CrossRef]
  42. QSR International. NVivo Qualitative Data Analysis Software for Researchers. 2022. Available online: https://www.qsrinternational.com/nvivo-qualitative-data-analysis-software/home (accessed on 28 November 2022).
  43. Ventana Systems. Vensim Simulation Software. 2022. Available online: https://vensim.com/ (accessed on 28 November 2022).
  44. Sterman, J. Business Dynamics: Systems Thinking and Modeling for a Complex World; McGraw Hill: Boston, MA, USA, 2000. [Google Scholar]
  45. Sterman, J. The Systems Thinker—Fine-Tuning Your Causal Loop Diagrams—Part I—The Systems Thinker. 2018. Available online: https://thesystemsthinker.com/fine-tuning-your-causal-loop-diagrams-part-i/ (accessed on 28 November 2022).
  46. Luna-Reyes, L.F.; Andersen, D.L. Collecting and analyzing qualitative data for system dynamics: Methods and models. Syst. Dyn. Rev. 2003, 19, 271–296. [Google Scholar] [CrossRef]
  47. Kim, H.; Andersen, D.F. Building confidence in causal maps generated from purposive text data: Mapping transcripts of the Federal Reserve. Syst. Dyn. Rev. 2012, 28, 311–328. [Google Scholar] [CrossRef]
  48. Eker, S.; Zimmermann, N. Using Textual Data in System Dynamics Model Conceptualization. Systems 2016, 4, 28. [Google Scholar] [CrossRef]
  49. Wood, G.; Newborough, M. Influencing user behaviour with energy information display systems for intelligent homes. Int. J. Energy Res. 2007, 31, 56–78. [Google Scholar] [CrossRef]
Figure 2. Flow chart of the process of invitation to owner occupiers and social tenants, through their registered social landlord (RSL), to participate in the case study investigation and response rates at each stage [38].
Sustainability 14 16799 g002
Figure 3. The distribution of heat pump efficiency for the 49 volunteer sites and the final selection of 21 case studies [38].
Sustainability 14 16799 g003
Figure 4. Causal diagram depicting the complex interrelationship between occupant behaviour and the HP’s operation processes, where arrow width (A, B, C and D) reflects the number of case studies in which the link was identified, i.e., A = 1–5, B = 6–10, C = 11–15 and D = 16–21. The dotted-line arrows represent technical interactions that are often-counterintuitive to non-experts. The ‘plus’ sign assigned indicates that the influenced variable increases (decreases) beyond what it would have been without the increase (decrease) in the influencing variable. The ‘minus’ sign indicates that the influenced variable decreases (increases) beyond what it would have been without the increase (decrease) in the influencing variable.
Sustainability 14 16799 g004
Figure 5. Causal diagram depicting the complex interrelationships of the self-resolving technical resolution process, where arrow width (A, B, C and D) reflects the number of incidents across the 21 case studies, i.e., A = 1–7, B = 8–13, C = 15–21 and D = 22–28. The ‘plus’ sign assigned indicates that the influenced variable increases (decreases) beyond what it would have been without the increase (decrease) in the influencing variable. The ‘minus’ sign indicates that the influenced variable decreases (increases) beyond what it would have been without the increase (decrease) in the influencing variable.
Sustainability 14 16799 g005
Table 1. Boundaries for the calculation of the heat pump (HP) system’s efficiency.
Boundary LevelDescription
H1Energy consumed by the HP unit
H2H1 + Energy consumed by the heat drawing equipment
H3H2 + Energy consumed by the incorporated resistance heater
H4H3 + Energy consumed by the circulator pumps/fans
H5H4 + Energy consumed due to cylinder heat losses
Table 3. Comparison between the statistically derived SPFs at boundary level H4 and their evaluation based on the visual inspection of the monitoring data series.
Case Study IDSPF Calculation PeriodStatistical SPFSPF Evaluation Based on the Visual Inspection
CS0112/2013–12/20142.3Ok
CS0203/2014–03/20152.3Ok
CS0311/2013–11/20142.4Likely underestimation
CS0411/2013–11/20143.0Ok
CS0511/2013–11/20142.6Ok
CS0604/2013–04/20142.8Ok
CS0702/2014–02/20152.7Likely overestimation
CS0811/2013–11/20142.4Likely overestimation
CS0903/2012–03/20132.7Ok
CS1011/2013–11/20143.2Ok
CS1102/2014–02/20152.9Ok
CS1211/2013–11/2–140.8Invalid
CS1301/2014–01/20154.1Uncertain
CS1411/2013–11/20143.6Ok
CS1503/2014–03/20153.0Likely underestimation
CS1611/2013–11/20141.7Likely underestimation
CS1701/2014–01/20153.1Ok
CS1808/2013–08/20144.4Likely overestimation
CS1903/2014–03/20154.0Ok
CS2011/2013–11/20143.5Ok
CS2112/2012–12/20131.3Likely underestimation
Table 4. Primary feedback loop description.
IDDescription
[B1]Programmer adjustment to meet heating needs
[B2]Flow temperature adjustment to meet heating needs
[B3]Thermostatic setting adjustments to meet heating needs
[B4]Overall spatial adjustments to meet heating needs
[B5]Balancing SH availability through window opening
[B6]Adjusting SH availability with non-electric supplementary heating
[B7]Adjusting SH availability with electric supplementary heating
[B8]Temporal rebound
[B9]Flow temperature rebound
[B10]Thermostatic setting rebound
[B11]Spatial rebound
[B12]Balancing DHW availability through the HP
[B13]Balancing DHW generation through the HP-incorporated resistance heater
[B14]Balancing energy consumption through monitoring
[B15]Self problem-resolving process
Table 5. Heat pump under- and over-sizing effects.
IssueEffect of Key VariableEffect on System Operation/Efficiency
Heat pump undersizingHigh effective compared to design heat load ratioMay force the HP to run almost continuously to reach the desired thermostat temperature settings, which it may not be able to satisfy. The energy savings associated with reduced cycling are likely to be offset or even reversed by the increased continuity of HP operation. May also trigger SH-generation via the HP-incorporated resistance heater [8].
Heat pump oversizingLow effective compared to design heat load ratioHP tends to switch on and off more frequently due to its higher-than-desired heating capacity, thus disrupting the continuity of HP operation, increasing compressor cycling and negatively affecting SPF [7,26].
Publisher’s Note: MDPI stays neutral with regard to jurisdictional claims in published maps and institutional affiliations.

