Article

Cyclic Direct Shear Testing of a Sand with Waste Tires

by
Özgür Yıldız
1 and
Ali Firat Cabalar
2,*
1
Department of Civil Engineering, Turgut Ozal University, Malatya 44210, Turkey
2
Department of Civil Engineering, University of Gaziantep, Gaziantep 27410, Turkey
*
Author to whom correspondence should be addressed.
Sustainability 2022, 14(24), 16850; https://doi.org/10.3390/su142416850
Submission received: 3 November 2022 / Revised: 11 December 2022 / Accepted: 13 December 2022 / Published: 15 December 2022
(This article belongs to the Section Sustainable Engineering and Science)

Abstract

:
This study investigates the cyclic behavior of sand mixed with waste tires by using a series of strain-controlled cyclic direct shear tests under constant normal load (CNL) conditions. Crushed Stone Sand (CSS) was used in the experimental studies. The sand grains have angular shapes and sizes changing from 1.0 mm to 2.0 mm. Two different types of waste tires were used in the experiments; (i) tire crumb (TC), and (ii) tire buffing (TB). The TC grains have an angular shape and size between 1.0 mm and 2.0 mm, whereas TB grains used were found to be fiber-shaped, with dimensions changing from 1 mm to 9 mm, and an aspect ratio of about 1:5. The tests were carried out under 100 kPa vertical effective stress on the sand with 0%, 2.5%, 5%, 7.5%, and 10% waste tire contents. The testing results were found to be highly dependent on both the type and amount of waste tires in the mixtures. Furthermore, the behavior of the mixtures was estimated by the Bayesian Regularization Neural Network (BRNN) prediction model, for further use by researchers. The performance of the proposed BRNN model was found to provide a quite high correlation coefficient (R2 = 0.96).

1. Introduction

Estimation of the stress-strain response of soils subjected to load is essential for designing the geotechnics of engineering structures. This response under monotonic and cyclic loading is tested by different static and dynamic approaches in a laboratory environment. Such laboratory works indicate that the deformations due to loading will damage the engineering structures. Therefore, it is of significance to have an accurate understanding of the shear behavior of the grain-grain interfaces. In a cyclic direct shear testing machine, the load is transferred from the soil grain to the other soil material, along the interface. A frictional resistance takes place through the interface based on the features of the material pair (grain-grain). Eventually, the amount of frictional resistance force through the interface provides a better understanding of the response of materials to cyclic loads. The fact is that frictional resistance force between sands and various constructional materials (i.e., steel, aluminum, and concrete) has already been studied using the cyclic direct shear testing methodology [1,2,3,4,5,6]. Potyondy [1] examined the parameters affecting skin friction, different structural materials (i.e., steel, wood, and concrete), different moisture contents (i.e., 13%, 15%, and 1%), different soil types (i.e., sand, clay, cohesive soils, and silt), and the effect of different normal stresses (i.e., 550 lb/sq to 6000 lb/sq), especially in cohesive soils, cohesion, and internal friction angle, which should be considered in the evaluation of skin friction. Al-Douri and Poulos [2] carried out static and cyclic direct shear tests to understand the response of pile-soil interfaces. It was concluded that higher interface friction along the piles was observed in calcareous sand than silica sand. Desai et al. [3] developed a new cyclic testing device to investigate the interface behavior between structural and geologic materials and the amplitude of displacement, normal stress, relative density of sand, and the number of loading cycles influencing factors associated with interface behavior. The increasing sand thickness leads to an increase in the transmitted normal stress to the interface. The friction between normally consolidated clay and steel was investigated by simple shear type and shear box type apparatuses. The resistance of friction reaches its maximum with higher shear strength clay and drainage conditions. Although consolidations are not influential on interface friction, loading speed is [4]. Fakharian and Evgin [5] compared shear apparatuses with direct shear and simple shear types. No major difference was observed between the two types of testing in terms of peak and residual strengths. For the monotonic shear test, it has been observed that peak and post-peak behavior can occur with an increase in the number of loading cycles in both methods. Mortara et al. [6] formulated a constitutive model for the behavior of the sand-steel interface through constant normal load and constant normal stiffness tests. The developed model reasonably matched the experimental results of the cyclic behavior of sand-steel interfaces.
The cyclic response of sands and structural material interfaces was investigated in terms of the influence of the size and shape characteristics of the grains [7,8]. In another study investigating the effect of grain shape on cyclic behavior, it was reported that the materials with higher particle regularity (i.e., spherical granular material) tend to exhibit cyclic softening after the cyclic direct shear test. In contrast, materials having lower particle regularity induce cyclic hardening [9]. In cyclic direct shear tests carried out under constant normal load, it was observed that contraction always occurred under prescribed stiffness conditions, whilst only one of dilation and contraction occurred under constant normal load [10]. Following the study by Fakharian and Evgin [11] on the interface between soils and structural materials, a direct shear testing device was used in conjunction with the simple shear device, and a comparative evaluation of results was made [5]. It was indicated that both of the tests observed close results regarding peak and residual shear strength. The amplitude of displacement, normal stress, relative density, and the number of loading cycles are described as the effective parameters of the behavior [3]. Stark et al. [12] observed that large post-peak strength loss took place in various materials (i.e., textured geomembrane, nonwoven geotextile, and drainage geocomposite). The monotonic and cyclic behavior of interface shear between carbonate sand and steel was investigated by successive studies [13]. The increase in friction angle under the monotonic loading is attributed to particle breakage, the effect of which is studied with a dimensionless parameter.
Because of their advantageous physical and mechanical characteristics, research on the utilization of waste tires in construction projects has recently been gaining momentum [14]. Large quantities of waste tires discarded each year can be beneficially used in various geotechnical applications [15]. Edil and Bosscher [16] stated that the benefits of using waste tires can be enhanced by replacing them with virgin construction materials. The improvement effect of waste tire inclusion was determined to be a function of soil properties and type, length, aspect ratio, content, and orientation of tires [17,18]. Experimental and numerical studies carried out in recent years have shown that the use of waste tires, as a light material in engineering applications, is convenient for improving the behavior of structures and foundations under load [19]. Bosscher et al. [20] proposed the use of tire chips for highway embankments. Tweedie et al. [21] used tire shreds as the backfill of a retaining wall. Humphrey et al. [22] indicated that tire shreds properly designed as a backfill may prevent self-heating reactions. Lee et al. [23] performed laboratory tests ona tire shred backfill at rest and active conditions. The FEM (i.e., Finite Element Model) analysis successfully estimated the deformations and stresses during rest conditions. Dickson et al. [24] constructed a prototype of a tire shred embankment fill. The settlements were within the expected range and no internal healing was observed. Zornberg et al. [25], due to the shear strength improvement caused by tire shred inclusion into the sand, soil-tire shred mixtures were proposed as an alternative backfill material. Hazarika et al. [26,27], after a set of small-scale model shaking table tests, resulted in the successful performance of sand-tire chip mixtures against liquefaction. Rubber-soil mixture is proposed as a new concept of seismic isolation [28,29]. The effect of strain amplitude on sand-rubber and gravel-rubber mixtures [30], rubber content [31], specimen geometry, and sample preparation [32] on the dynamic behavior of mixtures was investigated in follow-up studies. Mavronicola [33] stated that increasing layer thickness induced maximum reduction, even at lower rubber contents. Perez et al. [34] performed monotonic compression tests on sand–rubber mixtures at a constant volume. Mixtures with rubber contents between 0% and 20%, sand-sand, and rubber-rubber contacts, exhibit similar mechanical coordination and transition zone for 20 to 40% rubber content. The stability of the system was, primarily, explained by the interplay of sand–sand and rubber–sand contacts. For rubber contents greater than 40%, sand–sand contacts contribute less to the overall stability. The GSI (i.e., Geotechnical Seismic Isolation) concept was numerically applied beneath the foundation of low-to-medium-rise buildings. [35,36,37]. Edincliler and Yildiz [38] investigated the effect of specimen temperature on seismic behavior and suggested rubber-sand mixtures as an ideal material for cold regions. Yıldız [39] performed numerical analysis on the efficiency of the GSI concept for high-rise buildings and reported a remarkable seismic reduction effect of the concept. Humphrey [40] compiled the use of tire-derived aggregates in civil engineering applications. Aydilek et al. [41] proposed tire chips be used in leachate collection systems. Feng and Sutter [42] performed a resonant column test to investigate the dynamic properties of rubber-sand mixtures. The shear modulus of mixtures was observed to be influenced by rubber content, and confining pressure leads to an increase in pure rubber’s damping ratio. The difference between the thermal expansion of soil and rubber leads to thermoelastic enhancement of damping with rubber inclusion to sand [43]. The mechanical response of mixtures is dependent on the volume fraction of rubber and the relative grain size of rubber to sand [44,45]. Shear strain amplitude between the ranges of 0.1 to 0.01%, in soil-rubber mixtures, displays a more linear behavior of shear stiffness [46]. Small strain dynamic properties of sand-rubber [47] and gravel rubber mixtures [48] were investigated with a specific concentration on the effects of rubber content, specimen size and duration of confinement, and the relative size of rubber to soil particles. Nakhaei et al. [49] performed large-scale consolidated undrained cyclic triaxial tests with granulated rubber-granular soil mixtures, and introduced new relations of shear modulus and normalized shear modulus. Li et al. [50] observed the influence of rubber-soil proportion dynamic parameters and liquefaction susceptibility. Mashiri et al. [51] performed large-scale cyclic triaxial and bender element tests. It was observed that shear modulus at larger strains decreases with increasing amplitude of strain, as a function of tire chips in the mixture. Okur and Umu [52] developed new formulations of maximum shear modulus and damping ratio. The dynamic behavior of rubber-sand mixtures was observed to be completely strain-dependent at lower strain ranges of the threshold value depending on the confining stress [53]. The compressibility of tire chips was examined with custom-made equipment. At initial loadings, tire chips were found to be highly compressible but at subsequent stages, the compressibility got lower [54]. Foose et al. [55] addressed three parameters affecting the shear strength of sand-tire shred mixtures, unit weight of the sand matrix, normal stress, and shred content. Tatlısoz et al. [56] indicate that for smaller volumes, soil-tire chip mixtures allow steeper inclined embankment construction and provide greater resistance to settlement and lateral sliding. Further studies were carried out on the effect of the inclusion of tire shreds on the geotechnical properties of the sand, and common findings on strength improvement were reached [57,58,59,60]. The strength enhancement of rubber inclusion on the sand was investigated in subfreezing temperatures. The rubber inclusion at lower content improved the strength of the mixture at subfreezing temperatures [61]. Cabalar [62] developed a stepwise regression model to predict the shear strength of rubber-sand mixtures. Contrary to common views, Marto et al. [63] stated that the addition of tire chips did not significantly affect the strength of the sand, but provided an optimization effect. Anvari et al. [64] stated that with increasing grain rubber content, the behavior of the sand becomes more ductile, and the yield stress and stiffness of sand decreases. The inclusion of tire wastes into the sand with varied sizes, shapes, content, and specimen temperatures was investigated in detail. Tire-included specimens tested at 0 °C are more resistant to liquefaction than the ones at room temperature and 50 °C [65]. The sensitivity analysis, used as an alternative approach, demonstrated the effect of tire content on dynamic parameters of satire crumb mixtures [66]. The cyclic direct shear test performed instudies isquite limited in number [67]. From the results of a series of triaxial tests carried out with various sand-waste tire mixtures, Youwai and Bergado [68] stated that the strength of mixtures is increased with decreasing amount of tire shred. Similar findings were also revealed by Masad et al. [69], with tests performed with sand tire chips. The main motivation of these studies, performed with waste tire-soil mixtures, is to achieve the desired performance with optimum composition. Tasalloti et al. [70] performed a comprehensive literature study on the geotechnical characterization of soil-waste tire mixtures.
The present study adds to the recent research by exploiting cyclic direct shear tests on sand-waste tire mixtures, with various mixing ratios, to accurately quantify the effect of waste tires on the cyclic behavior of sand. In the tests conducted, crushed stone sand, whose material response during the cyclic direct shear test was examined in detail by Cabalar et al. [71] and Cabalar [7], was used. Two differently processed waste tire types: (i) tire buffing and (ii) tire crumb, were used as inclusions. In this manner, a better understanding has been targeted on the effect of processing type of waste tire addition to sand. The effect of content and shape properties have been examined by mixing sand with four different percentages (i.e., 0%, 2.5%, 5%, 7.5%, and 10%) of tire buffing, and tire crumb, respectively. Furthermore, a Bayesian Regularization Neural Network (BRNN) prediction model for further use by researchers was developed to predict the shear stress of the tested specimens.

2. Experimental Study

2.1. Materials

The tests were carried out using CSS (i.e., Crushed Stone Sand) waste tire material in two different processed forms, buffing and crumb. The CSS used in this study is quarried and consumed widely for earthworks in Northern Cyprus. The grain size of the CSS samples changes between 4.0 mm and 0.1 mm [72]. The D10, D30, D50, and D60 sizes are 0.50, 1.20, 1.50, and 1.55, respectively. Thus, the coefficients of uniformity (Cu) and curvature (Cc) are calculated as 3.10 and 1.86, respectively. According to the Unified Soil Classification System (USCS), the CSS sample is classified as SW, well-graded sand. The grain size distribution of the sand is shown in Figure 1.
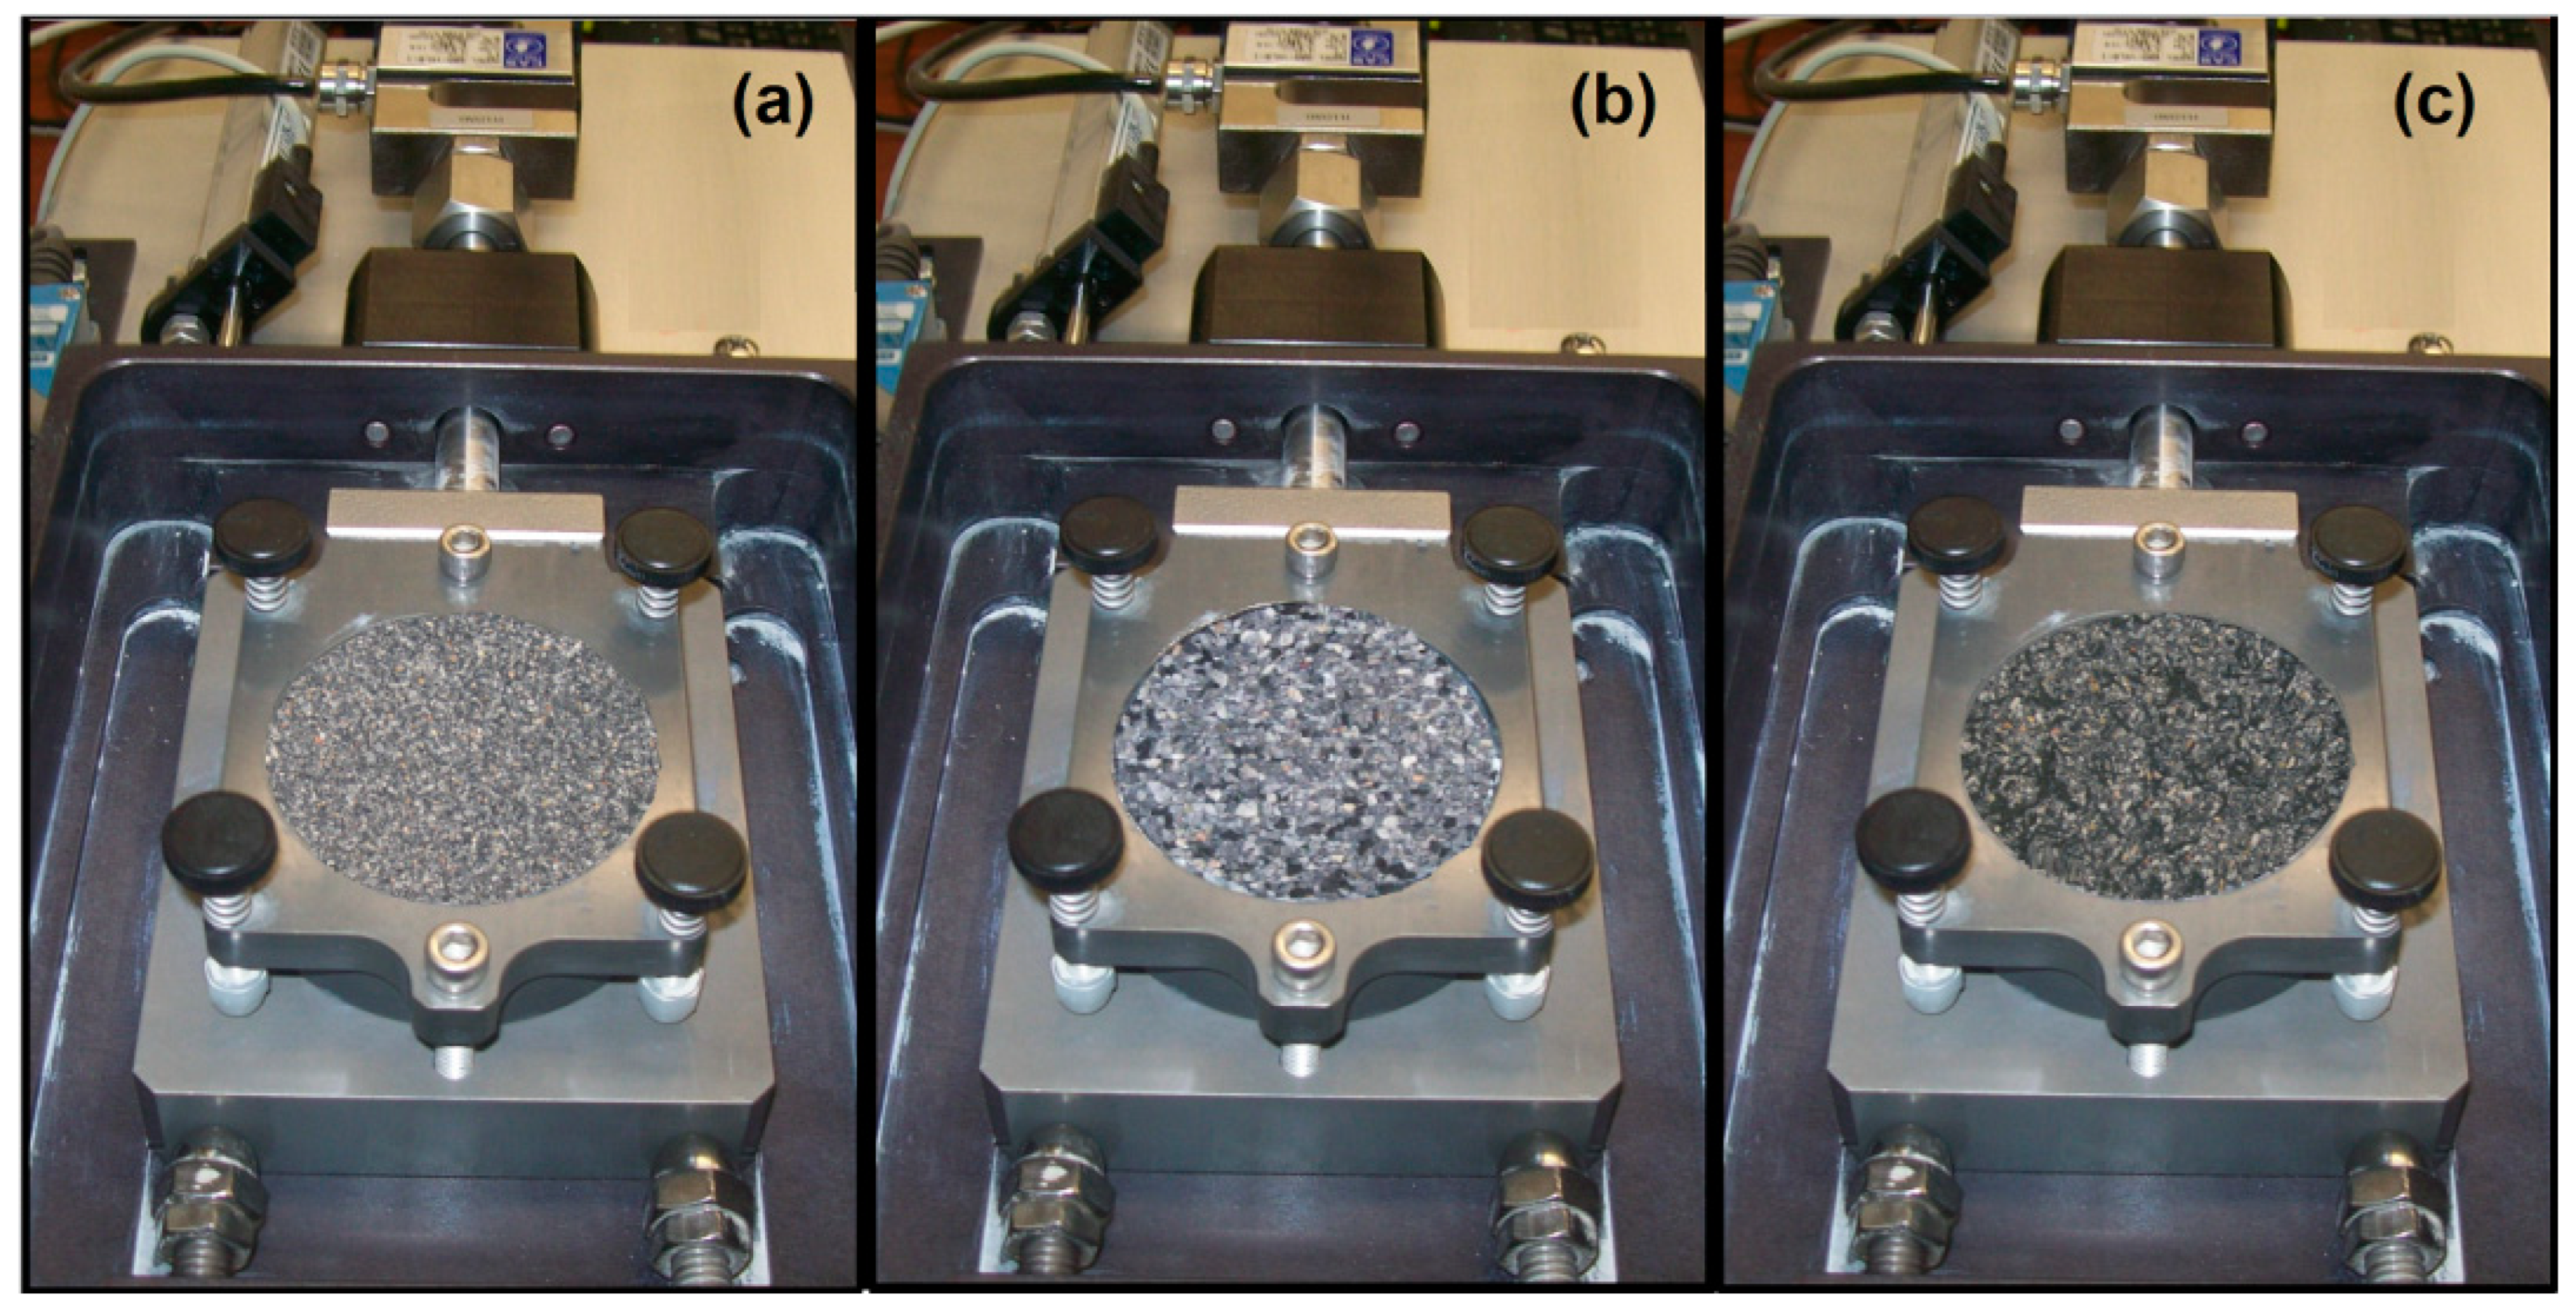
The manufactured waste tire material used in this study was purchased from a tire retread company in Istanbul, Turkey. TC (i.e., Tire Crumb) is produced from recycled vehicle tires, processed through mechanical trimming operations. During this process, steel and tire fluff are removed, leaving tire rubber with a granular consistency. It is defined as granulated rubber in [73], having an aspect ratio of 1:1.5. Another waste tire material, TB, (i.e., Tire Buffing) was also used in the shredded form, and was obtained from a tire retread company in Istanbul. The TB grains vary in length, with the minimum and maximum lengths of grains being 1 mm and 8 mm, respectively. The TB grains used in the cyclic direct shear tests have an aspect ratio of about 1:5. Pictures of the CSS, TB, and TC samples are shown in Figure 2.

2.2. Specimen Preparation and Testing Program

The cyclic direct shear tests were conducted using Geocomp Shear Trac II testing apparatus, which is capable of conducting the consolidation, static, and cyclic direct shear tests, under full automatic control. The system consists of a computer-controlled unit, a micro-stepper vertical load-applying motor, and an advanced horizontal cyclic load applying servo motor. Shear stress, which is the ratio of the applied shear force to the surface area of the sample in contact, is given by the testing apparatus as raw data in the computer environment. These data were then converted into graphical demonstrations of stress-strain and strain-time relationships. Cyclic direct shear tests were performed following the ASTM standards [74]. The vertical load was applied to the specimen by the rigid plate through an actuator and a rigid frame in the testing apparatus. The response of the specimens was investigated through the CNL (i.e., Constant Normal Load) tests. The cyclic rate that the device can apply is up to 5 Hz, and the typical test range is defined as 0.033 to 2 Hz. The maximum vertical displacement allowed by testing equipment is 25.4 mm. The cyclic tests were strain-controlled tests with a displacement of ±3 mm, and with loading rates of 2 mm/min. In the experimental works, five numbers of cyclic shearing and a 100 kPa vertical load were applied to specimens. As a follow-up study of Cabalar et al. [71] and Cabalar [7,8], the tests were carried out by employing the same conditions, ensuring consistency.
The specimens in the cyclic direct shear test apparatus were approximately 63.5 mm in diameter by 25.4 mm in height. In total, 9 specimens; clean crushed stone sand, four tire crumb-crushed stone sand, and four tire buffing-crushed stone sand mixtures, at different rubber contents, were prepared in the laboratory environment. Specimens were abbreviated to CSS, TCS2.5, TBS7.5, and so forth. The term CSS represents the clean crushed stone sand samples. The terms TCS and TBS represent the mixtures of crushed stone sand-tire crumb and crushed stone sand-tire buffing specimens, respectively. The numerals 2.5 and 7.5 denote the percentage of tire additive in the mixtures. Initially, the CSS specimen was prepared by weighing the required amount of sand and carefully spooned into the mold, preventing inconveniences during the placement. When the mold was filled, the top platen was placed on top. The TCS and TBS mixtures were prepared at four different tire contents: 2.5%, 5.0%, 7.5%, and 10% by weight. For each designated mixing ratio, the mass-based proportions of sand and waste tires were determined beforehand. The proportioned materials were mixed thoroughly until the mixtures were homogenized. Then, the specimens were placed into the mold in layers of equal dry mass, without vibration (Figure 3). The top platen was placed ontopwhen the mold was filled and then the tests were launched. The unit weights of the tested specimens are listed in the Table 1.

3. Results and Discussion

Figure 4a shows the shear stress-strain relationship of the CSS specimen under cyclic loading. Experiments on CSS indicate that the shear stress in earlier cycles was at much lower values. The peak shear strength of CSS was developed at relatively larger shear displacements and reached a maximum at the last cycle. As the number of cycles increased, the maximum horizontal stress increased by about 30%, whilst no significant change in horizontal strain occurred. The test was terminated at the end of the 5th cycle as the measured strain value was stabilized. Figure 4b presents the vertical displacement versus the horizontal displacements of CSS specimens under cyclic loading. The specimen exhibited a continuous contraction from the beginning to the end of the shearing process. The increasing vertical displacement caused a fall in the initial density of the specimen. Figure 5 demonstrates the change in volumetric strain during the time elapsed, for five loading cycles of the CSS specimen. The volumetric strain of the specimen increased gradually with the increasing number of cycles. Table 2 summarizes the maximum and minimum shear stress values measured at the end of each loading cycle. The difference between the maximum stress deformations measured in the negative and positive directions, which was 25% in the first cycle, increased to 55% at the end of the 5th cycle. It is accepted that the first quarter of loading initiated in a positive direction and developed an inter-particle locking between crushed sand grains. Due to the inter-particle locking developed in the first quarter of loading, the maximum stress value measured in the negative direction was much less than the measured stress value in the positive direction. The change between the maximum stress values measured in opposite directions, without changing the loading amplitude and the rate, is attributed to this fact. These findings are in harmony with the studies by Cabalar et al. [71] and Cabalar [7,8] in which the shear behavior of CSS is presented in comparison with typical sands.
The increase of shear stress with cycling is a common characteristic of CNL tests [6]. Figure 6 demonstrates the variation of shear stress for CSS and TBS specimens within the measured displacement level. Whether they contain tires or not, it has been observed that the shear stress of the specimens gradually increases as shearing progresses. The maximum shear stress value in the CSS specimen was found to be 150.6 kPa. By investigating the cyclic shear behavior of CSS along with other typical sand types, it is postulated that the physical properties of the sand matrix, which significantly affect the force chain distribution, are the main determining factors on the cyclic behavior [71]. The specimens with tire buffing responded to the loading with lower shear stress values than CSS. The grains on the shearing plane of the clean sand specimen are clamped by the interlocking effect, which causes higher internal friction. However, with the addition of tire buffing, rubber grains that accumulate on the shearing surface, depending on their orientation, facilitate the movement of the surface exposed to load, and accordingly, decreases the measured stress values. The collective demonstration of the results indicates that with the increase of waste material content, the stress-strain response of the mixture to cyclic loading decreases. At the end of the 5th cycle, the maximum shear strain value of the specimens with 2.5% and 10% tire buffing in sand material was found to be 133.5 kPa and 101.5 kPa, respectively. The response of the shearing interface to loading in the initial cycles was lower than the response in subsequent cycles. Accordingly, the slope of the line connecting the two extreme points of the hysteresis loop, which is equal to the secant modulus, increased with the progress of loading cycles. The maximum and minimum horizontal stresses measured at the end of each loading cycle affects the systematic increase in shear strength with the number of loading cycles (Table 3).
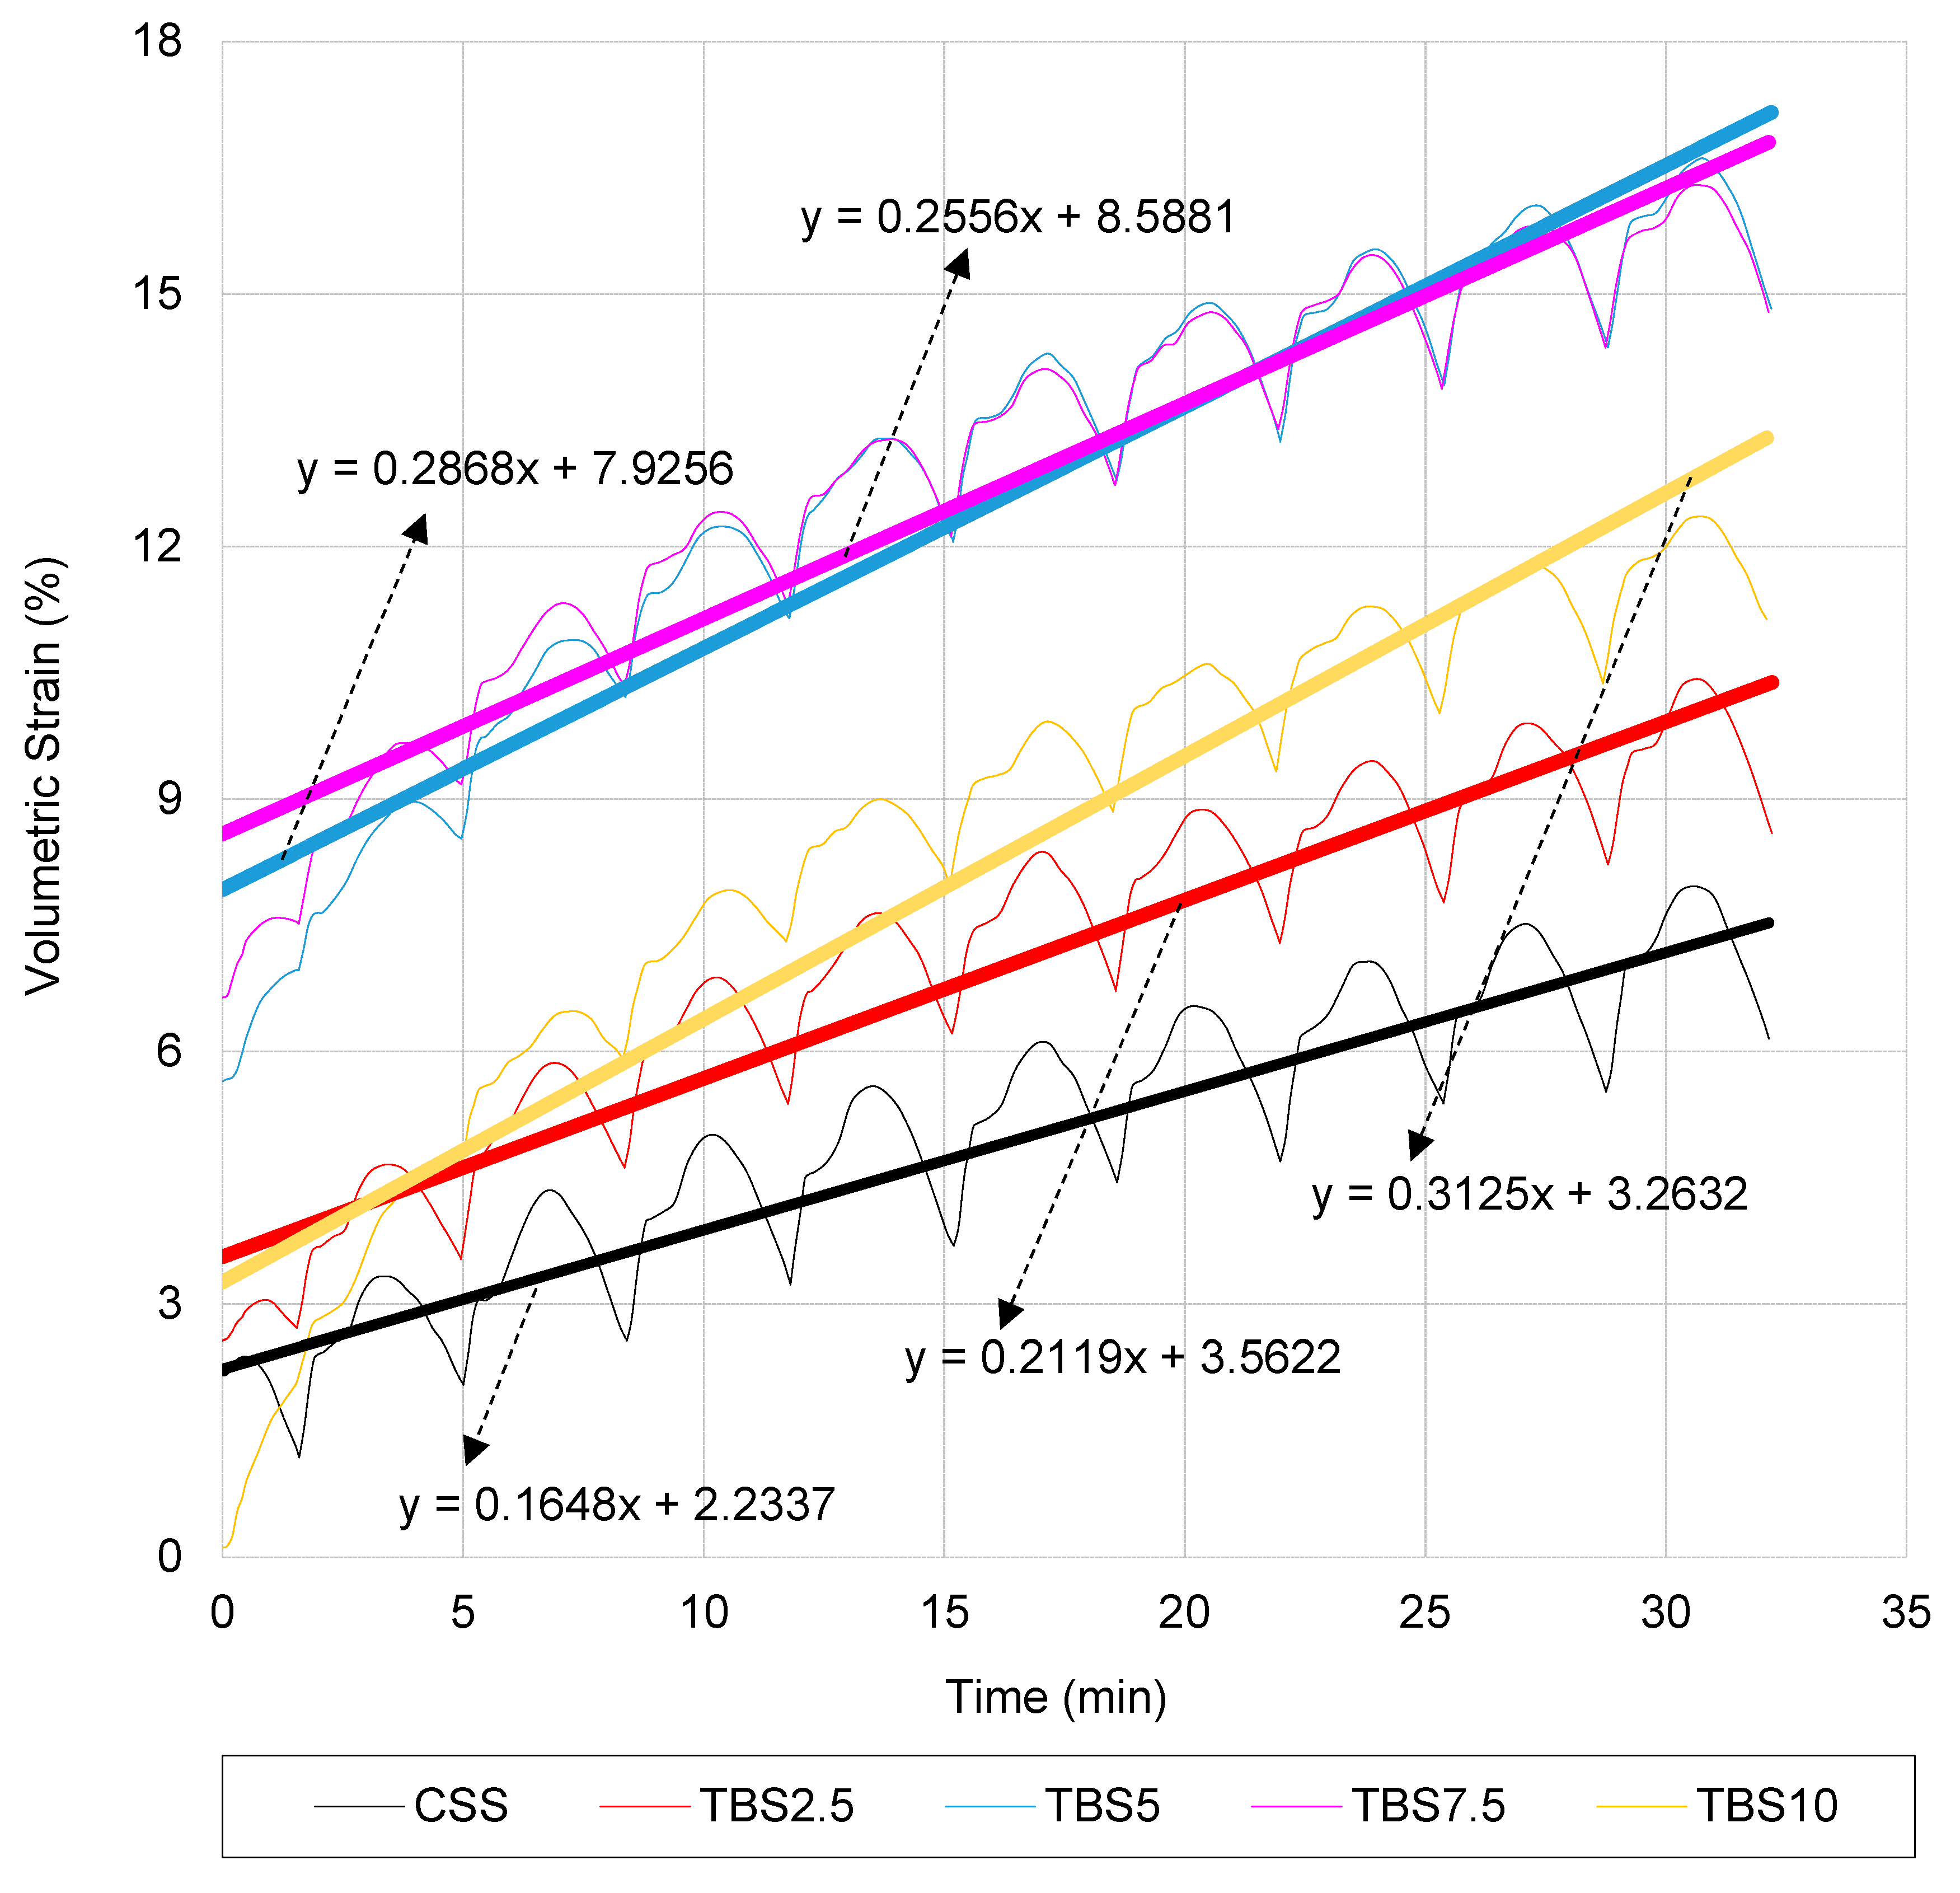
In general, shear tests are used to establish the stiffness, strength, and volumetric relations. Depending on several factors such as density, shear displacement, and stress level, the volumetric behavior emerges as an indicative feature for interfaces [6]. The change in volumetric strain along the time elapsed for five cycles of loading is presented in Figure 7. As can be seen, all samples showed the same trend of contraction as a response to cyclic loading. At initial cycles, the volumetric strain of the CSS specimen was 2% which then reached up to 6%, as shearing progressed. The inclusion of tire buffing leads to an increase in the rate and amount of volumetric change. The final volumetric strain was measured in TBS2.5, TBS5, and TBS7.5 specimens at 10%, 16% and 17%, respectively. There was no significant difference between the measured strains by TBS5 and TBS7.5. However, compared to TBS7.5 (i.e., 17%), a decrease of around 35% was observed in the final strain amplitude of TBS10 (i.e., 11%). It seems that tire buffing grains, at contents higher than 7.5%, prevent the closure of the voids in the sand matrix, with the fibrous shape and the covering effect it creates. This causes a decrease in volumetric strain at buffing rates higher than 7.5%. In their study on sand-rubber shredding mixtures, Foose et al. [55] stated that there was no clear relationship between shred content or shred length and volume change, but they did observe a greater contraction in specimens with shred content rather than clean sand. Although a smooth relationship between tire content and volumetric change could not be observed, it is understood from their studies that the addition of tires leads to a volumetric increase depending on the orientation of the tire in the shearing plane. Unlike sand, the deformation characteristics of shredded tires are controlled by two mechanisms: particle compression and particle rearrangement. In light of previous investigations, the observed volumetric change of sand-buffing mixtures is attributed to the deformation of tire materials and volumetric change in pore spaces. Considering all tested specimens, it was observed that as the cyclic shearing progressed, this volumetric expansion occurred along the shear interface raised to its maximum with 5% and 7.5% buffing inclusion, but saw a decline with the addition of rubber more than 7.5% tire content (i.e., 10%).
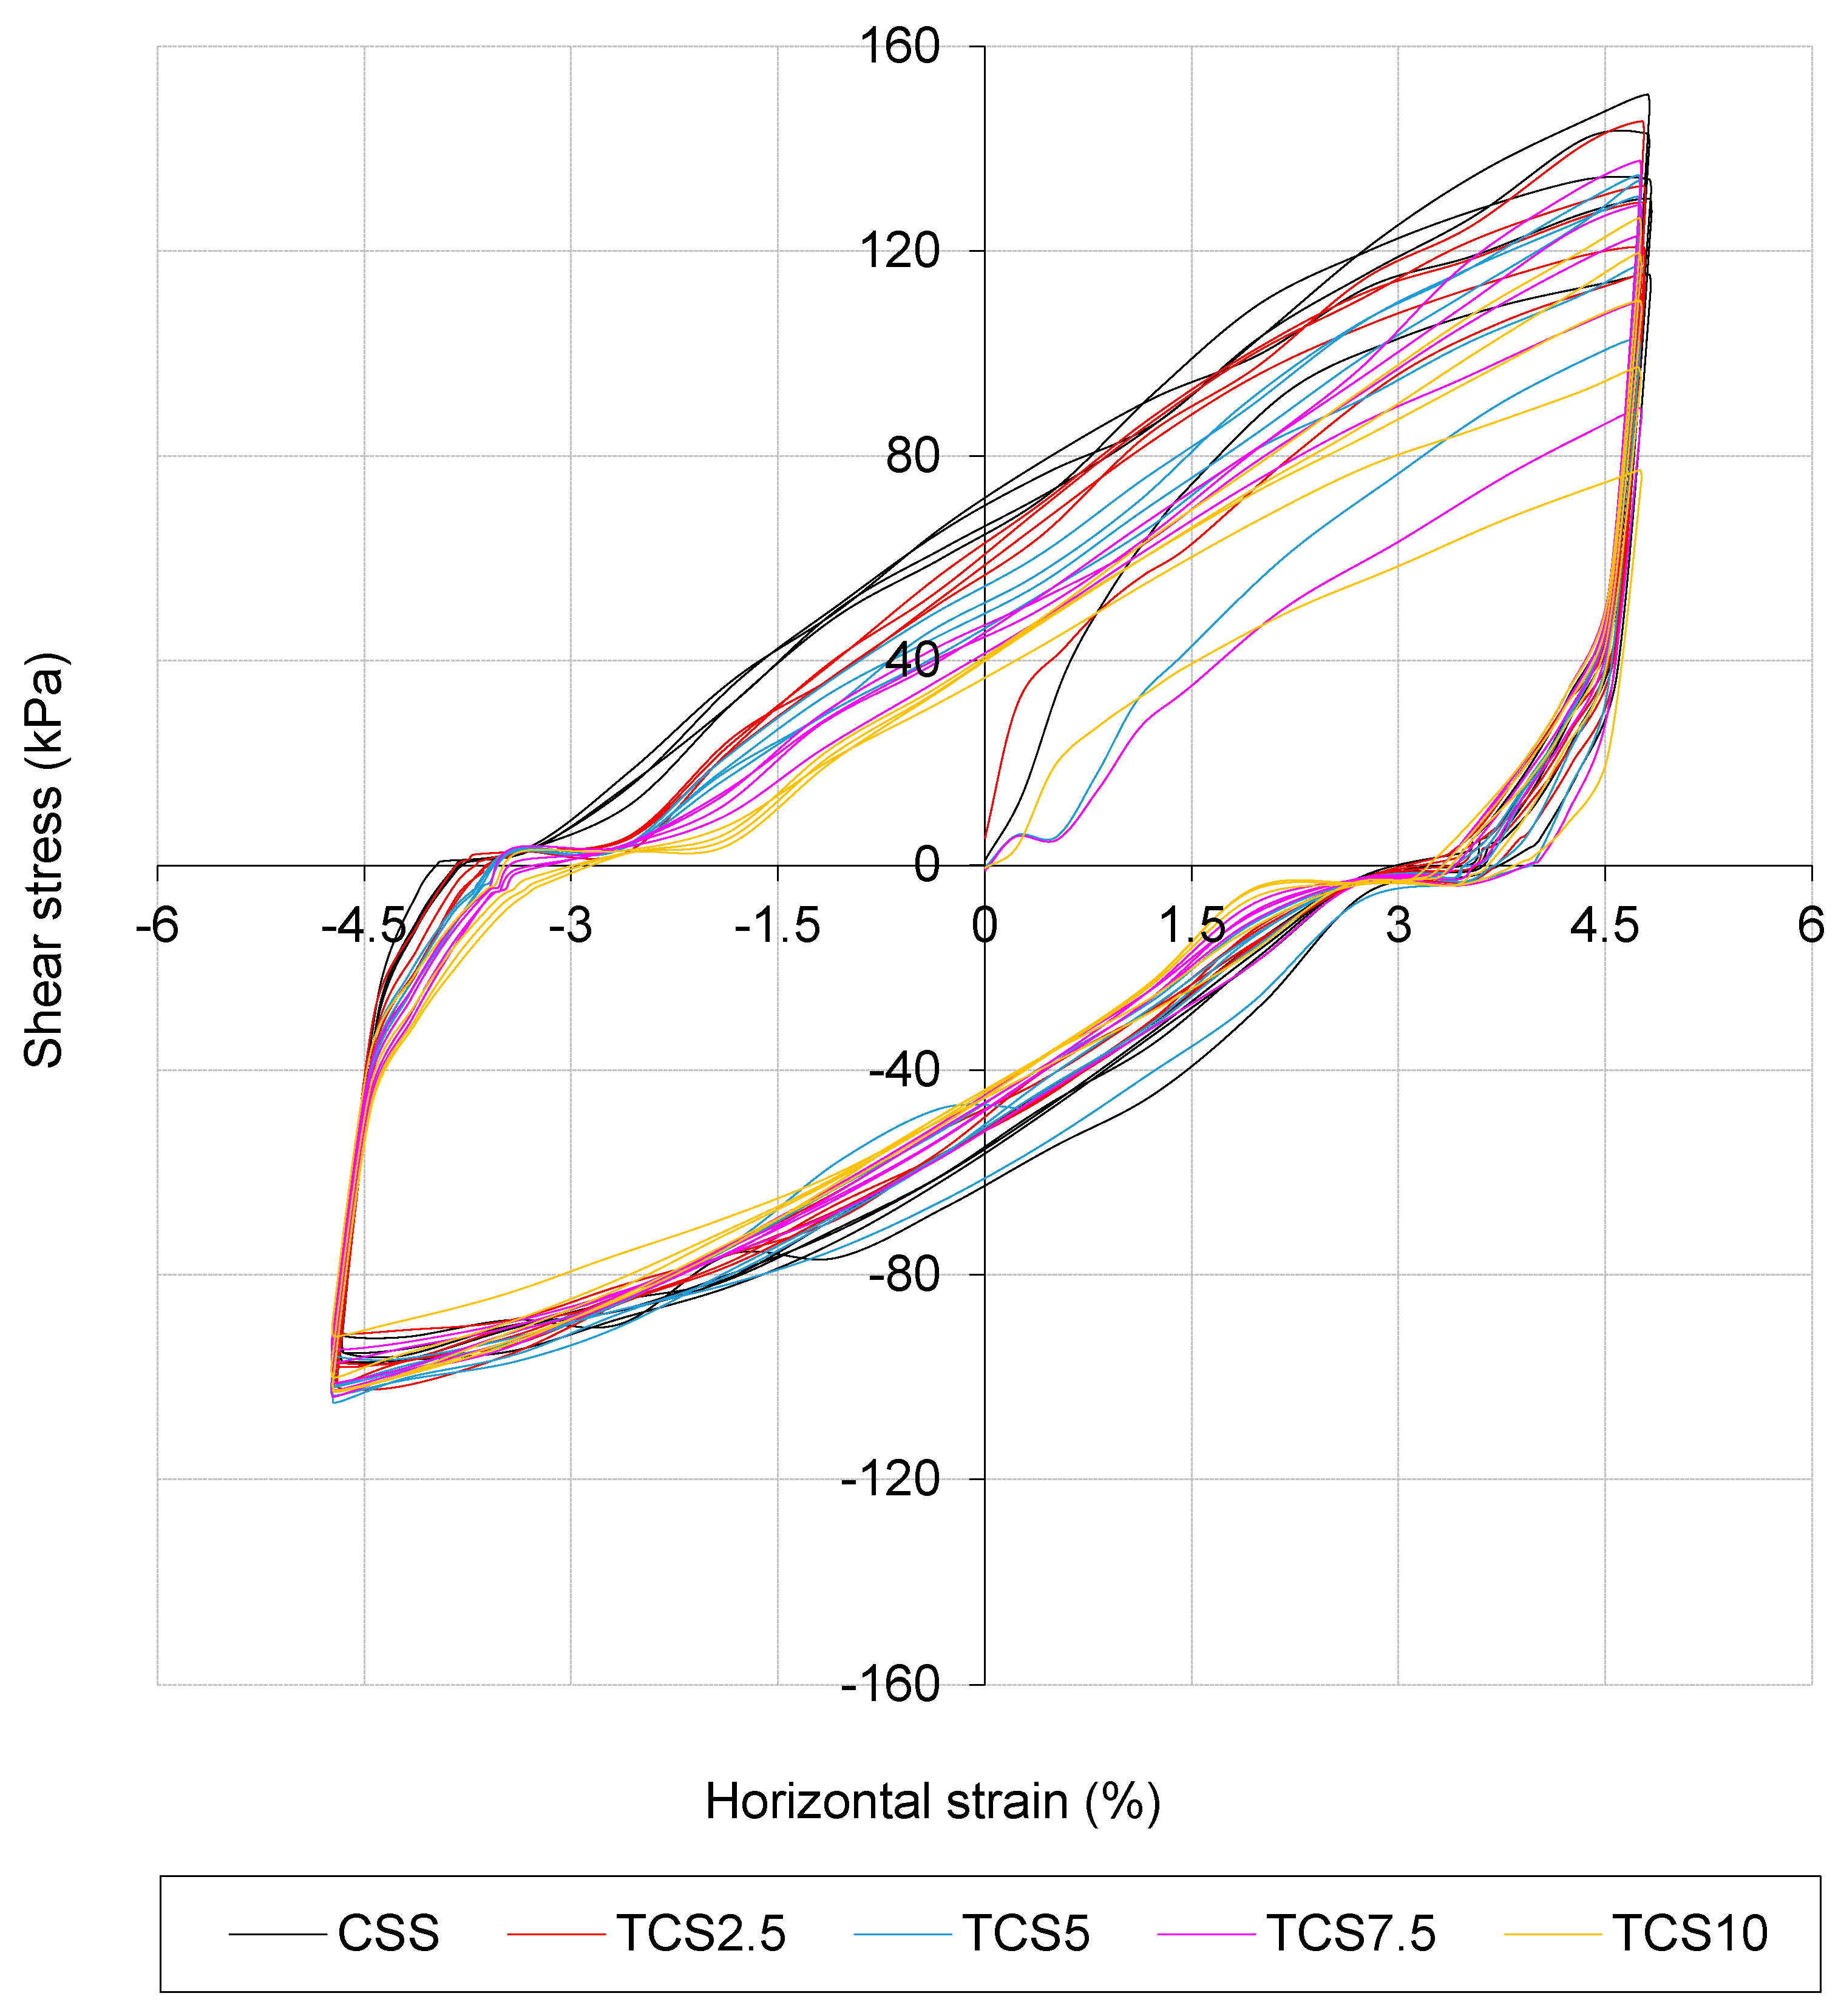
To see the effect of the tire crumb on the stress-strain behavior of CSS, a combined plot of shear stress versus shear strain relationships of CSS and TCS specimens at four tire contents (i.e., 2.5, 5.0, 7.5 and 10%) is presented in Figure 8. The maximum shear stress at the end of the 5th cycle was measured as 150.6 kPa by a clean CSS specimen. The inclusion of tires caused a decrease in the maximum stress amplitude. At lower mixing ratios, the decreasing effect of the rubber is less; however, as the ratio of the rubber introduced to sand increases, the decreasing effect becomes more pronounced. Anvari et al. [64] stated that sand and rubber grains tend to lock together in low contents of granulated rubber-sand mixtures. However, at higher contents, the granulated rubber grains tend to roll and slide over sand particles. In contrast with the authors, with increased rubber content in the mixture, the shear stress underwent a continuous reduction. The greater rubber content in the mixture led to greater contact surface between sand and granulated rubber particles. Since the interaction strength between sand and rubber particles is lower than that of sand particles, the higher introduced rubber content exposes strength reduction in the specimen. As such, the behavior of sand-rubber mixtures has been evaluated as either sand-like or rubber-like. Sand controls the behavior if the volumetric proportion of tire crumbs is less than 30% in the mixture, and rubber forms the skeleton, if the volumetric proportion of tire crumbs is above or equal to 60% [44]. These results are similarly observed by previous researchers [66,75,76,77,78]. The summary of the maximum and minimum horizontal stresses measured at the end of each loading cycle for tested specimens is given in Table 4.
Figure 9 shows the change in volumetric strain along the time elapsed for the entire cyclic loading. As can be seen, all tested specimens showed the same trend of contraction, as a response to cyclic loading. The inclusion of granulated rubber to finer-grained sand generates looser media. Therefore, the increasing rubber content in the mixture requires higher shear displacement to mobilize the volume of the specimen [66]. This result is also in agreement with Foose et al. [55]. The volumetric strain was measured as 6.2% by CSS specimen. As in the case of the TBS specimens, regardless of the content of the additive, all TCS specimens exhibit higher values of volumetric strain under the applied loading. The addition of tire crumb at 2.5% and 5% content has an almost equal effect on the volumetric strain of sand, by increasing it by 30%. However, the increasing effect of tire crumb on the strain amplitude becomes more pronounced at higher tire contents. The volumetric strain values were measured as 13.6% and 16.4% for TCS7.5 and TCS10 specimens, respectively. As the ratio of tire crumb in the mixture increases, an increasing upward trend was observed in the volumetric strain. The main mechanisms that affect the response of soil/rubber mixtures are controlled by the soil-to-soil and soil-to-rubber interfaces. Since the rubber-to-rubber interfaces are quite few important, the overall response of the sand-rubber mixtures is controlled, in the case of low percentages of rubber, by the soil skeleton. Whereas, for low to medium percentages of rubber, the specimen response is controlled by the soil-to-rubber solid matrix.
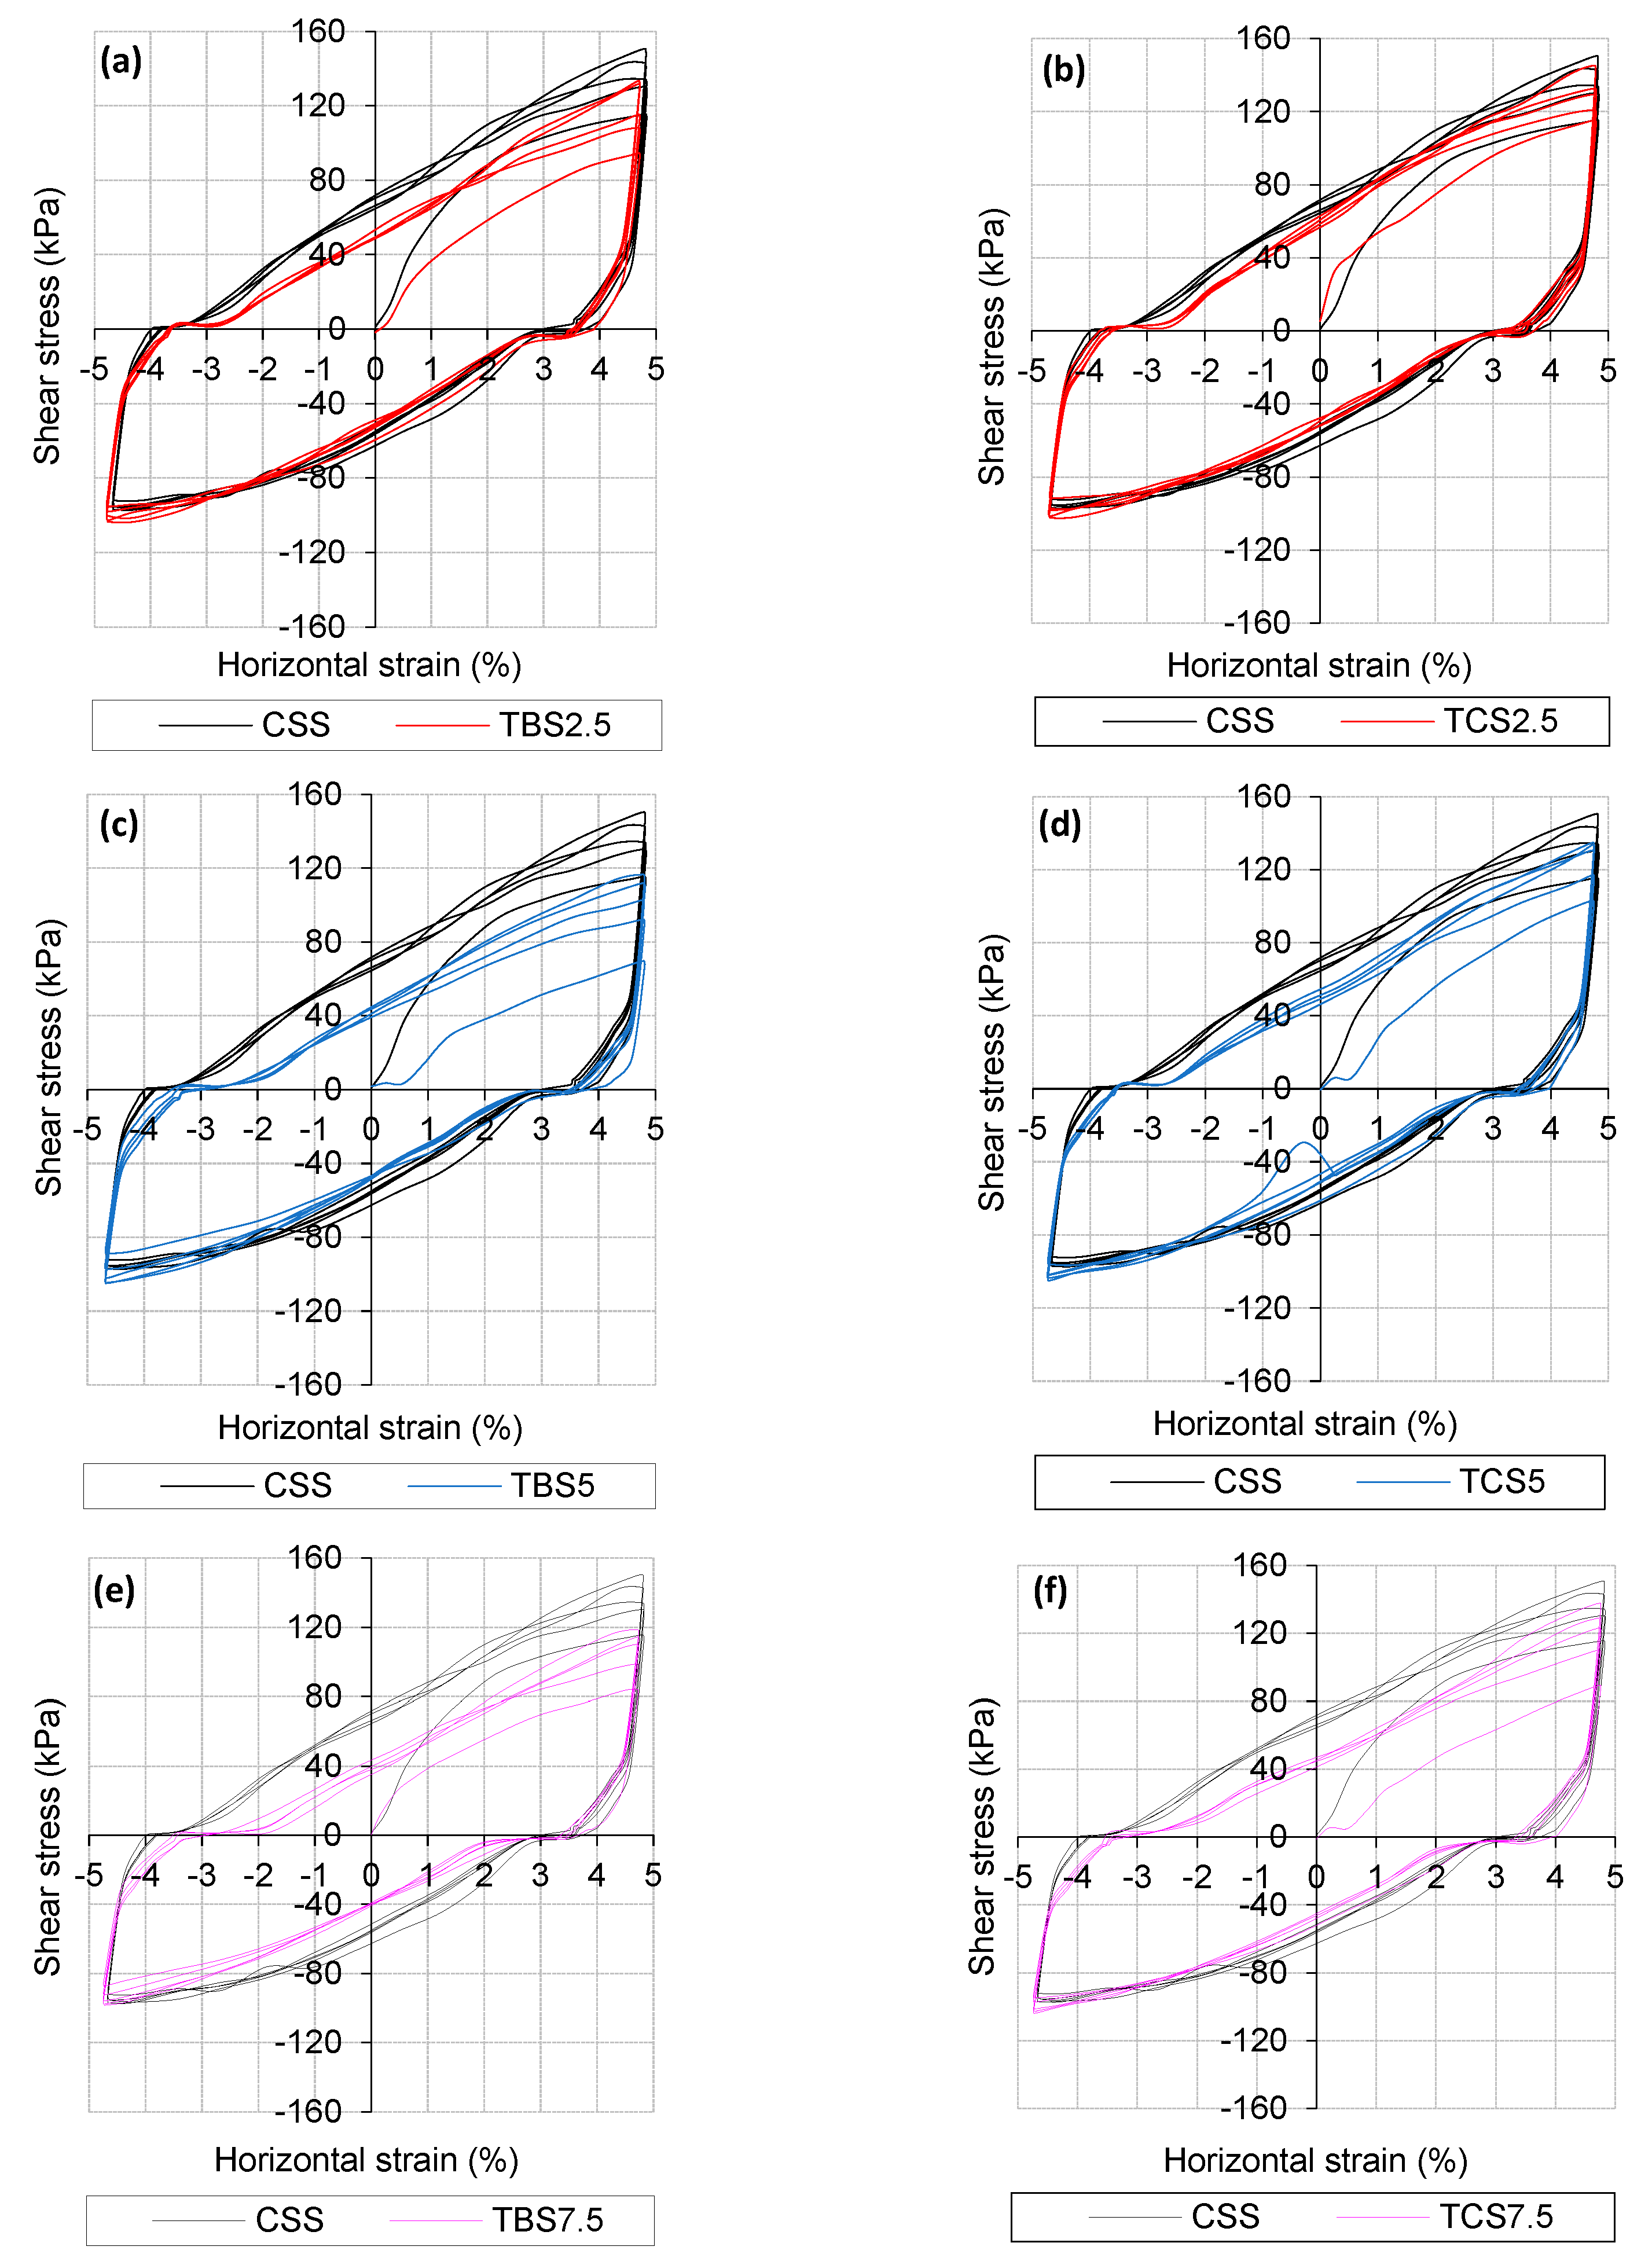
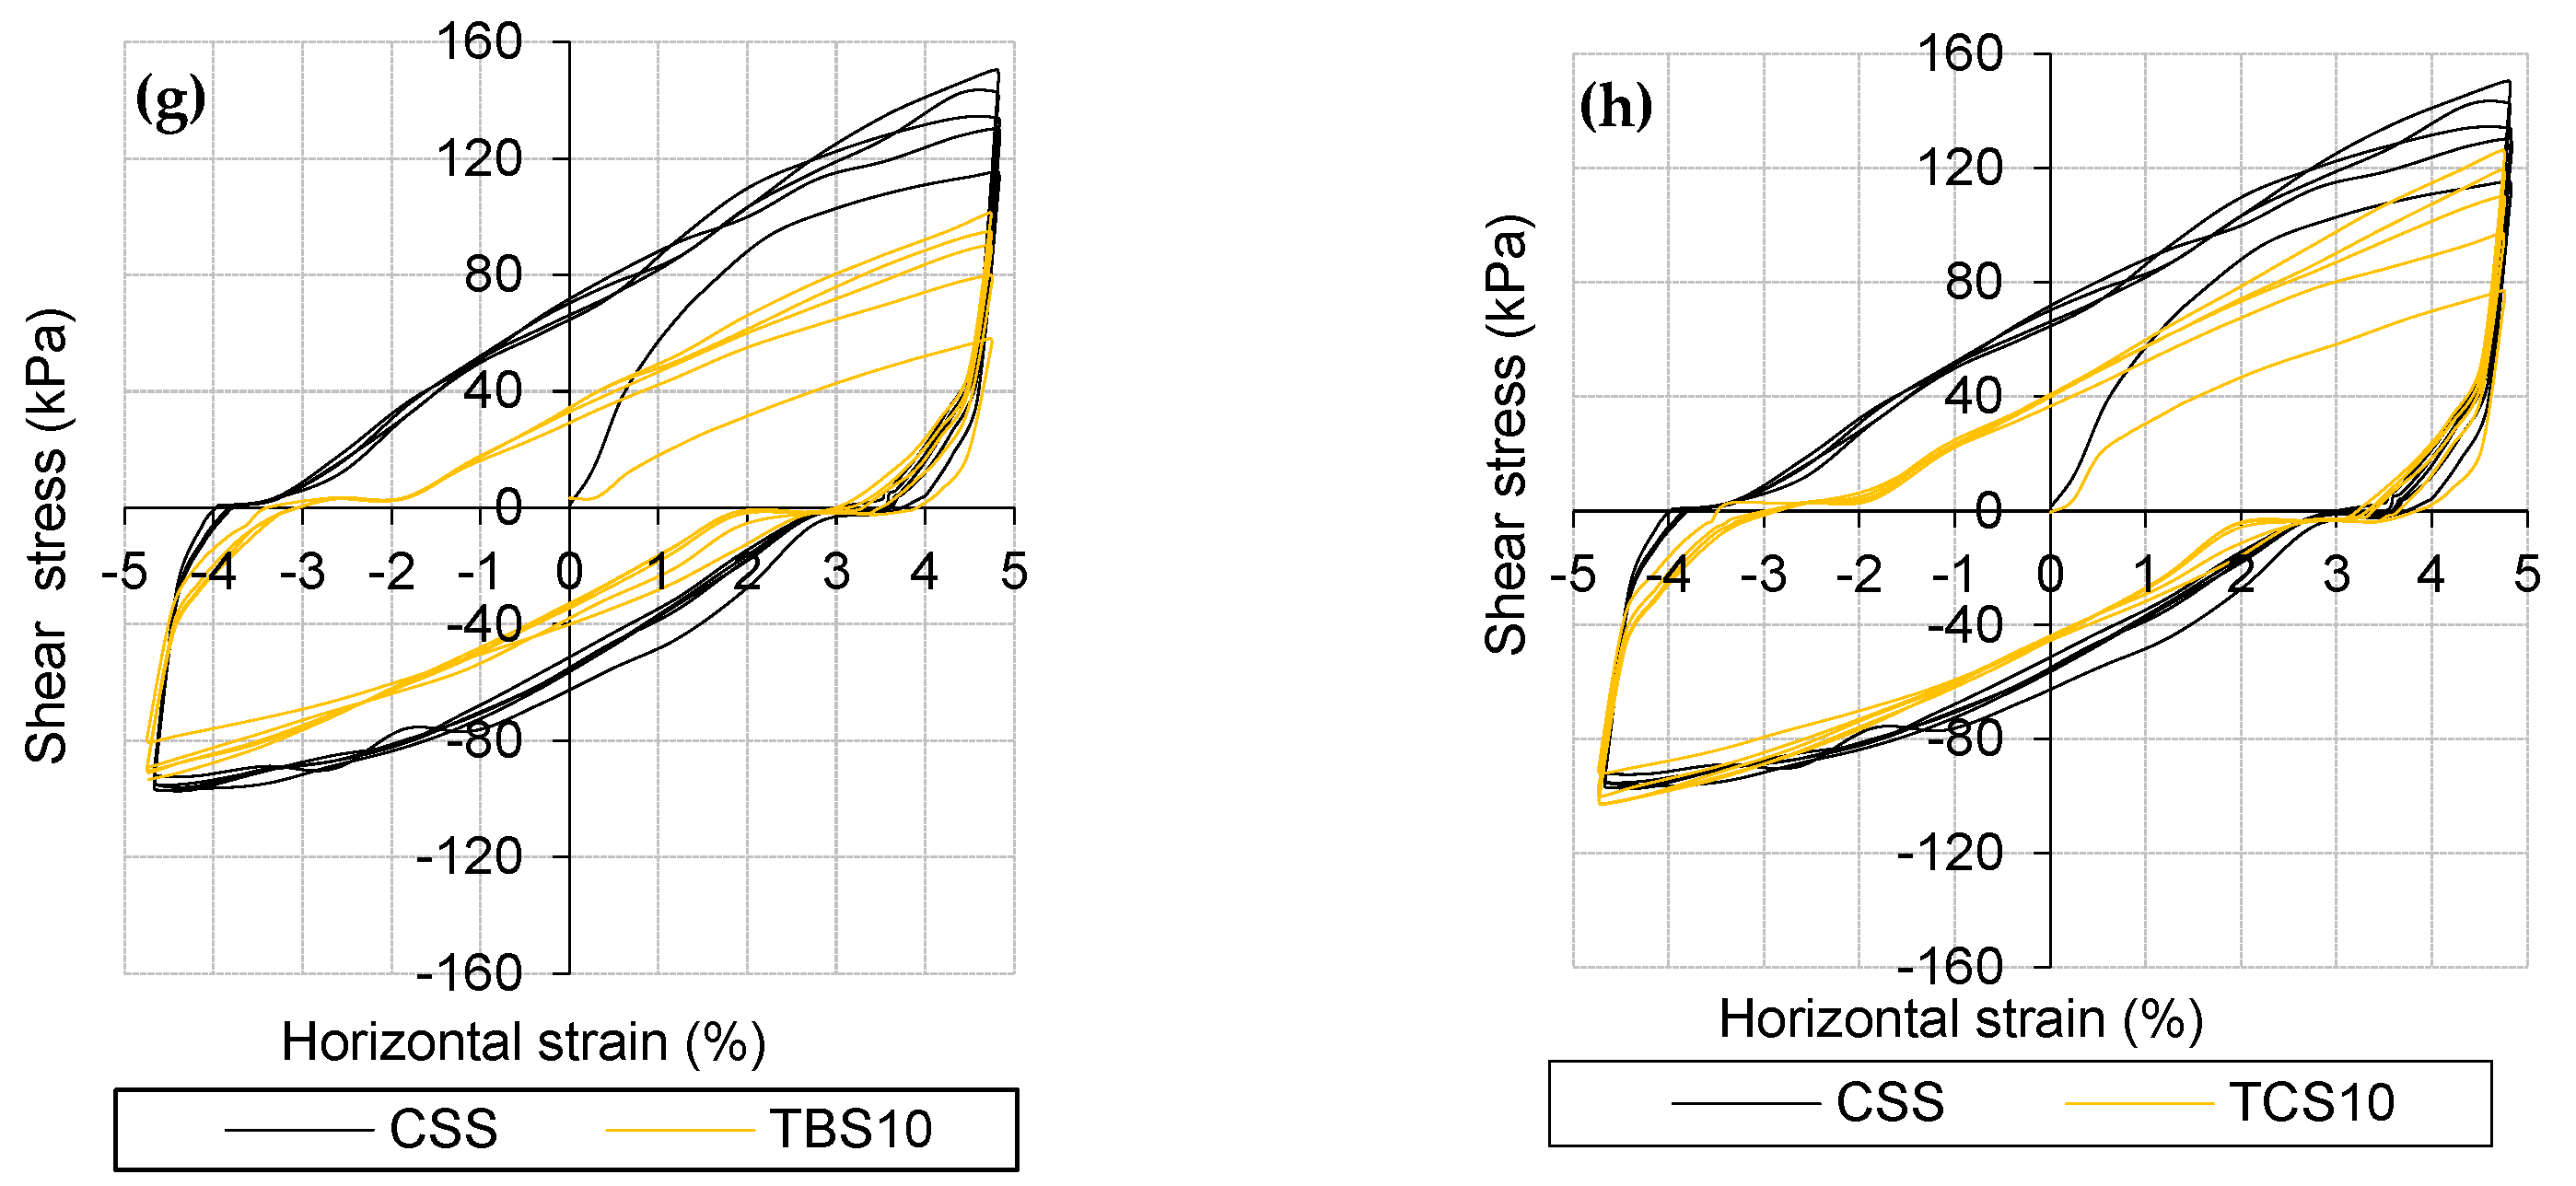
The variation of shear stress with horizontal displacement for pure CSS and tire included specimens is presented in Figure 10. A collective demonstration was made to show clearly the difference between the responses of the shearing interface with the addition of crumb and buffing materials to the sand in different proportions. To make an inference on the effect of rubber inclusion, the results are superimposed over the results of clean sand. Experiments on the specimens demonstrate that the shear stress in earlier cycles was at lower amplitudes. However, it exhibits a continuous increase with progressing cycles, then reaches a maximum at the last loading cycle. The rate of shearing was high enough (i.e., 2 mm/min), therefore, the stress-displacement curves were smooth, and no stress fluctuation was observed in any of the tested specimens. In almost all the literature studies performed with sand-rubber mixtures, it is postulated that the shear behavior is the function of relative density and rubber content in addition to other parameters [7,16,59,60,66,78,79]. Anvari et al. [64] concluded that at relatively lower densities, the shear strength of the mixture tends to decrease with rubber content exceeding 5%, while in mixtures at each granulated rubber content with higher relative densities, the shear strength is lower than of clean sand. In this study, the addition of both TB and TC, regardless of the content, caused a noticeable reduction in the measured shear stress. With the increase in the amount of additives, the reducing effect on the shear strength also increased. For example, the maximum shear stress for CSS was 150.6 kPa, while it was measured as 145 kPa for TCS2.5 and 126.5 kPa for TCS10. The increase in density results in a higher amount of tire in the specimen, which constitutes a greater contact surface between sand and tire particles. The lower interaction strength between sand and rubber particles is defined as lower interlocking property [66,78,80,81], which displayed a reducing effect on the shear strength of specimens. It should also be noted that the crumb material affects the behavior mechanism of the mixture with its energy dissipation feature, and the buffing material with the frictional surfaces formed between sand grains. Another remarkable testing result is that, for each tire content, the maximum shear stress measured by TBS specimens was lower than that measured by TCS specimens. At the same additive content, the higher stress reduction with the addition of TB compared to TC is attributed to the fact that both materials have different gradations and shape properties on their own. These properties affect the behavior under cyclic loading with CSS used as the host material. The voids created by granular-shaped TC grains were occupied by crushed stone sand grains, which resulted in higher shear resistance than fibrous-shaped tire buffing. In this context, Cabalar [8] may also be examined for the behavior of CSS and other clean sand specimens, under cyclic loading. Based on the experimental results, it seems that the addition of both TB and TC at determining content has fewer effects on horizontal strains.
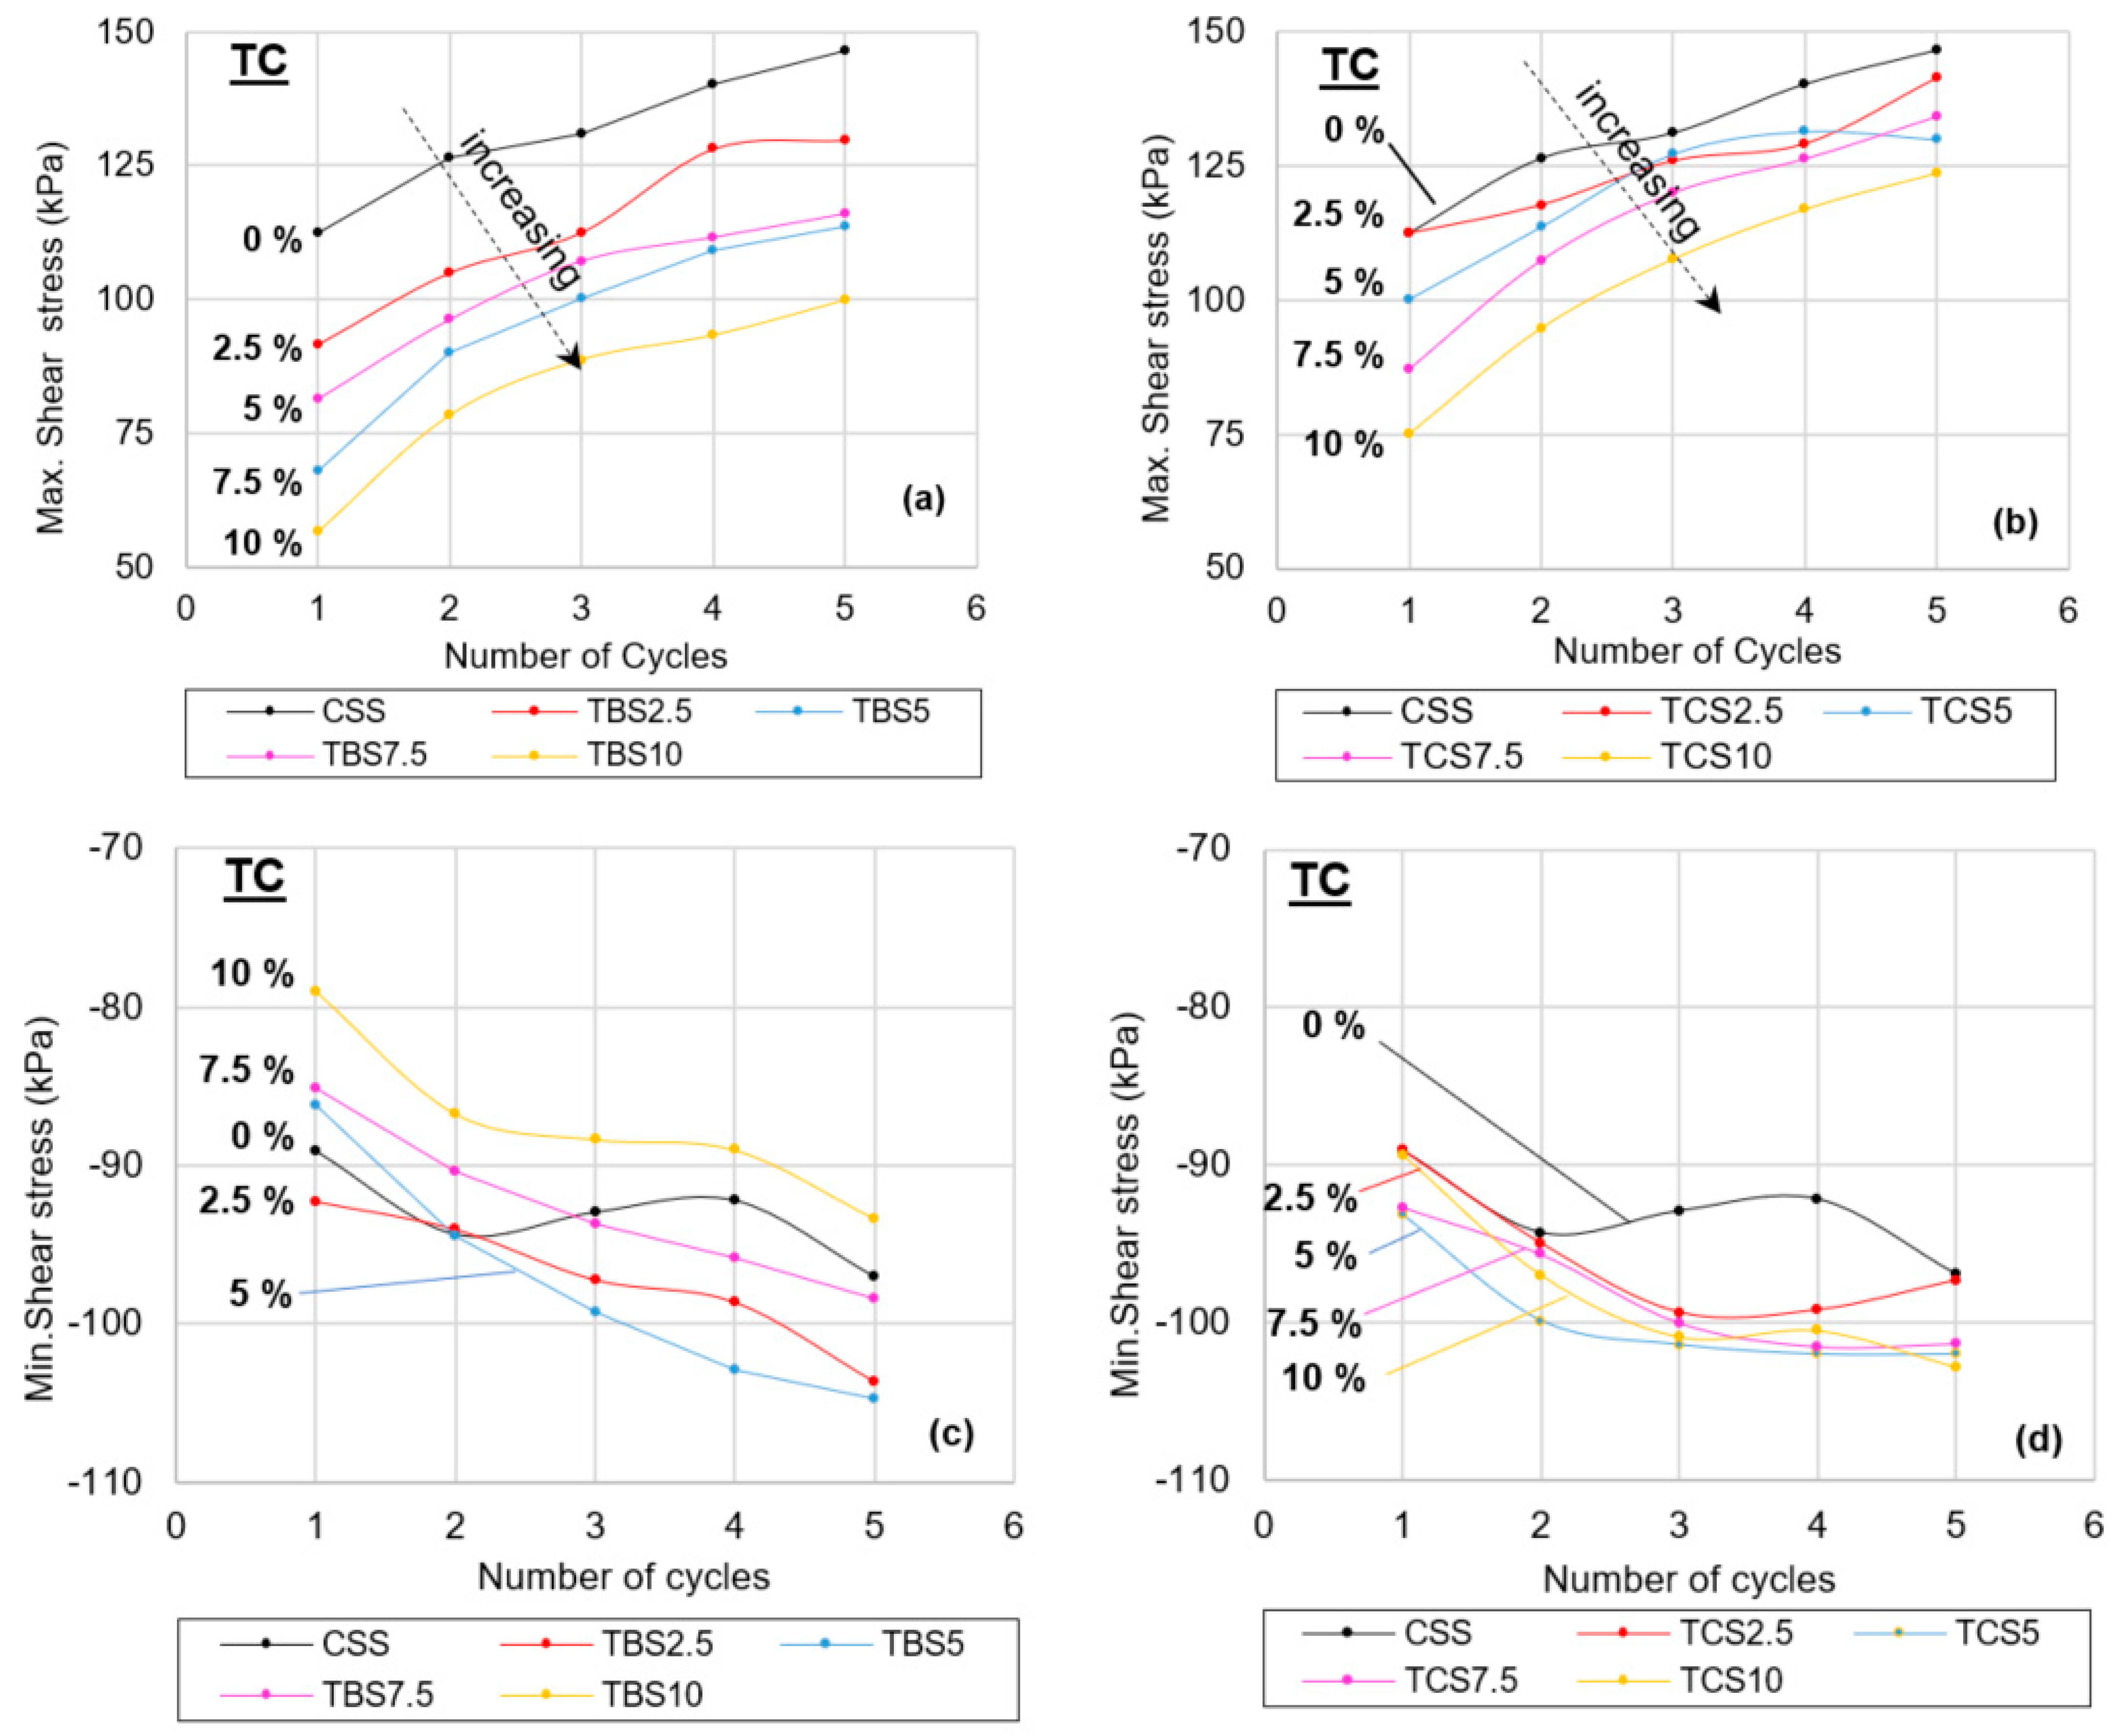
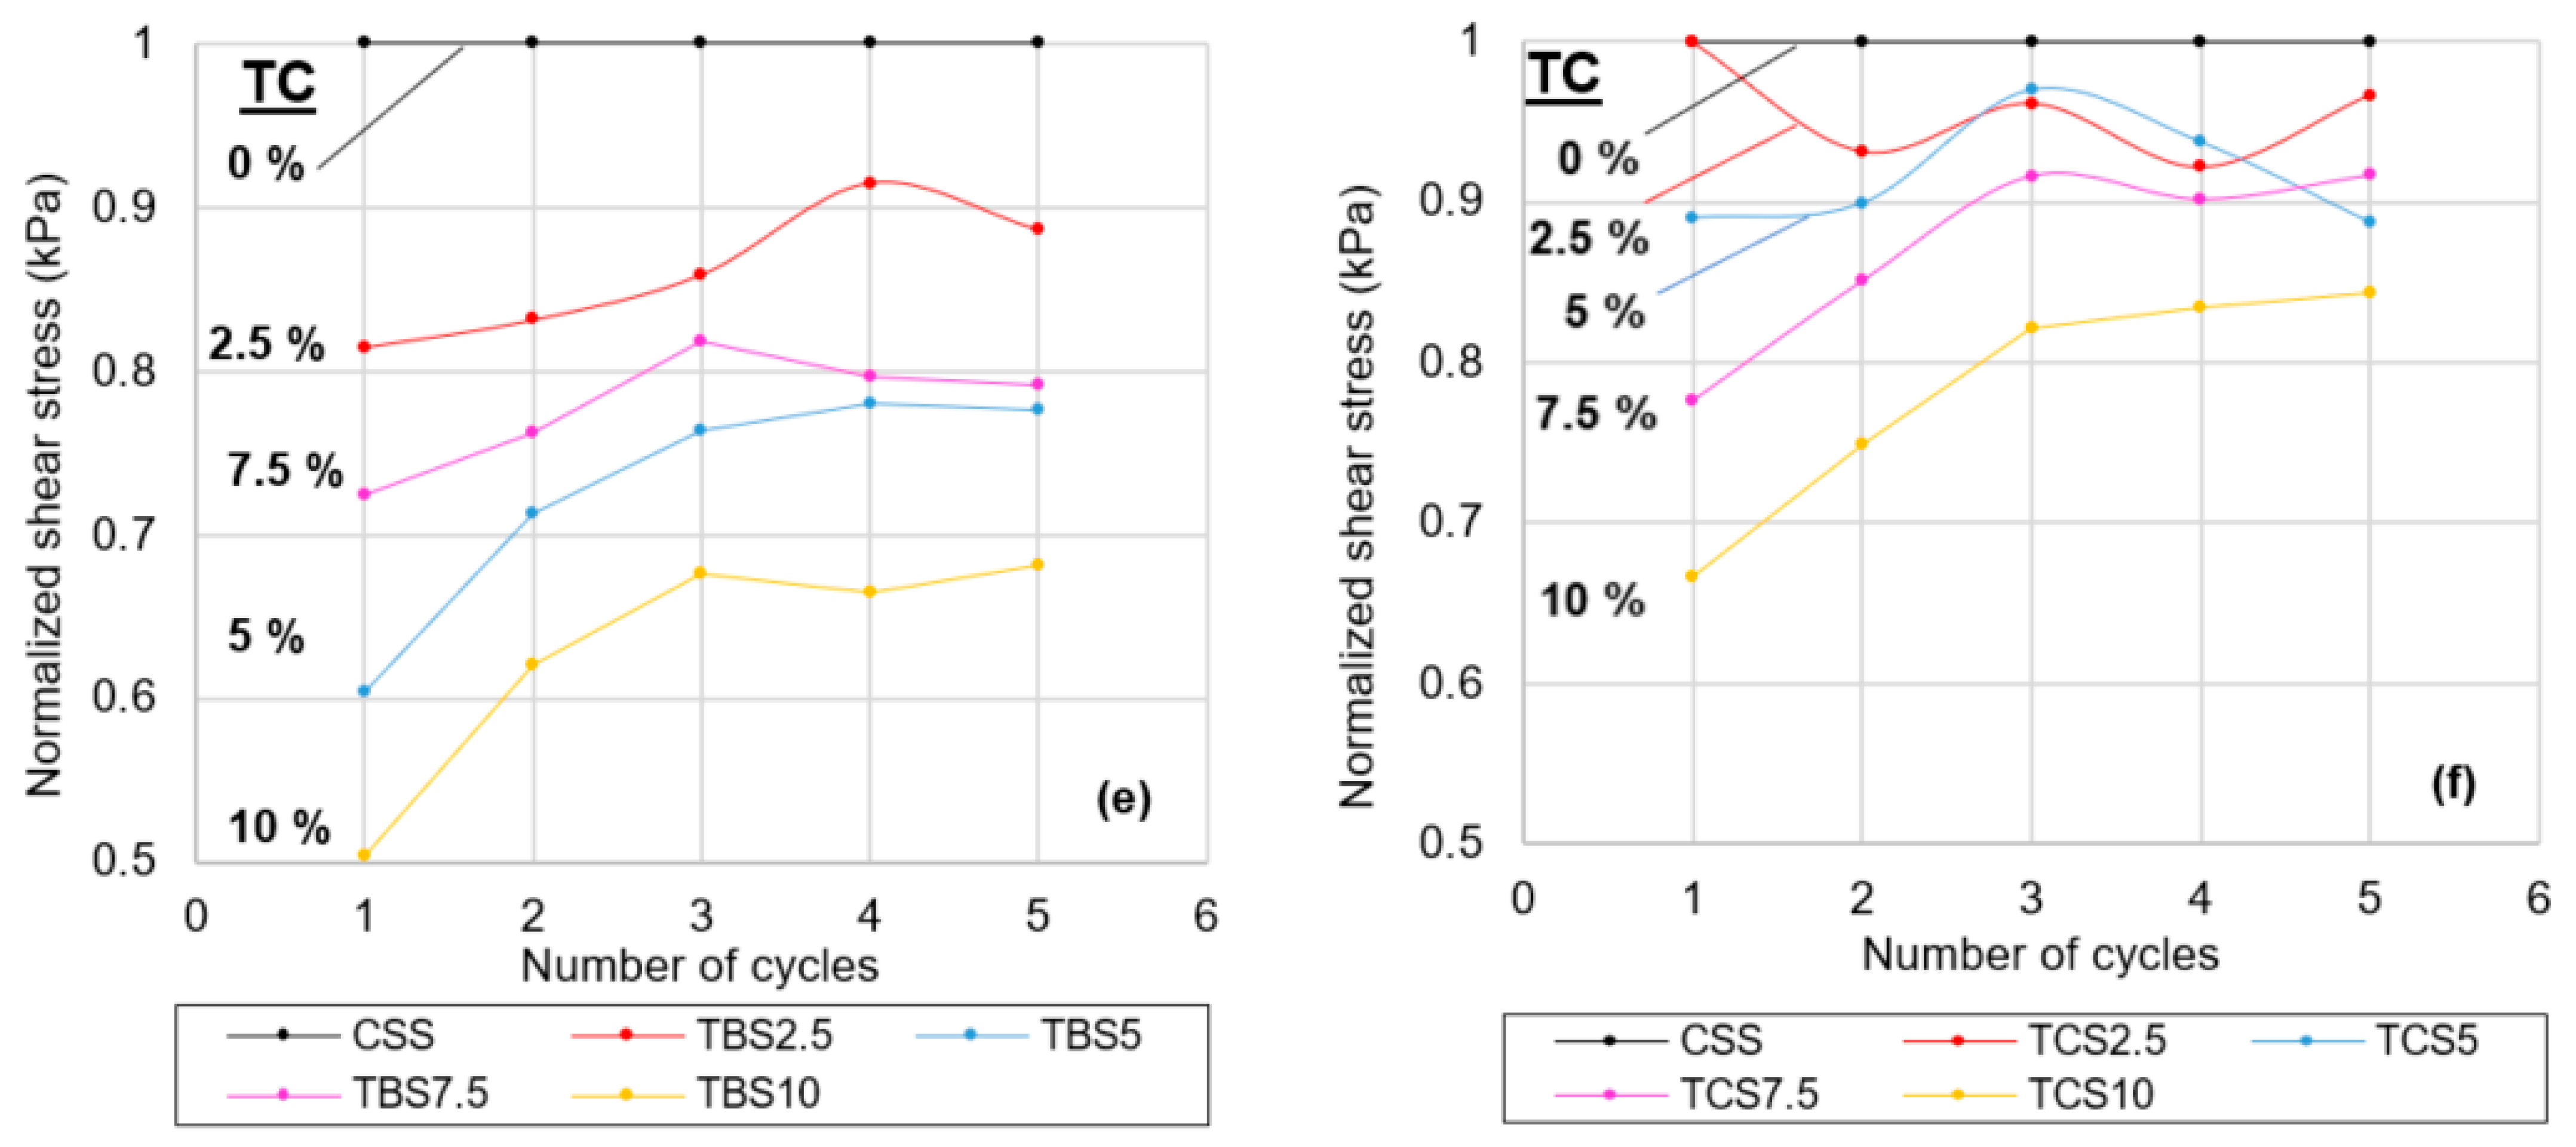
The variation of the volumetric strain of the specimens demonstrated that either clean sand or tire-included specimens displayed contraction through shearing. However, particularly at lower additive contents, this was more evident for TBS specimens. Foose et al. [55], while evaluating the results of their extensive studies with tire shred-sand mixtures, stated that there was no clear relationship between shred content and length and volumetric change. Edil and Bosscher [16] linked the reinforcement effect of tire chips to their orientation along the shear plane. The amount and orientation of the tire particles in the shear plane, which mainly depends on the determined content and density, has a significant effect on the shearing response. Although the different shearing responses of sand-buffing and sand-crumb mixtures prepared at the same content can be explained by the different shape properties of both materials, this should not be ignored. Vertical displacements measured at the end of the 5th cycle demonstrated that regardless of rubber type and ratio in the mixture, the measured vertical displacement in each specimen tested showed higher values than that of the clean sand specimen (Figure 11). Similar results were revealed by numerous researchers conducting shear tests with reinforced sands [55,79]. Depending on its granular structure, it was observed that the crumb grains initially filled the voids at lower contents and increased the normal displacements, under the shearing effect at higher percentages (i.e., TCS10 and TCS7.5). However, due to its fibrous shape, the same effect occurred in all TBS specimens regardless of the content. The maximum and minimum shear stresses measured at the end of each cycle and the variation of the normalized shear stress with the number of cycles are shown in Figure 12. The progressing number of cycles led to increased extreme stress values for each tested specimen. The decrease in shear strength of specimens with increasing rubber content can be attributed to the redistribution of the mixture fabric. The increase in the contact surface between the sand and the rubber particles, with the increasing rubber content, results in a decrease in the contact area between the sand particles. A slight reduction in shear stress was observed with the addition of 2.5, 5 and 7.5% rubber, while the reduction in shear stress became more evident at mixing ratios of more than 7.5%. The mechanism of load transfer in mixtures depends on the skeleton material [44]. This mechanism is explained by the formation of a skeleton when particles of the same material come into contact with each other and transfer stress. The material or pair of materials that make up the skeleton becomes the matrix material, which determines the overall mechanical behavior of a mixture. Two matrix formations can be indicated for rubber-sand materials. The first one is sand matrix, characterized by stiff sand like behavior [70]. The second one is the rubber matrix, which is the soft rubber like behavior that determines the overall behavior of specimen. It seems that in 7.5% larger rubber contents, the mixtures transfer from a sand like behavior mechanism to a rubber like behavior. The difference between shear behavior of the mixtures containing crumb and buffing rubber is explained with the grain size, shape, and aspect ratio differences. The processing type is accepted as an essential factor affecting the dynamic behavior of rubber material [18]. Due to its granular shape and crumb rubber, which has a larger contact area between particles, absorbs higher energy in the mixtures, while fiber shaped rubber induces higher friction between the sand grains. This results in TCS specimens showing higher shear strength than TBS specimens for the same ratio.

4. Prediction Model

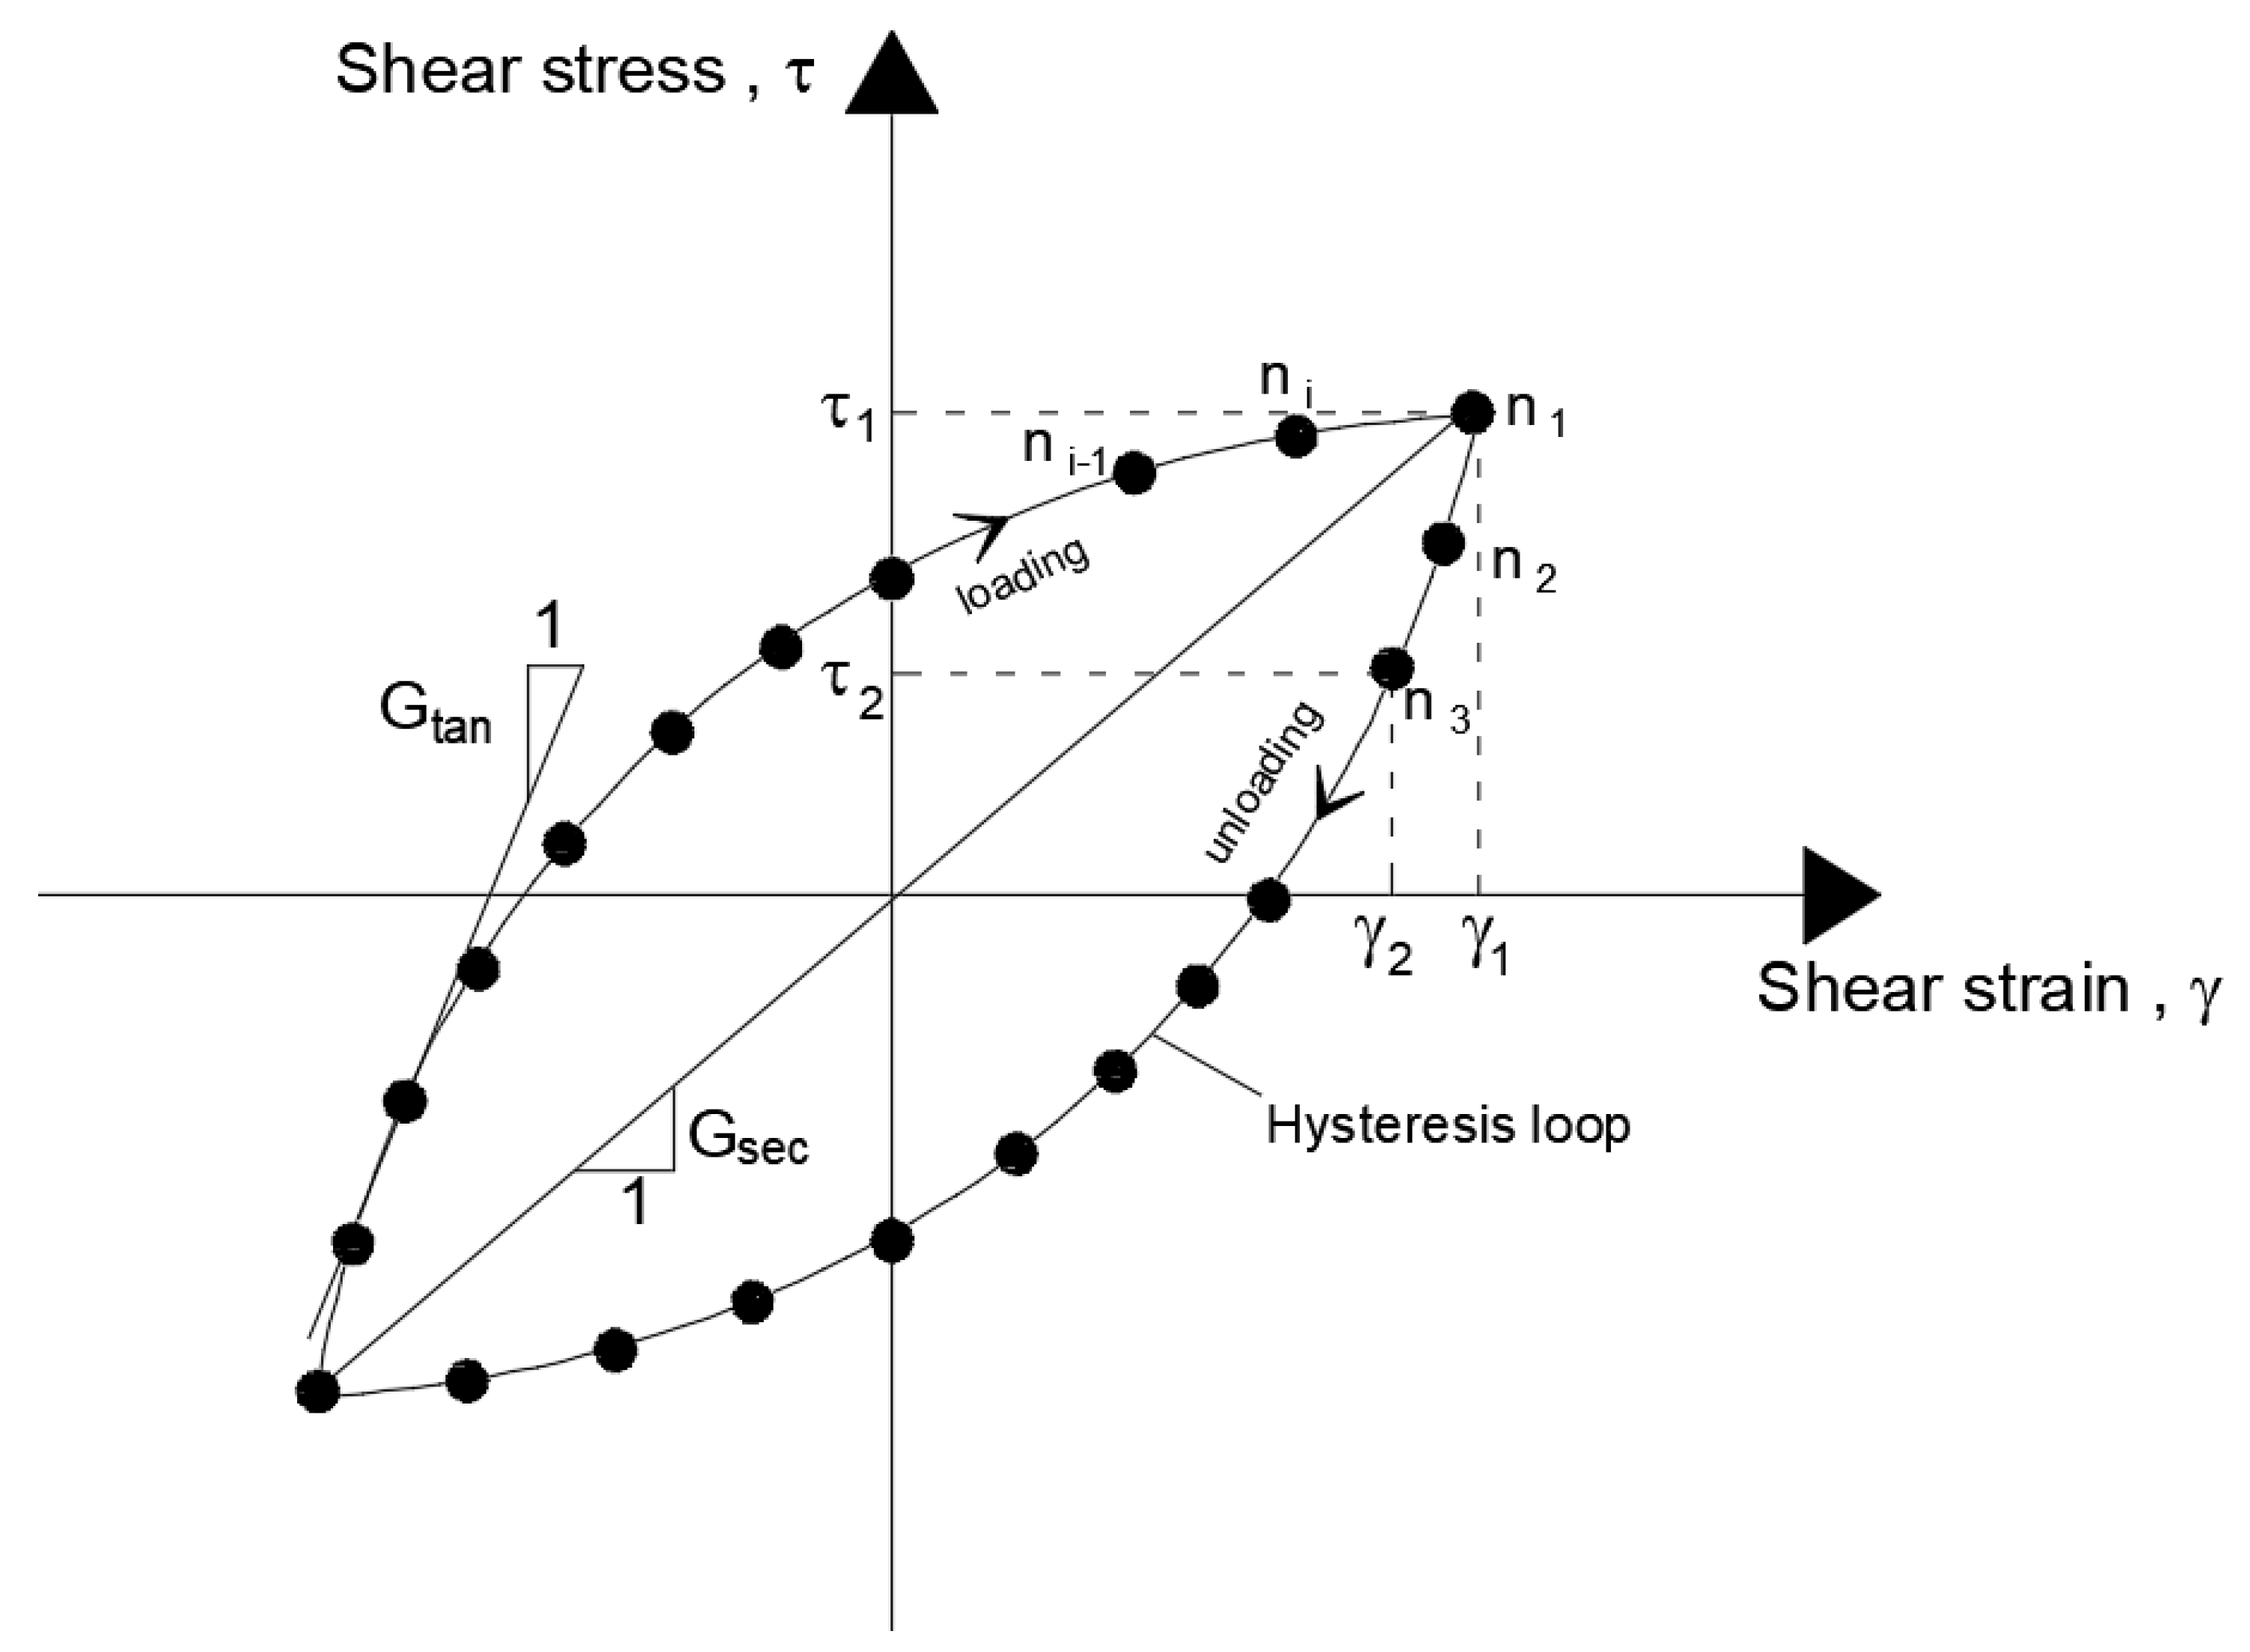
A neural network-based prediction model was developed to predict the cyclic behavior of the sand-rubber mixtures. Bayesian Regularization Neural Network (BRNN), a robust version of artificial neural networks (ANN), was developed as a prediction model. In contrast to ANN models, the BRNN models have a higher generalization and conversion ability due to their threshold value, which mainly eliminates the unrealistic weight values. Thus, the overfitting problems of the ANN model is largely avoided. In this type of data processing, the validation process is redundant. The architecture of the network is determined as 1 input layer, 2 hidden layers, and 1 output layer. A total of 5 neurons are defined in each hidden layer (Figure 13). While determining both the number of hidden layers and the number of neurons in these layers, a large number of analyzes were performed, and the optimum design was obtained by prioritizing both the prediction success and the fastest analysis time. The input parameters were defined as shear strain, normal stress, vertical displacement, tire content, and rubber type. The output parameter is set as shear stress. Shear stresses, which are the output of simulations, are obtained as a result of an estimation process rather than a calculation. This process consists of estimating the values that a data set can take, with a robust prediction model trained with real experimental data. The output parameters in the test data set are estimated by the relations that the model derives between the input parameters and the output parameters of the training dataset. Each hysteresis loop of TCS and TBS samples was discretized into 57 nodes, on average, and a data set for the corresponding sample was generated by the data of each nodal point. In total, 455 data points for 8 specimens (i.e., TCS2.5, TCS5, TCS7.5, TCS10, TBS2.5, TBS5, TBS7.5, and TBS10) were generated. The schematic representation of the discretized loops is shown in Figure 14. The feed-forward back propagation network type is adopted in the network. The back propagation algorithms were first introduced by Rummelhart [82], and defined as the algorithm adjusting part of the weights of the connections in the network, to minimize the error value. The tangent sigmoid function is used as a transfer function of the developed model. The advantage of the tangent sigmoid transfer function used in this study, compared to other functions, is that its derivative is steeper, covering more values, enabling faster learning. The Levenberg–Marquardt training function is used for the training process of the network. Model performance was evaluated in terms of MSE and R2 values. In cases where the performance is not sufficient, the architecture of the network is rearranged and training, validation, and prediction processes are renewed (Figure 15).
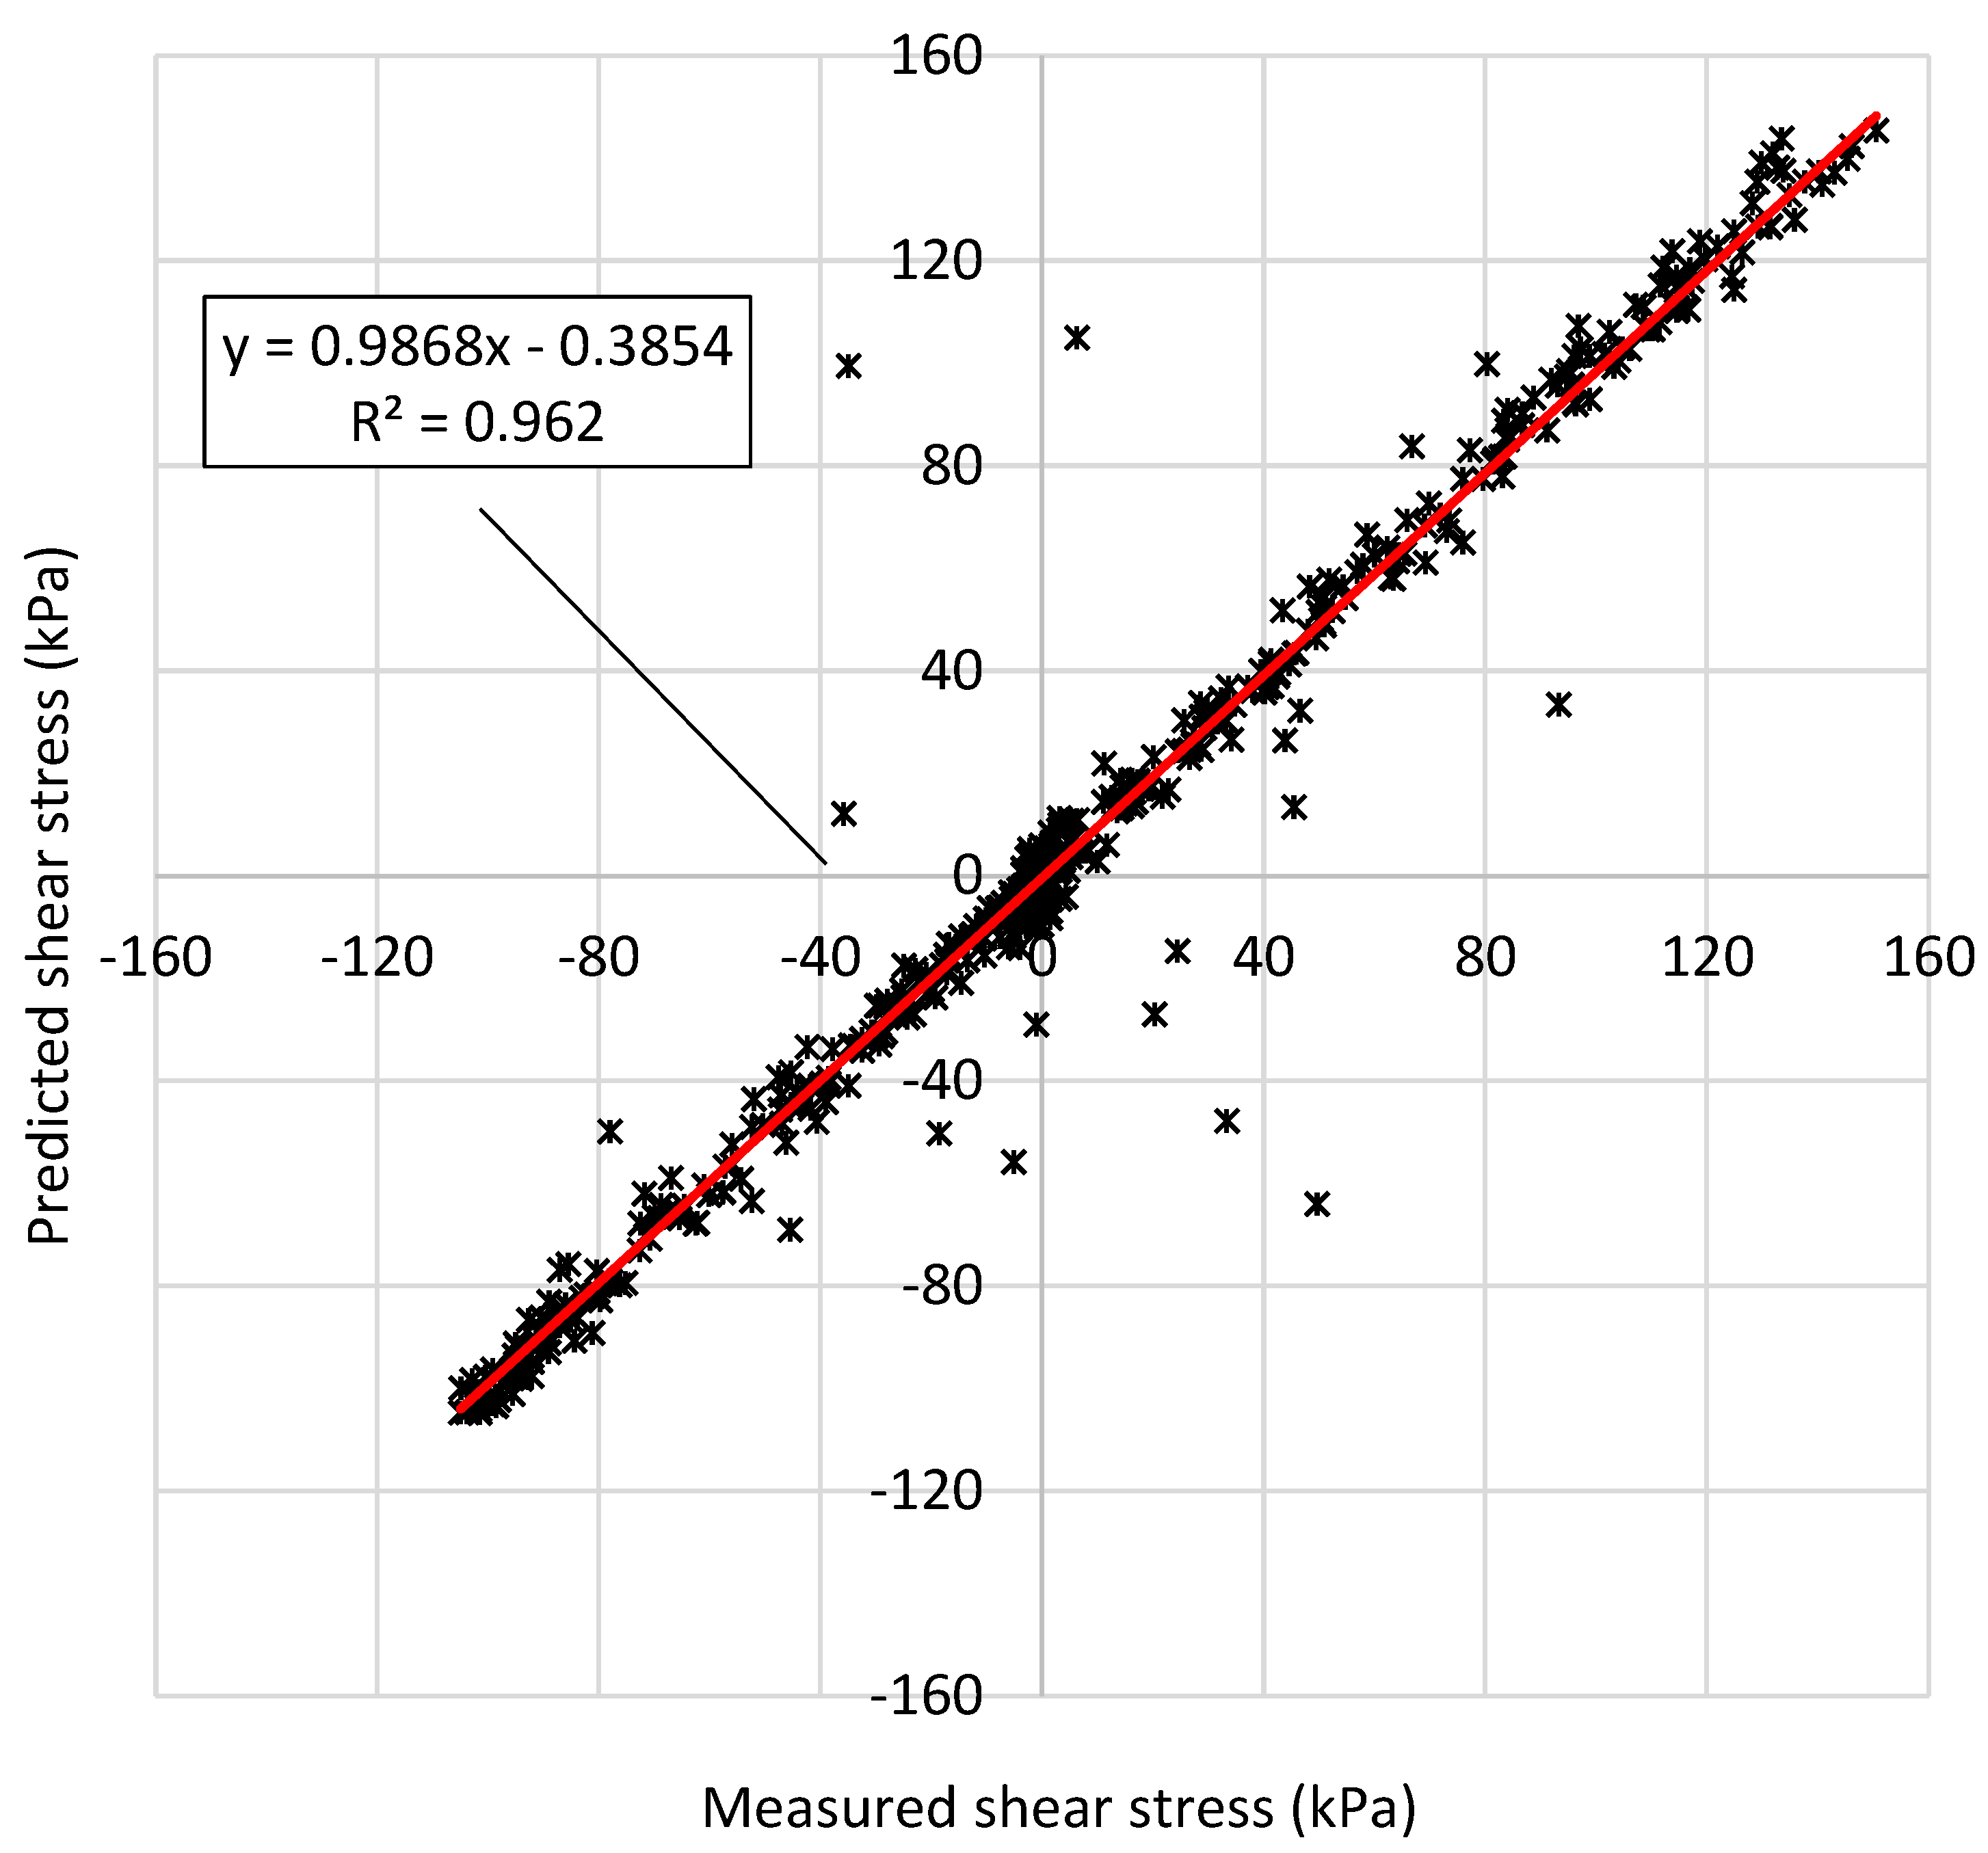
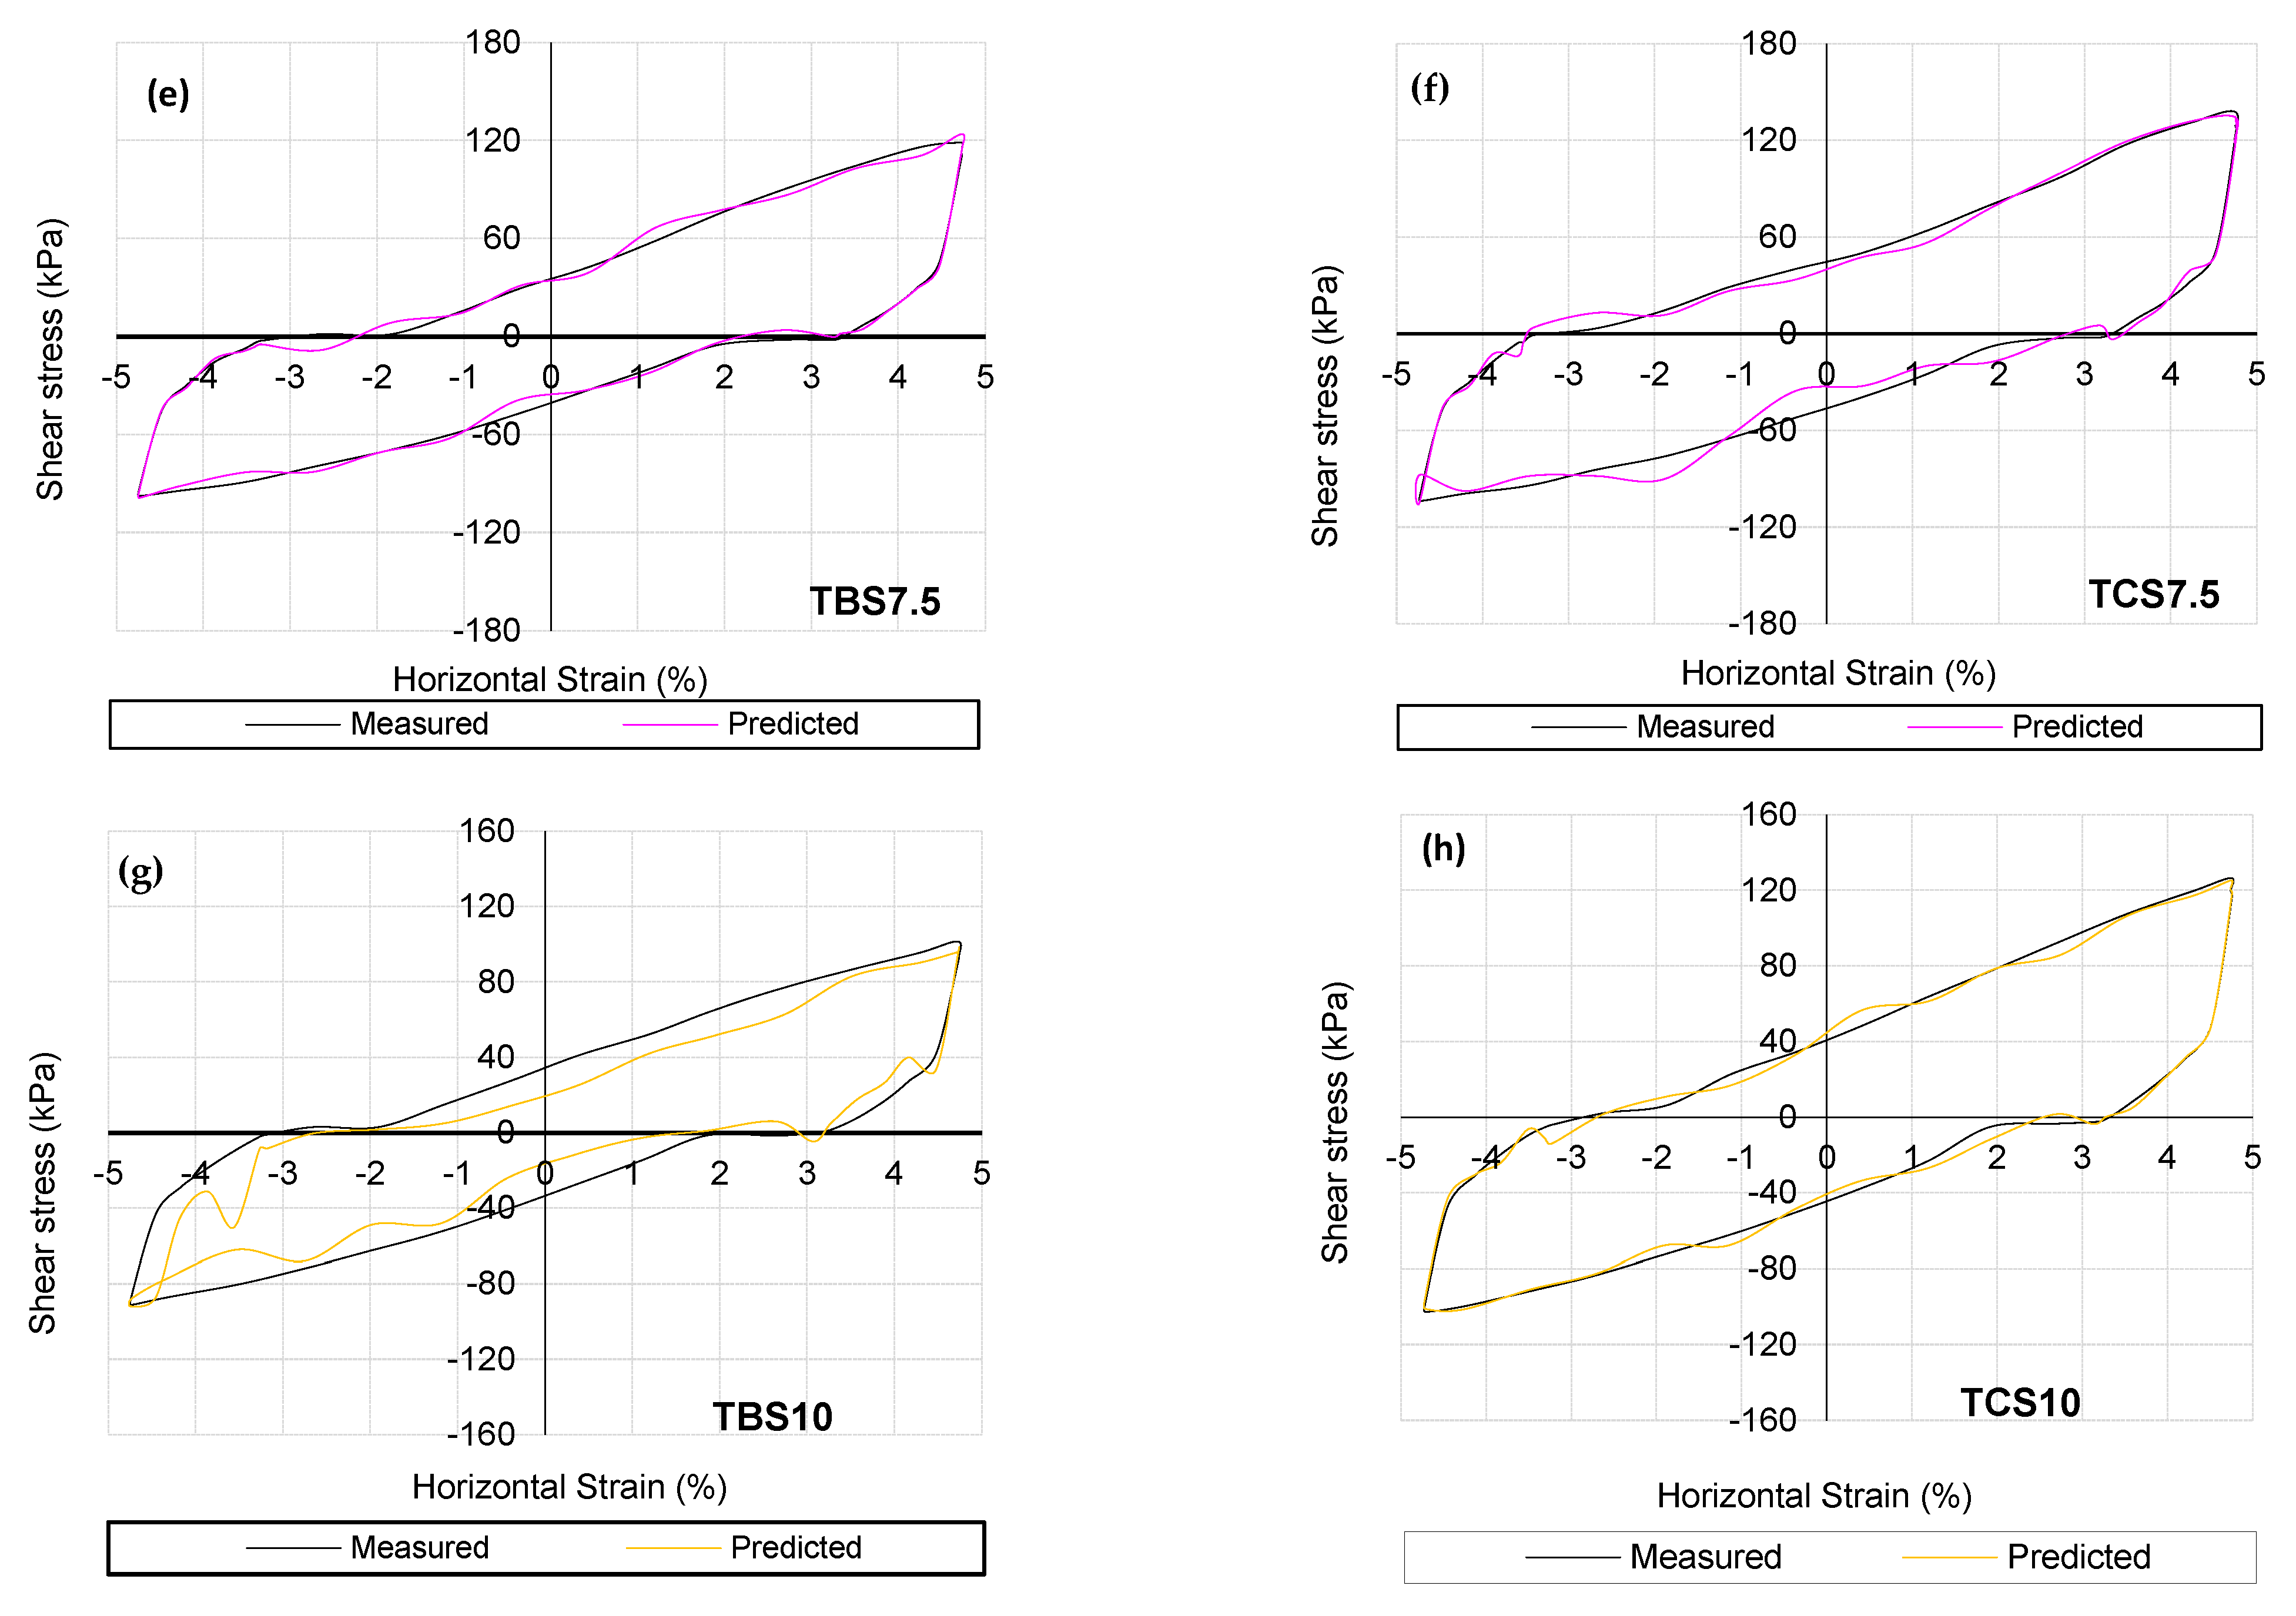
The regression curve formed when the experimental results and the estimation made with BRNN are compared is given in Figure 16. The linear relationship that emerges when both experimental and predicted results are evaluated shows the success of the model. The MSE value obtained was 158.1 from the prediction model, developed with a total of 455 data training and testing phases. The squared correlation coefficient, R2, between the measured and predicted compressive strength was obtained as 0.962. The successful matching of output and target values of shear stress represents the high accuracy of the prediction model. The stress-strain loops developed using the predicted values are presented in Figure 17, together with the experimentally obtained ones. When the stress-strain loops created with the predicted values are shown together with the experimental ones, the harmonious match obtained between both loops stands out. While it is observed that both predicted and measured loops are highly matched, especially at the maximum and minimum extremes, anomalies are observed at intermediate strain levels (i.e., TBS5, TBS10).

5. Conclusions

In this study, the cyclic behavior of waste tire/sand mixtures was studied in detail, based on an experimental program. The main purpose was to investigate the effect of tire inclusions at different types and contents on the behavior of sand in the large strain domain. As a follow-up study to Cabalar et al. [71] and Cabalar [7], crushed stone sand was used in the experiments. Two types of tire waste, namely, tire buffing and tire crumb were used as an additive to sand at different contents. The shear strength characteristics of the specimens were obtained by the strain-controlled cyclic direct shear tests. Furthermore, a BRNN model was developed in order to predict the behavior of the tested specimens. Based on the performed cyclic direct shear tests, the following results have been drawn.
-
The addition of waste tire to sand decreased the horizontal stress amplitudes, i.e., higher tire content in the mixture induced lower shear strength. Thereby, waste tire-sand mixtures have smaller values of shear modulus than the clean sand specimen.
-
At each additive content, the reduction effect of tire buffing inclusion into sand is higher than that of tire crumb, which is attributed to different grain size and shape properties of the waste tires.
-
The cyclic shear test with different processed tires showed that the behavior of waste tire-sand mixtures is significantly affected by the content, grain shape, and aspect ratio of waste tire grains.
-
With the developed prediction model, it is deduced that the artificial intelligence-based prediction models can be used conveniently in the prediction of cyclic behavior of waste tire-sand mixtures. This is highly dependent on the quality of the data used.

Author Contributions

Conceptualization, A.F.C. and Ö.Y.; Investigation, A.F.C. and Ö.Y. All authors have read and agreed to the published version of the manuscript.

Funding

This research received no external funding.

Institutional Review Board Statement

Not applicable.

Informed Consent Statement

Not applicable.

Data Availability Statement

Not applicable.

Conflicts of Interest

The authors declare no conflict of interest.

References

  1. Potyondy, J.G. Skin Friction between Various Soils and Construction Materials. Géotechnique 1961, 11, 339–353. [Google Scholar] [CrossRef]
  2. Knodel, P.; Al-Douri, R.; Poulos, H. Static and Cyclic Direct Shear Tests on Carbonate Sands. Geotech. Test. J. 1992, 15, 138–157. [Google Scholar] [CrossRef]
  3. Desai, C.S.; Drumm, E.C.; Zaman, M.M. Cyclic Testing and Modeling of Interfaces. J. Geotech. Eng. 1985, 111, 793–815. [Google Scholar] [CrossRef]
  4. Tsubakihara, Y.; Kishida, H. Frictional Behaviour between Normally Consolidated Clay and Steel by Two Direct Shear Type Apparatuses. Soils Found. 1993, 33, 1–13. [Google Scholar] [CrossRef] [Green Version]
  5. Fakharian, K.; Evgin, E. Simple Shear Versus Direct Shear Tests on Interfaces during Cyclic Loading. In Proceedings of the Third International Conference on Recent Advances in Geotechnical Earthquake Engineering and Soil Dynamics, St. Louis, MO, USA, 2–7 April 1995; Volume 4, pp. 13–16. [Google Scholar]
  6. Mortara, G.; Ferrara, D.; Fotia, G. Simple Model for the Cyclic Behavior of Smooth Sand-Steel Interfaces. J. Geotech. Geoenvironmental Eng. 2010, 136, 1004–1009. [Google Scholar] [CrossRef]
  7. Cabalar, A.F. Stress fluctuations in granular material response during cyclic direct shear test. Granul. Matter 2015, 17, 439–446. [Google Scholar] [CrossRef]
  8. Cabalar, A.F. Cyclic behavior of various sands and structural materials interfaces. Géoméch. Eng. 2016, 10, 1–19. [Google Scholar] [CrossRef]
  9. Ying, M.; Liu, F.; Wang, J.; Wang, C.; Li, M. Coupling effects of particle shape and cyclic shear history on shear properties of coarse-grained soil–geogrid interface. Transp. Geotech. 2021, 27, 100504. [Google Scholar] [CrossRef]
  10. Pra-Ai, S.; Boulon, M. Soil–structure cyclic direct shear tests: A new interpretation of the direct shear experiment and its application to a series of cyclic tests. Acta Geotech. 2017, 12, 107–127. [Google Scholar] [CrossRef]
  11. Fakharian, K.; Evgin, E. A Three-Dimensional Apparatus for Cyclic Testing of Interfaces. In Proceedings of the 46th Annual Canadian Geotechnical Conference, Saskatoon, SK, Canada, 27–29 September 1993; pp. 485–493. [Google Scholar]
  12. Stark, T.D.; Williamson, T.A.; Eid, H.T. HDPE Geomembrane/Geotextile Interface Shear Strength. J. Geotech. Eng. 1996, 122, 197–203. [Google Scholar] [CrossRef]
  13. Rui, S.; Wang, L.; Guo, Z.; Zhou, W.; Li, Y. Cyclic behavior of interface shear between carbonate sand and steel. Acta Geotech. 2021, 16, 189–209. [Google Scholar] [CrossRef]
  14. Hazarika, H.; Pasha, S.M.K.; Ishibashi, I.; Yoshimoto, N.; Kinoshita, T.; Endo, S.; Karmokar, A.K.; Hitosugi, T. Tire-chip reinforced foundation as liquefaction countermeasure for residential buildings. Soils Found. 2020, 60, 315–326. [Google Scholar] [CrossRef]
  15. Edincliler, A. Utilization of Waste Tires for Geotechnical Applications as Lightweight Materials. In Proceedings of the 9th International Symposium on Environmental Geotechnology and Global Sustainable Development, Hong Kong, China, 25–28 June 2008. [Google Scholar]
  16. Pincus, H.; Edil, T.; Bosscher, P. Engineering Properties of Tire Chips and Soil Mixtures. Geotech. Test. J. 1994, 17, 453. [Google Scholar] [CrossRef]
  17. Edinçliler, A.; Ayhan, V. Influence of tire fiber inclusions on shear strength of sand. Geosynth. Int. 2010, 17, 183–192. [Google Scholar] [CrossRef]
  18. Edinçliler, A.; Yildiz, O. Effects of processing type on shear modulus and damping ratio of waste tire-sand mixtures. Geosynth. Int. 2022, 29, 389–408. [Google Scholar] [CrossRef]
  19. Pistolas, G.A.; Anastasiadis, A.; Pitilakis, K.; Winter, M.G.; Smith, D.M.; Eldred, P.J.L.; Toll, D.G. Dynamic Properties of Gravel—Recycled Rubber Mixtures: Resonant Column and Cyclic Triaxial Tests. In Proceedings of the XVI ECSMGE Geotechnical Engineering for Infrastructure and Development, Edinburgh, UK, 13–17 September 2015; pp. 2613–2618. [Google Scholar]
  20. Bosscher, P.J.; Edil, T.B.; Kuraoka, S. Design of Highway Embankments Using Tire Chips. J. Geotech. Geoenvironmental Eng. 1997, 123, 295–304. [Google Scholar] [CrossRef]
  21. Tweedie, J.J.; Humphrey, D.N.; Sandford, T.C. Tire Shreds as Lightweight Retaining Wall Backfill: Active Conditions. J. Geotech. Geoenvironmental Eng. 1998, 124, 1061–1070. [Google Scholar] [CrossRef]
  22. Humphrey, D.N.; Whetten, N.; Weaver, J.; Recker, K.; Cosgrove, T.A. Tire TDA as Lightweight Fill for Embankments and Retaining Walls. In Proceedings of the Conference on Recycled Materials in Geotechnical Application, ASCE, Boston, MA, USA, 18–21 October 1998. [Google Scholar]
  23. Lee, J.H.; Salgado, R.; Bernal, A.; Lovell, C.W. Shredded Tires and Rubber-Sand as Lightweight Backfill. J. Geotech. Geoenvironmental Eng. 1999, 125, 132–141. [Google Scholar] [CrossRef]
  24. Dickson, T.H.; Dwyer, D.F.; Humphrey, D.N. Prototype Tire-Shred Embankment Construction. Transp. Res. Rec. J. Transp. Res. Board 2001, 1755, 160–167. [Google Scholar] [CrossRef]
  25. Zornberg, J.G.; Cabral, A.R.; Viratjandr, C. Behaviour of tire shred-sand mixtures. Can. Geotech. J. 2004, 41, 227–241. [Google Scholar] [CrossRef]
  26. Hazarika, H.; Yasuhara, K.; Hyodo, M.; Karmokar, A.K.; Mitarai, Y. Shaking Table Test on Liquefaction Prevention Using tire Chips and Sand Mixture. In Proceedings of the International Workshop on Scrap Tire Derived Geomaterials—Opportunities and Challenges, Yokosuka, Japan, 23–24 March 2007. [Google Scholar]
  27. Hazarika, H.; Yasuhara, K.; Hyodo, M.; Karmokar, A.K.; Mitarai, Y. Mitigation of Earthquake Induced Geotechnical Disasters Using a Smart and Novel Geomaterial. In Proceedings of the 14th World Conference on Earthquake Engineering, Beijing, China, 12–17 October 2008; The International Association for Earthquake Engineering (IAEE): Tokyo, Japan, 2008. [Google Scholar]
  28. Tsang, H.-H. Seismic isolation by rubber–soil mixtures for developing countries. Earthq. Eng. Struct. Dyn. 2007, 37, 283–303. [Google Scholar] [CrossRef]
  29. Senetakis, K.; Anastasiadis, A.; Trevlopoulos, K.; Souli, A. Dynamic Response of SDOF Systems on Soil Replaced with Sand/Rubber Mixture. In Proceedings of the ECOMAS Thematic Conference on Computation Methods in Structural Dynamics and Earthquake Engineering, Island of Rhodes, Greece, 17–19 June 2009; pp. 22–24. [Google Scholar]
  30. Senetakis, K.; Anastasiadis, A.; Pitilakis, K. Dynamic properties of dry sand/rubber (SRM) and gravel/rubber (GRM) mixtures in a wide range of shearing strain amplitudes. Soil Dyn. Earthq. Eng. 2012, 33, 38–53. [Google Scholar] [CrossRef]
  31. Senetakis, K.; Anastasiadis, A.; Pitilakis, K.; Souli, A.; Edil, T.; Dean, S.W. Dynamic Behavior of Sand/Rubber Mixtures, Part II: Effect of Rubber Content on G/GO-γ-DT Curves and Volumetric Threshold Strain. J. ASTM Int. 2012, 9, 1–12. [Google Scholar] [CrossRef]
  32. Senetakis, K.; Anastasiadis, A. Effects of state of test sample, specimen geometry and sample preparation on dynamic properties of rubber–sand mixtures. Geosynth. Int. 2015, 22, 301–310. [Google Scholar] [CrossRef] [Green Version]
  33. Mavronicola, E.; Komodromos, P.; Charmpis, D.C. Numerical Investigation of Potential Usage of Rubber-Soil Mixtures as a Distributed Seismic Isolation Approach. In Proceedings of the 10th International Conference on Computational Structures Technology, Stirlingshire, UK, 14–17 September 2010. [Google Scholar] [CrossRef]
  34. Perez, J.C.L.; Kwok, C.Y.; Senetakis, K. Investigation of the micro-mechanics of sand–rubber mixtures at very small strains. Geosynth. Int. 2017, 24, 30–44. [Google Scholar] [CrossRef] [Green Version]
  35. Tsang, H.-H.; Lo, S.H.; Xu, X.; Sheikh, M.N. Seismic isolation for low-to-medium-rise buildings using granulated rubber-soil mixtures: Numerical study. Earthq. Eng. Struct. Dyn. 2012, 41, 2009–2024. [Google Scholar] [CrossRef]
  36. Edincliler, A.; Yildiz, O. Numerical Study on Seismic Isolation for Medium-rise Buildings Using Rubber-Sand Mixtures. In Proceedings of the 4th Conference on Smart Monitoring, Assesment and Rehabilitation of Civil Structures, Zurich, Switzerland, 13–15 September 2017. [Google Scholar]
  37. Edincliler, A.; Yıldız, Ö. Numerical Study on Effects of Geotechnical Isolation Material on Seismic Performance of Medium Rise Buildings. In Proceedings of the 4th Eurasian Conference on Civil and Environmental Engineering, Istanbul, Turkey, 17–18 June 2019. [Google Scholar]
  38. Edincliler, A.; Yıldız, Ö. Seismic Behavior of Tire Waste-Sand Mixtures for Transporation Infrastructure in Cold Regions. Sci. Cold Arid. Reg. 2015, 7, 626–631. Available online: http://www.scar.ac.cn/EN/article/advancedSearchResult.do (accessed on 1 November 2022).
  39. Yildiz, Ö. Numerical Analysis of Geotechnical Seismic Isolation System for High-Rise Buildings. Naturengs 2021, 2, 34–43. [Google Scholar] [CrossRef]
  40. Humphrey, D.N. Civil Engineering Applications Using Tire Derived Aggregate (TDA); CIWMB: Sacramento, CA, USA, 2003. [Google Scholar]
  41. Aydilek, A.H.; Madden, E.T.; Demirkan, M.M. Field Evaluation of a Leachate Collection System Constructed with Scrap Tires. J. Geotech. Geoenvironmental Eng. 2006, 132, 990–1000. [Google Scholar] [CrossRef] [Green Version]
  42. Chaney, R.; Demars, K.; Feng, Z.-Y.; Sutter, K. Dynamic Properties of Granulated Rubber/Sand Mixtures. Geotech. Test. J. 2000, 23, 338–344. [Google Scholar] [CrossRef]
  43. Pamukcu, S.; Akbulut, S. Thermoelastic Enhancement of Damping of Sand Using Synthetic Ground Rubber. J. Geotech. Geoenvironmental Eng. 2006, 132, 501–510. [Google Scholar] [CrossRef]
  44. Kim, H.-K.; Santamarina, J.C. Sand–rubber mixtures (large rubber chips). Can. Geotech. J. 2008, 45, 1457–1466. [Google Scholar] [CrossRef] [Green Version]
  45. Ehsani, M.; Shariatmadari, N.; Mirhosseini, S.M. Shear modulus and damping ratio of sand-granulated rubber mixtures. J. Central South Univ. 2015, 22, 3159–3167. [Google Scholar] [CrossRef]
  46. Anastasiadis, A.; Pitilakis, K.; Senetakis, K.; Souli, A. Dynamic Shear Modulus and Damping Ratio Curves of Sand/Rubber Mixtures. In Proceedings of the Earthquake Geotechnical Engineering Satellite Conference, XVIIth International Conference on Soil Mechanics & Geotechnical Engineering, Alexandria, Egypt, 2–3 October 2009. [Google Scholar]
  47. Anastasiadis, A.; Senetakis, K.; Pitilakis, K.; Gargala, C.; Karakasi, I. Dynamic Behavior of Sand/Rubber Mixtures. Part I: Effect of Rubber Content and Duration of Confinement on Small-Strain Shear Modulus and Damping Ratio; ASTM International: West Conshohocken, PA, USA, 2012; Volume 9, pp. 221–247. [Google Scholar] [CrossRef] [Green Version]
  48. Anastasiadis, A.; Senetakis, K.; Pitilakis, K. Small-Strain Shear Modulus and Damping Ratio of Sand-Rubber and Gravel-Rubber Mixtures. Geotech. Geol. Eng. 2011, 30, 363–382. [Google Scholar] [CrossRef]
  49. Nakhaei, A.; Marandi, S.; Kermani, S.S.; Bagheripour, M. Dynamic properties of granular soils mixed with granulated rubber. Soil Dyn. Earthq. Eng. 2012, 43, 124–132. [Google Scholar] [CrossRef]
  50. Li, B.; Huang, M.; Zeng, X. Dynamic Behavior and Liquefaction Analysis of Recycled-Rubber Sand Mixtures. J. Mater. Civ. Eng. 2016, 28, 1–14. [Google Scholar] [CrossRef]
  51. Mashiri, M.S.; Vinod, J.S.; Sheikh, M.N.; Carraro, J.A.H. Shear modulus of sand–tyre chip mixtures. Environ. Geotech. 2018, 5, 336–344. [Google Scholar] [CrossRef] [Green Version]
  52. Okur, D.V.; Umu, S.U. Dynamic Properties of Clean Sand Modified with Granulated Rubber. Adv. Civ. Eng. 2018, 2018, 5209494. [Google Scholar] [CrossRef]
  53. Sarajpoor, S.; Kavand, A.; Zogh, P.; Ghalandarzadeh, A. Dynamic behavior of sand-rubber mixtures based on hollow cylinder tests. Constr. Build. Mater. 2020, 251, 118948. [Google Scholar] [CrossRef]
  54. Humphrey, D.; Sandford, T.; Cribbs, M.; Manison, W. Shear Strength and Compressibility of Tire Chips for Use as Retaining Wall Backfill. Transp. Res. Rec. 1993, 1422, 29–35. [Google Scholar]
  55. Foose, G.J.; Benson, C.H.; Bosscher, P.J. Sand Reinforced with Shredded Waste Tires. J. Geotech. Eng. 1996, 122, 760–767. [Google Scholar] [CrossRef]
  56. Tatlisoz, N.; Edil, T.B.; Benson, C.H. Interaction between Reinforcing Geosynthetics and Soil-Tire Chip Mixtures. J. Geotech. Geoenvironmental Eng. 1998, 124, 1109–1119. [Google Scholar] [CrossRef]
  57. Ghazavi, M.; Sakhi, M.A. Influence of Optimized Tire Shreds on Shear Strength Parameters of Sand. Int. J. Géoméch. 2005, 5, 58–65. [Google Scholar] [CrossRef]
  58. Attom, M.F. The use of shredded waste tires to improve the geotechnical engineering properties of sands. Environ. Geol. 2006, 49, 497–503. [Google Scholar] [CrossRef]
  59. Edinçliler, A.; Baykal, G.; Dengili, K. Determination of static and dynamic behavior of recycled materials for highways. Resour. Conserv. Recycl. 2004, 42, 223–237. [Google Scholar] [CrossRef]
  60. Edinçliler, A. Using Waste Tire–Soil Mixtures for Embankment Construction. In Scrap Tire Derived Geomaterials—Opportunities and Challenges; Kanto Branch of Japanese Geotechnical Society: Tokyo, Japan, 2007; pp. 319–328. [Google Scholar] [CrossRef]
  61. Christ, M.; Park, J.-B. Laboratory determination of strength properties of frozen rubber–sand mixtures. Cold Reg. Sci. Technol. 2010, 60, 169–175. [Google Scholar] [CrossRef]
  62. Cabalar, A.F. Direct Shear Tests on Waste Tires-Sand Mixtures. Geotech. Geol. Eng. 2011, 29, 411–418. [Google Scholar] [CrossRef]
  63. Marto, A.; Latifi, N.; Moradi, R.; Oghabi, M.; Zolfeghari, S. Shear Properties of Sand—Tire Chips Mixtures. Electron. J. Geotech. Eng. 2013, 18, 325–334. [Google Scholar]
  64. Anvari, S.M.; Shooshpasha, I.; Kutanaei, S.S. Effect of granulated rubber on shear strength of fine-grained sand. J. Rock Mech. Geotech. Eng. 2017, 9, 936–944. [Google Scholar] [CrossRef]
  65. Yıldız, O. Investigation on the Mitigation of Earthquake Hazards with Inclusion of Tire Wastes into the Sand. Master’s Thesis, Boğaziçi University, Istanbul, Turkey, 2012. [Google Scholar]
  66. Chenari, R.J.; Poursalimi, N.; Sosahab, J.S. Dynamic properties of sand-tire crumb mixtures with large cyclic direct shear apparatus. Electron. J. Geotech. Eng. 2017, 22, 5085–5106. [Google Scholar]
  67. Moussa, A.; El-Naggar, H.; Sadrekarimi, A. Dynamic Properties of Granulated Rubber Using Different Laboratory Tests. Buildings 2021, 11, 186. [Google Scholar] [CrossRef]
  68. Youwai, S.; Bergado, D.T. Strength and deformation characteristics of shredded rubber tire-sand mixtures. Can. Geotech. J. 2003, 40, 254–264. [Google Scholar] [CrossRef]
  69. Chaney, R.; Demars, K.; Masad, E.; Taha, R.; Ho, C.; Papagiannakis, T. Engineering Properties of Tire/Soil Mixtures as a Lightweight Fill Material. Geotech. Test. J. 1996, 19, 297–304. [Google Scholar] [CrossRef]
  70. Tasalloti, A.; Chiaro, G.; Murali, A.; Banasiak, L. Physical and Mechanical Properties of Granulated Rubber Mixed with Granular Soils—A Literature Review. Sustainability 2021, 13, 4309. [Google Scholar] [CrossRef]
  71. Cabalar, A.F.; Dulundu, K.; Tuncay, K. Strength of various sands in triaxial and cyclic direct shear tests. Eng. Geol. 2013, 156, 92–102. [Google Scholar] [CrossRef]
  72. ASTM D422-63; Standard Test Method for Particle-Size Analysis of Soils. ASTM International: West Conshohocken, PA, USA, 1998; Volume I, pp. 1–8.
  73. ASTM D6270-08; Standard Practice of for Use Scrap Tires in Civil Engineering Applications. ASTM International: West Conshohocken, PA, USA, 2020.
  74. ASTM D8296-19; Standard Test Method for Consolidated Undrained Cyclic Direct Simple Shear Test Under Constant Volume with Load Control or Displacement Control. ASTM International: West Conshohocken, PA, USA, 2019.
  75. Klar, A.; Roed, M.; Rocchi, I.; Paegle, I. Evaluation of Horizontal Stresses in Soil during Direct Simple Shear by High-Resolution Distributed Fiber Optic Sensing. Sensors 2019, 19, 3684. [Google Scholar] [CrossRef] [Green Version]
  76. Kutanaei, S.S.; Choobbasti, A.J. Effects of nanosilica particles and randomly distributed fibers on the ultrasonic pulse velocity and mechanical properties of cemented sand. J. Mater. Civ. Eng. 2016, 29, 04016230. [Google Scholar] [CrossRef]
  77. Kutanaei, S.S.; Choobbasti, A.J. Experimental study of combined effects of fibers and nanosilica on mechanical properties of cemented sand. J. Mater. Civ. Eng. 2016, 28, 06016001. [Google Scholar] [CrossRef]
  78. Ghazavi, M. Shear strength characteristics of sand-mixed with granular rubber. Geotech. Geol. Eng. 2004, 22, 401–416. [Google Scholar] [CrossRef]
  79. Shewbridge, S.E.; Sitar, N. Deformation Characteristics of Reinforced Sand in Direct Shear. J. Geotech. Eng. 1989, 115, 1134–1147. [Google Scholar] [CrossRef]
  80. Choobbasti, A.J.; Kutanaei, S.S. Effect of fiber reinforcement on deformability properties of cemented sand. J. Adhes. Sci. Technol. 2016, 31, 1576–1590. [Google Scholar] [CrossRef]
  81. Benson, C.H.; Khire, M.V. Soil reinforcement with strips of reclaimed HDPE. J. Geotech. Eng. 1994, 120, 838–855. [Google Scholar] [CrossRef]
  82. Rummelhart, D.E. The Architecture of Mind: A Connectionist Approach. In Foundations of Cognitive Science; Posner, M.I., Ed.; MIT Press: Cambridge, MA, USA, 1989; pp. 133–159. [Google Scholar] [CrossRef]
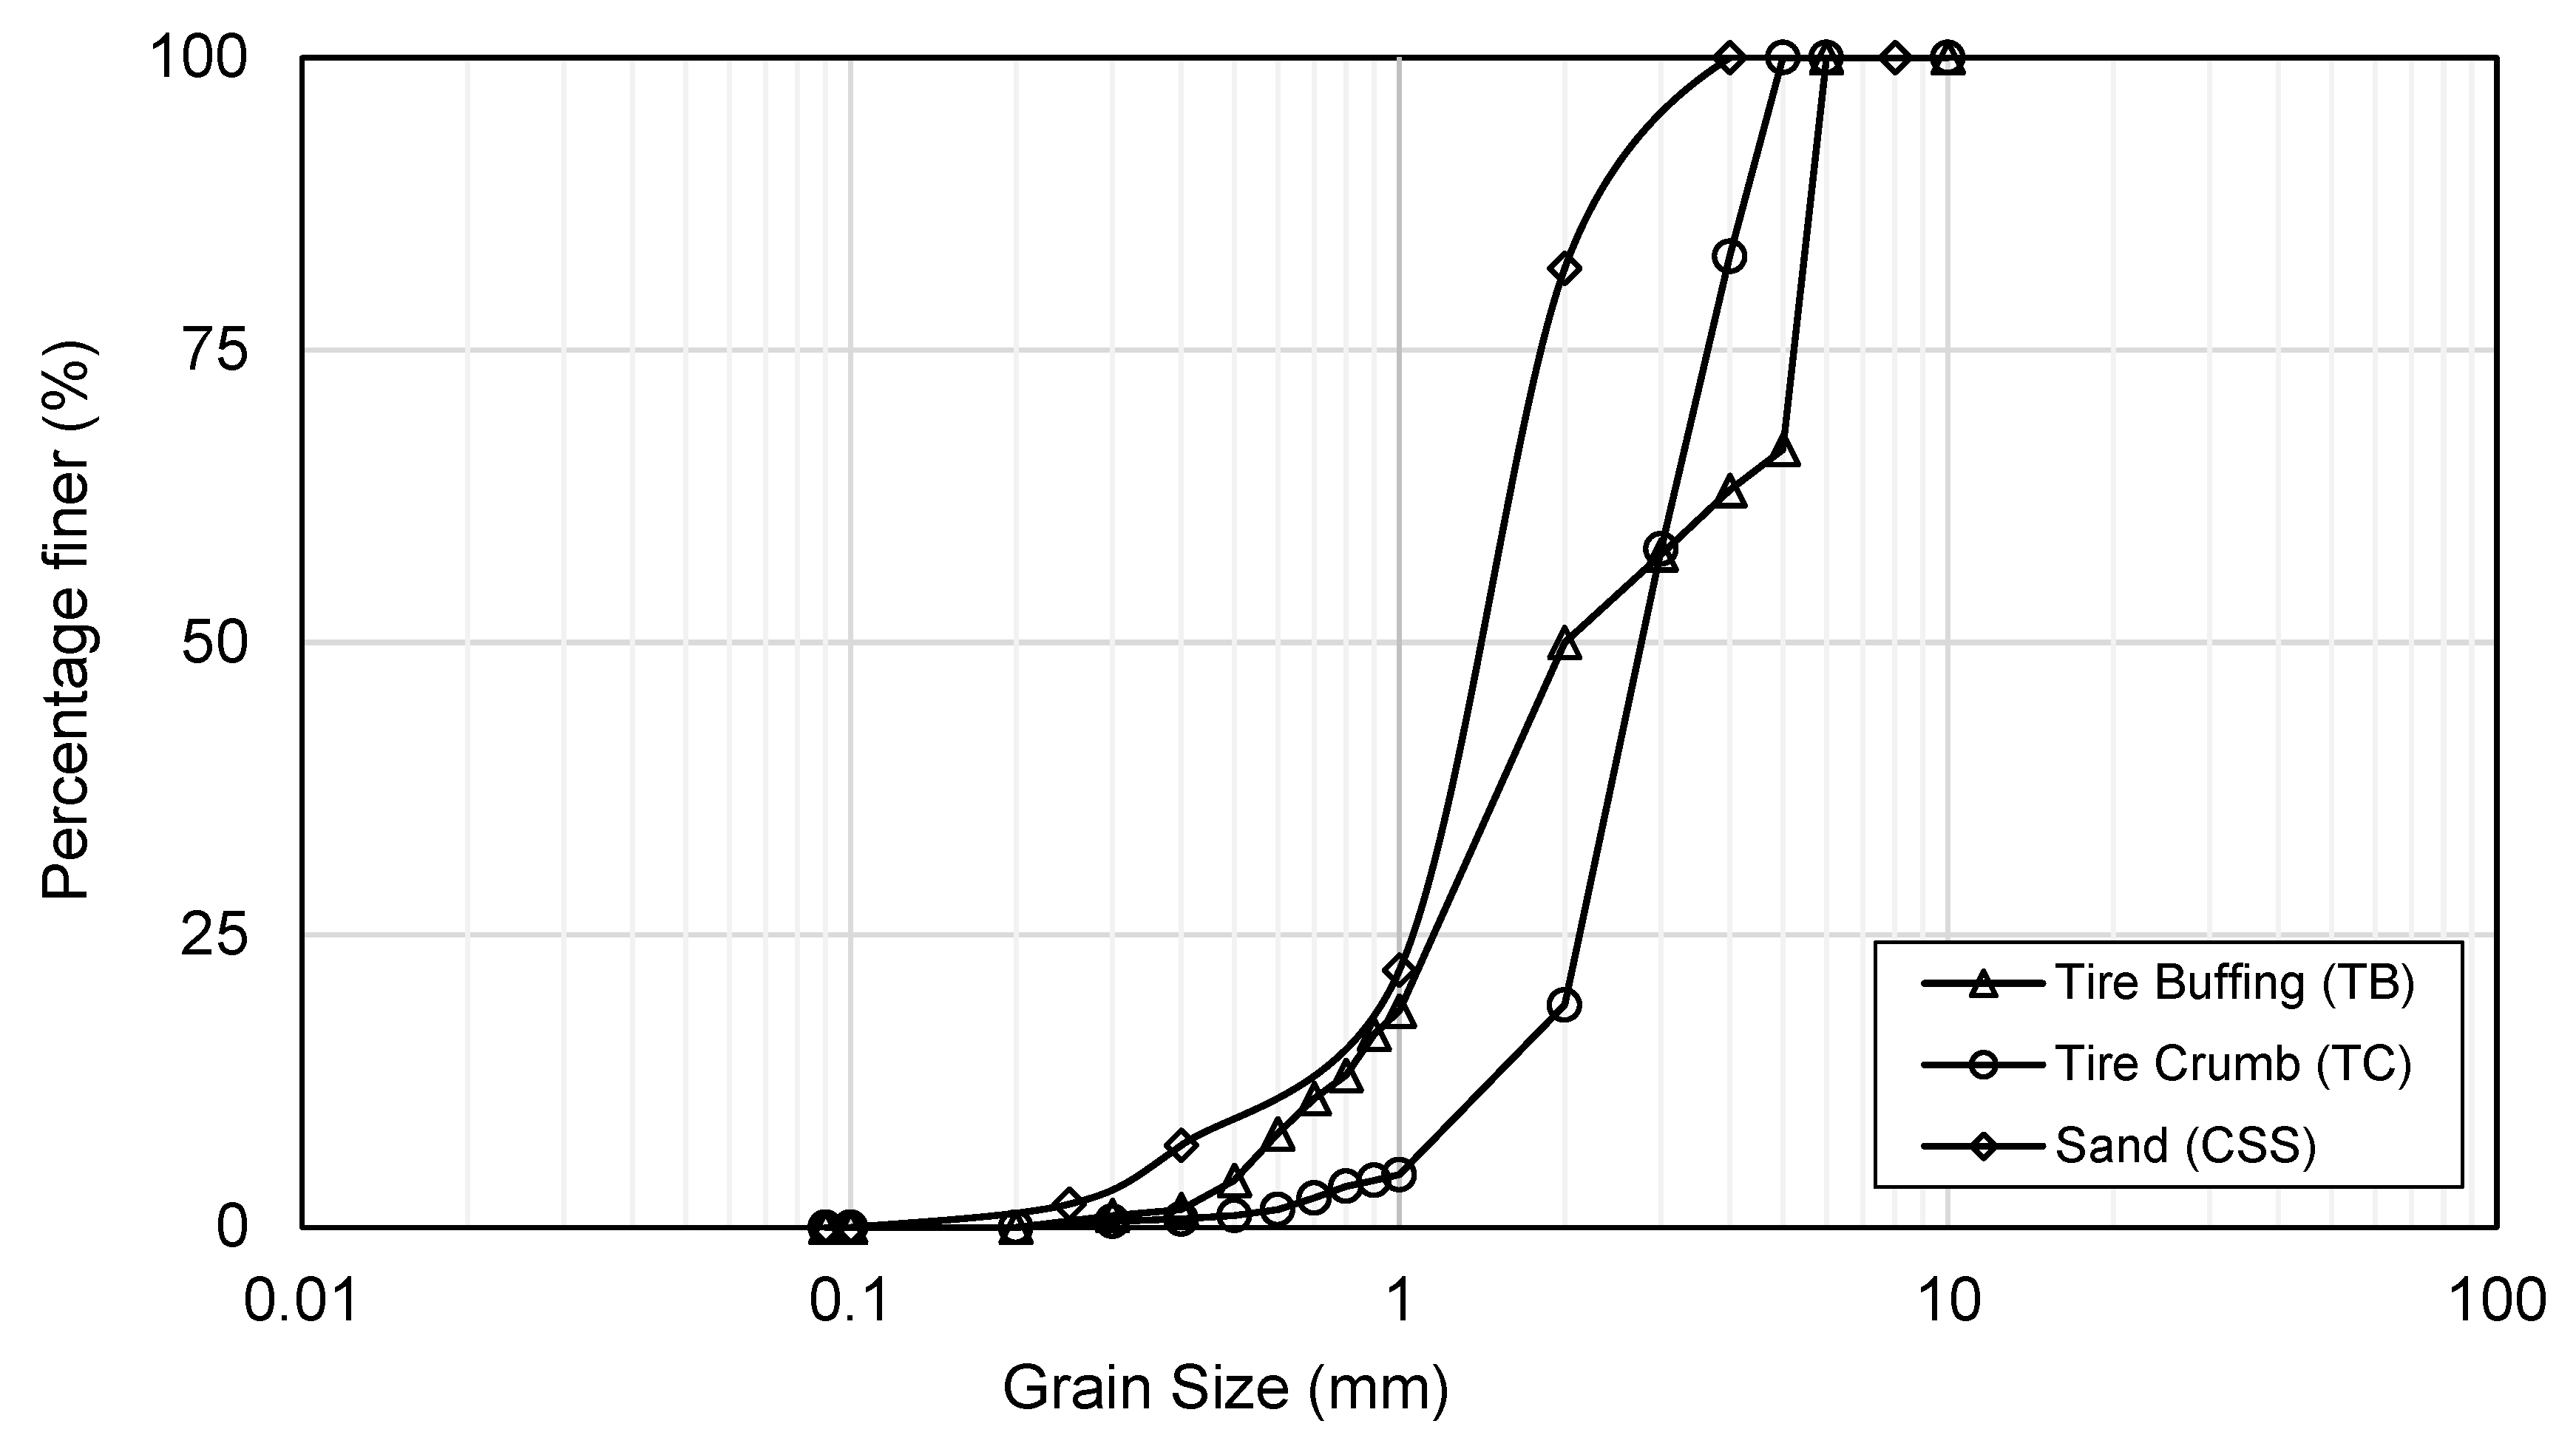
Figure 1. Grain size distribution of TB, TC, and CSS.
Sustainability 14 16850 g001
Figure 2. A photo of the (a) CSS, (b) TB, and (c) TC used during the experimental studies.
Sustainability 14 16850 g002
Figure 3. View of tested specimens (a) CSS, (b) TCS2.5, (c) TBS5.
Sustainability 14 16850 g003
Figure 4. Typical behavior of CSS specimen under cyclic loading: (a) shear stress vs. horizontal strain, (b) vertical displacement vs. horizontal displacement.
Sustainability 14 16850 g004
Figure 5. The relationship of volumetric strain and time for CSS specimen.
Sustainability 14 16850 g005
Figure 6. Horizontal stress vs. horizontal strain curve of CSS and TBS specimens.
Sustainability 14 16850 g006
Figure 7. The relationship of volumetric strain and time for CSS and TBS specimens.
Sustainability 14 16850 g007
Figure 8. Horizontal stress vs. horizontal strain curve of CSS and TCS specimens.
Sustainability 14 16850 g008
Figure 9. The relationship between volumetric strain and time, for CSS and TC specimens.
Sustainability 14 16850 g009
Figure 10. Stress-strain relationships of (a,c,e,g) TBS specimens, (b,d,f,h) TCS specimens tested under cyclic shear loading.
Sustainability 14 16850 g010aSustainability 14 16850 g010b
Figure 11. Vertical versus horizontal displacement of (a,c,e,g) TBS specimens, (b,d,f,h) TCS specimens.
Sustainability 14 16850 g011aSustainability 14 16850 g011b
Figure 12. Shear stress versus number of cycles; (a,b) maximum, (c,d) minimum, (e,f) normalized horizontal stress.TC: Tire content.
Sustainability 14 16850 g012aSustainability 14 16850 g012b
Figure 13. The architecture of the BRNN model.
Sustainability 14 16850 g013
Figure 14. Schematic representation of discretized hysteresis loop for prediction model.
Sustainability 14 16850 g014
Figure 15. The flowchart of the BRNN model.
Sustainability 14 16850 g015
Figure 16. Measured vs. predicted values by prediction model.
Sustainability 14 16850 g016
Figure 17. Measured and predicted stress-strain relationships of (a,c,e,g) TBS specimens, (b,d,f,h) TCS specimens.
Sustainability 14 16850 g017aSustainability 14 16850 g017b
Table 1. Unit weights of the tested specimens.
Type of Waste TiresUnit Weight (kN/m3)
Waste Tires Content (%)
02.557.510
TB18.8 18.5 17.9 16.3 16.1
TC18.8 18.6 18.3 18.0 17.7
Table 2. Maximum and minimum horizontal stress values for CSS.
Number of CycleMax. ShearStress (kPa)Min. Horizontal Stress (kPa)Difference (%)
1115.5−92.125
2130.3−96.935
3134.0−95.241
4143.0−95.749
5150.6−97.055
Table 3. Maximum and minimum horizontal stress values for CSS and TBS specimens.
Horizontal Stress (kPa)
Number of CycleCSSTBS2.5TBS5TBS7.5TBS10
Max.Min.Max.Min.Max.Min.Max.Min.Max.Min.
1115.5−92.194.6−95.169.9−88.584.0−87.458.4−80.7
2130.3−96.9108.2−97.992.3−97.198.8−92.280.0−88.9
3134.0−95.2115.4−101.0102.9−102.1110.2−95.790.4−90.3
4143.0−95.7131.9−102.6112.0−104.9111.6−97.695.0−91.1
5150.6−97.0133.5−103.6116.6−105.0118.7−98.4101.5−93.3
Table 4. Maximum and minimum horizontal stress values for CSS and TC specimens.
Horizontal Stress (kPa)
Number of CycleCSSTCS2.5TCS5TCS7.5TCS10
Max.Min.Max.Min.Max.Min.Max.Min.Max.Min.
1115.592.1115.6−91.5103.0−96.489.4−94.677.2−92.0
2130.3−96.9120.8−98.0117.0−102.0110.2−97.297.4−100.0
3134.0−95.2129.5−101.5130.7−103.6123.1−102.6110.4−102.9
4143.0−95.7132.7−102.1133.9−105.0129.1−103.8119.7−102.6
5150.6−97.0145.4−97.0134.8−102.0137.7−101.3126.5−102.8
Publisher’s Note: MDPI stays neutral with regard to jurisdictional claims in published maps and institutional affiliations.