Abstract
Anaerobic ammonia oxidation (ANAMMOX) technology is a novel biological nitrogen removal technology with potential applications for the treatment of nitrogenous wastewater treatment prospects. Most of the literature explores the growth environment of anaerobic ammonia-oxidizing bacteria and total nitrogen removal efficiency but the influence of reactor operating conditions (such as up-flow rate) on the treatment efficiency and sludge growth property of anaerobic ammonia-oxidizing bacteria is rarely discussed. Therefore, the purpose of this study is to discuss the effect of up-flow rate on the treatment efficiency and sludge property of the anaerobic ammonia oxidation treatment procedure adopting up-flow anaerobic sludge bed (UASB) as a reactor. The results show that up-flow rate has a significant effect on sludge concentration and sludge growth rate. The highest sludge concentration and maximum sludge growth rate could be obtained at the up-flow rate of 3.21 m/h. According to the analysis results of the sludge concentration, we speculate that when the flow rate was lower than 3.21 m/h, the sludge particles did not easily collide with each other to produce a larger sludge floc. On the contrary, when the up-flow rate was higher than 3.21 m/h, the larger sludge floc could be decomposed by the shear force. The sludge concentration was reduced by these two reasons. On the other hand, the average total nitrogen volume removal rates in test runs 1 through to 4 were 0.18 g-N/m3/d, 0.19 g-N/m3/d, 0.20 g-N/m3/d and 0.20 g-N/m3/d at up-flow rates from 1.95 m/h to 3.70 m/h, respectively. Therefore, the treatment efficiency was not affected by the up-flow rate in these operating conditions.
1. Introduction
Anaerobic ammonia oxidation (ANAMMOX) technology is a novel biological nitrogen removal technology with potential applications for the treatment of nitrogenous wastewater treatment prospects [1]. However, there are two reasons affecting the application of this procedure. The first reason is that anaerobic ammonia-oxidizing bacteria have lower cell proliferation rates than ammonia-oxidizing bacteria and nitrite-oxidizing bacteria utilized in conventional biological nitrification/denitrification [2,3] Another reason is that the acclimatization period takes more than three months, which is longer than traditional biological treatment procedures. Jetten et al. compared the growth of anaerobic ammonia-oxidizing bacteria with that of ammonia-oxidizing bacteria and the growth rate of ammonia-oxidizing bacteria was 13 times higher than that of anaerobic ammonia-oxidizing bacteria, with a generation multiplication rate of 0.73 days, while anaerobic ammonia-oxidizing bacteria required 10.6 days [4]; therefore, it is a challenge to optimize the operation of the anaerobic ammonium oxidation process to enhance the proliferation rate of ANAMMOX sludge.
Most of the literature explores the growth environment of anaerobic ammonia-oxidizing bacteria and total nitrogen removal efficiency but the influence of reactor operating conditions (such as up-flow rate) on the treatment efficiency and sludge growth property of anaerobic ammonia-oxidizing bacteria is rarely discussed. However, the operating conditions of the biological reactor could affect the treatment efficiency and sludge characteristics of the reactor, such as mass transfer characteristics and rheological behavior, are important influencing factors [5,6,7]. Current reactors for anaerobic ammonia oxidation procedures adopt the up-flow anaerobic sludge bed (UASB) proposed by Lettinga et al. in the 1980s [8]. The key to starting and operating this reactor is sludge granulation, which obtains better subsidence of the sludge and higher hydraulic loading; granular sludge can also sustain higher gas or liquid shear force [8,9,10,11,12,13]. Factors such as monomer, flow rate and agitating rate in the reactor tank can affect the flow conditions (appearing drain, short flow, reflow and dead end [14,15]) which, in turn, indirectly or directly affect the sludge growth efficiency as well as the treatment efficiency [16,17,18]. Factors such as inlet flow rate, up-flow rate and sludge layer height in UASB have also been observed to affect sludge treatment efficiency in previous research results of [14,19,20,21]. Beun et al. proposed up-flow rate as a critical influence on sludge subsidence [22]. Van Der Star et al. found that at an up-flow rate controlled at 2 m/h~3 m/h, sludge is less likely to condensed [23]. Tiwari et al. reported that toxic substances metabolized by sludge are less likely to accumulate in the tank at an up-flow rate of 1–2.5 m/h [10]. However, despite the fact that the up-flow rate is an important factor in operating reactors, there are no works in the literature that clearly indicate whether the up-flow rate has an impact on removal efficiency and sludge growth rate. Therefore, the purpose of this study is to discuss the effect of up-flow rate on the treatment efficiency and sludge property of the anaerobic ammonia oxidation treatment procedure adopting UASB as a reactor.
2. Materials and Methods
2.1. Setup of UASB
UASB has been proven to be the reaction tank of ANAMMOX [24]; therefore, UASB was selected as the reactor in this study. The reactor was designed and assembled by us and the schematic diagram is shown as Figure 1. Its main part was made of acrylic with a height of 2.1 m, an inner diameter of 14 cm and a total tank volume of 16 L, and a pH and ORP monitoring system was established.
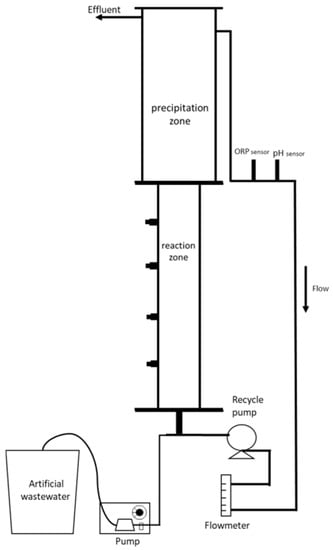
Figure 1.
Schematic diagram of UASB reactor.
Artificial wastewater was supplied to the reactor by a pump, and the flow rate of this pump affected the hydraulic retention time. In this study, the flow rate was controlled at 22 mL/min to maintain the same hydraulic retention time in each test run. In addition, the internal reflux was provided by a recycle pump to change the up-flow rate in the reactor.
The source of ANAMMOX sludge is activated sludge obtained from the wastewater treatment plant in the industrial park. This sludge has been confirmed to contain ANAMMOX strains by genetic engineering methods. After 4 months of acclimation and another 4 months of stable operation, the anaerobic ammonia oxidation reactor was successfully started up in the laboratory and the test run of this research was formally carried out.
2.2. UASB Operation
The operating conditions of the reactor were as shown in Table 1. The influent wastewater concentration and hydraulic retention time (HRT) were the same for each run, and only the up-flow rate was changed to review the effect of up-flow rate operation in the reactor tank. The influent wastewater was artificially prepared mainly by ammonium chloride (NH4Cl) and sodium nitrite (NaNO2), with appropriate amounts of sodium bicarbonate added as an inorganic carbon source for sludge growth. In this study, the concentrations of ammonia, nitrite and nitrate were expressed in nitrogen equivalents as NH4+–N, NO2−–N and NO3−–N. The concentrations of NH4+–N and NO2−–N in the influent artificial wastewater were 40 mg N/L and 60 mg N/L, and the total nitrogen loading was 0.2 g-N/m3/d. After each artificial wastewater sample was prepared, the influent and effluent water samples were collected and analyzed. The duration of operation in each test run was about 21 days.

Table 1.
Operating Parameters of ANAMMOX process.
The sludge bed height was measured at the beginning and end of the test run, and the sludge was collected for concentration analysis to review changes in sludge property and calculate the sludge growth rate.
2.3. Analytical
The concentrations of NH4+–N, NO2−–N and NO3−–N in the inlet and outlet samples were analyzed by an Agilent 1260, ion chromatography, an Infinity LC infusion pump, an automatic sample feeder, an Agilent 1100 Series, a column thermostat, a SHIMADZU CTO-10A, a detector and a Shodex CD-200. Regarding cations and anions, the ion chromatography columns used for analysis were IC SH-CC-3, 4. 6 mmID × 125 mm and SH-AP-3, 150 mm × 4.0 mm. The chromatographic analysis conditions were set at a flow rate of 1 mL/min, the temperature in the oven was 35 °C and analysis times of 20 min for cations and 6 min for anions were used.
Since most of the ANAMMOX sludge was composed of organic matter, it could be volatilized at 550 °C. Therefore, in this study, the amount and concentration of ANAMMOX sludge were expressed as volatile suspended solid (VSS) and mixed liquor volatile suspended solid (MLVSS), respectively. The determination of MLVSS was based on the NIEA W210.58A standard method. The high-temperature furnace equipment model is DENG YNG, DF 303.
3. Results
3.1. Effect of Up-Flow Rate on Total Nitrogen Removal Efficiency
In this study, to investigate the effect of the up-flow rate on the treatment efficiency and sludge characteristics of the anaerobic ammonia oxidation procedure, other operating factors were fixed, such as hydraulic retention time (Table 1), and only the up-flow rate was changed, that is, up-flow rates were 1.95 m/h, 2.53 m/h, 3.12 m/h and 3.70 m/h, for at least 20 days of operation in test runs.
Figure 2 shows the changes in the water quality of the influent and effluent water in each test run. The influent NH4+–N and NO2−–N concentrations are stable at 38 mg/L~40 mg/L and 55 mg/L~65 mg/L, except that the concentration of NO2−–N was slightly higher due to the relationship between the reagents in Run 3. The NH4+–N and NO2−–N concentrations in the effluent can be reduced to 0~5 mg/L and 0~17 mg/L. The following shows that this treatment procedure can effectively remove NH4+–N and NO2−–N and maintain the removal rates above 95 and 85%. Since NH4+–N and NO2−–N were removed at the same time, the ratio is about 1:1.1~1.2, which is consistent with the theoretical ratio of ANAMMOX, indicating that ANAMMOX reactions should occur in the reactor tank.
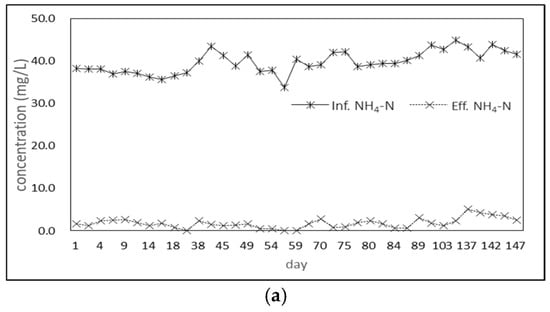
Figure 2.
(a) Variation in NH4+ –N water quality for each test run, (b) Variation in NO2−–N water quality for each test run, (c) Variation in NO3−–N water quality for each test (According to these water quality data, it was shown that the UASB reactor was very stable during operation and was not affected by the up-flow rate.).
In addition, no nitrate nitrogen was added to the artificially prepared influent water. The analysis results also showed that there was no NO3−–N in the influent water, but a small amount of NO3−–N increased in the effluent water. According to the literature, ANAMMOX bacteria growth is accompanied by the generation of NO3−–N; so, it is presumed that the growth of ANAMMOX bacteria should occur in this reactor tank.
Figure 3 shows the comparison of the average NH4+–N removal rate and the average NO2−–N removal rate for each test run. The NO2−–N removal rate in the system generated slight variation in Run 1 (90.6%), Run 2 (88.3%), Run 3 (83.0%) and Run 4 (92.0%). Removal rates were lower as the up-flow rate increased to 3.12 m/h and the reasons causing this are reviewed later with the average total nitrogen removal rate.
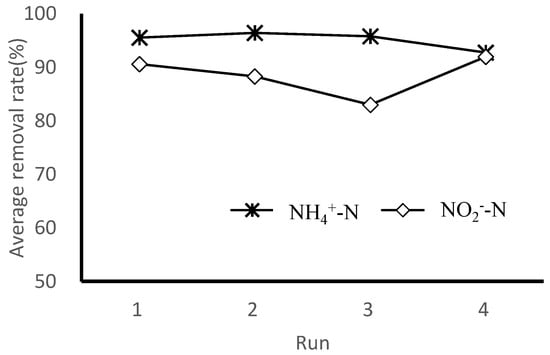
Figure 3.
Average removal rate of NH4+–N and NO2−–N for each test run (The removal rate of NH4+–N and NO2−–N were not affected by the up-flow rate.).
The average total nitrogen volume loading rate (NLR) and average total nitrogen volume removal rate (NRR) for each run are shown in Figure 4. The average total nitrogen volume loading is the amount of total nitrogen (including NH4+–N and NO2−–N) for each unit of volume in the reactor per day, which represents the intensity of pollutants per unit volume in the reactor; the average total nitrogen volume removal rate is the amount of total nitrogen removal per unit of volume in the reactor per day; the closer the two values are, the higher the removal rate is, and the pollutants entering the reactor can be completely removed. The total nitrogen loading rates for each run are 0.2 g-N/m3/d for Run 1, 0.2 g-N/m3/d for Run 2, 0.23 g-N/m3/d for Run 3 and 0.21 g-N/m3/d for Run 4, and the total nitrogen loading rate for Run 3 is slightly higher than those of other runs. This is due to the slightly higher concentration of NO2−–N in the influent because reagents were sourced from different suppliers.
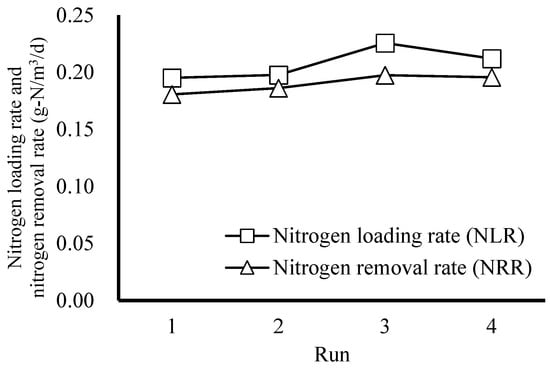
Figure 4.
NLR and NRR in effluent for each test run (NLR and NRR were not affected by the up−flow rate).
The mean total nitrogen removal rate, the mean NH4+–N removal rate and the mean NO2−–N removal rate were almost the same at different up-flow rates, indicating that the up-flow rate did not affect the removal of NH4+–N and NO2−–N. The ratios of NH4+–N and NO2−–N conversion in each run were similar to the anaerobic ammonia oxidation conversion ratios proposed by Strous et al. [3] and conformed with the theoretical values.
In addition, there was no obvious difference between the three volume removal rates in Run 3 and the other runs, but the removal rate was slightly lower than those in other runs. After comparing the average total nitrogen volume loading and the influent water quality data, it was found that Run 3 had a higher concentration of NO2−–N in the influent water, which led to a higher base for the calculation of the nitrite removal rate, thus resulting in a lower removal rate.
3.2. Effect of Up-Flow Rate on the Growth Rate of Anaerobic Ammonia Oxidation Sludge
To understand the relationship between the up-flow rate and the property of anaerobic ammonium oxidation sludge, the MLVSS concentration and sludge bed height of the sludge in the reactor were measured at the beginning and end of each test run, and the above data were used to calculate the sludge growth rate for each test run according to Equation (1) for comparison.
where A is sludge bed height at the end of the test run and B is sludge bed height at the beginning of the test run.
The operating results and sludge characteristic analysis of each test run are shown in Table 2. Figure 5 shows the relationship between the analysis results of sludge concentration and the up-flow rate for each test run. As the up-flow rate gradually increased from 1.95 m/h in Run 1 to 3.12 m/h in Run 3, the sludge concentration in the reactor also rose; however, as the up-flow rate increased to 3.70 m/h in Run 4, the sludge concentration started to decrease again. The sludge concentration increased from 1217 mg/L to 1483 mg/L, and MLVSS increased from 1027 mg/L to 1220 mg/L in Run 3. The other three tests showed negative growth, especially in the sludge concentration, which decreased sharply in Run 1 at an up-flow rate of 1.95 m/h, with MLSS and MLVSS decreasing by 726 mg/L and 519 mg/L, respectively.
Table 2.
Operating results and results of sludge property for each test run.
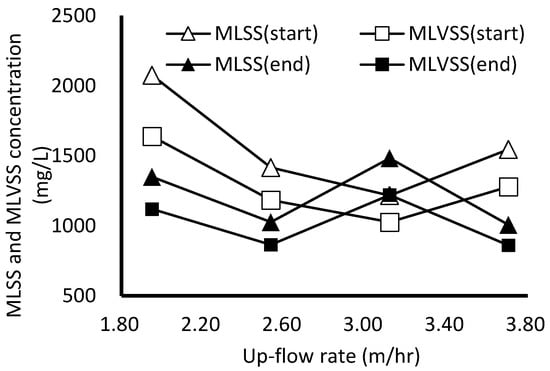
Figure 5.
Variation in sludge concentration for each test run (The sludge concentration was affected by the up-flow rate, and only the 3.12 m/h flow rate would promote an increase in the sludge concentration).
4. Discussion
Based on the sludge concentration analysis results, being inferred that the sludge concentration is low because the flow rate is too low and the sludge particles are less likely to collide with each other, it is not easy to generate a large amount of sludge floc. However, as the up-flow rate increases, the possibility of sludge mutual collision rises and the sludge concentration also increases, reaching the highest value in Run 3. However, the sludge is scattered and decomposed by the shear force caused by the higher up-flow rate in Run 4, which causes the sludge concentration to decrease.
The relationship between sludge growth rate, sludge growth height and up-flow rate is shown in Figure 6. The best sludge growth rate of 0.0283 mgVSS/mgVSS-day was observed at the up-flow rate of 3.12 m/h, while the other three groups had negative growth rates: ranked from high to low, −0.0011 mgVSS/mgVSS-day at 2.53 m/h, −0.0026 mgVSS/mgVSS-day at 3.70 m/h, and −0.0096 mgVSS/mgVSS-day at 1.95 m/h. Both the sludge growth rate and sludge growth height increased with up-flow rates below 3.12 m/h and reached the maximum value at the upstream flow rate of 3.12 m/h in Run 3. As the up-flow rate was increased to 3.70 m/h in Run 4, on the contrary, both were decreased.
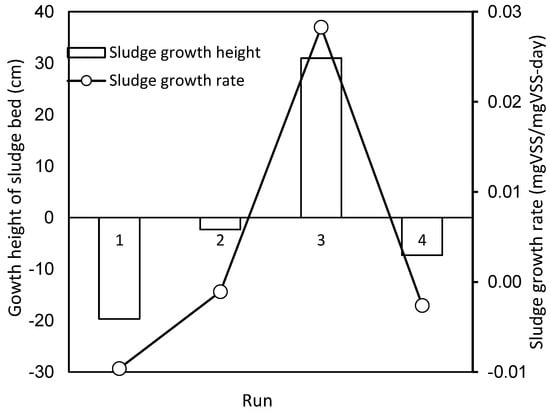
Figure 6.
Growth height and growth rate of sludge for each test run (Growth height and growth rate of sludge were affected by the up-flow rate, and only the 3.12 m/h flow rate would promote the increase in growth height and growth rate of sludge).
It is found that the sludge growth rate and its growth height have the same trend: as the sludge growth height increases, the sludge growth rate also increases; as the sludge height decreases, its growth rate also decreases, and it is affected by the up-flow rate. In comparison with the trend of sludge concentration at the end of the test run in Figure 6, it was found that there was the same trend of sludge concentration regarding sludge growth rate and its growth height. Except for Run 1, all other three test runs showed that the sludge growth rate and sludge growth height increased when the sludge concentration increased, as shown in Figure 7.
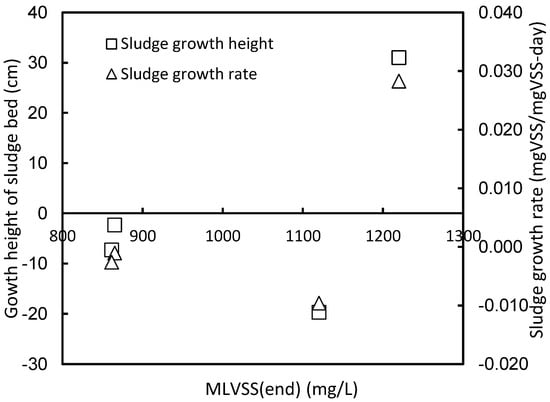
Figure 7.
Comparison of anaerobic ammonia oxidation sludge proliferation for each test run (Except for Run 1: the sludge growth rate and sludge growth height increased with increasing sludge concentration).
Based on the results in Table 2, the average removal rate of total nitrogen was not related to the up-flow rate in each run, concluding that the total nitrogen removal was similar in each run. Therefore, it was assumed that the ratio of biomass production of anaerobic ammonia-oxidizing bacteria and total nitrogen removal in the tank remained unchanged; NO3−–N production related to sludge proliferation was detected in the effluent water of each test run.
However, the results in Figure 6 show that there was only obvious sludge proliferation in Run 3. Referring to the results in Figure 7, it was inferred that the sludge bed height could not be increased under the operating condition of low up-flow rate, so it is not easy to produce much sludge floc and the sludge concentration is low. Because the sludge floc is small and the specific gravity is low, it is easy to be lost, so the sludge proliferation rate is negative.
As the up-flow rate increases, the sludge particles collide with each other to form a larger floc which increases the density of sludge and causes the sludge concentration to increase and reach the maximum value in Run 3. The sludge floc is larger and less likely to be lost, so it can be retained in the tank, the sludge bed height increases significantly and the final result shows that the sludge proliferation rises significantly.
However, as the flow rate of Run 4 was increased to 3.70 m/h, the shear force caused by the higher flow rate resulted in the sludge floc being scattered and decomposed by the shear force, the specific gravity decreased, resulting in a decrease in sludge concentration and easy loss, and the height of sludge bed was lowered; the growth rate of sludge was negative.
In previous works in the literature, it was indicated that the up-flow rate of UASB for anaerobic microorganisms is controlled at 1.5–1.75 m/h [25]. It was also proposed that sludge particles may be discomposed due to shear force at up-flow rates higher than 1 m/h [26]. On the other hand, Yoda et al. suggested that a better mass transfer would lead to an increase in biomass in the reactor at up-flow rates between 3 to 3.4 m/h [27], which is similar to our results. Moreover, Tiwari et al. [10] summarized the results of previous research data and also stated that a higher up-flow rate can promote mass transfer and cause toxic substances metabolized by the sludge less likely to be accumulated in the tank, so it can reduce the sludge activity affected by these toxic substances, thus enhancing the sludge activity.
The results of the combined data are summarized as Table 2. The efficiency of nitrogen wastewater made by artificial anaerobic ammonia oxidation sludge metabolism was more than 90% at different up-flow rates, but the growth in anaerobic ammonia oxidation sludge was significantly differential. It can be reasonably assumed that the up-flow rate has a significant effect on anaerobic ammonia oxidation sludge growth, which is the same as the results of previous reports [24,28].
5. Conclusions
Summarizing the results of the above runs, the conclusions shown are as follows:
- The mean total nitrogen removal rate was the same for different up-flow rates;
- The concentration, accretion value and growth rate of sludge were all maximized under the operating condition of up-flow rate = 3.21 m/h, which was the key to sludge accretion;
- When the up-flow rate is lower than 3.21 m/h, it is not easy to produce a large amount of sludge floc; the sludge concentration is lower and easier to be lost; and the height of the sludge bed is not increased to make the sludge growth rate negative;
- When the up-flow rate exceeds 3.21 m/h, the shear force caused by the higher up-flow rate results in the sludge floc being scattered, the specific gravity is lowered and the height of sludge bed cannot be increased, so the volume of sludge cannot be increased significantly;
- The up-flow rate has a significant effect on sludge properties such as sludge concentration, sludge accretion height and sludge growth rate, and the best sludge properties are obtained at the up-flow rate of 3.21 m/h.
Author Contributions
Investigation, W.-Y.C.; Writing–original draft, W.-Y.C.; Writing – review & editing, T.-Y.T.; Project administration, T.-Y.T. All authors have read and agreed to the published version of the manuscript.
Funding
This research received no external funding.
Conflicts of Interest
The authors declare no conflict of interest.
References
- Zhang, L.; Narita, Y.; Gao, L.; Ali, M.; Oshiki, M.; Okabe, S. Maximum specific growth rate of ANAMMOX bacteria revisited. Water Res. 2017, 116, 296–303. [Google Scholar] [CrossRef] [PubMed]
- van der Star, W.R.L.; Abma, W.R.; Bolmmers, D.J.W.; Tokutomi, T.; Strous, M.; Picioreanu, C.; van Loosdrecht, M.C.M. Startup of reactors for anoxic ammonium oxidation: Experiences from the first full-scale ANAMMOX reactor in Rotterdam. Water Res. 2007, 41, 4149–4163. [Google Scholar] [CrossRef] [PubMed]
- Strous, M.; Fuerst, J.-A.; Kramer, E.-H.M.; Logemann, S.; Muyzer, G.; van de Pas-Schoonen, K.T.; Webb, R.J.; Kuenen, G.; Jetten, M.-S.M. Missing lithotroph identified as new planctomycete. Nature 1999, 143, 446–499. [Google Scholar] [CrossRef]
- Jetten, M.S.M.; Wagner, M.; Fuerst, J.; van Loosdrecht, M.; Kuenen, G.; Strous, M. Microbiology and application of the anaerobic ammonium oxidation (‘ANAMMOX’) process. Curr. Opin. Plant Biol. 2001, 12, 283–288. [Google Scholar] [CrossRef] [PubMed]
- Shi, Z.J.; Guo, Q.; Xu, Y.Q.; Wu, D.; Liao, S.M.; Zhang, F.Y.; Zhang, Z.Z.; Jin, R.C. Mass transfer characteristics, rheological behavior and fractal dimensions of biogas particles: The role of upflow velocity and temperature. Bioresour. Technol. 2017, 244, 117–124. [Google Scholar] [CrossRef] [PubMed]
- Du, R.; Cao, S.; Li, B.; Zhang, H.; Wang, S.; Peng, Y. Synergistic effects of partial denitrification and anaerobic bacterial action for simultaneous removal of nitrate and ammonia at room temperature in a continuous-feed up-flow sludge bed reactor. Bioresour. Technol. 2018, 274, 386–394. [Google Scholar] [CrossRef] [PubMed]
- Rehman, A.; Zohaib, U.; Wu, J.; Li, Z.H.; Akand, R.; Cao, Z.P.; Poncin, S.; Li, H.Z. New insights into spatial mass transfer con-ditions in upflow anaerobic reactors. J. Clean. Prod. 2018, 204, 390–398. [Google Scholar]
- Lettinga, G.; van Velsen, A.F.M.; Hobma, S.W.; de Zeeuw, W.; Klapwijk, A. Use of the upflow sludge blanket (USB) reactor concept for biological wastewater treatment, especially for anaerobic treatment. Biotechnol. Bioeng. 1980, 22, 699–734. [Google Scholar] [CrossRef]
- Schmidt, J.E.; Ahring, B.K. Granular sludge formation in upflow anaerobic sludge blanket (UASB) reactors. Biotechnol. Bioeng. 1996, 49, 229–246. [Google Scholar] [CrossRef]
- Tiwari, M.K.; Guha, S.; Harendranath, C.S.; Tripathi, S. Effect of extraneous factors on granulation in UASB reactors. Appl. Microbiol. Biotechnol. 2006, 71, 145–154. [Google Scholar] [CrossRef]
- Muhammad, A.A.; Rumana, G.; Zularisam, A.W.; Anwar, A. Integrated application of upflow anaerobic sludge blanket reactor for the treatment of wastewaters. Water Res. 2011, 45, 4683–4699. [Google Scholar]
- Owusu-Agyeman, I.; Malovanyy, A.; Plaza, E. UASB/anammox technology: A sustainable approach for energy recovery and cost effective nitrogen removal from wastewater. In Proceedings of the International Research Initiative Conference (IRIC), Accra, Ghana, 7–8 October 2014. [Google Scholar]
- Mainardis, M.; Buttazzoni, M.; Goi, D. Upflow anaerobic sludge blanket (UASB) technology for energy recovery. A review on the state of the art and recent technological advances. Bioengineering 2020, 7, 43. [Google Scholar] [PubMed]
- Bolle, W.L.; van Breugel, J.; van Eybergen, G.C.; Kossen, N.W.F.; Zoetemeyer, R.J. Modelling of liquid flow in an upflow anaerobic sludge blanket reactor. Biotechnol. Bioeng. 1986, 28, 1615–1620. [Google Scholar] [CrossRef]
- Peña, M.R.; Mara, D.D.; Avella, G.P. Dispersion and treatment performance analysis of an UASB reactor under different hy-draulic loading rates. Water Res. 2006, 40, 445–452. [Google Scholar] [CrossRef] [PubMed]
- Arrojo, B.; Figueroa, M.; Mosquera-Corral, A.; Campos, J.L.; Méndez, R. Influence of gas flow-induced shear stress on the op-eration of the ANAMMOX process in a SBR. Chemosphere 2008, 72, 1687–1693. [Google Scholar] [CrossRef] [PubMed]
- Daud, M.K.; Rizvi, H.; Akram, M.F.; Ali, S.; Rizwan, M.; Nafees, M.; Jin, Z.S. Review of Upflow Anaerobic Sludge Blanket Reactor Technology: Effect of Different Parameters and Developments for Domestic Wastewater Treatment. J. Chem. 2018, 2018, 1596319. [Google Scholar] [CrossRef]
- Letelier-Gordo, C.O.; Martin Herreros, M. Denitrifying granules in a marine Upflow Anoxic Sludge Bed (UASB) reactor. Aquac. Eng. 2019, 84, 42–49. [Google Scholar] [CrossRef]
- Heertjes, P.M.; Van Der Meer, R.R. Dynamics of liquid flow in an up-flow reactor-used for anaerobic treatment of wastewater. Biotechnol. Bioeng. 1978, 20, 1577–1594. [Google Scholar] [CrossRef]
- Heertjes, P.M.; Kujivenhoven, L.I.; Van Der Meer, R.R. Fluid flow patterns in an upflow reactor for the anaerobic treatment of sugar beet factory wastewater. Biotechnol. Bioeng. 1982, 24, 443–459. [Google Scholar] [CrossRef]
- Bolle, W.L.; van Breugel, J.; van Eybergen, G.C.; Kossen, N.W.F.; van Gils, W. An integral dynamic model for the UASB reactor. Biotechnol. Bioeng. 1986, 28, 1621–1636. [Google Scholar] [CrossRef]
- Beun, J.J.; van Loosdrecht, M.C.; Heijnen, J.J. Aerobic granulation. Water Sci. Technol. 2000, 41, 41–48. [Google Scholar] [CrossRef]
- Van der Star, W.R.L. Growth and Metabolism of Anammox Bacteria. Ph.D. Thesis, TU Delft, Delft, The Netherlands, 15 April 2008; p. 25. [Google Scholar]
- Reino, C.; Carrera, J. Low-strength wastewater treatment in an ANAMMOX UASB reactor: Effect of the liquid upflow velocity. Chem. Eng. J. 2017, 313, 217–225. [Google Scholar] [CrossRef]
- Hulshoff Pol, L.W.; Heijnekamp, K.; Lettinga, G. The selection pressure as a driving force behind the granulation of anaerobic sludge. In Granular Ananerobic Sludge: Microbiology and Technology; Lettinga, G., Zehnder, A.J.B., Grotenhuis, J.T.C., Hulshoff Pol, L.W., Eds.; Pudoc: Wageningen, The Netherlands, 1988; pp. 153–161. [Google Scholar]
- Kosaric, N.; Blaszczyk, R.; Orphan, L. Factors influencing formation and maintenance of granules in upflow anaerobic sludge blanket reactors (UASBR). Water Sci. 1990, 22, 275–282. [Google Scholar] [CrossRef]
- Yoda, M.; Kitagawa, M.; Miyaji, Y. Granular Sludge Formation in the Anaerobic Expanded Micro-Carrier Bed Process. Water Sci. Technol. 1989, 21, 109–120. [Google Scholar] [CrossRef]
- Show, K.Y.; Yan, Y.; Yao, H.; Guo, H.; Li, T.; Show, D.Y.; Chang, J.S.; Lee, D.J. Anaerobic granulation: A review of granulation hypotheses, bioreactor designs and emerging green applications. Bioresour. Technol. 2020, 300, 122751. [Google Scholar] [CrossRef]


Publisher’s Note: MDPI stays neutral with regard to jurisdictional claims in published maps and institutional affiliations. |
© 2022 by the authors. Licensee MDPI, Basel, Switzerland. This article is an open access article distributed under the terms and conditions of the Creative Commons Attribution (CC BY) license (https://creativecommons.org/licenses/by/4.0/).