Article

Influence of Thermal Behavior on the Safety Performance of the Pit Enclosure near Railway Foundations under Solar Radiation

Postgraduate Department, China Academy of Railway Sciences, Beijing 100081, China
Sustainability 2022, 14(24), 17001; https://doi.org/10.3390/su142417001
Submission received: 12 October 2022 / Revised: 10 December 2022 / Accepted: 16 December 2022 / Published: 19 December 2022

Abstract

:
Thermal behavior often affects the performance of thin-walled steel structures and even becomes one of the controlling loads. Steel pipes are often used in foundation pit support. This problem of the thermal stress of steel pipes is very important. The Huhang Railway, a section of the high-speed railway from Huzhou to Hangzhou in Zhejiang Province, China, was examined in this study. In this paper, the displacement and stress in pit 358# of the Huhang Railway near the railway foundation was monitored, and a thermal coupling model was established. The temperature field distribution inside the foundation pit was calculated through solar radiation and ambient temperature, and the displacement and stress of the supporting structure and enclosure structure were calculated using the thermal expansion coefficient. The following conclusions were drawn from the comparison: (1) In addition to solar radiation, ambient radiation should also be taken into account at the same time, especially in the calculation of the substructure. (2) The temperature of the support structure was unevenly distributed, and the maximum temperature difference between the steel pipes on the east and west sides could reach from 18.9 °C up to 58.8 °C. The height angle of solar radiation was the main factor that led to this situation. (3) The difference in stress between the support structure and the enclosure structure was positively related to the change in temperature. When the temperature rose, the stress increased, and the horizontal displacement of the enclosure structure decreased, which was beneficial to the stability of the foundation pit and vice versa. (4) The thermal behavior had different effects on the stress at different depths and times, and had spatial and temporal heterogeneity. The enclosure stresses had a certain delay in response to temperature changes. The reasons for this are yet to be investigated.

1. Introduction

For steel components, solar radiation is a major contributor to thermal stress, and the absorption and reflection of solar radiation vary with the type of color of the steel component lacquer [1]. Most of the components are exposed to the environment and affected by ambient temperature and solar radiation [2]. In practice, the temperature of steel elements can be much higher than the air temperature so that, in the calculations, the solar radiation influence must be considered in the thermal load analysis of the steel structures [3]. The shape of steel members also affects the temperature field distribution under solar radiation [4]. Based on the studies of the above scholars, it is clear that thermal radiation has an effect on the stresses in steel structures.
Different researchers have calculated the temperature effects of large-span buildings, such as bridges, domes, and dams, through experiments or modeling [5,6,7]. For the problem of thermal behaviors in foundation pits, Jin et al. and Xiang analyzed the effect of temperature stress on the axial force of the internal support bars and the deformation of the supporting structure. They summarized a simple method to calculate thermal stress [8,9]. In the research of numerical simulation, Zhou et al. studied the temperature field of a cross-section of rectangular steel pipe concrete members under solar radiation and found that the temperature field had non-linear characteristics [10]. Hu et al. found that there was a temperature difference between the inside and outside of a foundation pit ground connection wall [11]. After the actual project was completed, it still needed to be monitored to ensure the project quality and safety [12]. Zhang discussed the sensitivity of high-speed railway bridges to the construction impact of adjacent piles through the study of monitoring values [13]. In summary, the solar radiation has an impact on the safety of large structures.
Some researchers simulated solar radiation through numerical simulation software, as commercial computing software has been proven to be accurate [14,15]. However, these studies do not combine numerical calculations with practical monitoring very well [16,17]. The problem of non-uniform temperature fields under solar radiation is not explained from the perspective of theoretical calculations [18,19,20]. In addition, there are few investigations that referred to the thermal behavior. In summary, many scholars have performed monitoring analysis of structures and demonstrated the feasibility of COMSOL software to perform relevant multi-physics field coupling calculations, but there is still a lack of comprehensive consideration of monitoring values, numerical simulation studies, and related correlation analysis.
In this paper, the foundation pit project of the Yuhang Grand Bridge (358#) was modeled in the Huhang Railway around the high-speed railway. The temperature field of the supporting and enclosure structures was calculated using radiation theory and heat transfer theory. The displacement field of the elements in the pit was calculated for the thermal expansion effect. Finally, the study explored the effect of temperature field changes on the deformation of the pit support structure and the enclosure structure. Based on the comparison between the field monitoring values and the calculated values of the project, the study can be applied to similar projects and areas.

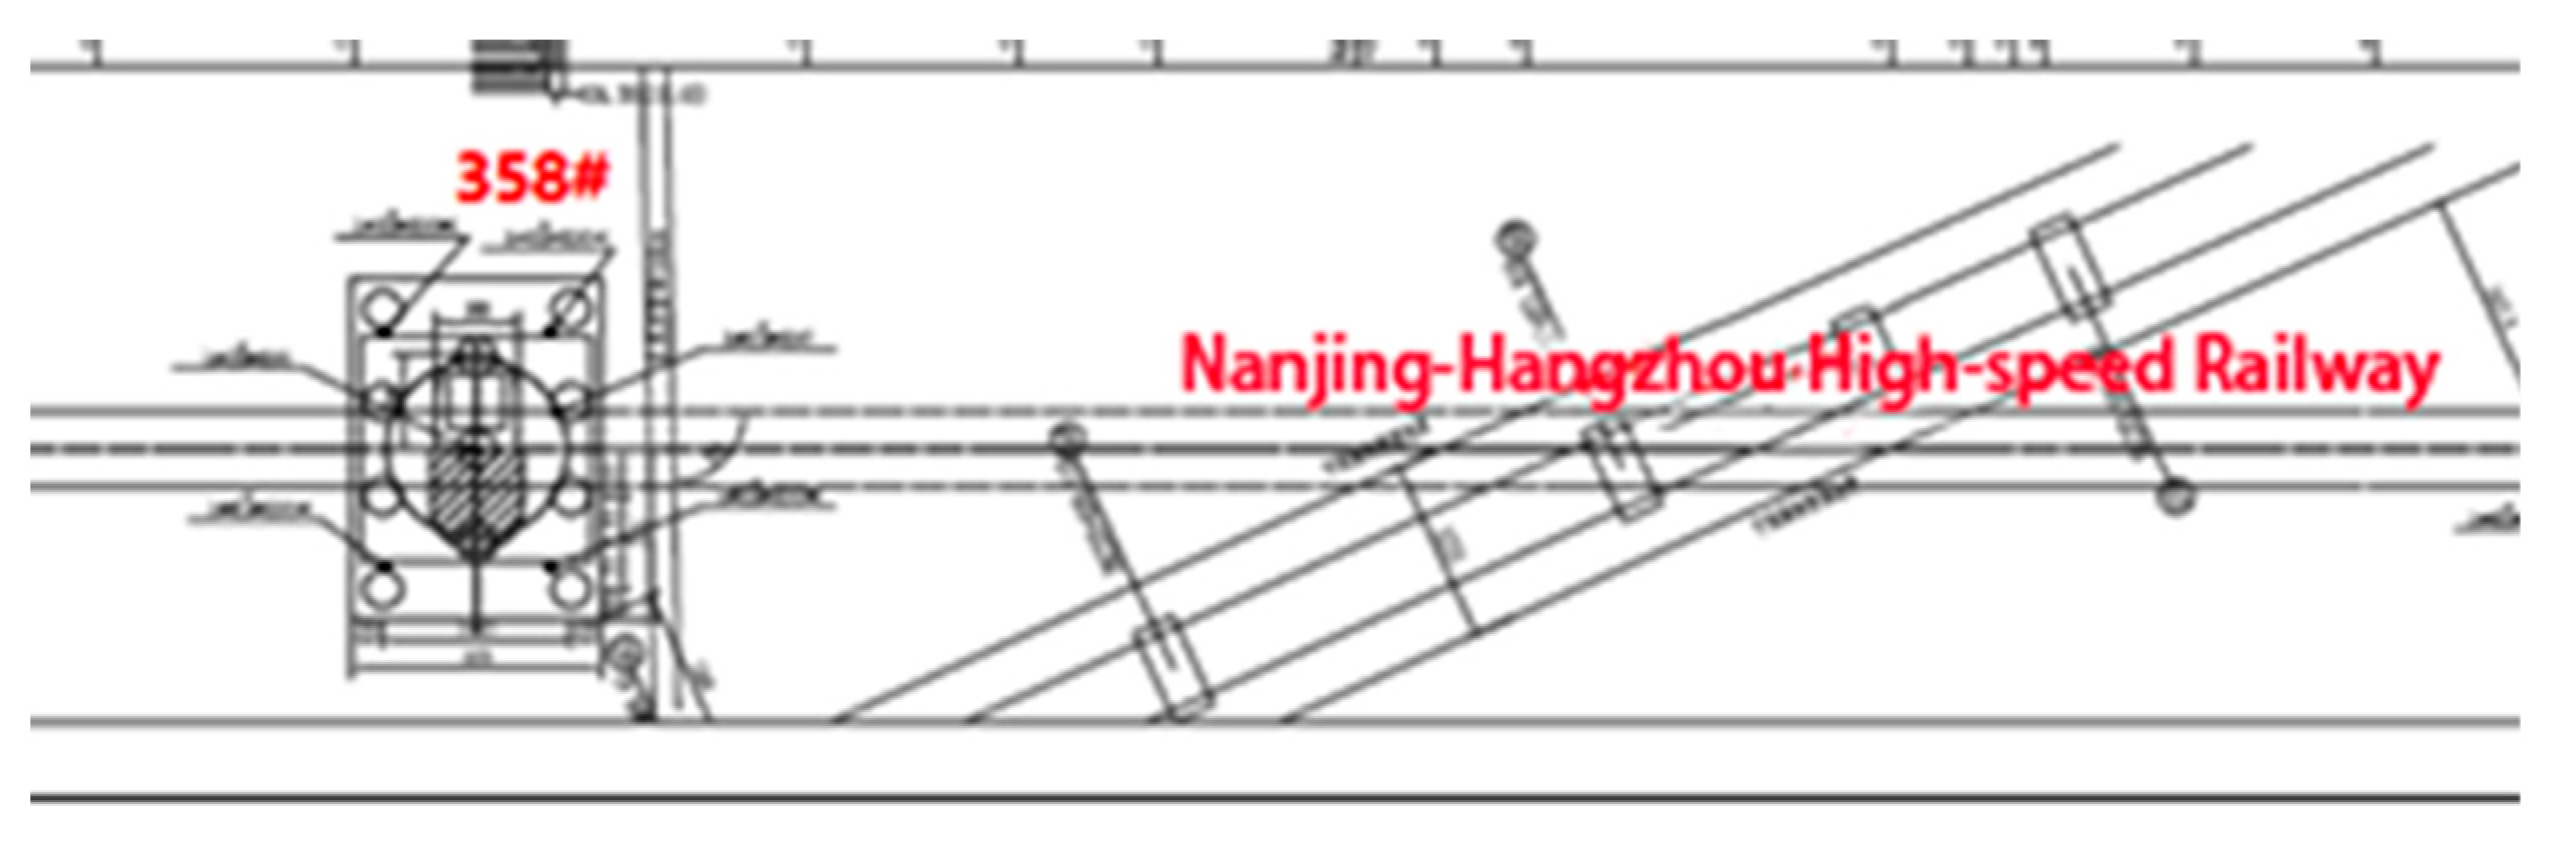
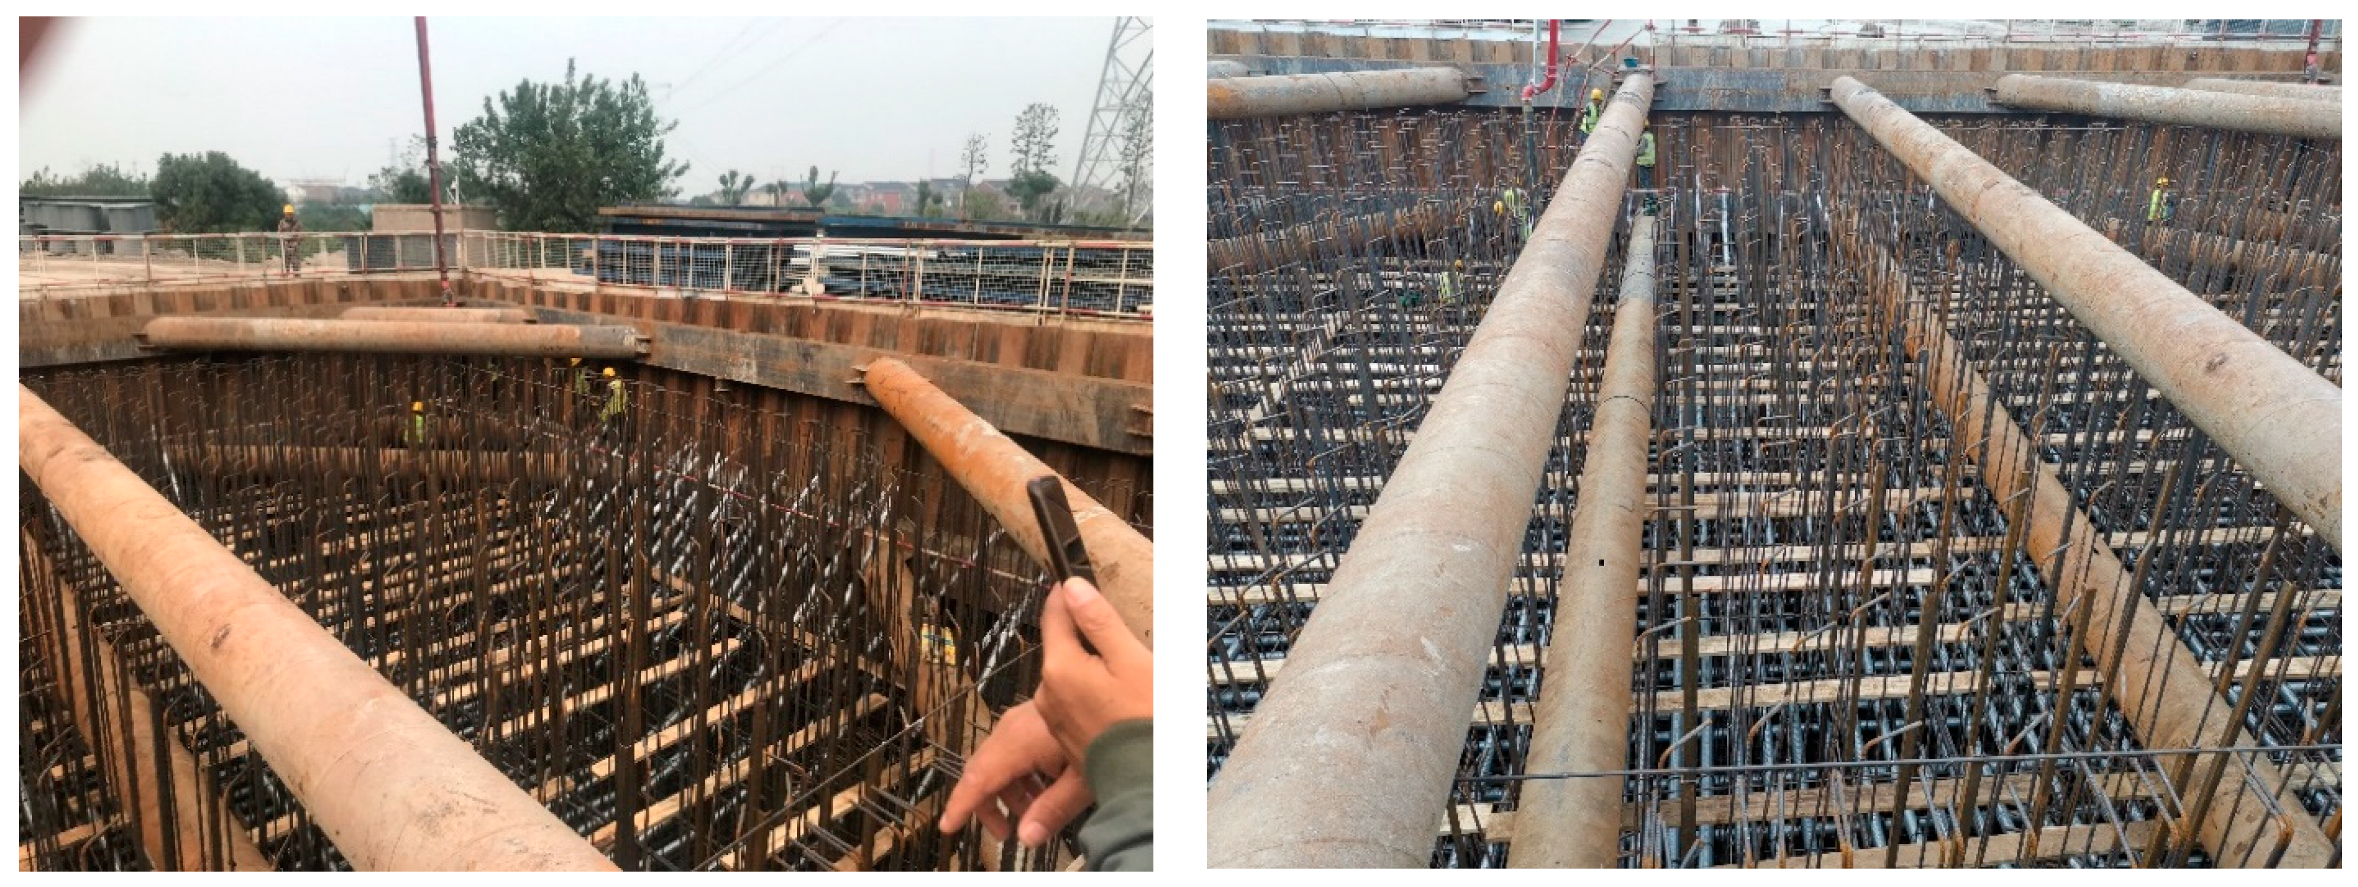
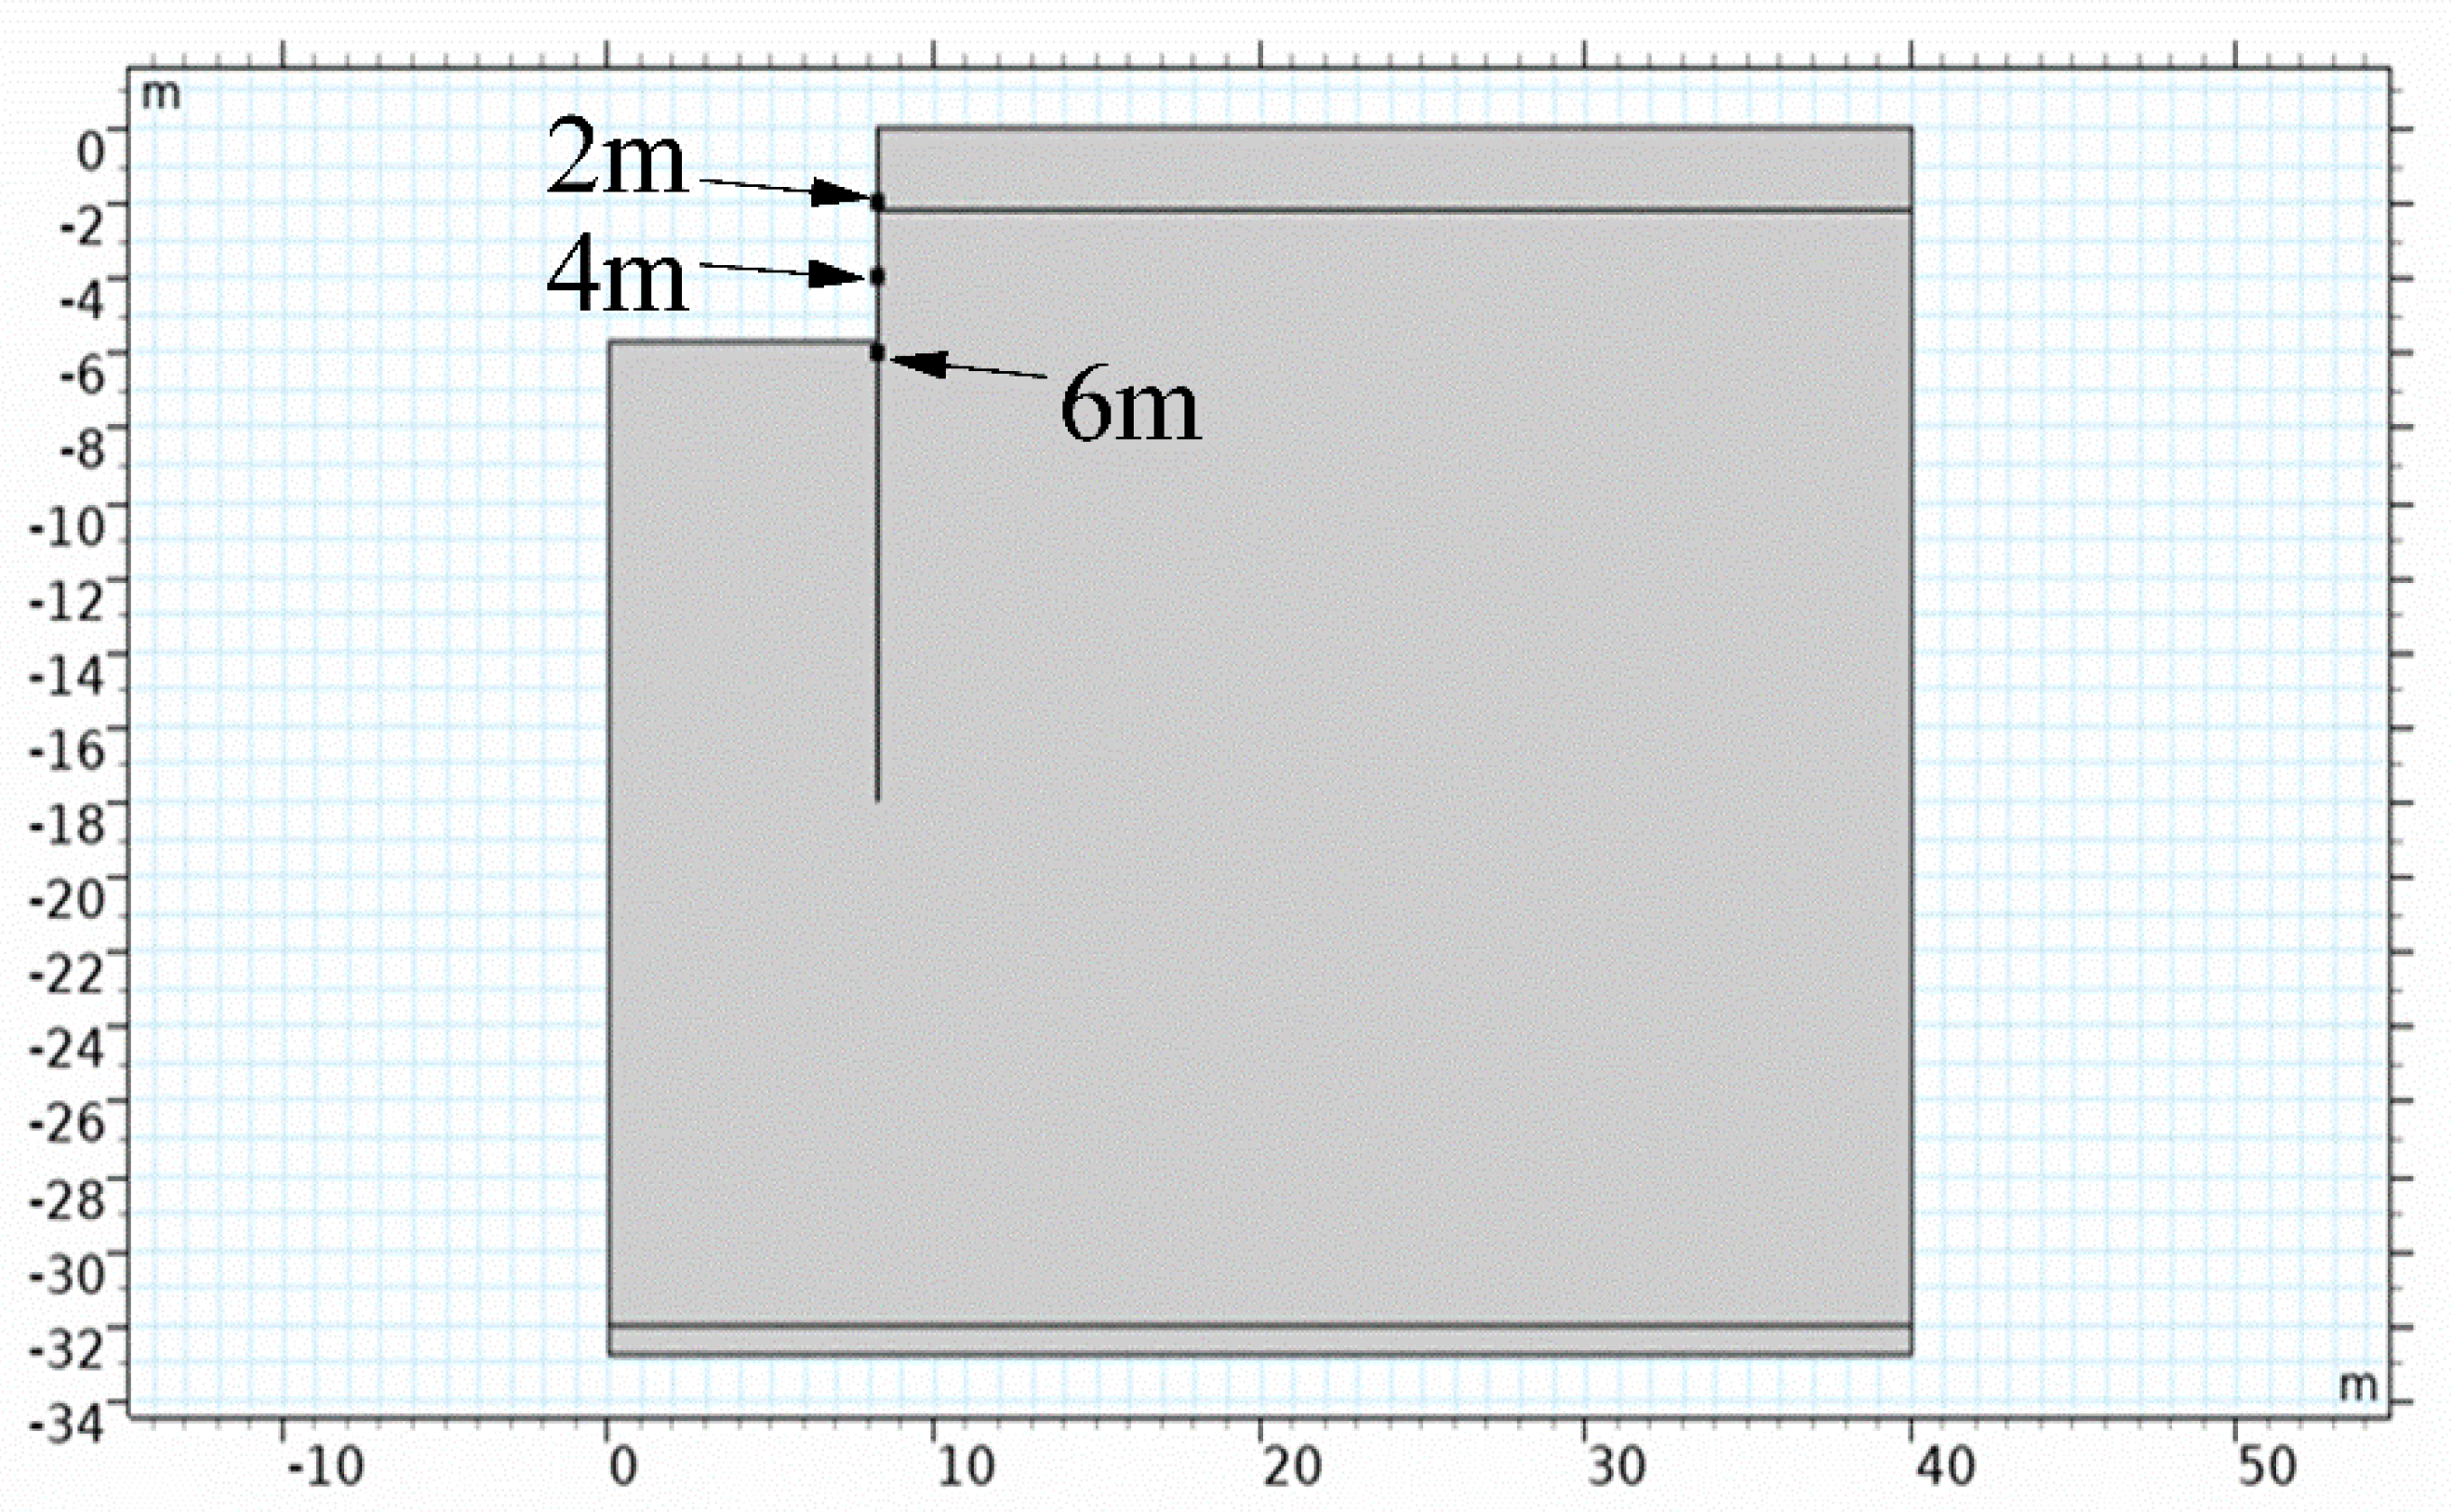
2. Engineering Background

The Yuhang Grand Bridge starts and ends at DK36 + 272.35-DK68 + 576.606, and has a total bridge length of 32.304 km, which starts at Deqing Station and ends at the Hangzhou West Elevated Station, which is an important part of the Huhang Railway. It is located in the town of Qian Yuan in Huzhou City, in Zhejiang Province, in the Sanyuan Township in Huzhou City, and in the Yuhang District in Hangzhou City. The bridge site is located along the railway bed, and the terrain is flat and open. The related distribution diagram is shown in Figure 1.The ground elevation is about 0.15–15.00 m.
The 358# pit is the foundation pit for the bearing platform of the Yuhang Grand Bridge, and is located on the west side of the existing Ning-Hang High-speed Railway; the pit is less than 20 m from the existing Ning-Hang High-speed Railway, and the excavation depth is more than 5 m, which uses steel sheet pile protection. The pit is 26 m long, 16.5 m wide, and 5.7 m deep. The purlins are made of two HW 400 × 400 mm sections, and the inner supports are made of φ 630 × 10 mm steel pipes. The enclosure structure adopts an 18 m deep Larsen Ⅳ steel sheet pile enclosure. The layout of the foundation pit support structure is shown in Figure 2. A major feature of the pit is the use of the steel sheet pile enclosure, which is dark in color, has good heat transfer properties, and may experience deformation and temperature stress under solar radiation.
The model needs to simulate the ambient temperature in Hangzhou. The average temperature in Hangzhou is 30 °C, with an average maximum temperature of 35 °C and a minimum average temperature of 27 °C. The geographical coordinates of Hangzhou are approximately 119° E, 30° N, and the time zone is in the eastern eight (UTC+8). The graph shows the average temperature of Hangzhou City on sunny days in June compared with the temperature curve entered in the model. The curve gives a better picture of what happens in HCM City during sunny days in June. The relevant temperature data are shown in Figure 3.

3. Modeling

The support structure had two layers, the thickness of the support steel pipe was 0.1 m, and the diameter was 0.63 m. The pit was square, with a length of 26 m, a width of 16.5 m, and a depth of 5.7 m. There were two layers at each of the four corner points, and each had a total of four support steel pipes. The east and west directions of the pit also had four steel pipe supports, giving a total of 20 steel pipes. Each steel pipe was numbered in turn from south to north, as shown in Figure 4. The diagram shows the upper layer of steel pipes numbered A1–A10, which correspond to the lower layer of steel pipes numbered B1–B10.The pit model was established as shown in Figure 5.The meshing had to account for the accuracy of the calculation and the calculation time. The support pipe was used as the key part of the meshing as the center of the mapping, and spread out to the remaining parts to form a meshing with the key points of the calculation spreading outwards. Such a division increases the accuracy of the critical part of the calculation and effectively reduces the calculation time, as has been shown in Yazgan [21] and Wu [22].
To calculate the temperature field under solar radiation, the intensity of the vertical solar irradiation was the first thing to be determined. The intensity of the solar radiation at different times of the day is influenced by the angle of the sun and the weather. According to the local temperature data in June, the diurnal temperature difference in the study area during summer was not large, and was generally less than 5 °C. The relevant data is shown in Figure 6. According to the literature [23], the diurnal temperature difference in the study area was considered negligible when it was less than 10 °C. Therefore, the effect of night cooling was not considered.
The solar radiation absorption coefficient is expressed as the ratio of the solar radiation absorbed by the object to the total solar radiation projected onto the surface of the object, and is between 0 and 1. The finish coating color and the finish coating type have a significant effect on the solar radiation absorption coefficient of the steel member [3]. As the supporting structure is a steel structure and the color is generally dark, the solar radiation absorption coefficient tends to be large, and the parameter chosen was 0.8. According to the heat transfer theory, the heat at the bottom of the pit will also spread through the airflow and, thus, influence the temperature of the enclosure and the supporting structure. According to the literature [19,20], the convection coefficient under a natural breeze has been simulated. The convection coefficient was chosen according to the airflow velocity in the pit, and the thermal convection coefficient was taken as 14. The temperature change leads to the deformation of the supporting structure and the enclosure structure, which in turn generates thermal stress.

4. Solar Radiation Parameter

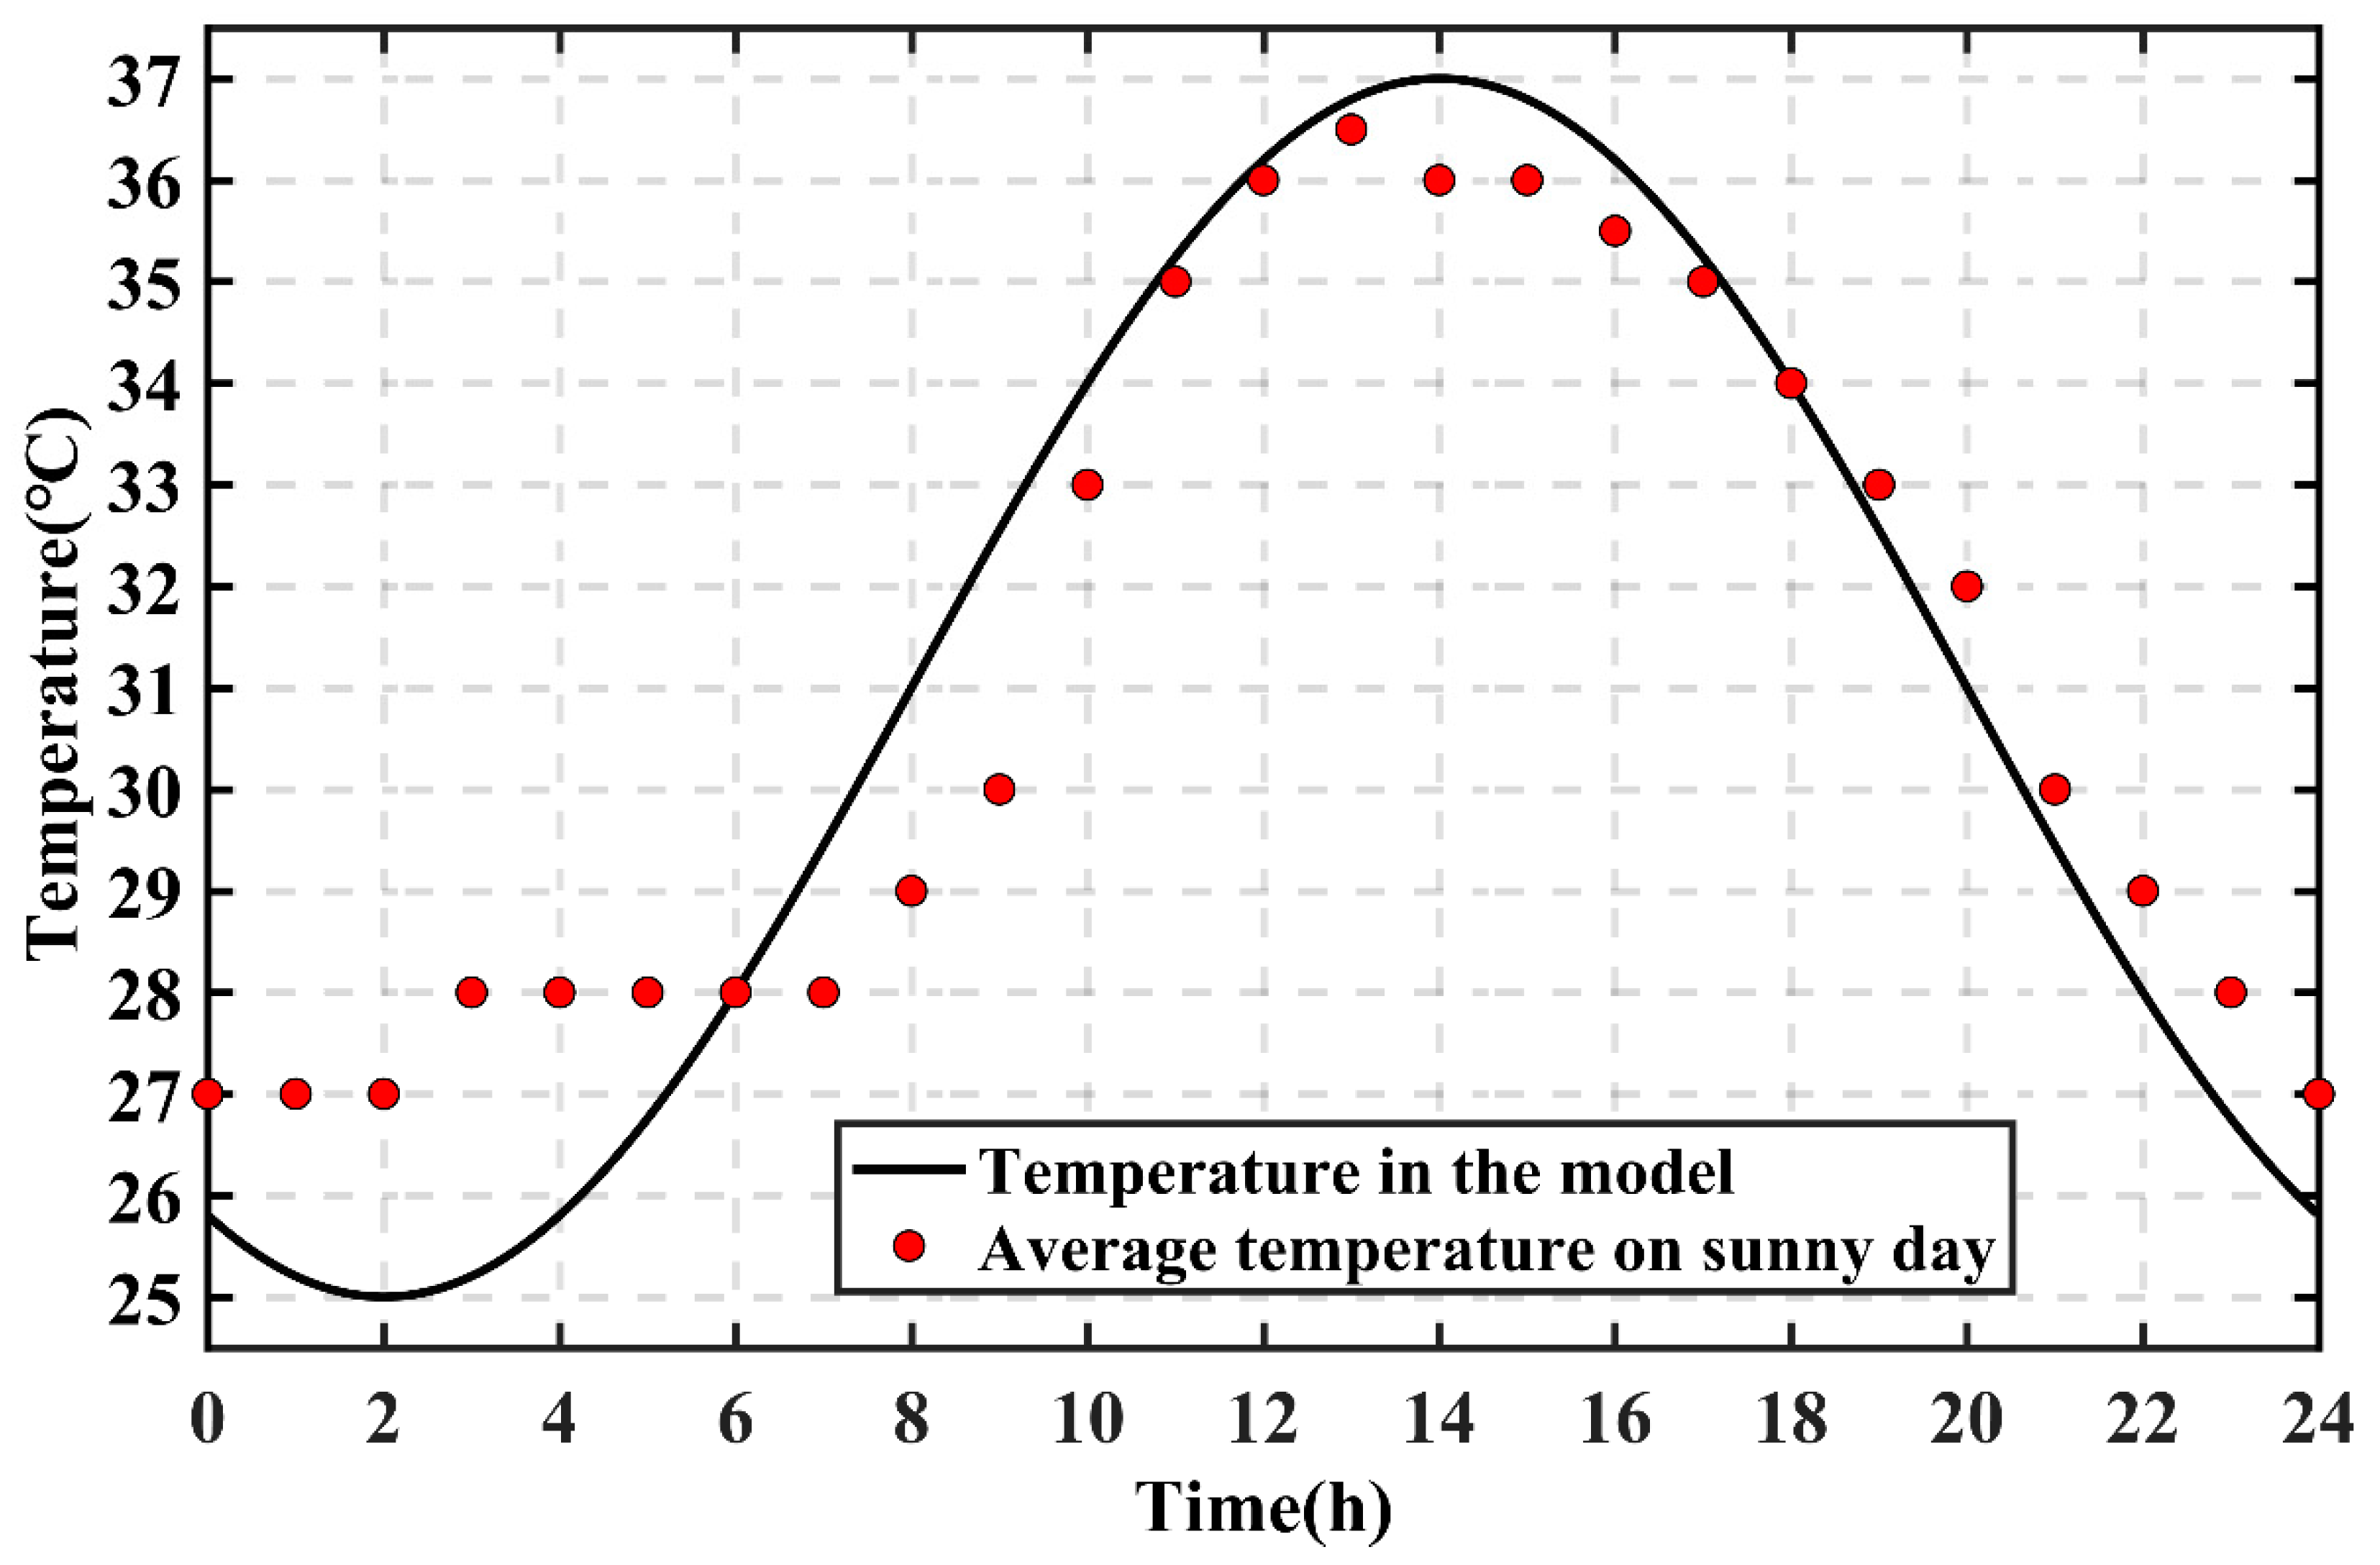
4.1. Temperature Field Calculation

The radiative heat transfer from the support structure consists of the following components: direct solar radiation, reflected solar radiation, and reflected radiation from the surrounding structure.
J i = λ i e b ( T ) F i ( T ) + ρ d G i
G = G m ( J ) + G a m b + G e x t
G a m b = F a m b e b ( T a m b )
where J i is total heat absorbed by an object; λ i is the solar radiation absorption coefficient; e b ( T ) is the solar radiation power; e b ( T a m b ) is the ambient intensity; F i ( T ) , F a m b is the ambient view factor of solar and ambient obscuration, with 0 for complete obscuration and 1 for no obscuration; T a m b is the ambient temperature; ρ d is the absorption coefficient; G is the irradiation; G m ( J ) is the total surface radiation; and G a m b is the total ambient radiation. In accordance with previous studies [14,15], the theoretical equation of solar radiation was established. Formula (1) shows that the total absorbed radiation amount of the steel pipe should be equal to the radiation amount of sun directly shining on the object and the long wave radiation amount. Formula (2) indicates that long wave radiation should include ground radiation and environmental radiation. Formula (3) shows the calculation method for environmental radiation and proposes the environmental angle coefficient, which measures the occlusion relationship between other objects and the object.
In the numerical simulation calculation, we first calculated the angle coefficient of solar radiation and environmental angle coefficient. We then calculated the radiation field of solar radiation and long wave radiation. Finally, we calculated the temperature change through the radiation field using the heat transfer module in order to obtain the temperature field of the foundation pit based on the time change. The occlusion relationship between objects was calculated using the method mentioned in [23], which proposed a method to judge the mutual occlusion of tubular structures. This paper also adopted the methods in the references, and the calculation result was the angle coefficient.
Table 1 shows the selected values of the parameters appearing in the formula. The thermal convection coefficient was calculated based on the wind speed in the foundation pit. The remaining parameters in the table were selected according to [3,4,23].

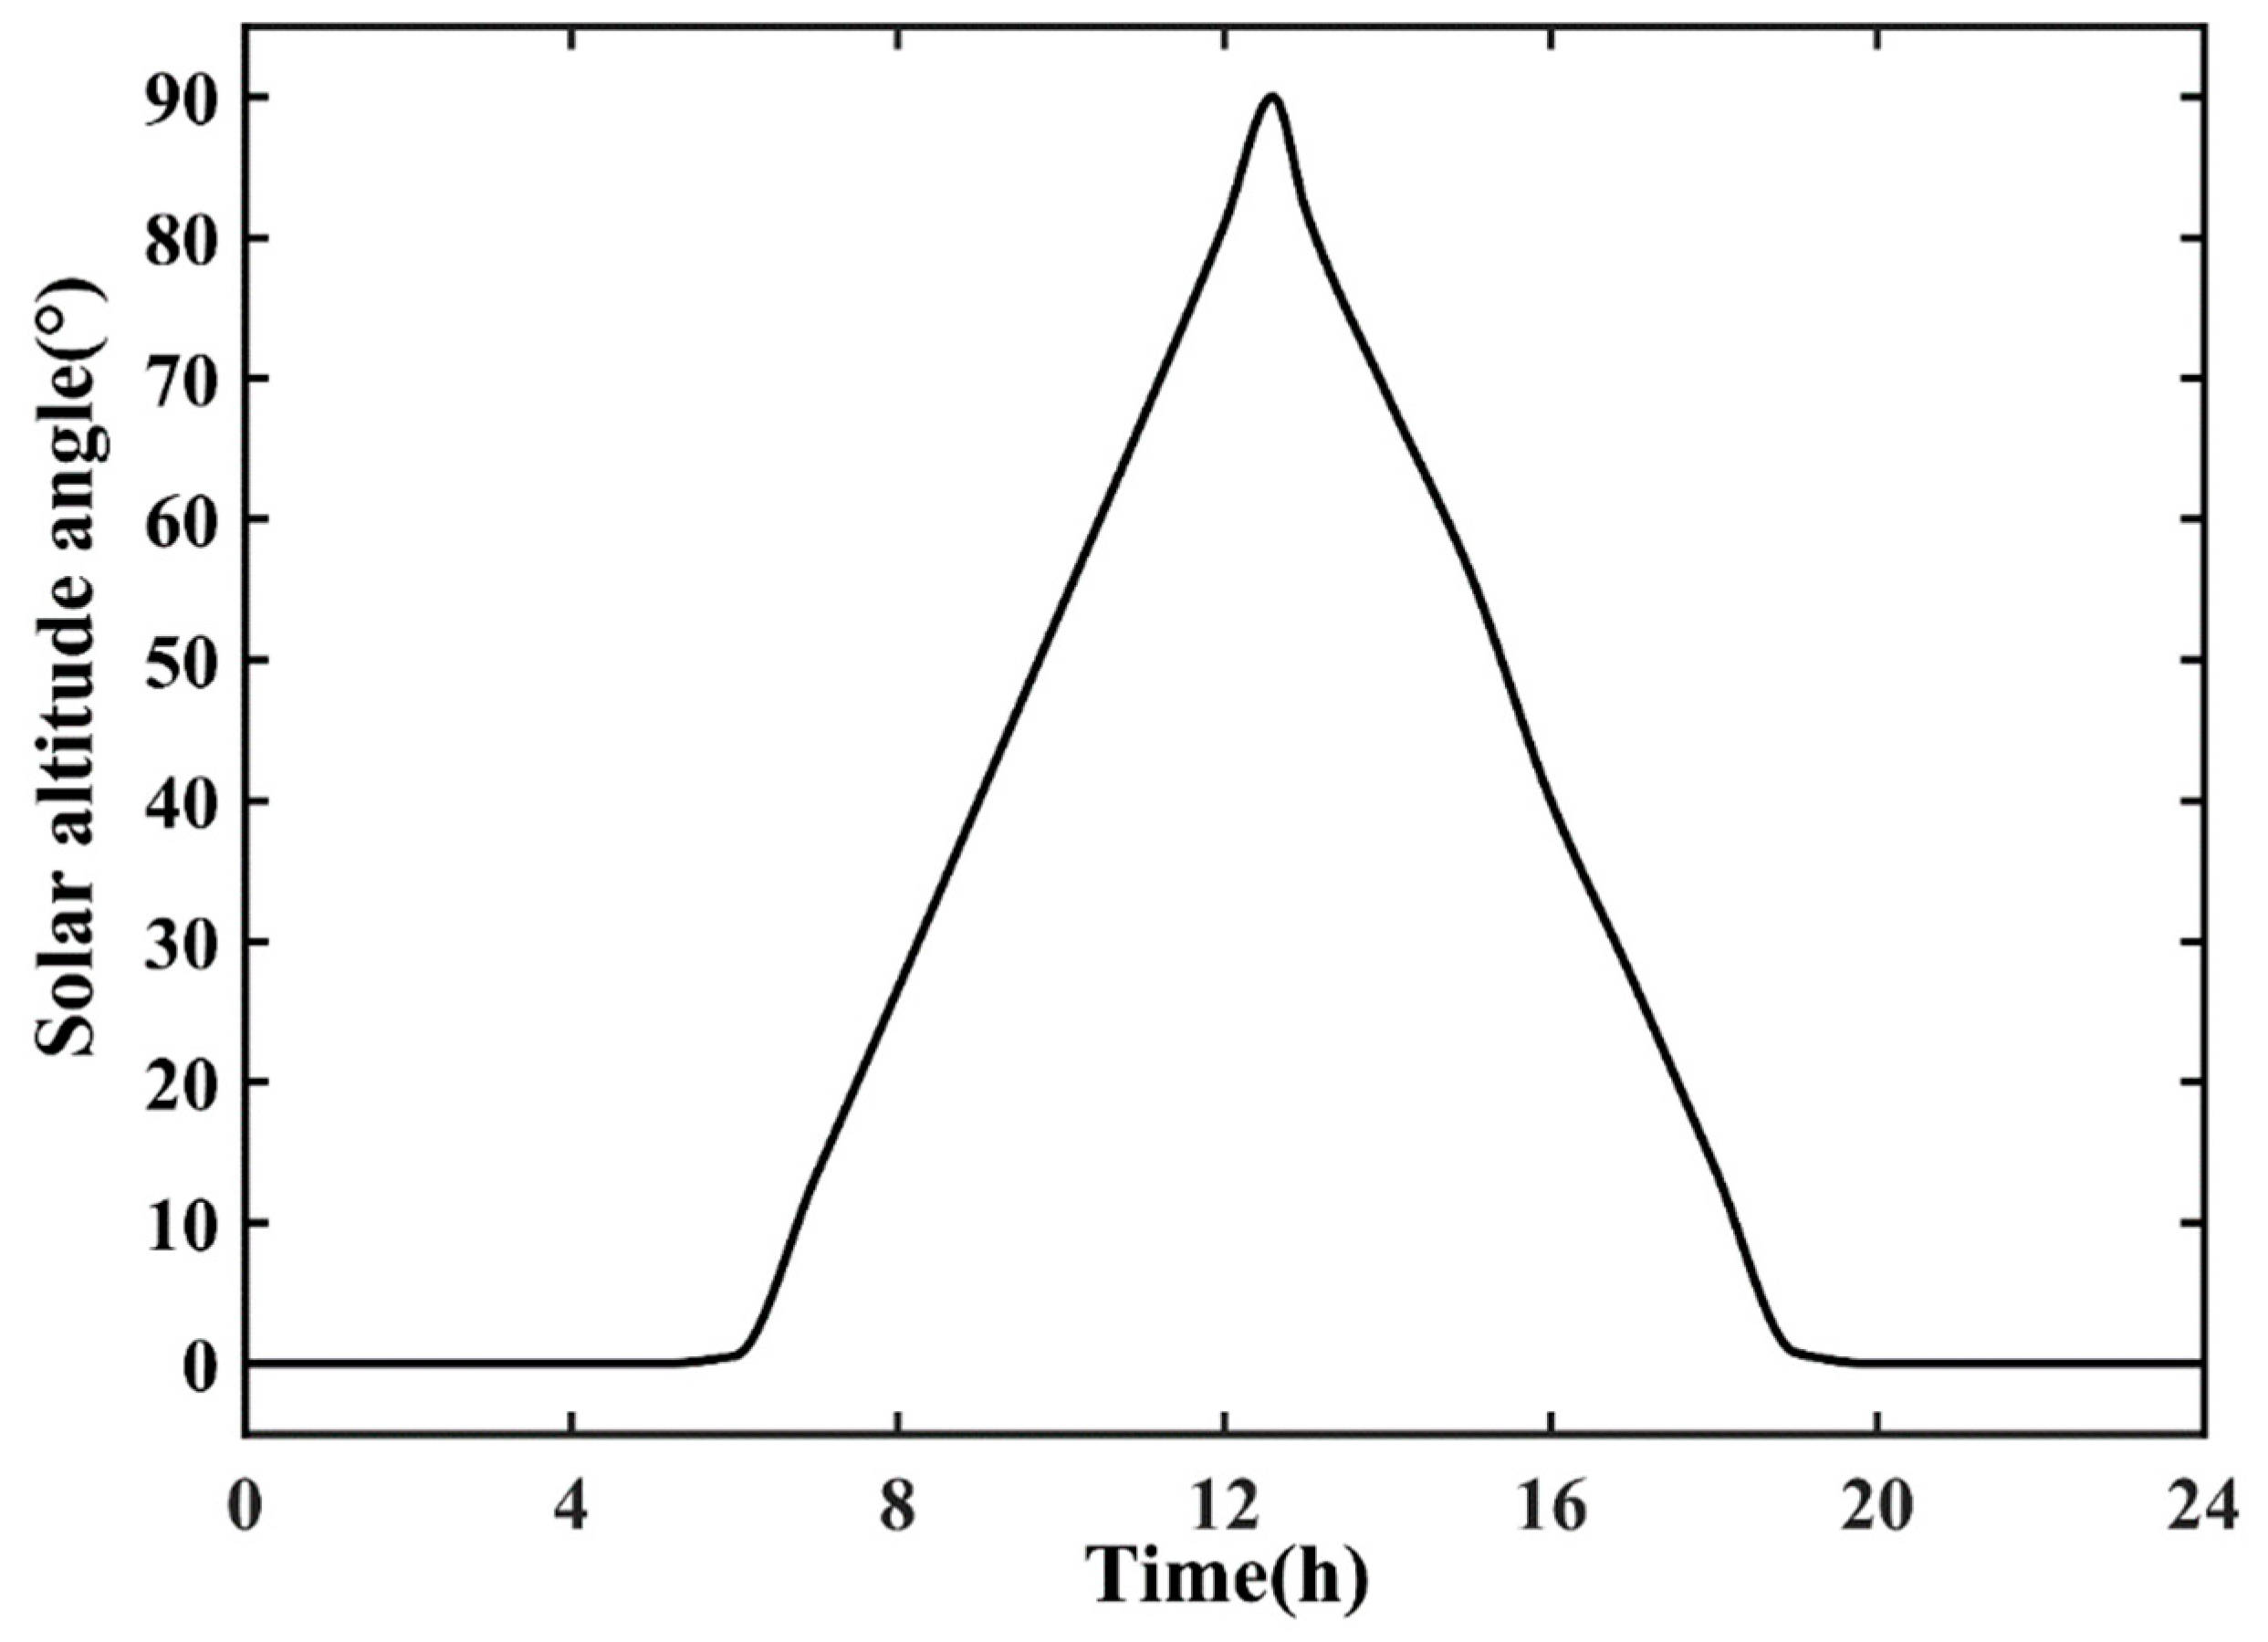
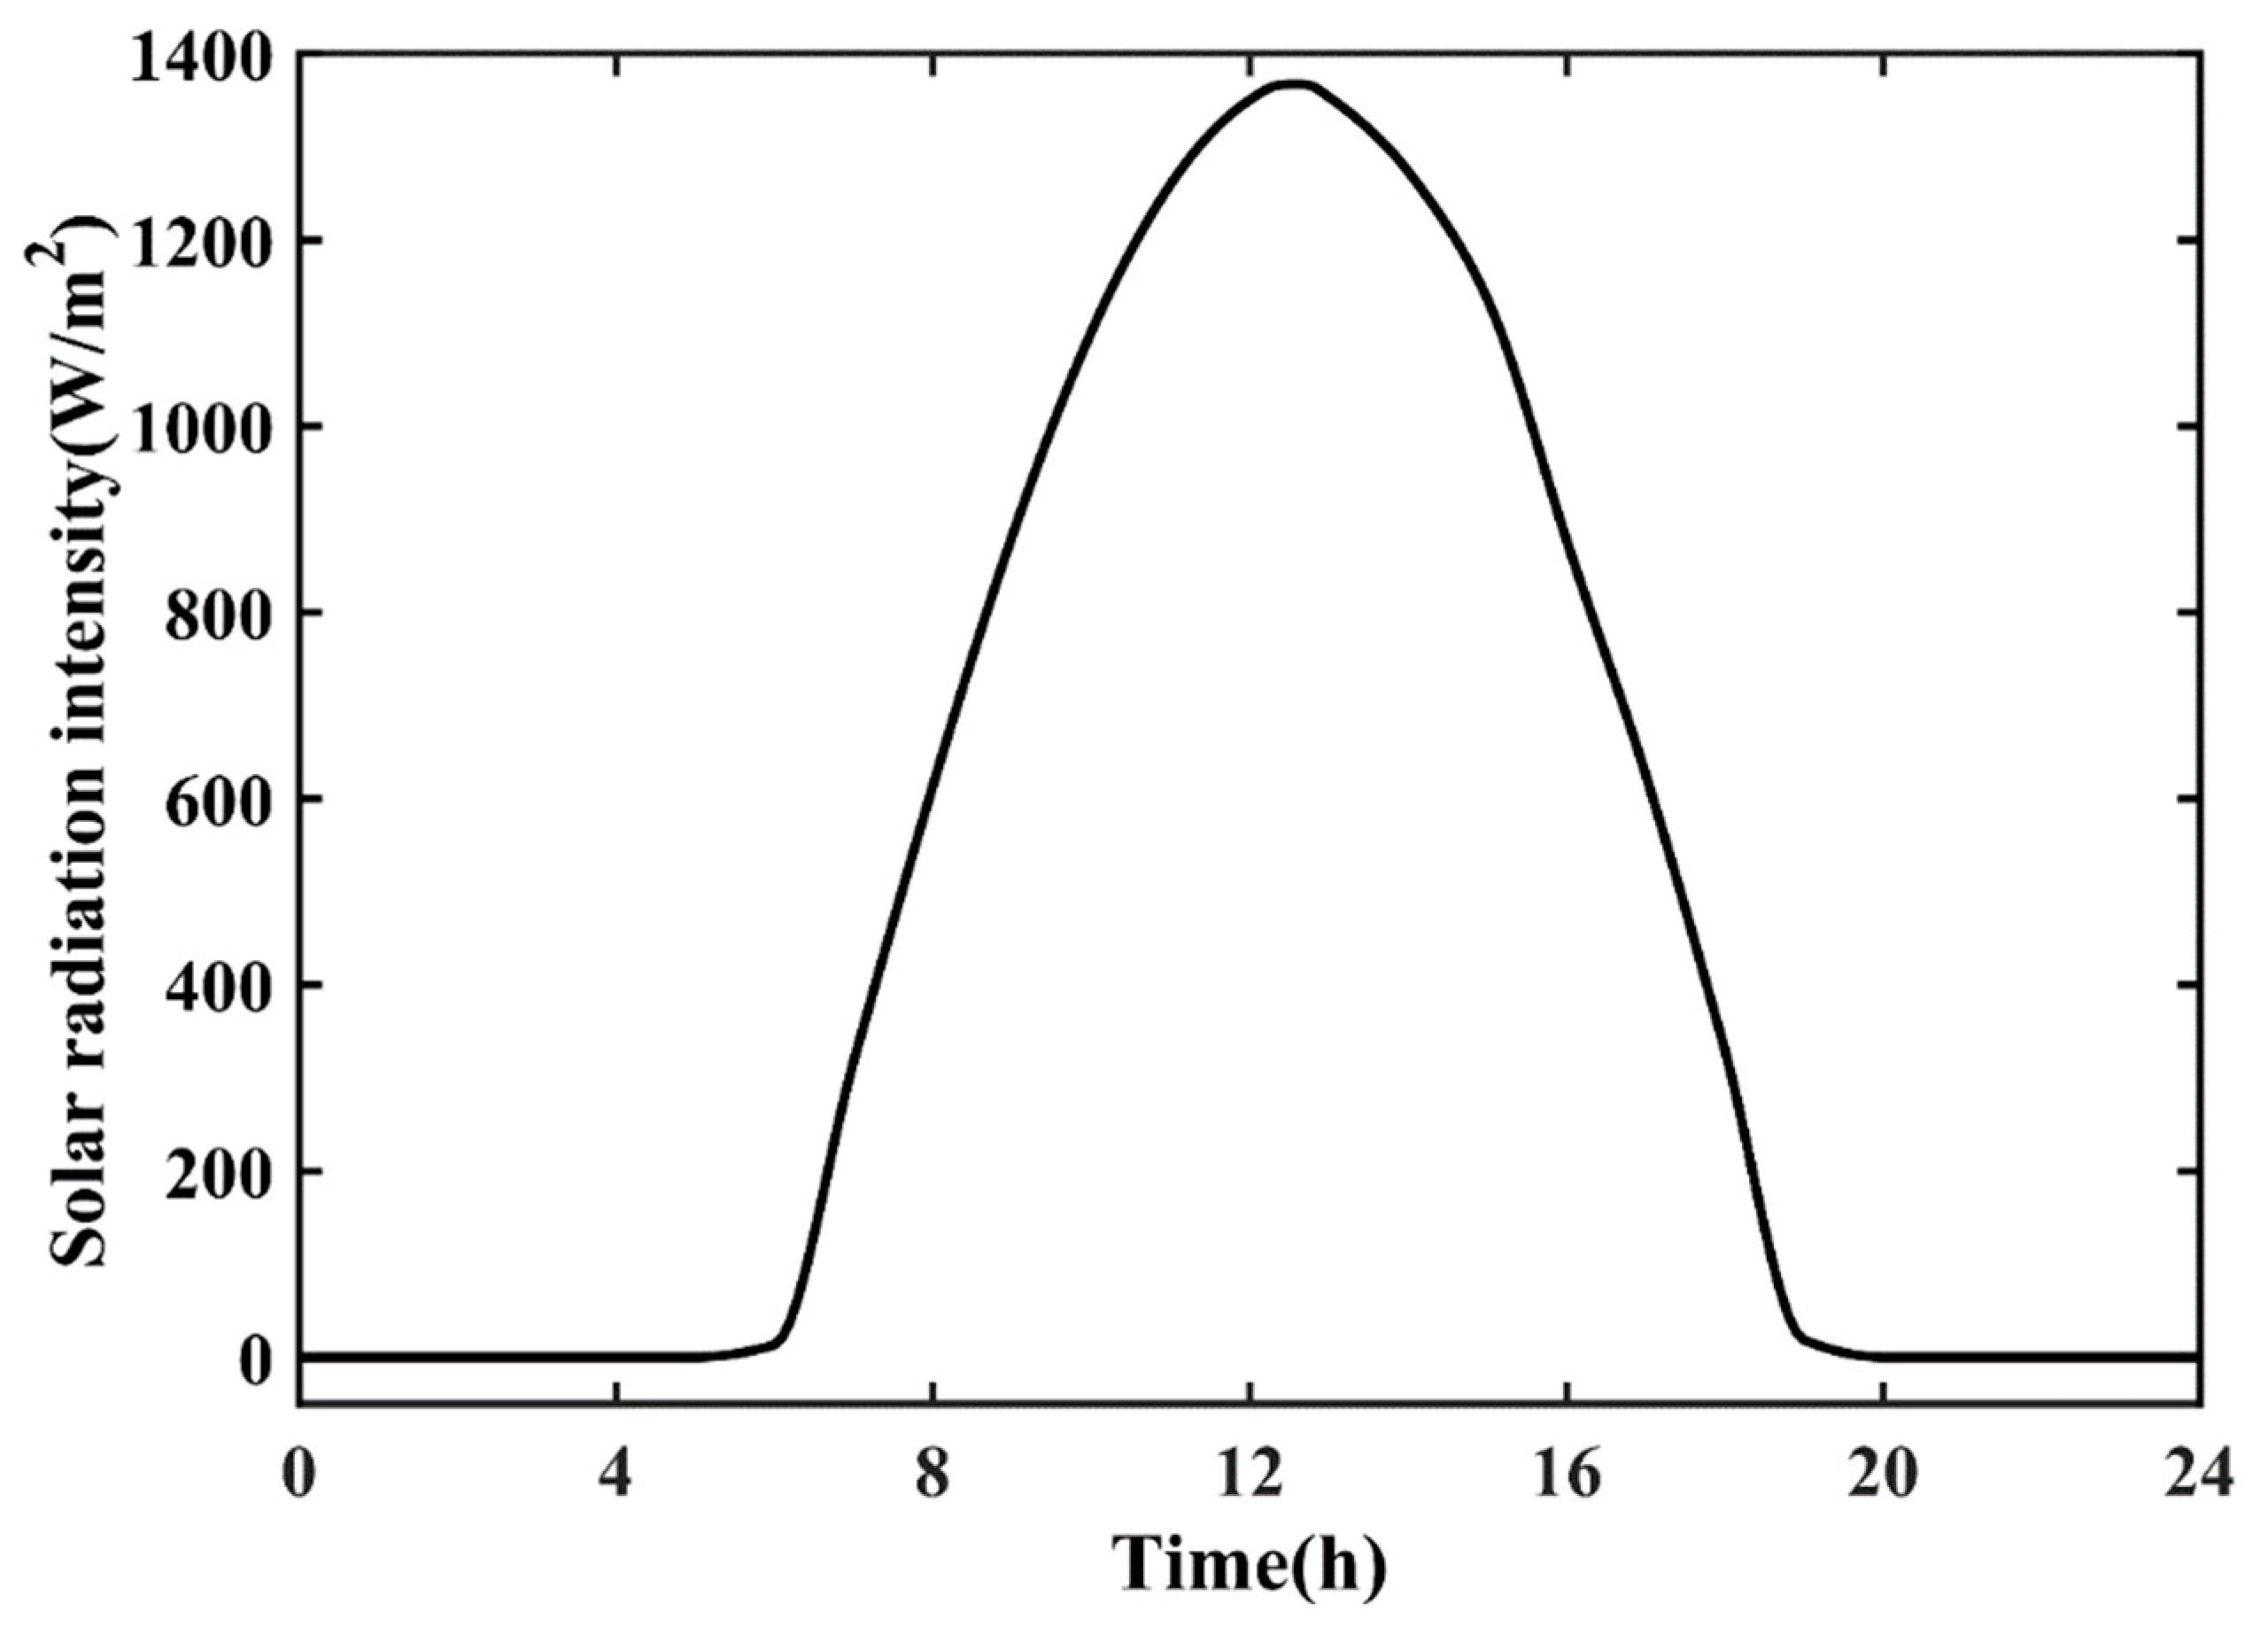
4.2. Calculation of Solar Radiation Intensity

The intensity of radiation is strongest when the sun is directly overhead, and changes as the angle of incidence of the sun changes. The solar altitude angle at different times (the angle between the beam solar radiation and the horizontal plane) was then given, and this data was fitted to the difference to obtain the curve shown in Figure 7. The angle of incidence θ is the angle between the solar beam radiation and the normal angle to the surface.
As seen in Figure 7, 6 h was the time of sunrise, and 19 h was the time of sunset. The before sunrise and after sunset solar altitude angles could not be observed, the solar altitude angle at 13 h is 81.85°. The intensity of direct solar radiation intensity by the surface of the structure was closely related to the solar altitude angle and the weather. In clear weather, the lower the solar incidence, the more dispersed the solar radiation is to the earth’s surface, and the smaller the amount of solar radiation intensity received by the surface of the structure, and vice versa. Figure 8 shows the solar radiation intensity during the day, calculated by the formula, which was 0 at the minimum and up to 1349.7 (W/m2) at the maximum.
G D = G N D C N cos θ
where G D is the intensity of solar radiation received by the surface of the structure; G N D is the intensity of direct solar radiation; C N is the atmospheric cleanliness; and θ is the angle of incidence, which should be greater than 0 and less than 90°.

5. Calculation of Non-Uniform Temperature Fields

First, we simulated the temperature fields of the support and the enclosure structures in the foundation pit. The heat transfer parameters of the steel pipe are shown in Table 2. In the actual project, the support and the enclosure structure are exposed to air and sunlight and should be affected by both. The radiation absorption of the support structure, the enclosure structure, and the pit bottom is calculated by taking into account the solar radiation intensity and the ambient radiation intensity. The radiation absorption is transformed into the temperature change of the object, and finally the temperature change is transformed into the expansion of the object by combining the thermal expansion coefficient of the object. The thermal expansion coefficient represents the amount of strain change caused by unit temperature change under a certain pressure. The greater the coefficient, the greater the deformation of the object affected by temperature.

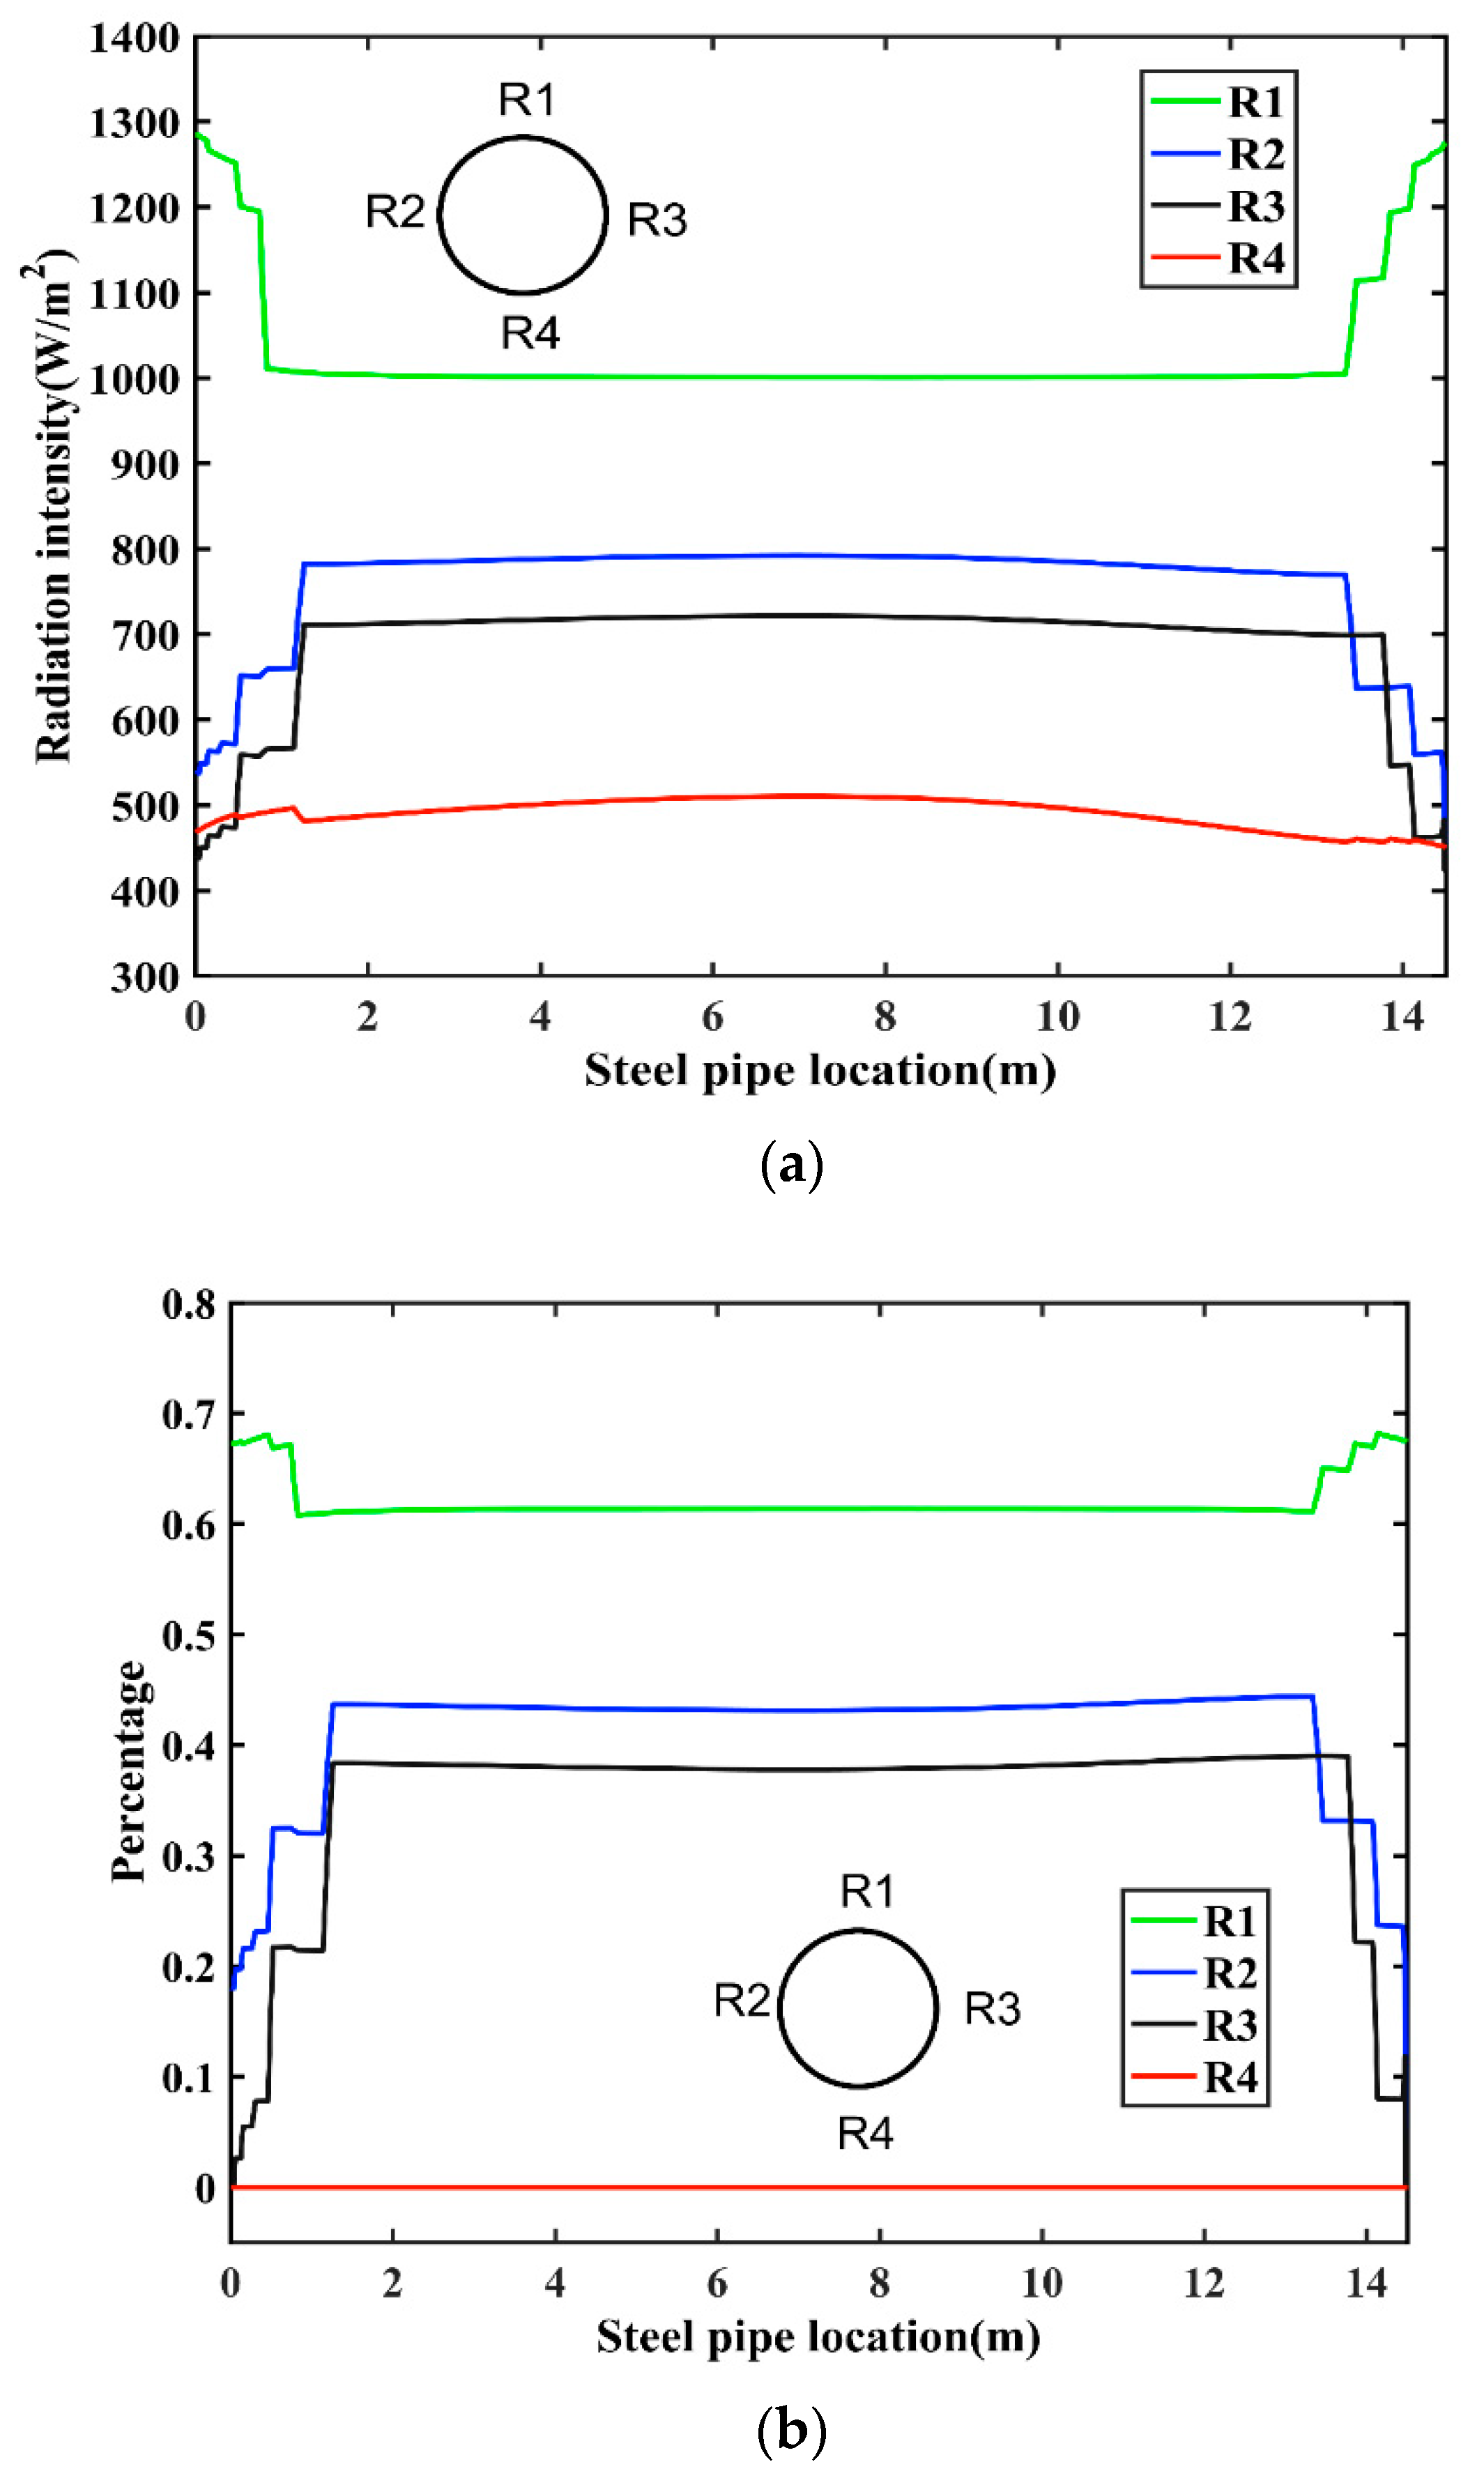
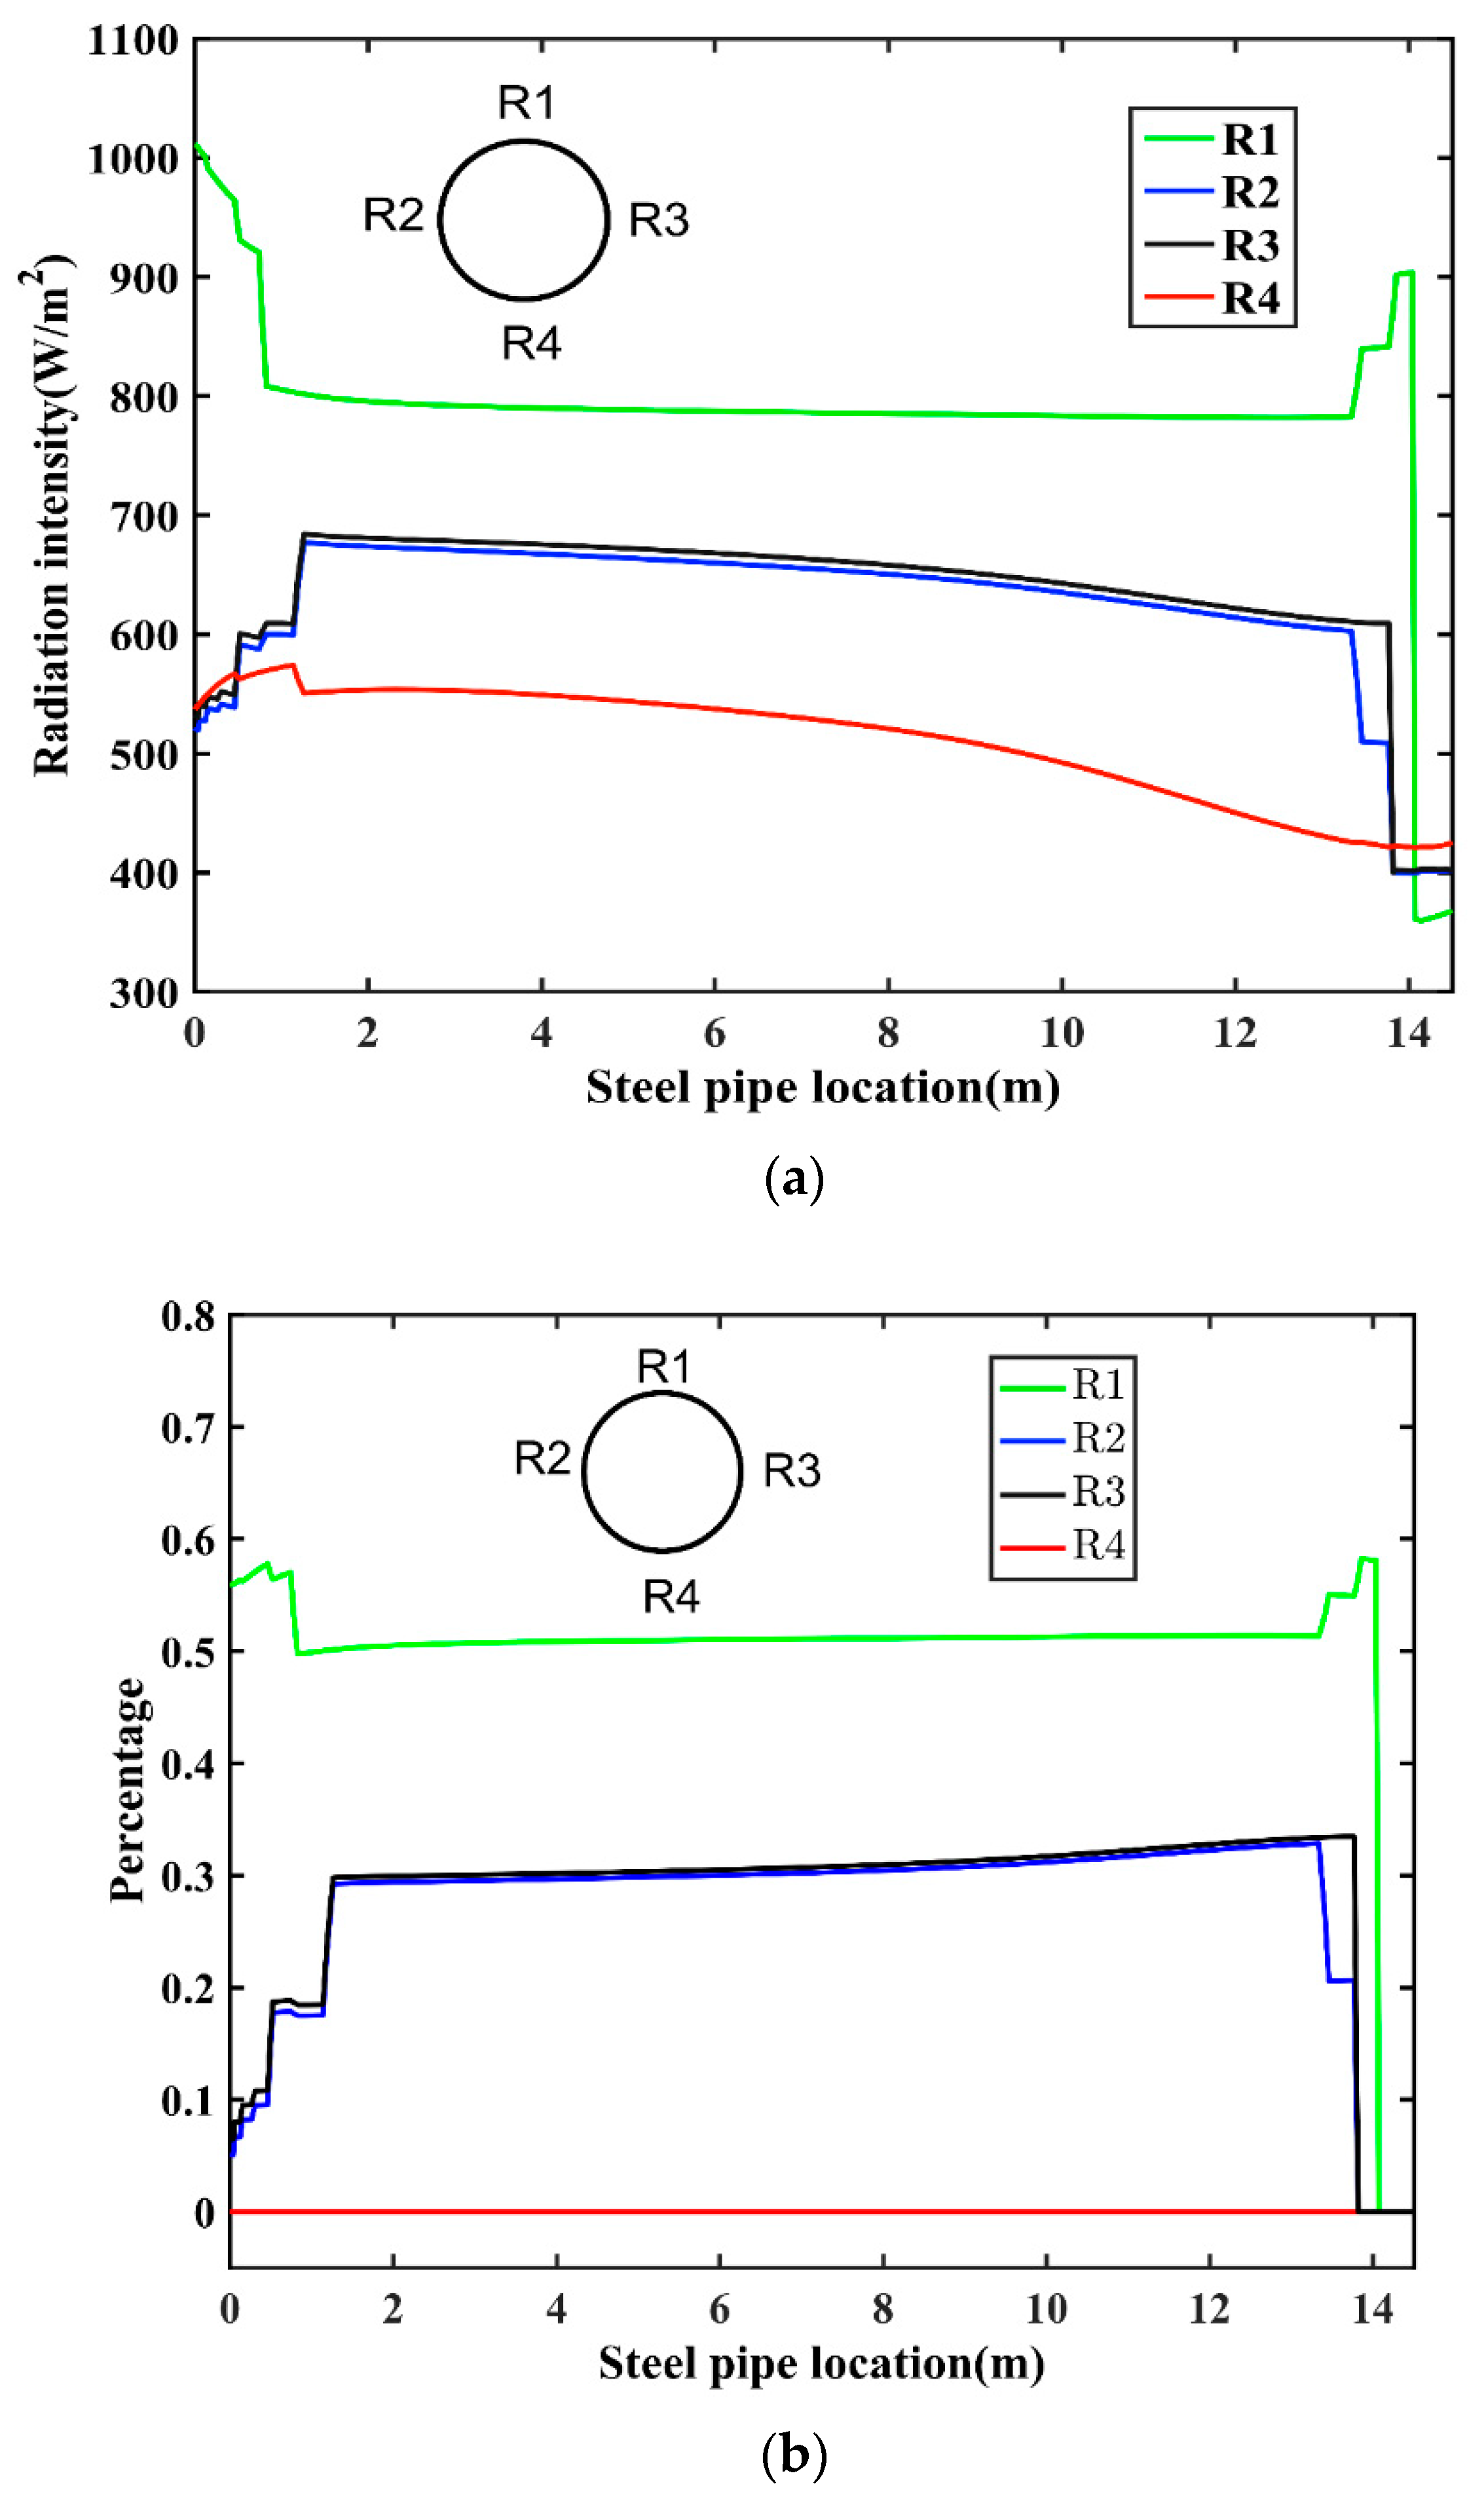
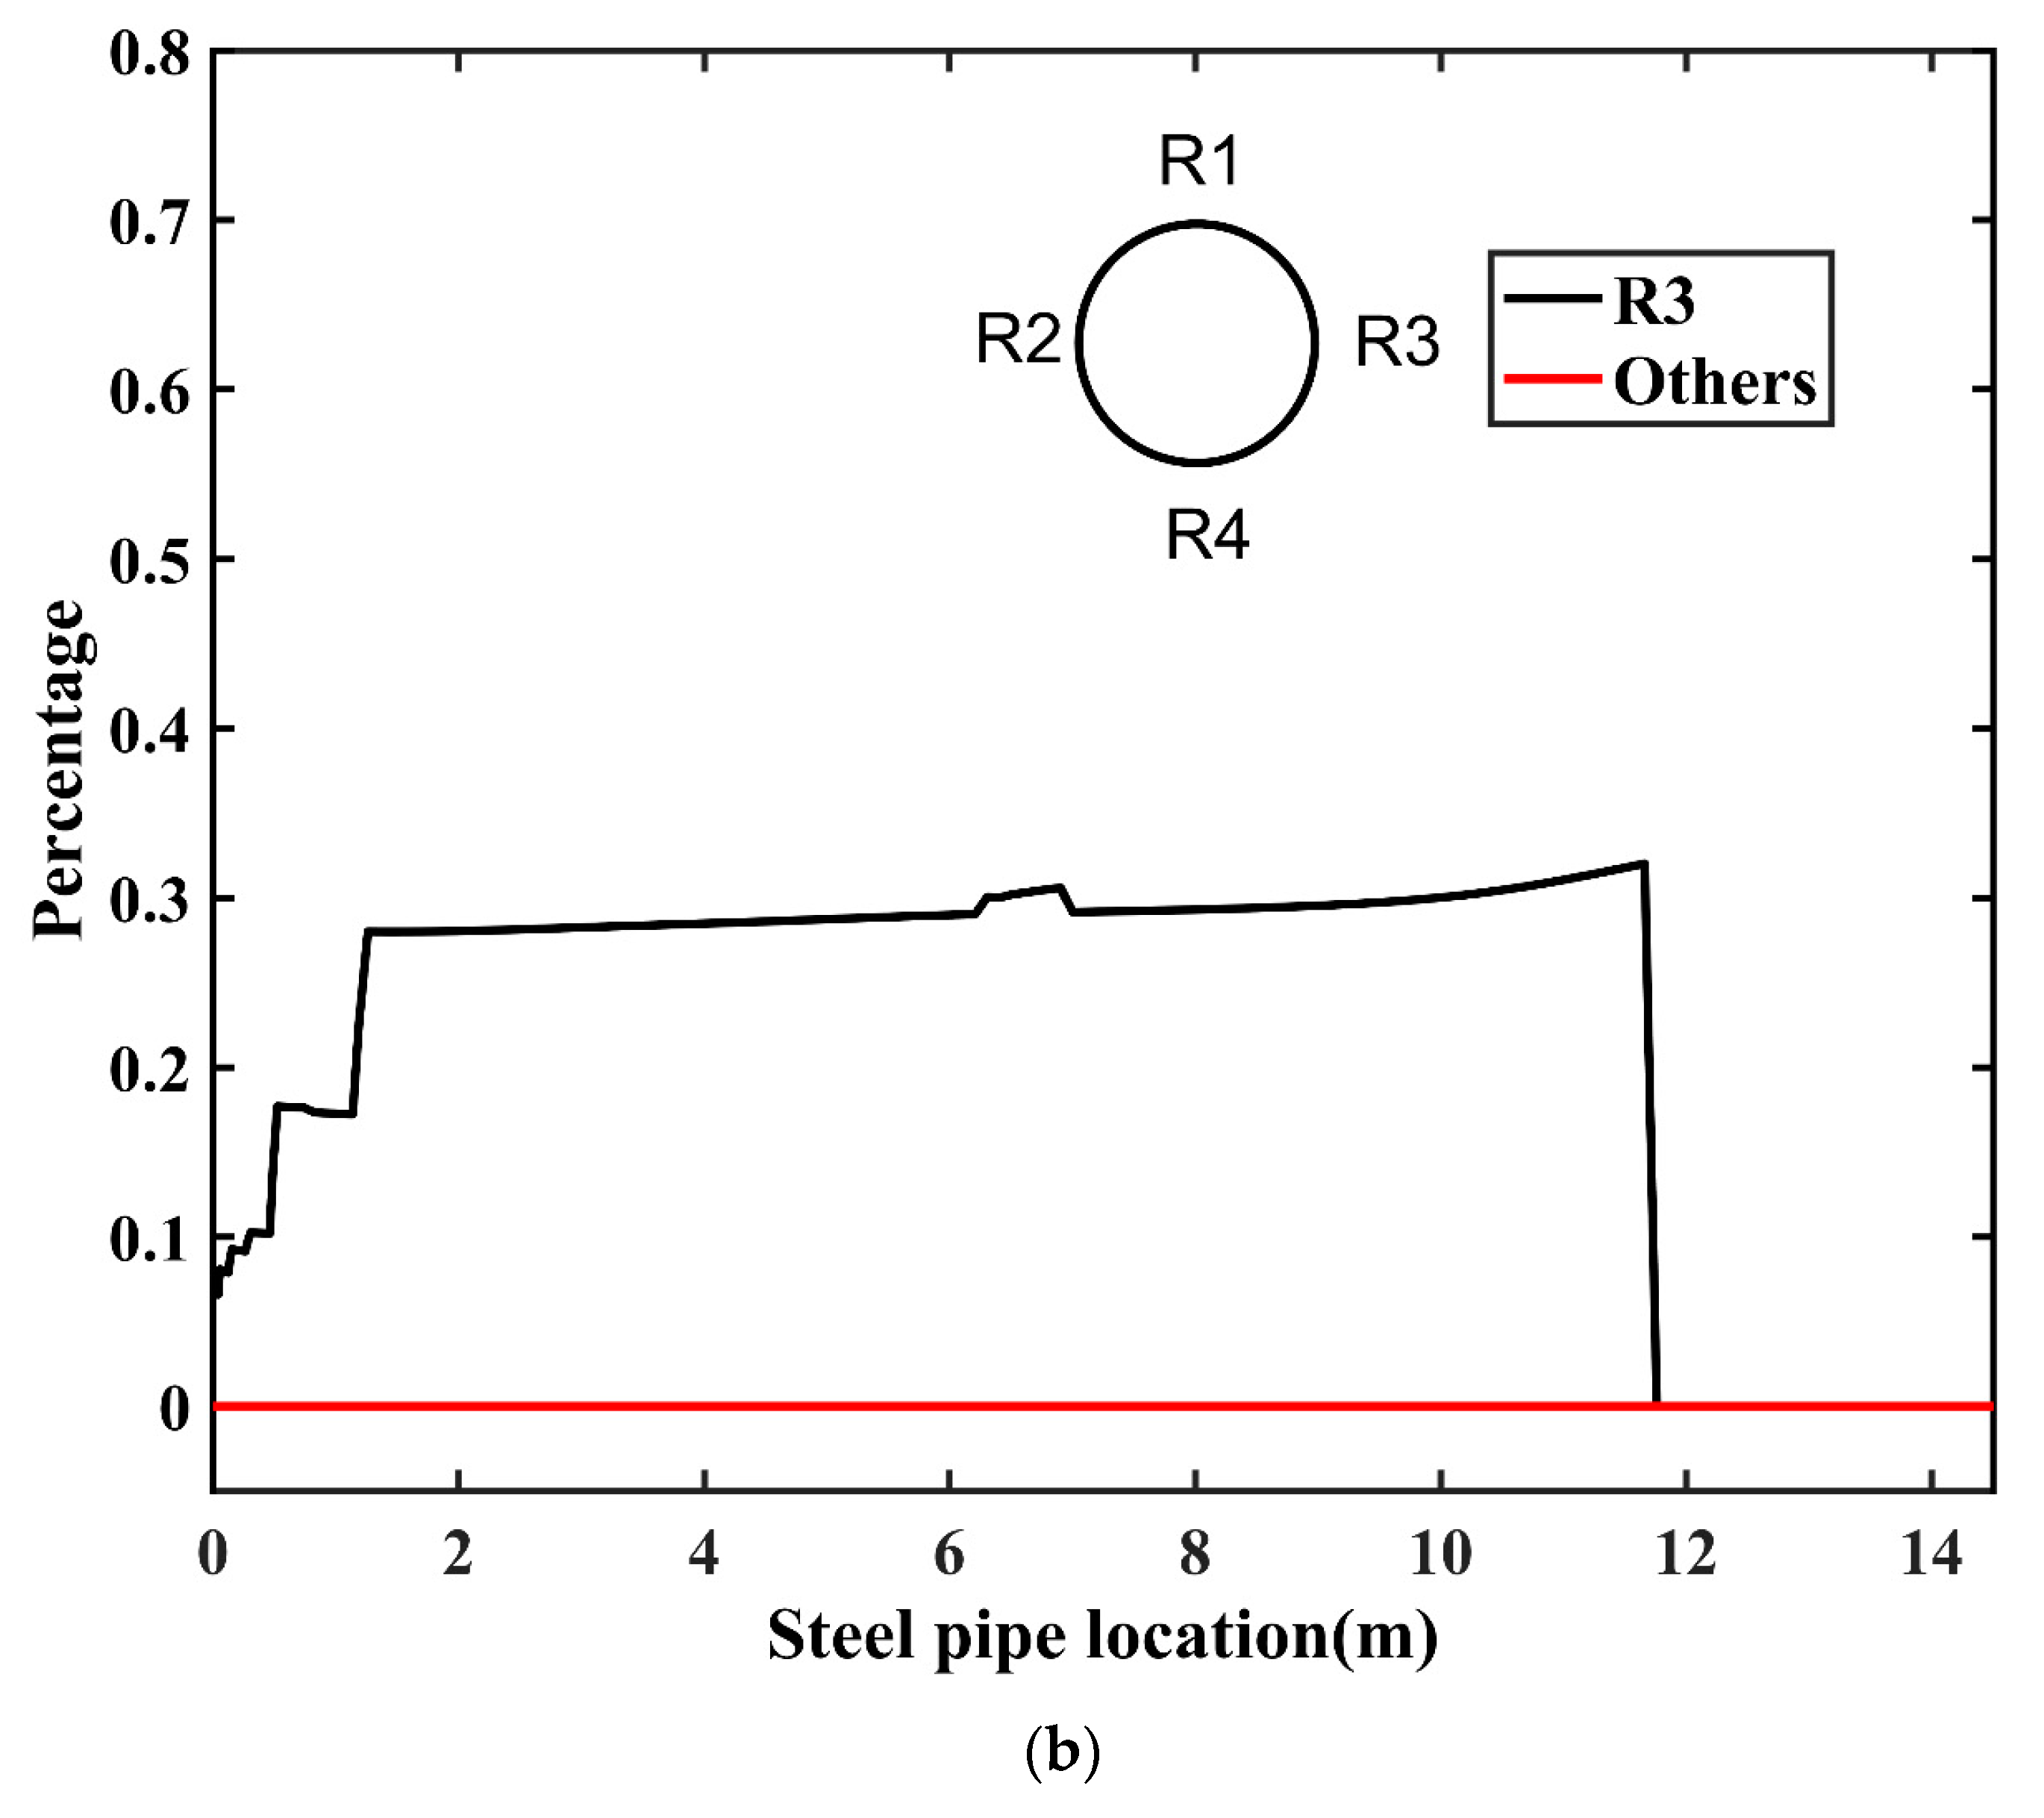
5.1. Calculation of the Radiation Field

Based on the previous theoretical study, the radiation was divided into two parts. One part is solar radiation, and one part is ambient radiation. Solar radiation is the amount of radiation absorbed by the structure after sunlight exposure. The ambient radiation is the amount of radiation generated by the structures radiating against each other. The radiation intensity was analyzed for A5 and B5 at two key times, 12 h and 15 h, and the reasons for choosing these two times are explained in Section 3.

5.1.1. Upper Support Structure

The support structure was divided into four key positions, and the four positions were represented by R1, R2, R3, R4, as shown in Figure 9a, for the total radiation of A5 in direct sunlight. For A5, the sun could directly irradiate the top of the support structure (R1), with the two sides of the radiation being greater than the middle of the radiation, while for the left and right side (R1, R2) radiation intensity was higher in the middle and smaller on the sides.
The total radiation intensity refers to the total radiation received by the support structure, including direct solar radiation and long wave radiation. The total radiation intensity received by the support structure, in descending order, was R1, R2, R3, and R4. The received radiation intensity of R1 reached an average of 1026.8 (W/m2). Figure 9b shows the ratio of solar radiation to the total radiation intensity. The bottom part did not receive solar radiation, so the value was 0.
Figure 10a shows the total radiation intensity of A5 at the highest temperature of the support structure (15 h). As time passed, the amount of radiation absorbed by the support structure decreased, and the law of distribution remained that R1 was large on both sides and small in the middle, while R2 and R3 were large in the middle and small at both ends. The average radiation intensity of the support structure at position R1 reached 783.6 (W/m2). When compared to direct sunlight, the radiation intensity on the east side (0 m) was larger and was slightly smaller on the west side (14.5 m). When combined with Figure 10b, it could be found that the support structure R1, R2, and R3 positions near the west side of the enclosure structure receive no solar radiation, which meant at that time that the support structure was blocked.

5.1.2. Lower Support Structure

The radiation field characteristics of the lower support structure were different from the upper side. Figure 11a shows the total radiation of the lower B5 structure in direct sunlight. The radiation field was more evenly distributed on the east and west side. The total radiation intensity of the lower support structure, in descending order, was R2, R4, R3, and R1. The average radiation intensity of the support structure at position R2 reached 726.3 (W/m2). The upper side of the support structure was blocked, and only R2 was not completely blocked when the sun was direct. Solar radiation accounted for less than half of the total radiation received, and R1, R3, and R4 solar radiation percentages were 0.
At the time of the highest temperature of the support structure (15 h), the total radiation decreased at all locations, and showed a high radiation intensity on the east side (0 m) and a low radiation intensity on the west side (14.5 m). Figure 11b shows that only R3 was not completely blocked in direct sunlight, and the solar radiation accounted for less than 30% of the total radiation received, while R1, R2, and R4 solar radiation percentages were 0. The total radiation received by the lower support structure, in descending order, was R3, R4, R2, and R1. The average radiation intensity of the support structure at position R3 reached 525.4 (W/m2).
In summary, the lower enclosure was mainly affected by ambient radiation, and ambient radiation accounted for the majority of the total radiation, as shown in Figure 12. Here are two reasons for the low radiation absorption on the west side of the support structure: (1) The west side support structure was shaded and not exposed to the sun. (2) The solar position was on the west side at 15 h, and the amount of solar radiation received by the western enclosure was significantly less than that of the eastern enclosure. The ambient radiation was mainly influenced by the ambient temperature and the temperature of the enclosure structure. When the difference in ambient temperature between the east and west side was not significant, the ambient radiation of the west side support structure at 15 h decreased, which resulted in a decrease in the total radiation absorption.

5.2. Temperature of the Support Body

We chose the particular A5 support tube to study the behavior of the support structure in terms of temperature and temperature differences at different times. Figure 13a shows the maximum and minimum temperatures of the support structure at different times of extraction. The maximum temperature of the support structure was 58.8 °C at 15 h, while the time of 15 h shown in Figure 13b was also the time when the maximum temperature difference occurred, and this time should be noted as the typical time (TT). The problem of temperature field distribution at the TT is particularly important.
The support structure is always exposed to the environment and is influenced by the ambient temperature. In contrast, after solar irradiation, A5 began to show a significant change in temperature difference, and it can be concluded that the temperature difference was then due to solar radiation. As shown in Figure 13, which demonstrates the temperature difference of the A5 structure at different times, the maximum temperature difference occurred at 15 h, while from 11 h to 13 h, when the solar altitude angle was larger and the sun shined directly on the support structure, the temperature difference decreased instead.
The temperature at different locations of the support structure was calculated for the time between sunrise (6 h) and sunset (21 h). The results of the calculations are shown in Figure 14. The support structure under solar radiation exhibited a non-uniform distribution of temperature. The uniformity was characterized by higher temperatures on the east and west sides of the support structure than on the support structure inside the pit. The angle of the solar radiation determined whether the temperature was higher on the east side or on the west side. The sun was on the west side at 15 h, and part of the enclosure and support structure was shaded on the west side. The maximum temperature of the steel pipe on the east side was 58.8 °C.
The temperatures of the A5 and B5 steel tubes were calculated for different times. The maximum difference between the maximum and minimum temperature of the A5 steel pipe was 18.9 °C, which was due to the change in sun angle that occurred at the TT (15 h). Figure 15 shows the temperature at different locations of B5 at different times. The results show that the temperature distribution of B5 was similar to that of A5 and changed with the changes in solar altitude angle. The minimum temperature of B5 was lower than that of A5, but B5 did not appear to be lower than A5, because it was not directly exposed to solar radiation, and some locations even had higher temperatures than the same locations on A5. The uneven temperature distribution of the tubes was not only due to the angle of solar radiation, but also to the influence of ambient radiation.
The average temperature of the support structure at different moments was calculated. In the case of A5 and B5, there was a correlation between the change in temperature of the support structure and the change in ambient temperature. The upper support structure could reach a higher average temperature, but was not as capable of maintaining temperature as the lower structure. The duration of high temperature in the lower structure was significantly longer than that of the upper structure. The graph shows that the temperature of A5 was higher than that of B5 at 12 h, but, at 15 h, the temperature of A5 was close to that of B5.
Due to the thin thickness of the supporting steel pipe, the temperature difference between the inner and outer sides of the steel pipe was within 0.5 °C. The temperature on both sides could be the same. The non-uniform temperature field of the steel pipe was mainly reflected in the horizontal position. At the same time, the maximum temperature difference of the same steel pipe could reach almost 20 °C. This non-uniform temperature field may have led to the deformation of the supporting structure and then led to the change in the horizontal displacement of the enclosure.
15 h was the TT time and 12 h was the time when solar radiation was strongest. As shown in Figure 16 and Figure 17, the two key times were chosen to compare the non-uniform temperature field under the two moments of A5 and B5. At 12 h, A5 had a higher temperature, which was apparently caused by solar radiation, and B5 was shaded by A5 to receive less solar radiation, while A5 and B5 had similar temperature fields at 15 h. Although the solar radiation was still A5 > B5, B5 absorbed more ambient radiation at that time.

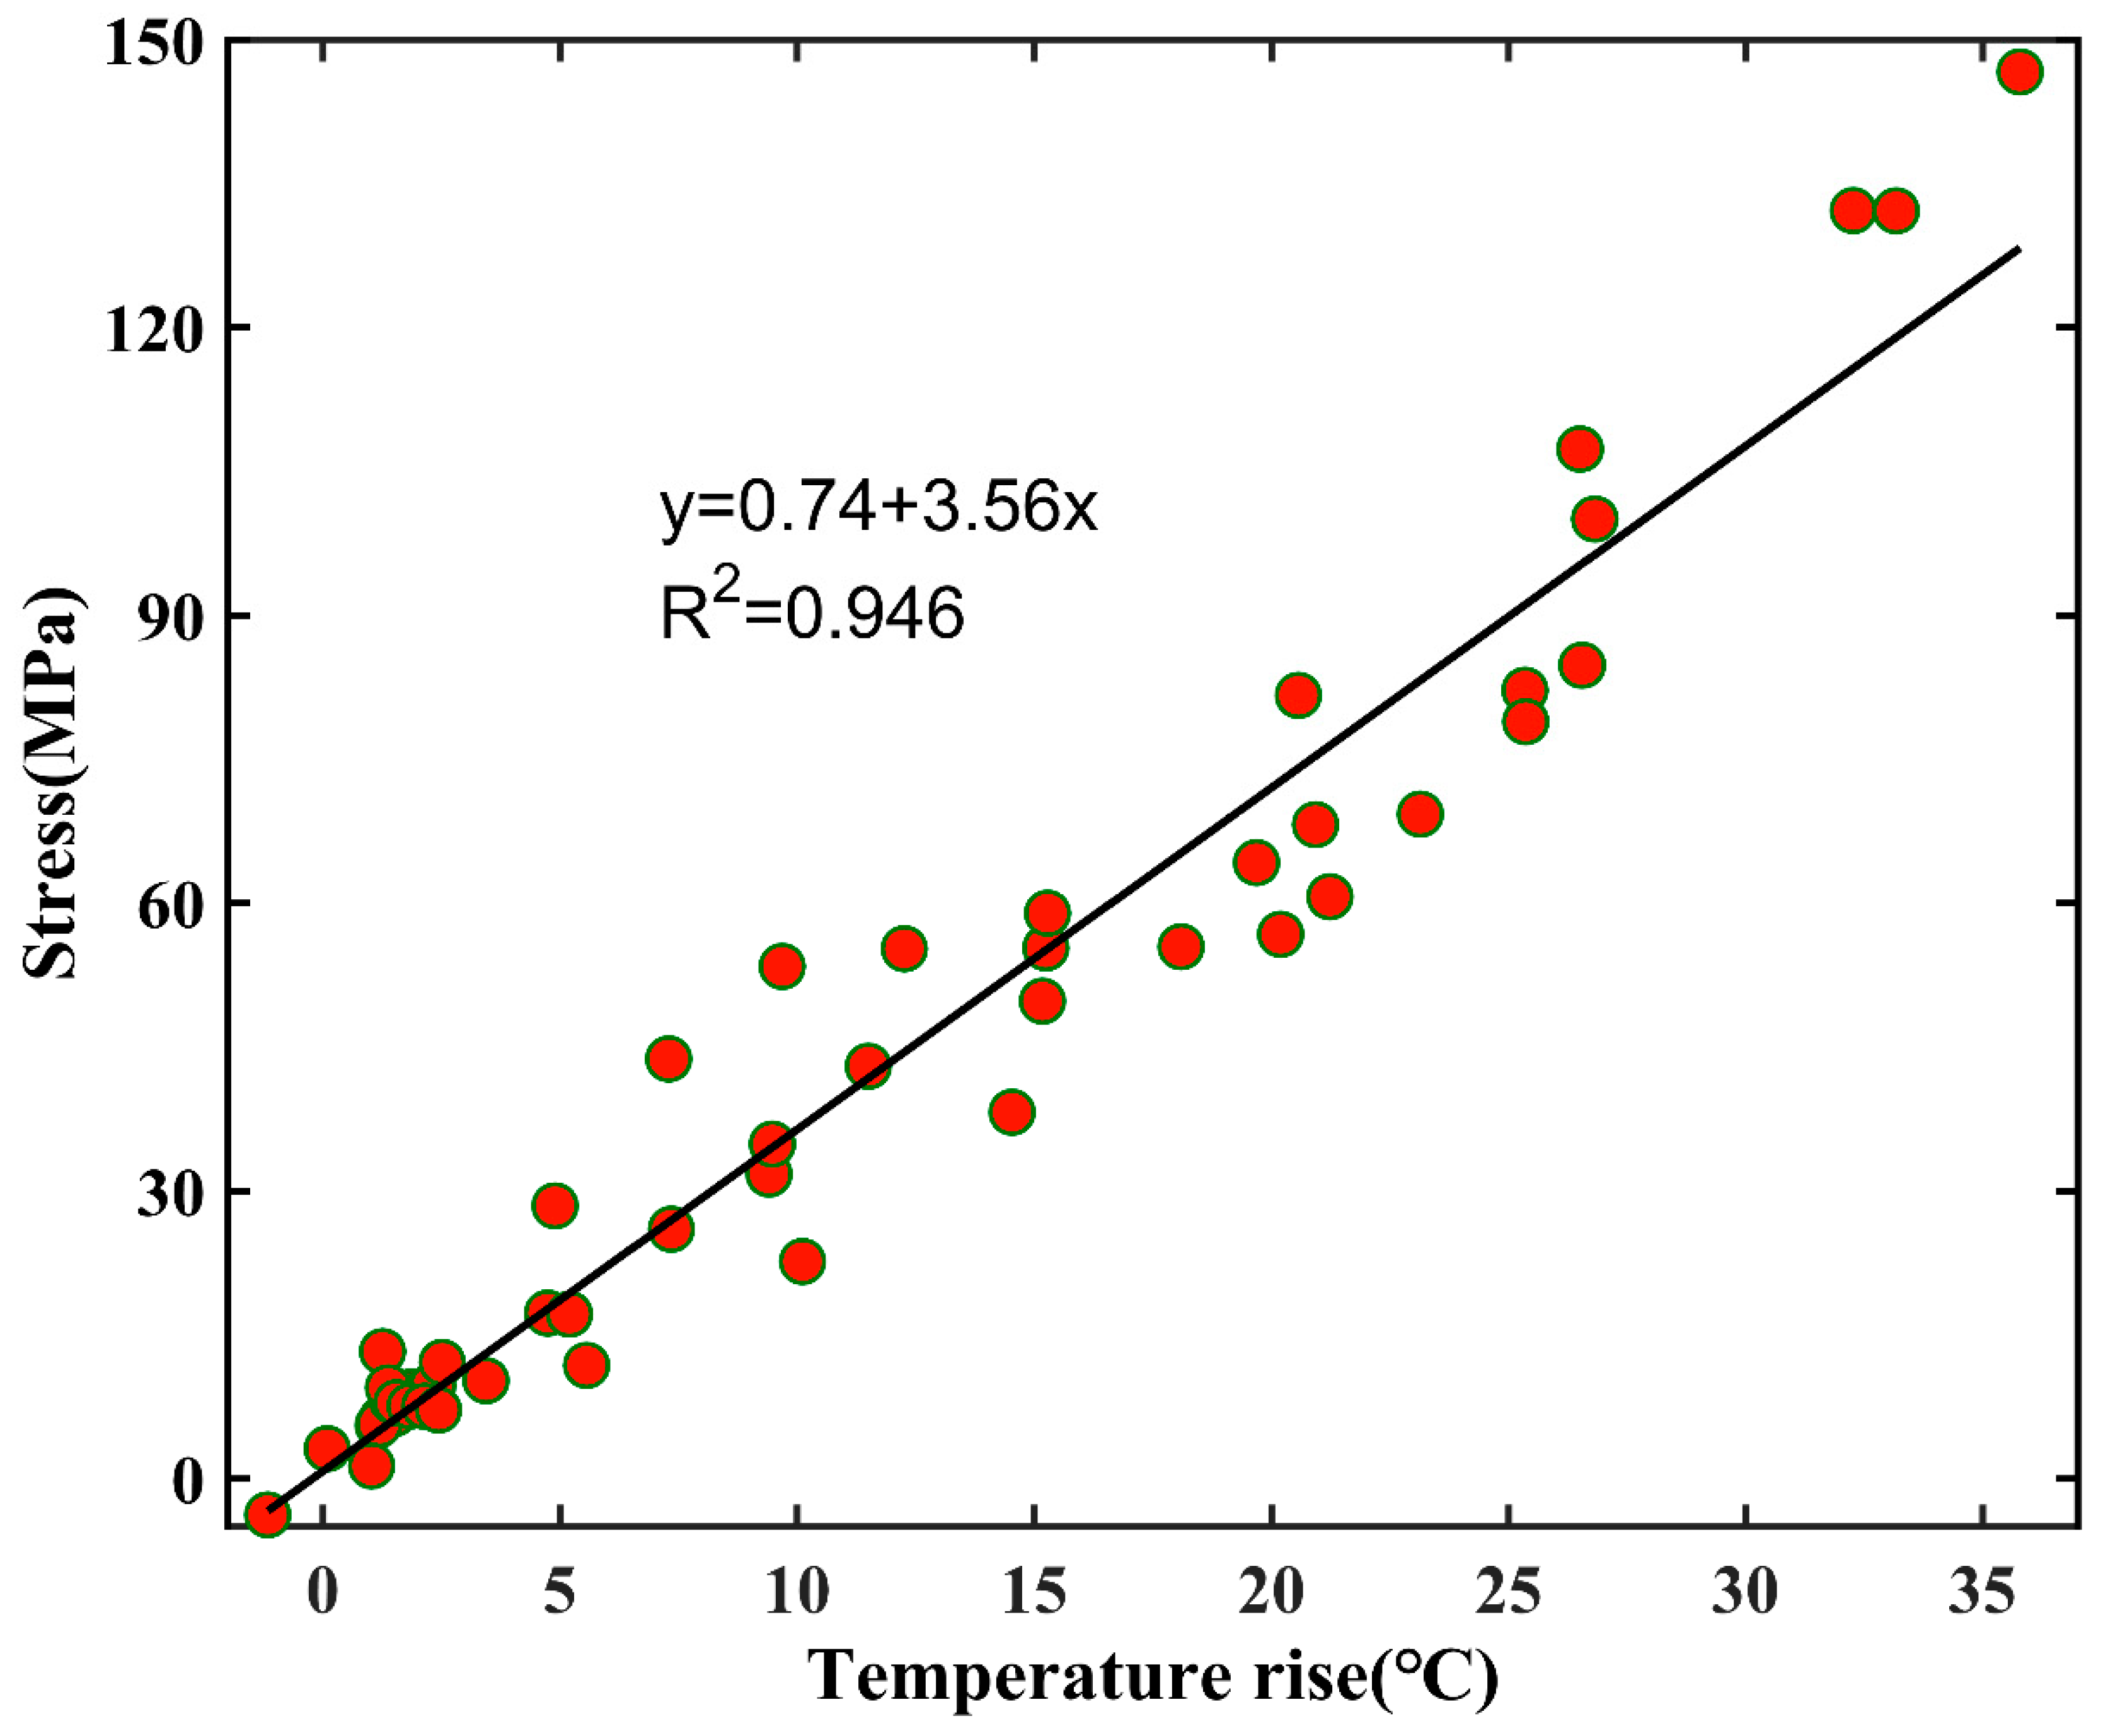
6. Solving for Thermal Stress

The problem of thermal behaviors on structures under solar radiation is mainly influenced by solar radiation, ambient air conditions, and shadows. It has the characteristics of rapid change and non-uniformity. The support structure generates thermal stresses within the steel structure, due to non-uniform temperature field distribution, thermal convection effects, thermal expansion effects, and boundary condition constraints. The thermal stresses vary with temperature and, in turn, change the horizontal displacement of the pit. If the enclosure is poured cement, the heat of hydration during pouring will also result in a time-varying temperature field in the enclosure.

6.1. Thermal Stresses in the Support Structure

In the pit project studied in this paper, the two ends of the inner support were welded to the purlins, and the ends were reinforced with triangular stiffening plates. Therefore, the boundary condition of the supporting steel pipe was a rigid constraint condition. The horizontal and vertical displacements of the supporting steel pipe were limited. The conditions for the generation of thermal stress were satisfied.
A linear fit was performed for the support body thermal stress. Scatter plots were plotted for a total of 50 points of data from 0–24 h on the east and west sides of A5, and a linear fit was performed on the scatter plot, as shown in Figure 18. The fit was better at 0.946. The thermal stress in the support structure was positively related to the value of the temperature change on that side. The higher the temperature increased, the higher the thermal stress was. For every 1 °C increase in temperature, the horizontal stress increased by 3.56 MPa. In addition, the thermal stress should be related to the strength of the material itself and the thermal expansion coefficient.

6.2. Thermal Stresses in the Enclosure

We explored the issue of thermal stresses in the enclosure. Thermal stress is a time-varying effect. For comparison purposes, the 0 h observations were recorded as 0 Mpa, and the monitoring data for stress was transformed into the amount of stress change. During the excavation of this pit, monitoring devices for stresses were set up at 2 m, 4 m, and 6 m depths on the east and west sides of the enclosure, and stress values for the enclosure were read at 30 min intervals, recorded, and stored in a developed website. The stress monitoring locations are shown in Figure 19.
Figure 20 shows the actual monitored values of the stresses in the eastern enclosure compared to the calculated values. The actual data was monitored from 0 h to 24 h on 2 June 2021, and the data was measured using strain gauges, which were numbered YB-GBZ-E-2m and recorded in real time when taking each whole point of data, for a total of 25 data points. Strain gauges were installed in all four directions of the pit enclosure at installations of three on each side. Figure 20a–c show the stress monitoring values for the eastern enclosure of the pit at depths of 2 m, 4 m, and 6 m respectively compared to the calculated values, with the monitoring data at 6 m being more similar to the calculated values. The following conclusions were drawn from the analysis:
(1) Both the actual monitoring and the model calculations showed that the stress values changed by temperature were greater at a 4 m depth and smaller at 2 m and 6 m depths. The thermal behavior had different effects on the stresses at different depths and was spatially non-uniform, with the general rule being that the middle was large and the sides were small.
(2) In the calculation of the model, the maximum stress was reached at around 16 h; in reality, the maximum stress could only be reached at 17–20 h. Both the actual monitoring and the calculation of the model showed a pattern of increasing and then decreasing. For different times, the thermal stress had different effects and was characterized by non-uniformity in time.
(3) Both the actual monitoring and the model calculations were accompanied by a situation where the stress remained stable for a period of time and decreased rapidly near the highest point, which also occurred in the monitoring of the horizontal displacement of the enclosure. This paper suggests that this is a temporally delayed phenomenon of thermal stress, and the factors leading to this phenomenon need to be studied.

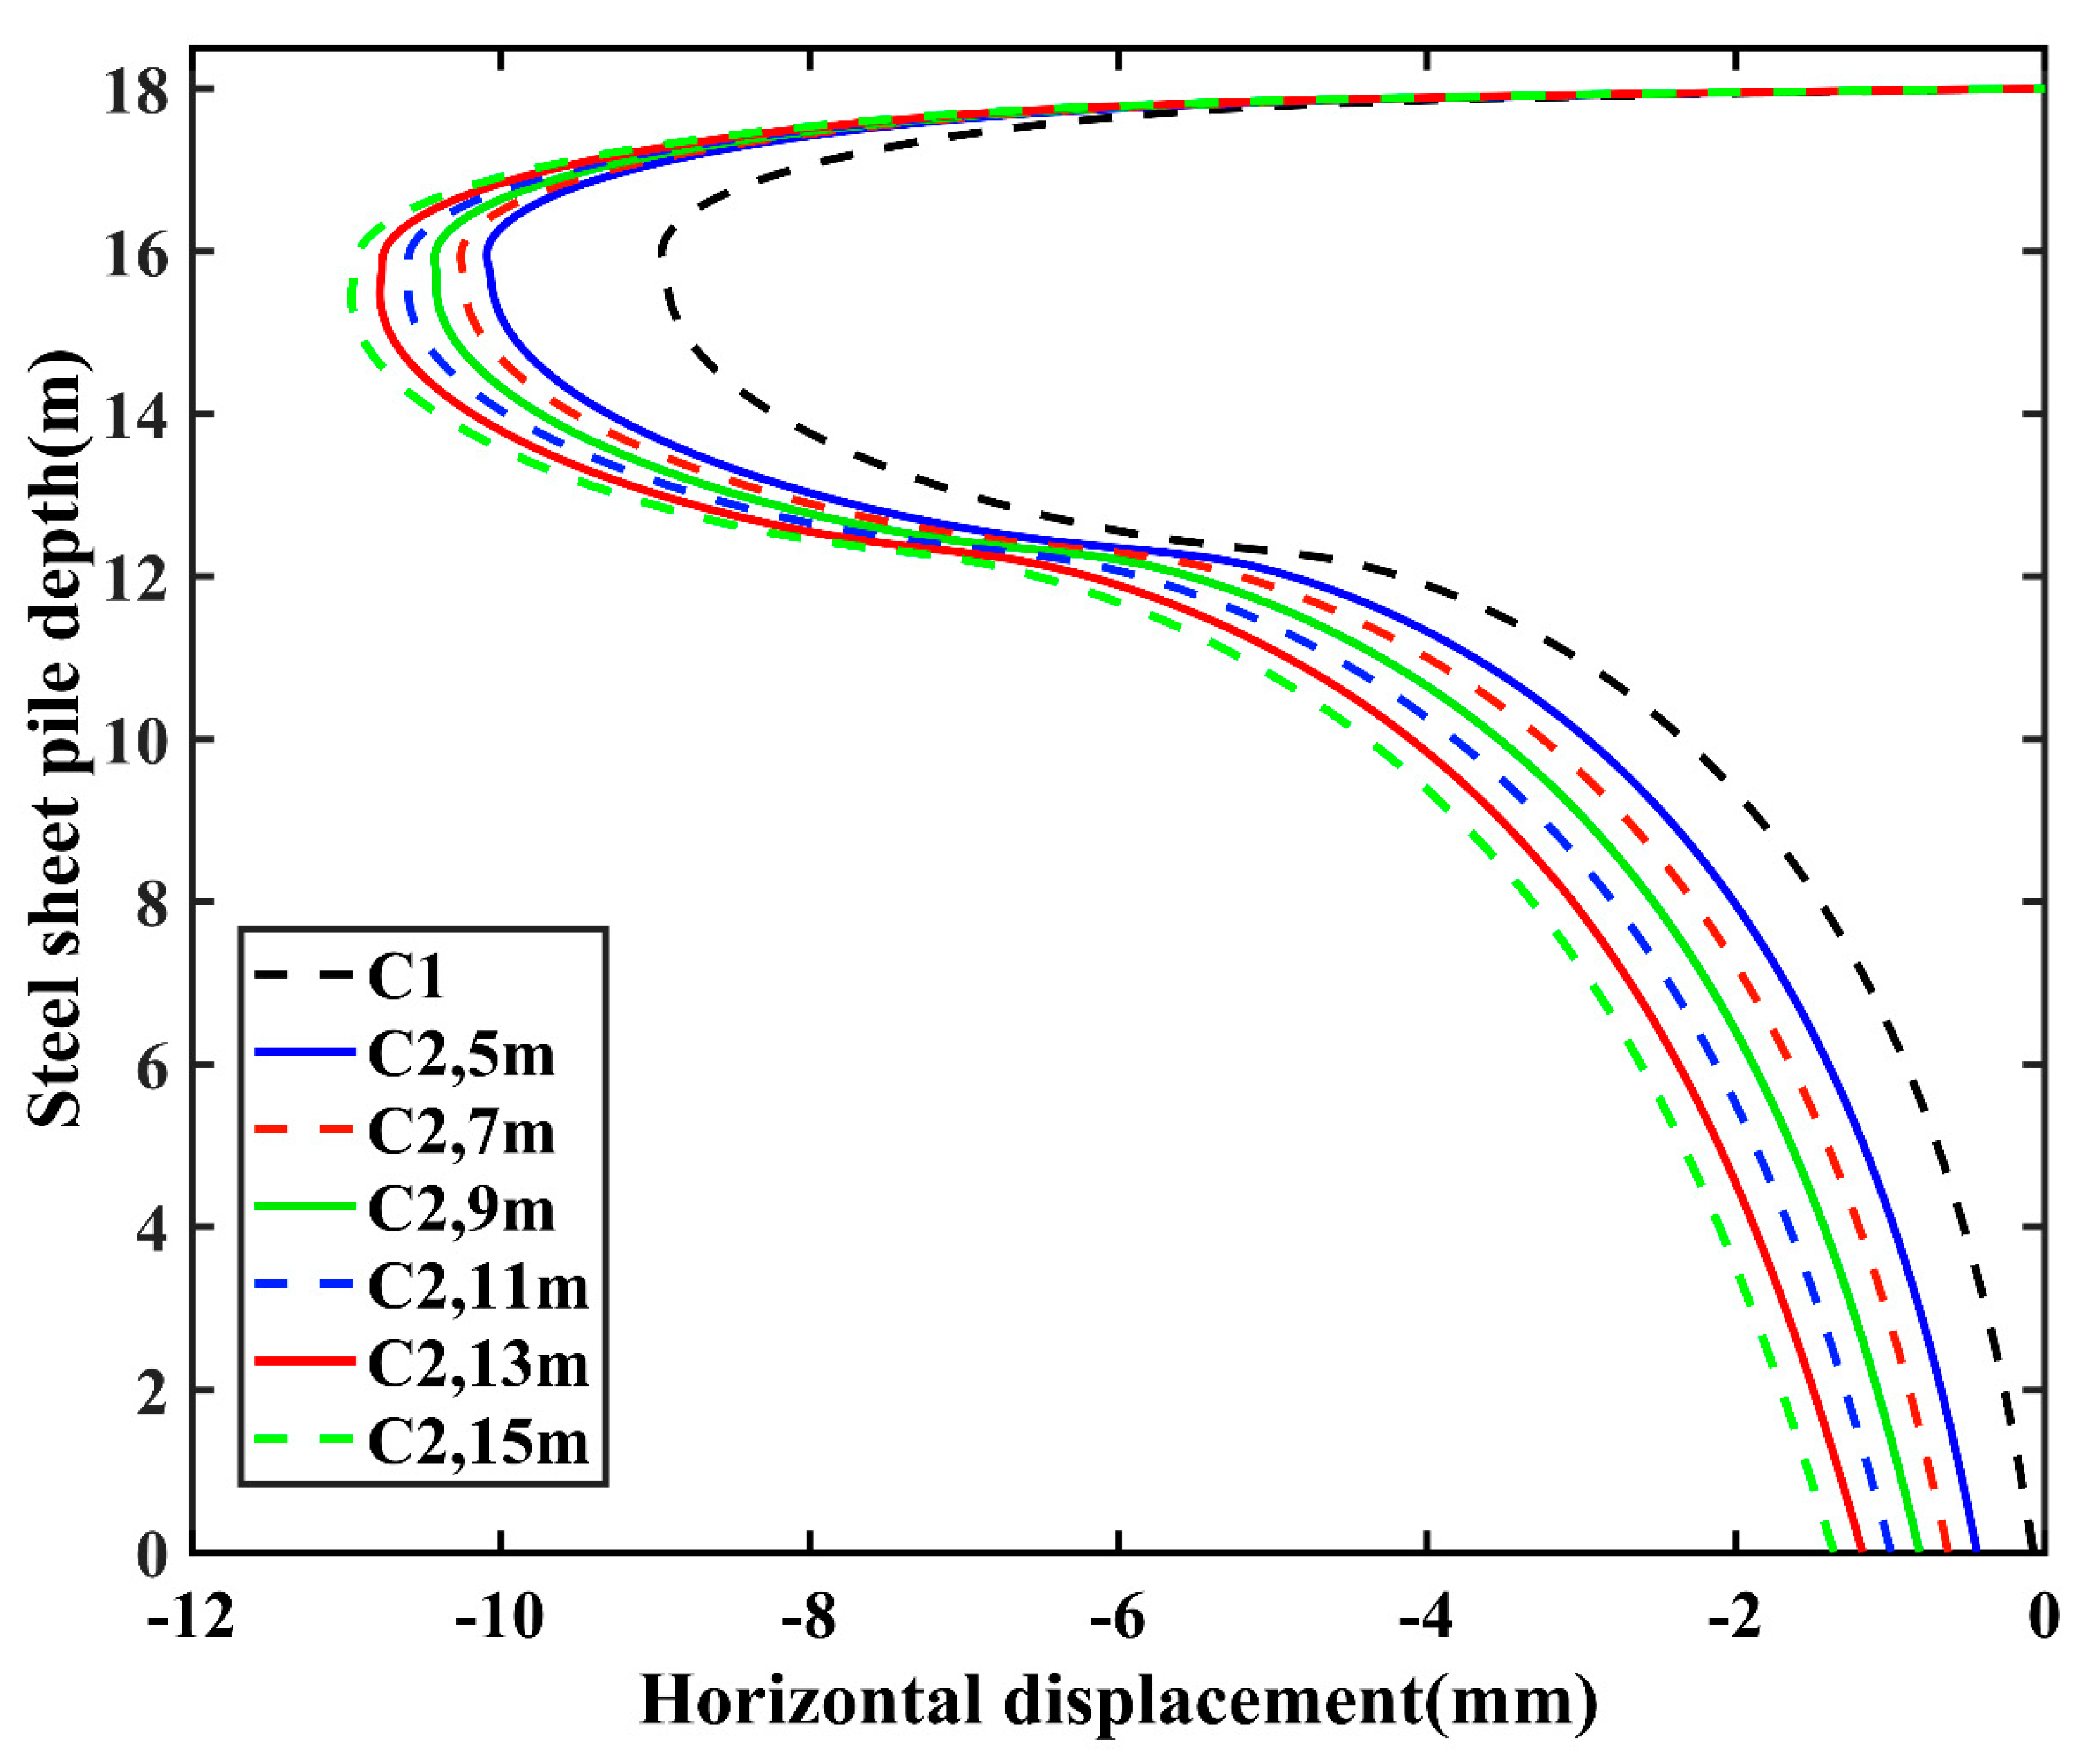
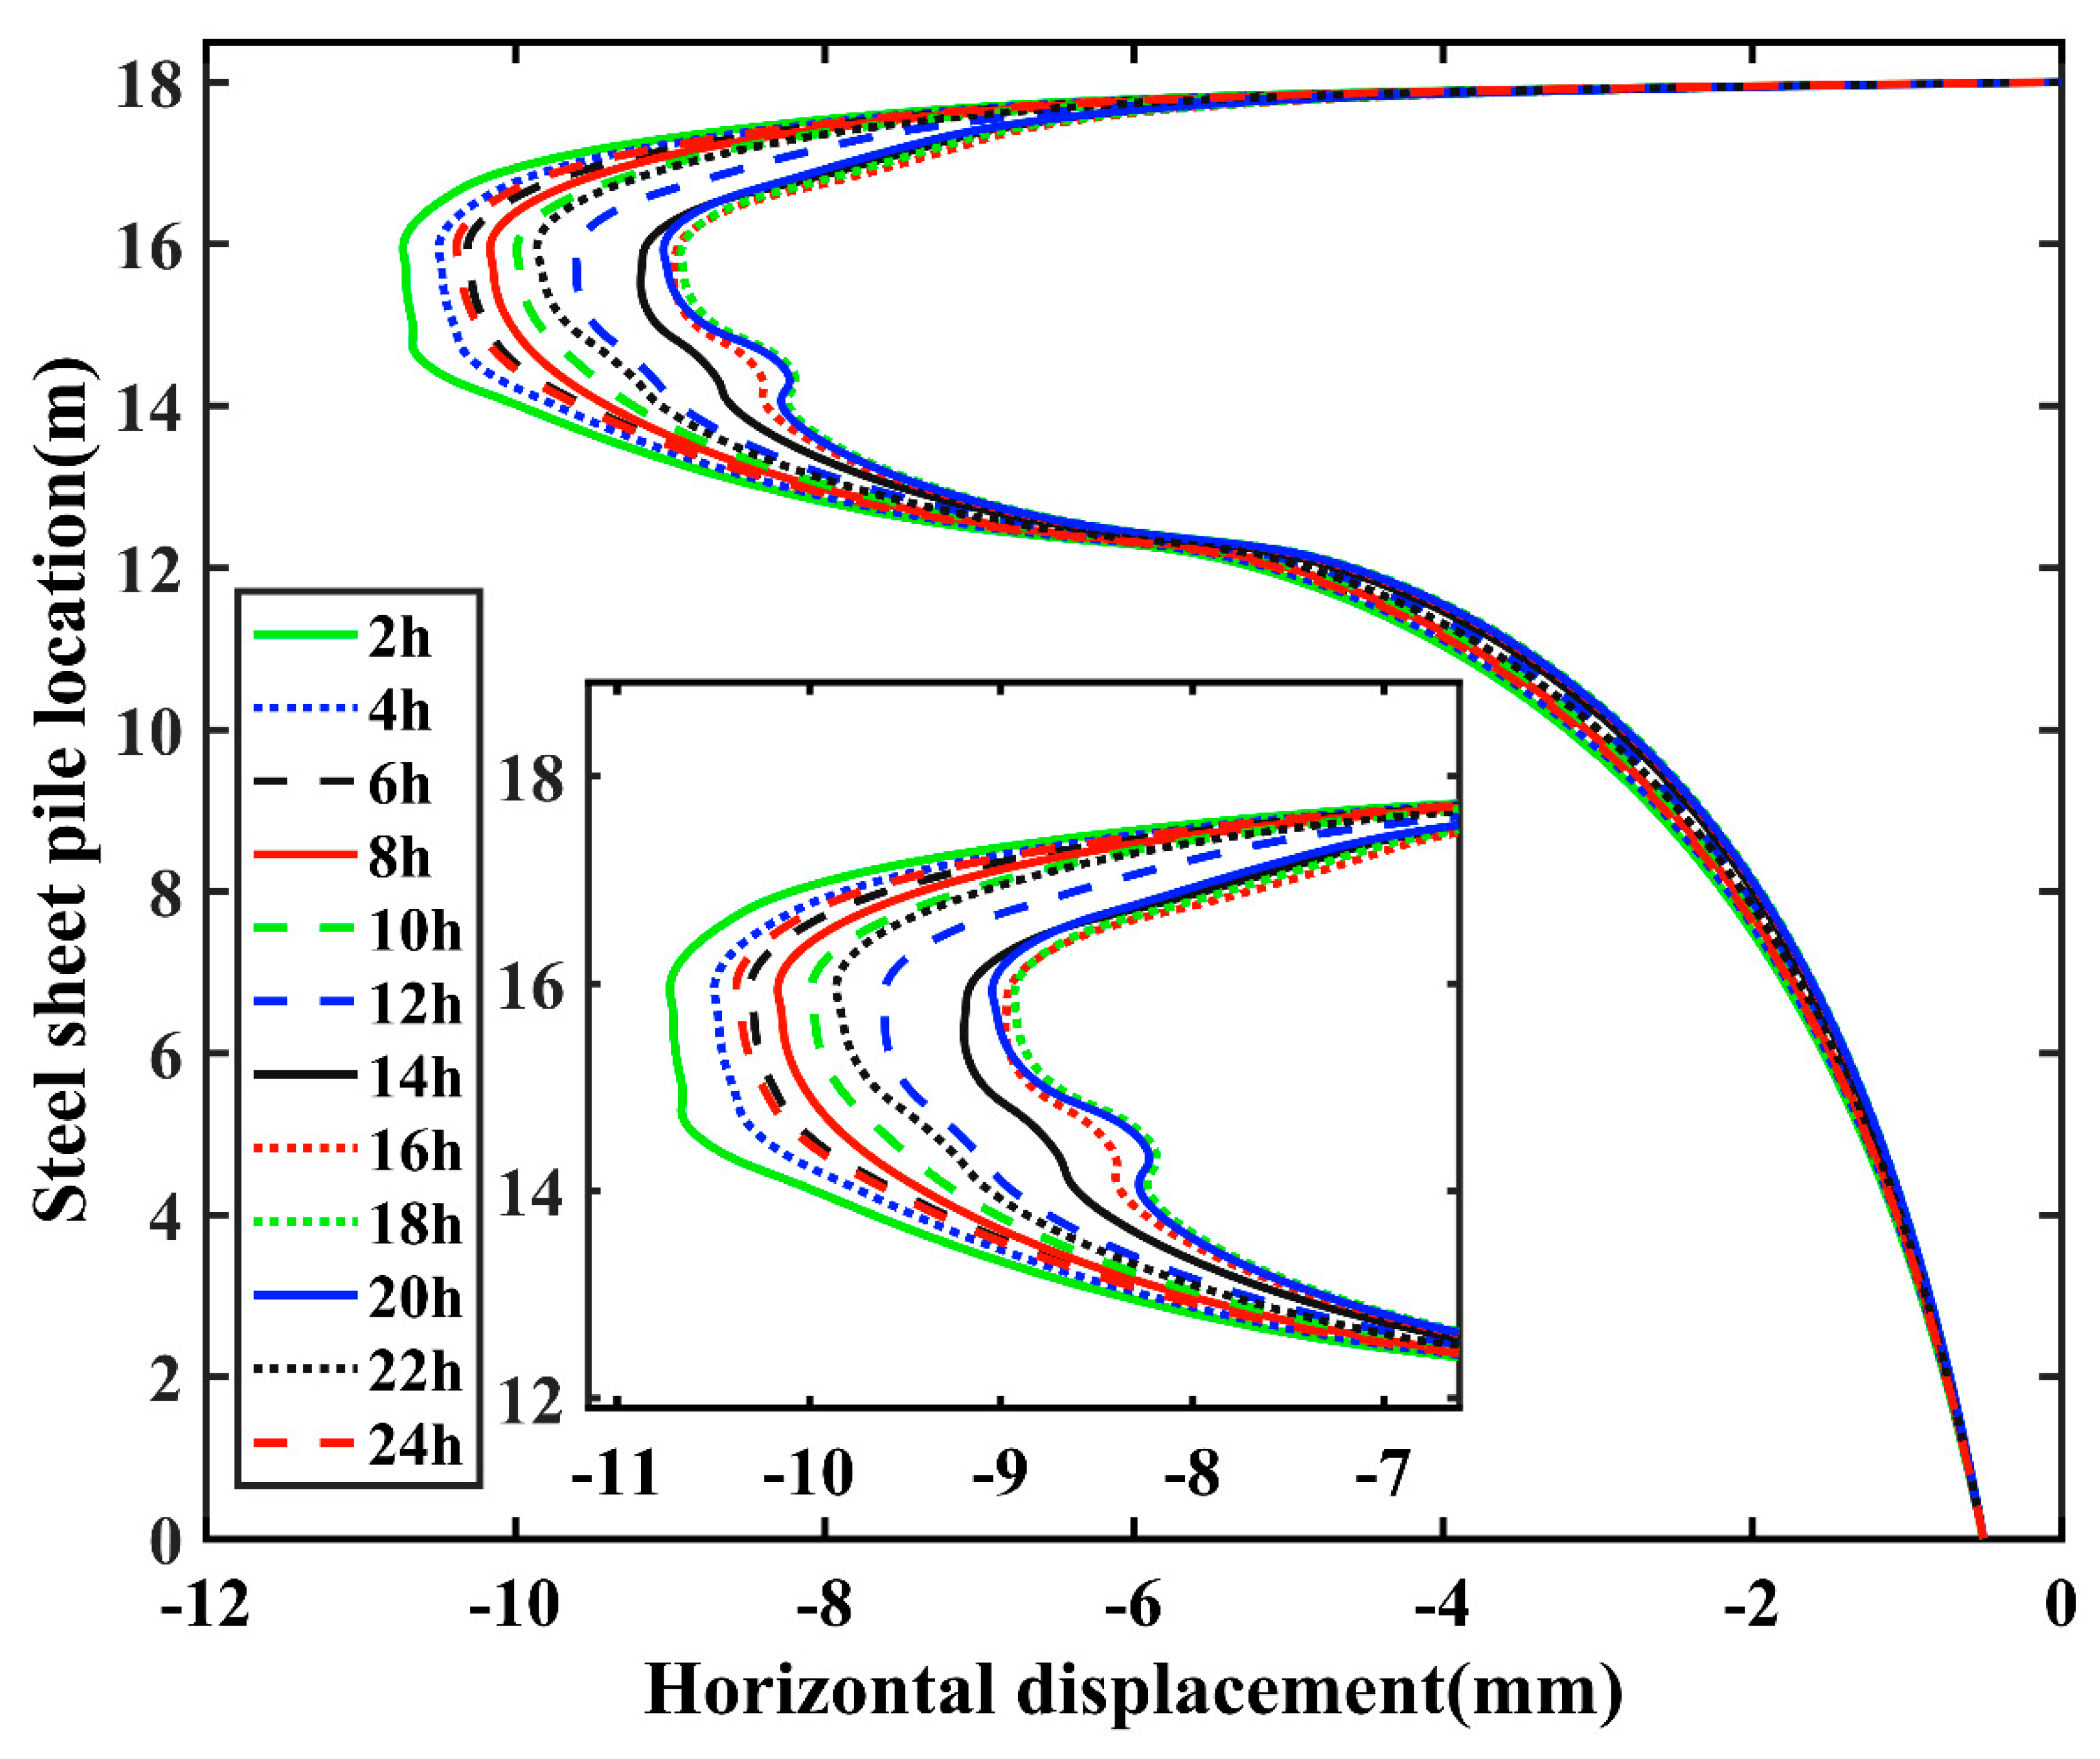
6.3. Enclosure Displacement

Figure 21 shows the calculation results of the east side of A5. The support steel pipe was divided into four key points. A horizontal displacement less than 0 meant the displacement direction was out of the pit; as the time increased, the support structure was displaced by the temperature. The displacement was increasing and then decreasing, and this larger displacement lasted about 4 h. The left side displacement was close to the right side displacement. This situation was caused by the deformation of the enclosure: the deformation of the enclosure also has an effect on the bending of the steel pipe. The actual situation in the project may have been more complex, as the shading of unknown objects and changes in the construction weather can lead to uneven stress distribution problems in the support structure.
In actual engineering, the displacement of the enclosure is affected by the joint influence of soil stress, pore stress, and thermal stress. The results of the three-dimensional model of the support structure stress affected by the temperature field are calculated, interpolated, and fitted into a two-dimensional fluid-structure coupling model to achieve the effect of coupling the three fields. The fluid–solid coupling model is based on Biot’s consolidation theory [24]. The two-dimensional fluid-structure coupling equation can be expressed as:
G 2 w x G 1 2 v x w x x + w y y + u x = 0
G 2 w y G 1 2 v y w x x + w y y + u y = γ t
t w x x + w y y + 1 γ w x k x u x + y k y u y + γ w = 0
where G is Young’s modulus, 2 is the Laplace operator; w x , w y refer to the displacement along the x and y directions; v is Poisson’s ratio; u is the pore water pressure; γ t and γ w are the unit weights of soil and water, respectively; and k x and k y refer to the permeability coefficient along the x and y direction.
The deformation of a saturated porous medium caused by fluid withdrawal is theoretically described by the three-dimensional fully coupled poroelasticity model. The theory considers the stress–strain relationship between the fluid and the solid skeleton and its mode of motion separately [25].
The Biot theory assumes that all layers around the pit are homogeneous and fully saturated, and that the soil particles and pore water are in-compressible, which describes the deformation of saturated porous media caused by fluid withdrawal under Darcy’s law [26], and is applicable to the problem of the deformation of porous media caused by the process of foundation pit precipitation. Table 3 shows the mechanical parameters of certain soils. The layering is based on the results of the field survey of the foundation pit. The calculation of soil stress is based on the Mohr–Coulomb criterion, which can be referred to in the research [27].
The time variability of pore pressure and earth pressure is poor, with negligible changes over a 24 h period. In contrast, the stress of the support structure has a strong time variability, which is reflected in the previous chapter. A simple inference can be drawn that the daily displacement change in the enclosure structure is mainly influenced by temperature. In order to verify this inference, the enclosure displacements were calculated for the multi-field coupling. Figure 22 shows the pore pressure cloud for deep foundation pits. The flow network diagram consists of streamlines intersected by lines of equal head. The arrows are streamlines, which indicate the direction of flow within the seepage zone.
In past studies, the water tightness of the enclosure has been shown to be effective in reducing foundation settlement and translating this settlement into horizontal displacements. The effect of seepage is a part of the calculation of horizontal displacement that cannot be ignored. The difference in pore stress between the two sides of the pit results in a certain horizontal displacement of the enclosure, the magnitude of which is related to the difference in pore stress between the two sides. Figure 23 shows the horizontal displacement of the pit with multiple fields coupled. C1 is the case of non-flow-solid coupling, and C2 is the case considering flow-solid coupling. The simulation of the water barrier is achieved by changing the infiltration coefficient in the model. To differentiate significantly, the bored piles do not pass water when there is a water barrier. The seepage field is calculated by the porosity of the cement when there is no water barrier. According to Wang’s research [28], when combined with the actual water–cement ratio used in the project, the porosity of the bored pile was taken to be 0.108. As the depth of the water barrier increased, the difference in pore pressure between the inside and outside of the pit increased, which led to an increase in the horizontal displacement of the enclosure.
Figure 24 shows the horizontal displacement of the enclosure at different times. The horizontal displacement varied with time in a pattern of first decreasing and then increasing, with the smallest displacement at 18 h and the largest displacement at 2 h. Most of this temporal variability comes from thermal stresses. The variation in displacement with time is related to the variation in temperature of the supporting structure with time. When the temperature rose, the thermal stress of the supporting structure increased, and the displacement of the enclosure decreased; when the temperature decreased, the thermal stress decreased, and the displacement increased. In addition, the range of action of thermal stress was mainly within the depth of the pit (less than 6 m).
Similarly, three inclinometers were set up for the eastern part of the pit at three depths of 2 m, 4 m, and 6 m. They were numbered CX-E-2m, CX-E-4m, and CX-E-6m respectively. The horizontal displacement values of the enclosure structure were read for each whole point of the inclinometers and stored in the database, which was retrieved through the website. The calculated values for the three depth models and the actual monitored values are shown in Figure 25. The calculated and monitored values had a similar pattern as time changed: they both increased and then decreased. The maximum value of displacement occurred at 16–20 h. This time-varying feature was mainly caused by the change in temperature. The influence of thermal stress was less wide and could only act near the depth of the support structure.

7. Conclusions

In this paper, the non-uniform temperature and displacement fields of pit 358# that were recorded during the construction of the Shanghai-Hangzhou Railway were calculated using radiation and heat transfer theory. The accuracy of this numerical simulation method was verified by comparing the actual monitoring values of the stress and displacement of the enclosure structure with the calculated values. The innovation of the thesis lies in the numerical simulation of a pit with a steel sheet pile enclosure structure. When compared to other studies, not only was the shadow effect considered, but also the consideration of long-wave radiation from the enclosure structure was added. This paper built a model based on the engineering background, and the following conclusions were made:
(1) The material and temperature variation of the enclosure directly affected the temperature distribution of the support structure. The long-wave radiation received by the enclosure structure accounted for a large part of the total radiation received by the lower side support structure, at up to 68.3%.
(2) The temperature field of the supporting structure had an uneven distribution. The maximum temperature difference of the steel pipe reached 18.9 °C, and the maximum temperature reached 58.8 °C, which was a 66.1% increase over the prevailing ambient temperature. The main factor leading to the temperature difference was the angle of solar radiation. In the direct sunlight, the supporting structure temperature difference was obviously reduced. The temperature distribution of the support structure was in the form of a U-shaped distribution. The temperature on both sides of the support structure should be higher than the temperature in the middle. The reasons for this distribution characteristic could be the long-wave radiation effect of the enclosure.
(3) The decrease in temperature caused an increase in the horizontal displacement of the enclosure. A linear fitting of the stress changes due to temperature led to the conclusion that the horizontal stress increased by approximately 3.56 MPa for every 1 °C increase in temperature. The variation in the seepage effect of the pit over time was almost negligible.
(4) The thermal behavior was reflected in the changes in stress and displacement of the pit enclosure over a 24 h period, and was spatially and temporally non-uniform. The stresses and displacements of the enclosure had a certain delay with respect to the changes in temperature. The reasons for this delay effect need to be studied in more depth.

Funding

This research received no external funding.

Institutional Review Board Statement

Not applicable.

Informed Consent Statement

Not applicable.

Data Availability Statement

Data will be made available on request.

Conflicts of Interest

The authors declare no conflict of interest.

References

  1. Liu, H.; Chen, Z.; Chen, B.; Xiao, X.; Wang, X. Studies on the temperature distribution of steel plates with different paints under solar radiation. Appl. Therm. Eng. 2014, 71, 342–354. [Google Scholar] [CrossRef]
  2. Zhao, Z.; Liu, H.; Chen, Z. Thermal behavior of large-span reticulated domes covered by ETFE membrane roofs under solar radiation. Thin-Walled Struct. 2017, 115, 1–11. [Google Scholar] [CrossRef]
  3. Liu, H.; Chen, Z.; Han, Q.; Chen, B.; Bu, Y. Study on the thermal behavior of aluminum reticulated shell structures considering solar radiation. Thin-Walled Struct. 2014, 85, 15–24. [Google Scholar] [CrossRef]
  4. Chen, D.; Qian, H.; Wang, H.; Chen, Y.; Fan, F.; Shen, S. Experimental and numerical investigation on the non-uniform temperature distribution of thin-walled steel members under solar radiation. Thin-Walled Struct. 2018, 122, 242–251. [Google Scholar] [CrossRef]
  5. Jin, F.; Chen, Z.; Wang, J.; Yang, J. Practical procedure for predicting non-uniform temperature on the exposed face of arch dams. Appl. Therm. Eng. 2010, 30, 2146–2156. [Google Scholar] [CrossRef]
  6. Alinia, M.M.; Kashizadeh, S. Effect of flexibility of substructures upon thermal behaviour of spherical double layer space truss domes. Part I: Uniform thermal loading. J. Constr. Steel Res. 2006, 62, 359–368. [Google Scholar] [CrossRef]
  7. Tong, M.; Tham, L.G.; Au, F.T. Extreme thermal loading on steel bridges in tropical region. J. Bridge Eng. 2002, 7, 357–366. [Google Scholar] [CrossRef]
  8. Jin, Y.B.; Shen, X.; Rao, L.Y. Study on the effect of temperature change on the axial force and deformation of support in deep foundation pit. J. Geotech. Eng. 2021, 43, 1417–1425. [Google Scholar]
  9. Xiang, Y. Study on the effect of temperature stress on the internal force and deformation of deep foundation pit support structure. J. Geotech. Eng. 2014, 36, 64–69. [Google Scholar]
  10. Zhou, T.; Yang, H.J.; Hu, J.J.; Liu, H.N.; Liu, H.B.; Chen, Z.H. Experimental study on the temperature field of rectangular steel pipe concrete member sections under exposed environment. Build. Struct. 2020, 7, 80–85. [Google Scholar] [CrossRef]
  11. Hu, Q.; Ling, D.S.; Cheng, Z.H.; Chen, Z. Analysis of the effect of temperature stress on the force deformation of annular ground link wall enclosure structure. J. Geotech. Eng. 2013, 35, 2139–2143. [Google Scholar]
  12. Mao, J.; Wang, H.; Spencer, B.F., Jr. Toward data anomaly detection for automated structural health monitoring: Exploiting generative adversarial nets and autoencoders. Struct. Health Monit. 2021, 20, 1609–1626. [Google Scholar] [CrossRef]
  13. Zhang, Y.M.; Wang, H.; Mao, J.X.; Wang, F.Q.; Hu, S.T.; Zhao, X.X. Monitoring-based assessment of the construction influence of Benoto pile on adjacent high-speed railway bridge: Case study. J. Perform. Constr. Facil. 2019, 33, 04018106. [Google Scholar] [CrossRef]
  14. Golbabaei, F.; Karami, E.; Shahi, M.; Safari, Z.; Azrah, K. Modeling and investigating the effect of parasol installation on solar radiant temperature reduction using COMSOL Multiphysics. Int. J. Occup. Saf. Ergon. 2022, 1–15. [Google Scholar] [CrossRef]
  15. Jiménez-Flores, S.; Pérez-Luna, J.G.; Alvarado-Pulido, J.J.; Jiménez-González, A.E. Development and simulation of a magnetohydrodynamic solar generator operated with NaCl electrolyte solution. J. Sol. Energy Eng. 2021, 143, 021004. [Google Scholar] [CrossRef]
  16. Zhang, Z.; Li, Z.; Lou, C. Numerical analysis of radiative entropy generation in a parallel plate system with non-uniform temperature distribution participation medium. J. Quant. Spectrosc. Radiat. Transf. 2019, 225, 319–326. [Google Scholar] [CrossRef]
  17. Lin, Y.Z.; Sun, Y.D. Calculation method of foundation pit support structure under the effect of temperature. J. Shandong Min. Inst. 1999, 18, 51–57. [Google Scholar]
  18. Diniz, J.M.; Santos, C.A.D.; Silva, J.P.D.; Rocha, Á.B.D. Reformulation of the Used Model to Estimate Soil Temperature. Energies 2022, 15, 2905. [Google Scholar] [CrossRef]
  19. Liu, H.; Chen, Z.; Zhou, T. Numerical and experimental investigation on the temperature distribution of steel tubes under solar radiation. Struct. Eng. Mech. 2012, 43, 725–737. [Google Scholar] [CrossRef]
  20. Chauhan, A.; Sharma, U.K. Influence of temperature and relative humidity variations on non-uniform corrosion of reinforced concrete. Structures 2019, 19, 296–308. [Google Scholar] [CrossRef]
  21. Yazgan-Birgi, P.; Arafat, H.A.; Ali, M.I.H. Implementation of two multiphase flow methods in modeling wetting of microporous hydrophobic membranes. Sci. Total Environ. 2019, 691, 1251–1261. [Google Scholar] [CrossRef] [PubMed]
  22. Wu, Y.X.; Shen, S.L.; Lyu, H.M.; Zhou, A. Analyses of leakage effect of waterproof curtain during excavation dewatering. J. Hydrol. 2020, 583, 124582. [Google Scholar] [CrossRef]
  23. Zhou, M.; Fan, J.S.; Liu, Y.F.; Zhang, J.X.; Duan, X.J.; Lei, S.S. Non-uniform temperature field and effect on construction of large-span steel structures. Autom. Constr. 2020, 119, 103339. [Google Scholar] [CrossRef]
  24. Biot, M.A. General theory of three-dimensional consolidation. J. Appl. Phys. 1941, 12, 155–164. [Google Scholar] [CrossRef]
  25. Selvadurai, A.P.S.; Suvorov, A.P. Coupled hydro-mechanical effects in a poro-hyperelastic material. J. Mech. Phys. Solids 2016, 91, 311–333. [Google Scholar] [CrossRef]
  26. Yang, J.; Yang, D.; Han, H.; Qiu, L.; Cheng, Y. A wave propagation model with the Biot and the fractional viscoelastic mechanisms. Sci. China Earth Sci. 2021, 64, 364–376. [Google Scholar] [CrossRef]
  27. Jiang, H.; Jiang, A.; Xu, M. Research on Algorithm and Coupling Damage Model of Rock Under High Temperature and Loading Based on Mohr–Coulomb Criterion. Int. J. Comput. Methods 2022, 19, 2250001. [Google Scholar] [CrossRef]
  28. Wang, J.; Xu, H.; Xu, D.; Du, P.; Zhou, Z.; Yuan, L.; Cheng, X. Accelerated carbonation of hardened cement pastes: Influence of porosity. Constr. Build. Mater. 2019, 225, 159–169. [Google Scholar] [CrossRef]
Figure 1. Layout plan of the rotating platform and the existing high-speed rail.
Sustainability 14 17001 g001
Figure 2. Layout of the pit support structure.
Sustainability 14 17001 g002
Figure 3. Average temperature and model input temperature for sunny days in June in Hangzhou.
Sustainability 14 17001 g003
Figure 4. Schematic diagram of the support structure arrangement.
Sustainability 14 17001 g004
Figure 5. Model building and meshing.
Sustainability 14 17001 g005
Figure 6. Average temperature difference between day and night.
Sustainability 14 17001 g006
Figure 7. Solar altitude angle at different times.
Sustainability 14 17001 g007
Figure 8. Solar radiation intensity at different times.
Sustainability 14 17001 g008
Figure 9. A5 in direct sunlight. (a) Total radiation intensity at A5 in direct sunlight. (b) Percentage of solar radiation.
Sustainability 14 17001 g009
Figure 10. A5 at maximum temperature. (a) Total radiation intensity. (b) Percentage of solar radiation.
Sustainability 14 17001 g010
Figure 11. B5 in direct sunlight. (a) Total radiation intensity at B5 in direct sunlight. (b) Percentage of solar radiation.
Sustainability 14 17001 g011
Figure 12. B5 at maximum temperature. (a) Total radiation intensity. (b) Percentage of solar radiation.
Sustainability 14 17001 g012aSustainability 14 17001 g012b
Figure 13. Maximum and minimum temperature and temperature differences. (a) Maximum and minimum temperature of A5 at different times. (b) Temperature difference of A5 at different times.
Sustainability 14 17001 g013
Figure 14. Temperatures at different locations on A5 at different times (east side at 0 m).
Sustainability 14 17001 g014
Figure 15. Temperatures at different locations on B5 at different times (east side at 0 m).
Sustainability 14 17001 g015
Figure 16. Average temperature of A5, B5, and ambient temperature.
Sustainability 14 17001 g016
Figure 17. Temperature distribution of A5 and B5 at different times.
Sustainability 14 17001 g017
Figure 18. Stress fitting under thermal behavior.
Sustainability 14 17001 g018
Figure 19. Location of stress monitoring points.
Sustainability 14 17001 g019
Figure 20. Comparison of actual monitored and calculated values of stresses in the east enclosure. (a) Depth 2 m. (b) Depth 4 m. (c) Depth 6 m.
Sustainability 14 17001 g020aSustainability 14 17001 g020b
Figure 21. Horizontal displacement on the east side of A5.
Sustainability 14 17001 g021
Figure 22. Pore pressure cloud.
Sustainability 14 17001 g022
Figure 23. Horizontal displacement of the enclosure structure at different depths of the water proof curtain.
Sustainability 14 17001 g023
Figure 24. Horizontal displacement of the enclosure at different times.
Sustainability 14 17001 g024
Figure 25. Comparison of actual monitored and calculated values of horizontal displacement in the east enclosure. (a) Depth 2 m. (b) Depth 4 m. (c) Depth 6 m.
Sustainability 14 17001 g025aSustainability 14 17001 g025b
Table 1. Radiation theoretical parameters.
ParametersConvection Coefficient (W/(m2·K)) The   Blackbody   Emissive   Power   ( K ) / e b ( T ) Absorption   Coefficient / λ Emissivity   Coefficient / ρ d
Values1458000.80.2
Table 2. Heat transfer parameters for steel tubes.
ParametersSpecific Heat Capacity
(J/(kg·K))
Thermal Conductivity/W/(m·K)Thermal Expansion Coefficient
(1/K)
Density (kg/m3)Young’s Modulus (Pa)Poisson’s Ratio
Values47544.51.23 × 10−578502.00 × 10110.3
Table 3. Mechanical parameters of certain soils.
NumberHydrogeologyDepth (m) Thickness
(m)
Unit Weight
(kN/m−3)
Shear ExperimentPoisson’s Ratio
Cohesion (kPa)Internal Friction
Angle (°)
1Filled soil0 2.217.40180.3
2Clay sand2.229.816.930160.25
3Sand32520.82360.25
Publisher’s Note: MDPI stays neutral with regard to jurisdictional claims in published maps and institutional affiliations.

