1. Introduction
The anthropogenic impact on the climatic system enters into complex interactions with natural factors, determining the difficulty in predicting climatic changes [
1]. Changing the nature of land by human activities will inevitably lead to a response to climate change. Land use change affects energy and water vapor exchange between the land surface and atmosphere by changing the surface albedo and surface roughness, thus indirectly affecting the surface radiation budget and energy balance; additionally, these changes have different impacts on the regional and global climate [
2]. The impact of land use on climate change is very complex, involving interactions of albedo, evaporation, the carbon cycle, and other factors [
3]. Among them, meteorological elements are one of the most important determinants.
Desert microclimate research is a branch of desert climate research that covers a wide range of research fields, such as desert vegetation, groundwater, micrometeorology, local topographic circulation in the desert, soil moisture, surface temperature, and oasis effects. With the development of society, people living in oasis areas on the edge of the desert began to understand the desert climate in the process of production and life, fighting against sandstorms and drought [
4,
5]. In modern times, with the improvement of productivity, researchers began to think rationally about desert climate and carried out research [
6,
7,
8,
9,
10,
11,
12,
13,
14]. At present, domestic and foreign scholars’ research on the desert microclimate involves change in various meteorological parameters and energy characterization parameters in the process of desertification and oasis, and those research efforts also gradually reveal the local climate effect in these processes.
Since 2005, in the oil headquarters living quarters and desert highway on both sides of the Taklimakan Desert hinterland, an ecological protection belt of shrubs has been built, CGL has been supported by groundwater and drip irrigation technology, and mobile sand dunes have been fixed, thus improving the living environment for production and living in the desert. With the change in the underlying surface properties in small desert areas, a variety of meteorological elements and soil microenvironments and other characteristic parameters change accordingly, breaking the original pattern of the near-surface energy balance in the small desert area. Under the influence of the redistribution, permutation and combination of regional microclimate factors, a local microclimate of the desert CGL has been formed, which is greatly different from the extreme desert climate. Many scholars have begun to pay attention to this phenomenon, and research on the local microclimate of the Taklimakan Desert has also been carried out [
15,
16,
17,
18,
19,
20,
21,
22]. However, there is still a lack of systematic and comprehensive observation experimentation on natural sand and CGL, especially in the center of the desert. Therefore, based on previous research experience, we conducted a systematic study on the local climate differences in the CGL in the hinterland of the Taklimakan Desert, which is an ideal experimental area for assessing the interaction between CGL and NSL. Based on long-term field positioning observation experiments, we could reveal the observation facts about the temperature, humidity and wind of the ground between the artificial underlying surface and the natural underlying surface. The test and research results can provide a basis for the evaluation of the stability of ecological greening projects in the Tarim Basin, provide scientific and theoretical data support for the sustainable development of CGL in desert areas, and provide an important reference for studying the interaction and influence mechanism of land and atmosphere between desert and oasis areas.
In this study, we focused on reporting the observed differences between CGL and NSL. There are very few such observations worldwide, so these data are valuable for helping us understand the local climate differences within deserts. The paper is arranged as follows.
Section 2 describes the climate overview of the observational site, the introduction of the experiment and the quality control. The observed changes in temperature, wind speed, and humidity are discussed in
Section 3.
Section 4 provides the discussion, and
Section 5 presents the conclusion.
3. Differences in Local Meteorological Factors
3.1. Temperature Characteristics
Due to the influence of the underlying surface in the desert area, the temperature difference between day and night was extremely large. Therefore, day–night mapping analysis was adopted to highlight the local temperature change characteristics of NSL and CGL in desert areas to elaborate the similarities and differences as well as the threshold interval of temperature changes in more detail.
As shown in
Figure 2, the diurnal variation in temperature in NSL and CGL was very significant. The solar elevation varied in different seasons. To show the diurnal variation in temperature in a more detailed way, we defined the interception points of the daytime and nighttime width of each representative month in each season to observe the sunrise and sunset time of the month. Since it took a certain period of time for solar radiation to heat the underlying surface and near-surface atmospheric temperature, the increase in temperature usually lagged by 2 h. Within a day, the solar elevation reached its maximum at 12:00 local time. Therefore, the highest temperature on NSL occurred at 14:00 local time. In the study area, NSL had good uniformity of the underlying surface, small heat capacity of dust particles, strong surface-reflected radiation, and more energy feedback to the atmosphere. The maximum temperature appeared at 15:00 (Beijing time). Therefore, from sunrise to noon, the 2 m temperature near the surface of NSL was obviously higher than that of CGL, and it conformed to the above rules in April, July, September and January. From noon to sunset, the NSL temperature reached its peak and began to decrease. For the CGL, the heat capacity was large due to the presence of vegetation. Moreover, in the CGL, the vegetation moisture content was significantly higher than that in the NSL. In the process of water evaporation, the liquid turns to gas and absorbs a certain amount of heat. At the same time, due to the growing season, CGL drip irrigation causes surface water evaporation. Therefore, under the combined effects of the physical properties of vegetation, plant transpiration, and surface water evaporation, the temperature of the CGL reached its peak at 17:00 (Beijing time), which was approximately 2 h later than that in natural sand.
Because there was no solar radiation to provide energy at night, the temperatures of both the NSL and the CGL continued to decrease. Both the CGL (west) and the CGL (east) are located in the boundary transition zone between the CGL and desert, and the temperature over those areas was highest at night. During the nongrowing season of vegetation, the temperature of NSL was the lowest, while during the vegetation growing season, the temperature of the artificial greenbelt center was the lowest. According to the diurnal variation in the temperature in the NSL, CGL (west) boundary, CGL (east) boundary, and CGL central area, it was found that in all seasons, the daily difference in the central area of the CGL was the largest, followed by the daily difference in the NSL; furthermore, the CGL (west) boundary and the CGL (east) boundary had the smallest daily difference. The maximum daily range of the temperature in the four seasons occurred in the CGL (middle), which was 17.4 °C in winter, 15.3 °C in spring, 15.5 °C in summer and 19.0 °C in autumn. The minimum was in the CGL (west), with a range of 12.1 °C in winter, 11.6 °C in spring, 11.1 °C in summer, and 13.4 °C in autumn. Therefore, the daily temperature range in both the NSL and the CGL in the desert area showed an obvious microclimate effect, and the daily temperature range order was as follows: CGL (middle) > NSL (west) > CGL (east) > CGL (west) (
Figure 3).
The reasons for the abovementioned special temperature characteristics are complex. In the daytime, the underlying surface of sand grains is smoother under wind erosion because of the lower heat capacity of NSL than that of CGL. With the influence of solar radiation, natural ground heats up faster than CGL. The warm air heated over the NSL at night is transported to the CGL through local circulation, forming an inversion layer with hot upper and cold lower layers. It keeps the lower cold air stable, and thus, a microclimate, which is cooler and more humid than the NSL, is formed. The whole process demonstrates the microclimate effect of the CGL. In addition to the microclimate effect, the small terrain effect is one of the main factors causing the abovementioned phenomenon. The CGL (middle) may be considered as an example. The observation point was located in a valley with low terrain. Compared with the CGL (east–west) boundary, the air–ground contact area was larger, the wind speed was lower, and the heat was less likely to be lost than the boundary of the CGL. In addition, the CGL (middle) was the gathering place of cold air sinking along the low terrain at night, resulting in a large daily temperature range in the CGL (middle) combined with the radiation cooling effect. At the CGL (east–west) boundary, under the influence of vegetation, the rising daytime temperature was not as fast as that in natural sand. The observation point was located at the top of the large dune in the east and west, with high wind speed and strong turbulent exchange in the daytime. At night, the cold air near the ground sank along the low terrain, which filled the warmer air from the natural sand. Therefore, the CGL (east and west) boundary temperature was higher at night, and the daily temperature range was also smaller.
As shown in
Table 2, there was a significant feature of the temperature: in winter and spring, under the condition of extremely sparse vegetation, the night temperature was the lowest in NSL, followed by that in CGL, which was mainly affected by the low terrain. In the season with lush vegetation, the night temperature of the CGL was the lowest, followed by that in the NSL, which was also affected by the cold island effect of vegetation microclimate and the low terrain. Because of the alternation of the lowest value of the lowest night temperature, it was judged that the microclimate effect of the CGL was greater than the low terrain effect. The average daytime temperature of the NSL (west) was the highest in all seasons, indicating that the underlying surface of the desert had a more obvious warming effect on the surface layer than in the CGL. In July and September, the average night temperature of the CGL (middle) was the lowest in the seasons with better vegetation. Compared with the NSL, the CGL (middle) was a cold source with a significant cooling effect, which also reflected the oasis cold island effect of the microclimate from the side.
3.2. Temperature Variability
Of course, during the day, the time when the NSL reached the highest daily temperature was earlier than that in the CGL, and the time when it reached the lowest temperature was also earlier, with slight differences in different seasons. CGL had an obvious hysteresis effect of temperature. To more intuitively and accurately represent the characteristics of its temperature change, the daily changes in temperature variability of different underlying surfaces in different seasons are given, as shown in
Figure 4.
First, the daily change rate of NSL was different in the four seasons. The period of positive temperature change included a period of a continuous increase in warming and a period of a continuous decrease in warming. In January, the period when the warming rate continued to increase was 3 h, the maximum warming rate was 4.1 h, and the period when the warming rate continued to decrease was 5 h. In April, the period when the warming rate continued to increase was 2 h, the maximum warming rate was 3.2 h, and the period when the warming rate continued to decrease was 7 h. In July, the period when the warming rate continued to increase was 2 h, the maximum warming rate was 2.7 h, and the period when the warming rate continued to decrease was 8 h. In September, the period when the warming rate continued to increase was 2 h, the maximum warming rate was 4.4 h, and the period when the warming rate continued to decrease was 7 h.
Second, the CGL was affected by the effects of microclimate and low terrain, and the period of positive temperature change in the four seasons was obviously shorter than that of the NSL. The daytime change rate of the CGL was different from that of natural sand land in four seasons. In January, the period when the warming rate continued to increase was 1 h, the maximum warming rate was 4.9 °C/h, and the period when the warming rate continued to decrease was 6 h. In April, the period when the warming rate continued to increase was 2 h, the maximum warming rate was 4.2 °C/h, and the period when the warming rate continued to decrease was 6 h. In July, the period when the warming rate continued to increase was 3 h, the maximum warming rate was 4.1 °C/h, and the period when the warming rate continued to decrease was 6 h. In September, the period when the warming rate continued to increase was 3 h, the maximum warming rate was 4.8 °C/h, and the period when the warming rate continued to decrease was 6 h.
It is important that the period of continuous decrease in warming rate of the CGL was very stable, which was 6 h in all seasons of the year; the period of continuous increase in warming rate in the growing seasons was also very stable, which was 3 h in all seasons of the year. In addition, the maximum warming rate fluctuated little in the four seasons. Compared with the NSL, the maximum warming rate fluctuated greatly. Except for winter, the maximum temperature increase period was more stable, with a value of 2 h.
3.3. Temperature Profiles
The daytime and nighttime temperature profiles in each season were given by the temperature data of the different levels in the 80 m gradient observation system in the central area of the CGL. As shown in
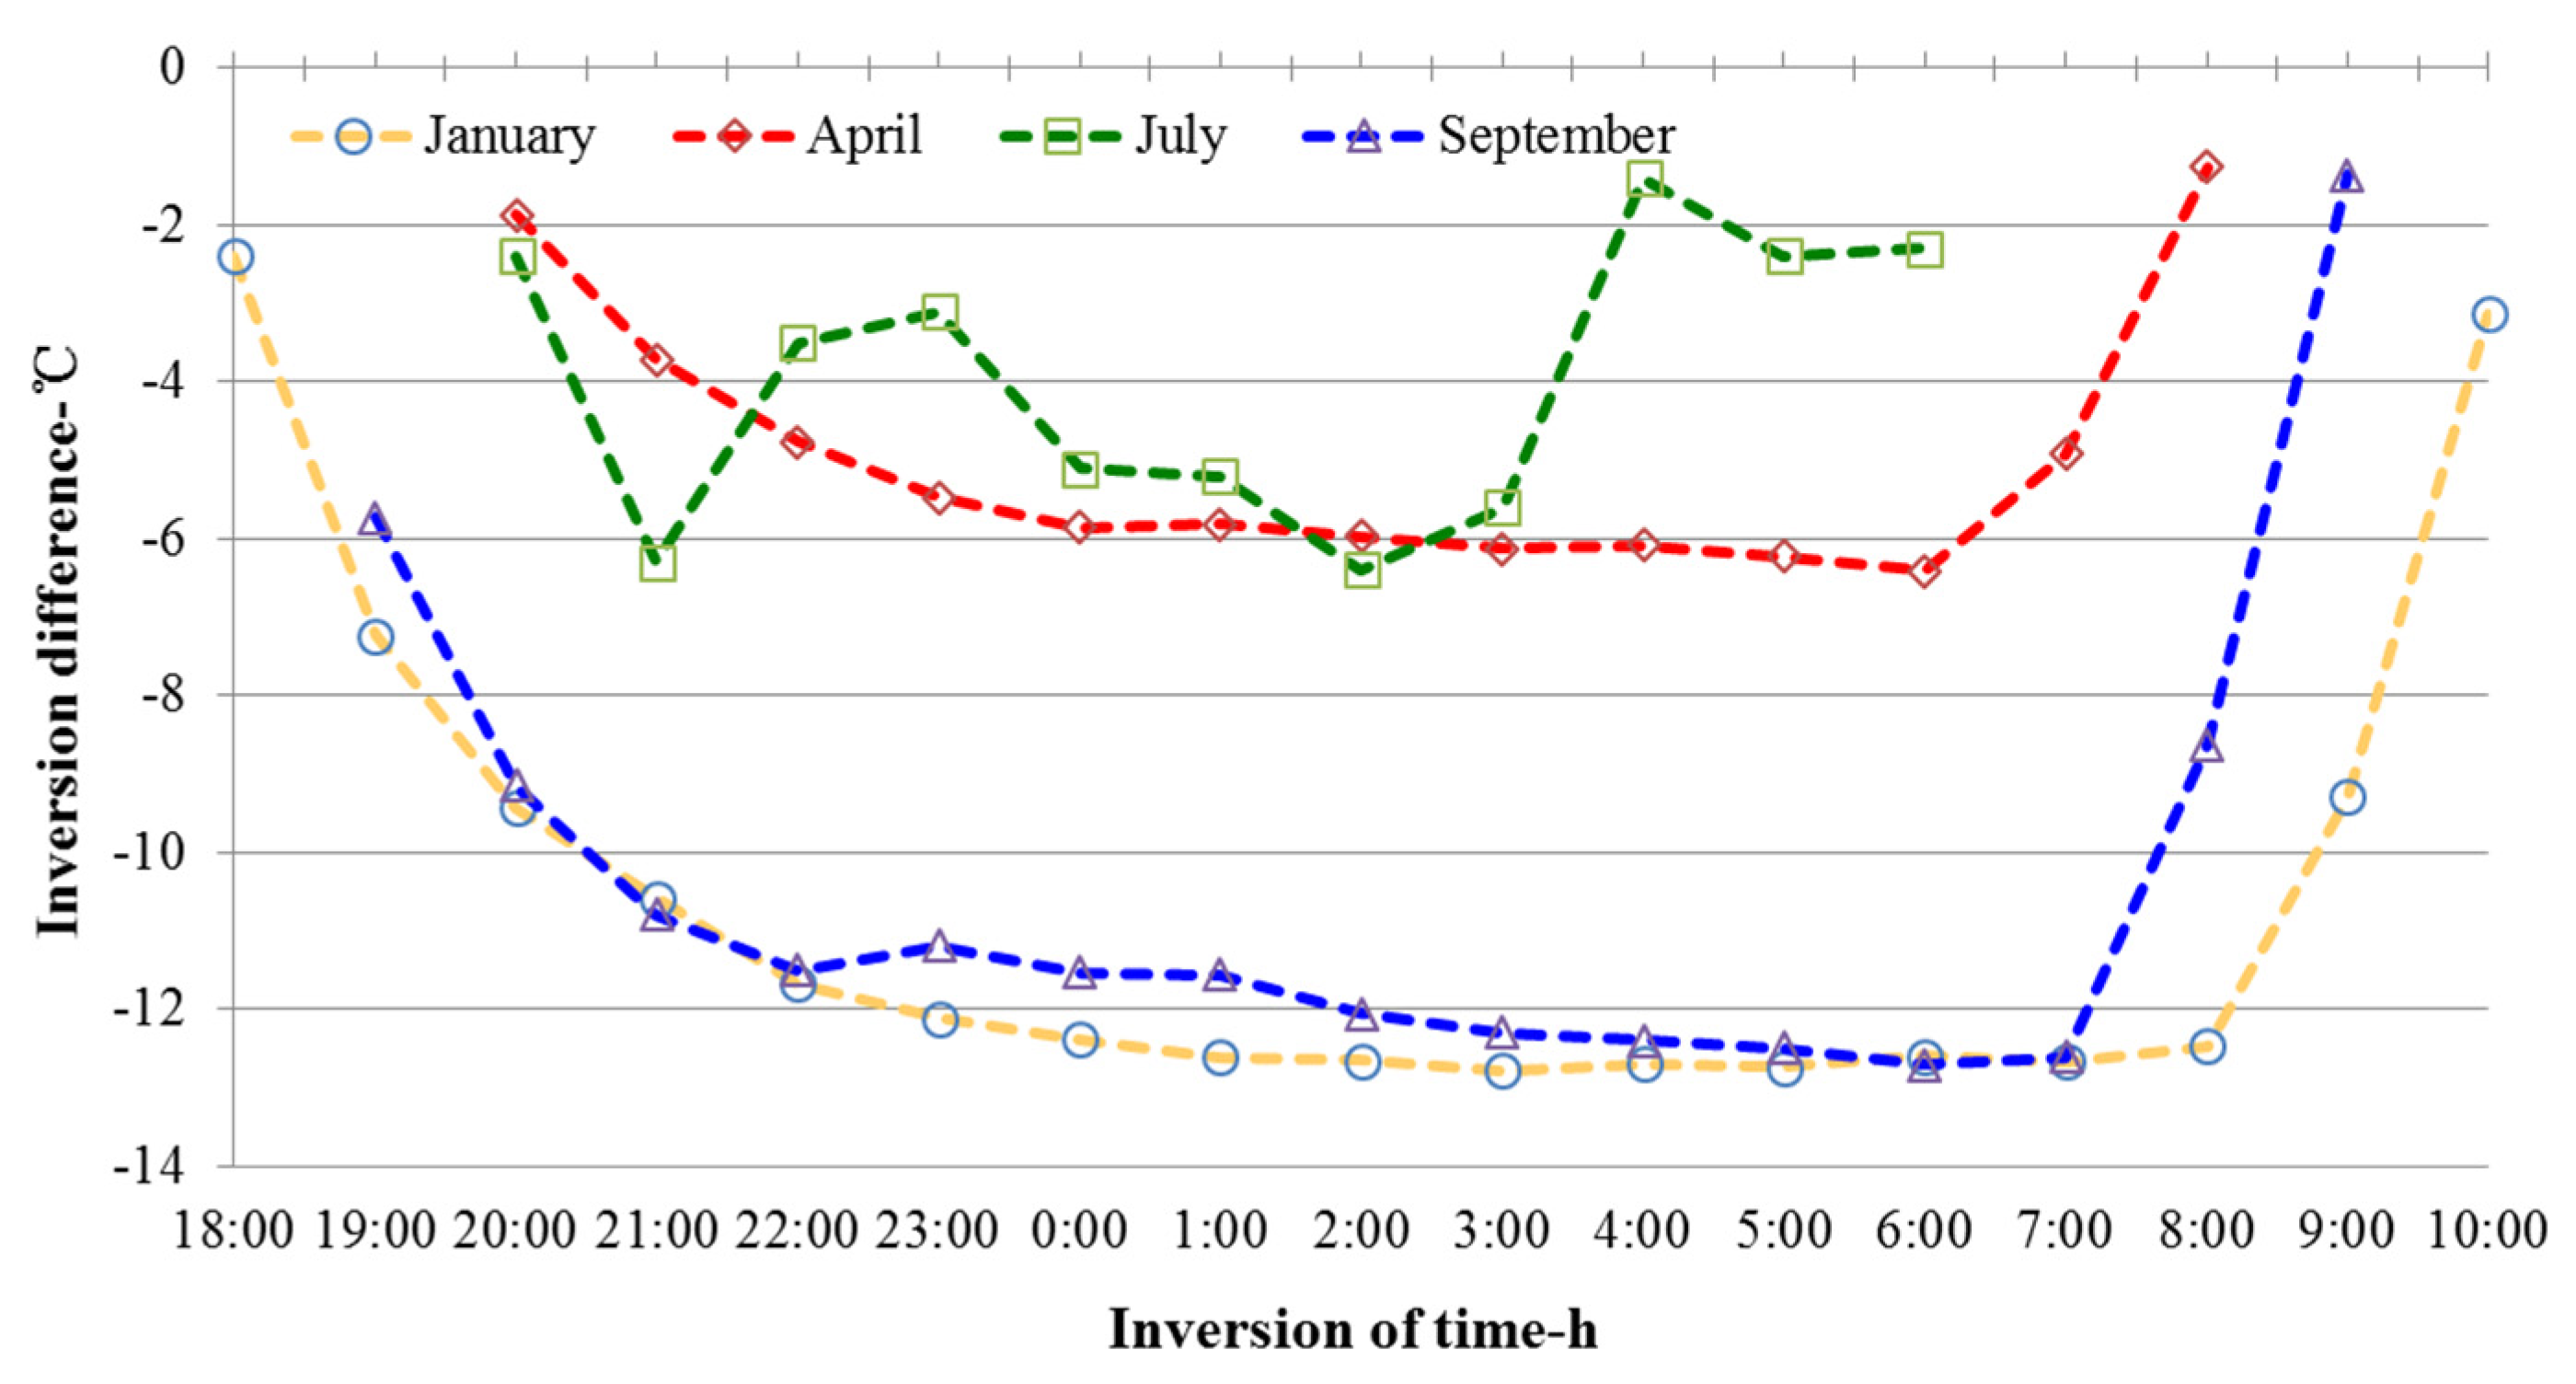
Figure 5, there were obvious nocturnal temperature inversions in winter, spring, summer and autumn. In January, the temperature inversion lasted for 16 h from 18:00 to 10:00 the next day. In April, the temperature inversion lasted for 13 h from 20:00 to 8:00 the next day. In July, the temperature inversion lasted for 11 h from 20:00 to 6:00 the next day. In September, the temperature inversion lasted for 15 h from 19:00 to 9:00 the next day. As shown in
Figure 6, the temperature inversion intensity was the highest in January, with the maximum temperature inversion difference reaching 12.8 °C at 3:00. The increasing rate of the temperature inverse difference was large from 18:00 to 20:00. The temperature inversion was stable from 23:00 to 7:00, and the deceleration rate of the temperature inverse difference was large from 08:00 to 10:00. The intensity of the temperature inversion was second in autumn in September, and the increasing rate of the temperature inversion was large from 19:00 to 22:00. The decreasing rate of the temperature inversion was large from 23:00 to 7:00 during the stable period, and the decreasing rate of the temperature inversion was from 8:00 to 9:00. This was followed by April in spring, and 00:00–6:00 was the stable period of temperature inversion. In July, the temperature inversion difference was smallest, with a maximum temperature inversion difference of 6.4 °C, and the temperature inversion fluctuated greatly with no stable period.
In the desert area, radiation inversion was the main factor. At night, the ground radiation was strong, and the cooling effect of the ground was strong, so the air temperature close to the ground dropped rapidly. The cooling rate of the upper air layer was small, which led to the negative vertical lapse rate of the air temperature and resulted in temperature inversion. Advection temperature inversion could not be ignored. The warm air above the NSL was transmitted horizontally to the upper air layer of the CGL. Due to the large temperature difference between the cold and warm air, the CGL adjacent to the ground air layer and the lower layer of warm air were greatly affected by cooling, the upper layer of warm air was less affected and the cooling was slower, which also strengthened the temperature inversion. Under the influence of the small terrain, the CGL (middle) was located in the valley, and the CGL (east–west) boundaries were on the hillsides. Due to the rapid heat dissipation of the hillside, the cold air sank along the hillside to the bottom of the valley. The warmer air at the bottom of the valley was pushed up by the cold air, resulting in temperature inversion. The temperature difference between the CGL (east and west) boundary and the CGL (middle) was one of the main reasons (
Figure 7).
In addition, in the desert, a certain area of vegetation can produce a “cold conduction” effect. Bao et al. studied the impact of vegetation coverage on Australia, and the results indicated that the greening of the deserts in midwestern Australia significantly reduced the surface temperature in the eastern part of the green area, with a temperature decrease of 7 °C in the cooling center. In the middle part of the Australian continent, there was significant warming caused by large-scale desertification [
28]. The temperature distribution showed that the desert land temperature increased, the critical vegetation land temperature decreased, and the boundary land temperature increased. In their research, it was stated that in winter and spring, under the condition of extremely sparse vegetation, the temperature at night was the lowest in the NSL; in the season of lush vegetation, the temperature at night was the lowest in the CGL, followed by that in the NSL. During the growing season, the night temperature in the center of the CGL was the lowest in the desert area caused by the microclimate effect and small terrain, which was lower than that of the NSL. Moreover, the night temperature on the boundary between the NSL and the CGL in the observation area was higher than that in the central area of the oasis, which also confirmed the results from other studies, reflecting the superposition effect of low terrain and showing the special characteristics of microclimate temperature of different underlying surfaces in the study area.
3.4. Characteristics of Wind Speed
The Taklimakan Desert is windy in spring and summer, with many windy days and frequent sand-dust weather, which was also confirmed by the observation data (
Figure 8). The wind speed in spring and summer was higher than that in autumn and winter in both the NSL and the CGL in the test area. The overall seasonal variation in the average wind speed was as follows: the wind was the strongest in spring, second strongest in summer, third strongest in autumn, and weakest in winter. In terms of diurnal variation, the average wind speed in the daytime was higher than that at night, the turbulence during the day was strong, the air temperature changed drastically, the wind speed was high, the night tended to be stable, the temperature inversion was strong, and the wind speed was low. Among them, the variation range of wind speed in the NSL was greater than that in the CGL. In the spring with the maximum wind speed, the range of diurnal changes of daily average wind speed in NSL was 3.0 m/s, 1.8 m/s in the center of CGL, and 2.0 m/s and 2.2 m/s at the east and west boundary of the CGL, respectively. Obviously, the wind speed changed most drastically in the NSL, especially in the daytime. With the influence of solar radiation after sunrise, the wind speed started to increase quickly. In the afternoon, due to the difference in ground and air temperature, the turbulence increased, and the wind speed reached extreme highs. The CGL was affected by ground vegetation, and the wind speed was significantly lower than that of the NSL. The wind speed in the boundary area of the CGL was higher than that in the center area of the CGL. Obviously, the wind speed tended to decrease with the increase in the thickness of ground vegetation.
Therefore, the decreasing rate of wind speed due to the influence of vegetation in the windy season could be analyzed through the refined observation data of different underlying surfaces, and the decreasing rate of wind speed between the boundary of the CGL and the central area of the CGL could be compared at the same time. As shown in
Figure 9, in spring, if the average wind speed of the NSL was quantified as 1.0 m/s, the average wind speed at the boundary of the CGL was 0.7 m/s, and the wind speed lapse rate reached 35%. Similarly, in the central area of CGL, the average wind speed was 0.3 m/s, and the wind speed lapse rate reached 68%. In summer, if the average wind speed of the NSL was quantified as 1.0 m/s, the average wind speed at the boundary of the CGL was 0.7 m/s, and the wind speed lapse rate reached 30%. Similarly, in the central area of CGL, the average wind speed was 0.3 m/s, and the wind speed lapse rate reached 71%. In spring and summer, with the growth of vegetation, the vegetation coverage of the CGL increased so that the aerodynamic roughness increased and the wind speed further decreased. The wind speed lapse rate of the transition boundary between the NSL and CGL changed little in spring and summer. The wind speed lapse rate at the CGL boundary was basically maintained at 30%, and the wind speed lapse rate in the central area of the CGL was basically maintained at 70%. In summer, when vegetation was abundant, the declining rate of wind speed increased slightly. Due to the change in the underlying surface, the wind speed of the desert green space microclimate decreased significantly, and the wind speed reduction effect in the central area of the CGL was slightly stronger than that in the CGL boundary.
3.5. Specific Humidity Characteristics
As shown in
Figure 10, in both the NSL and the CGL, the specific humidity was the largest in summer, followed by autumn, spring, and winter. Due to the extreme drought in the hinterland of the Taklimakan Desert, precipitation could be negligible. According to the climate background data of the Tazhong Meteorological Station mentioned above, in winter, there was no precipitation in January, slight precipitation in April, 2.4 mm precipitation in July and 0.0 mm precipitation in September. Therefore, the precipitation in July had an effect on the specific humidity in summer, and the effect in other months was low. In summer and autumn, the specific humidity was larger and had obvious diurnal changes, which clearly highlighted the effect of the CGL. The average specific humidity of the NSL was 0.06 g/kg in July, 0.03 g/kg in September, 0.02 g/kg in April, and 0.01 g/kg in January. The CGL (middle) had an average specific humidity of 0.05 g/kg in the summer of July, 0.03 g/kg in September, 0.01 g/kg in April, and 0.01 g/kg in January.
For both the NSL and the CGL, the diurnal fluctuation of specific humidity in summer was the most significant and had the largest amplitude. The specific humidity of the NSL reached a peak value of 0.064 g/kg at 06:00 and a minimum value of 0.049 g/kg at 16:00. The specific humidity of the CGL (middle) reached a peak value of 0.071 g/kg at 09:00 in the morning and a minimum value of 0.029 g/kg at 16:00. Obviously, the time when the specific humidity of the NSL reached the maximum value was significantly 3 h earlier than that of the CGL. The decreasing period of specific humidity in the NSL from maximum to minimum was the longest. During the day, the surface temperature gradually decreased, and the specific humidity began to increase. Although the area of the CGL in the study area was only approximately 2 km
2, the specific humidity of the CGL (middle) was greater than that of the natural sand land from 07:00 to 10:00 after sunrise, and from 15:00 to 11:00 (the next day), the specific humidity of the CGL (middle) was larger than that at the boundary of the CGL (east and west), which conformed to the characteristics of the wet island effect described by Zhang and Hu [
29]. The diurnal variation in specific humidity in autumn with good vegetation was basically consistent with that in summer, but the threshold of the specific humidity interval was significantly lower than that in summer. In the NSL, the daily average specific humidity was 0.055 g/kg in summer and 0.033 g/kg in autumn. Similarly, in the CGL (middle), the daily average specific humidity was 0.046 g/kg in summer and 0.032 g/kg in autumn. The specific humidity in spring was greater than that in winter, and in winter from 20:00 to 09:00 the next morning, the specific humidity of the CGL (middle) was greater than that of natural sand, and from 12:00 to 19:00, the specific humidity was lower than that of the NSL.
To more accurately represent the CGL humidity variation characteristics in the Taklimakan Desert, the wet island effect of the CGL in the desert area was analyzed through the diurnal variation rate between the CGL (middle) and the NSL, CGL (middle) and CGL (east and west) boundaries. In summer, the specific humidity reached its peak; in the initial decreasing period of 7:00–10:00, Δq (the humidity difference between middle of CGL and NSL) was positive, and at 09:00, Δq was the largest, and the wet island effect lasted for 3 h. In autumn, from 22:00 to 11:00, Δq was positive, and the wet island effect lasted for 14 h. The variation range of daytime temperature in summer was obviously larger than that in autumn, and the evaporation capacity was strong. The temperature threshold range in autumn was obviously lower than that in summer, and the moisture condensation process near the surface was obviously longer than that in summer. Therefore, the intensity of the wet island effect was the largest in summer, and the duration of the wet island effect was the longest in autumn. As shown in
Figure 11, in winter from 20:00 to 00:00, Δq (the humidity difference between middle and west of CGL) was positive; in spring, Δq was positive except at 11:00; in summer, Δq was positive except from 12:00–14:00; and in autumn, Δq was positive except at 16:00. The Δq (the humidity difference between middle and east of CGL) was positive in spring, summer and autumn. Therefore, compared with the boundary, the central area of the CGL had an obvious wet island effect. The western boundary was the upstream boundary of the local circulation, and the duration of the wet island effect was short, while the eastern boundary was the downstream boundary of the local circulation, and the duration of the wet island effect was long. Of course, the vegetation coverage in the central area of the CGL was obviously greater than that in the boundary area. In the daytime, the transpiration of vegetation in the central area was greater than that in the boundary area. At night, because the air was in a stable state, the water vapor near the ground did not easily diffuse after condensation, so the specific humidity at night was greater than that in the daytime.
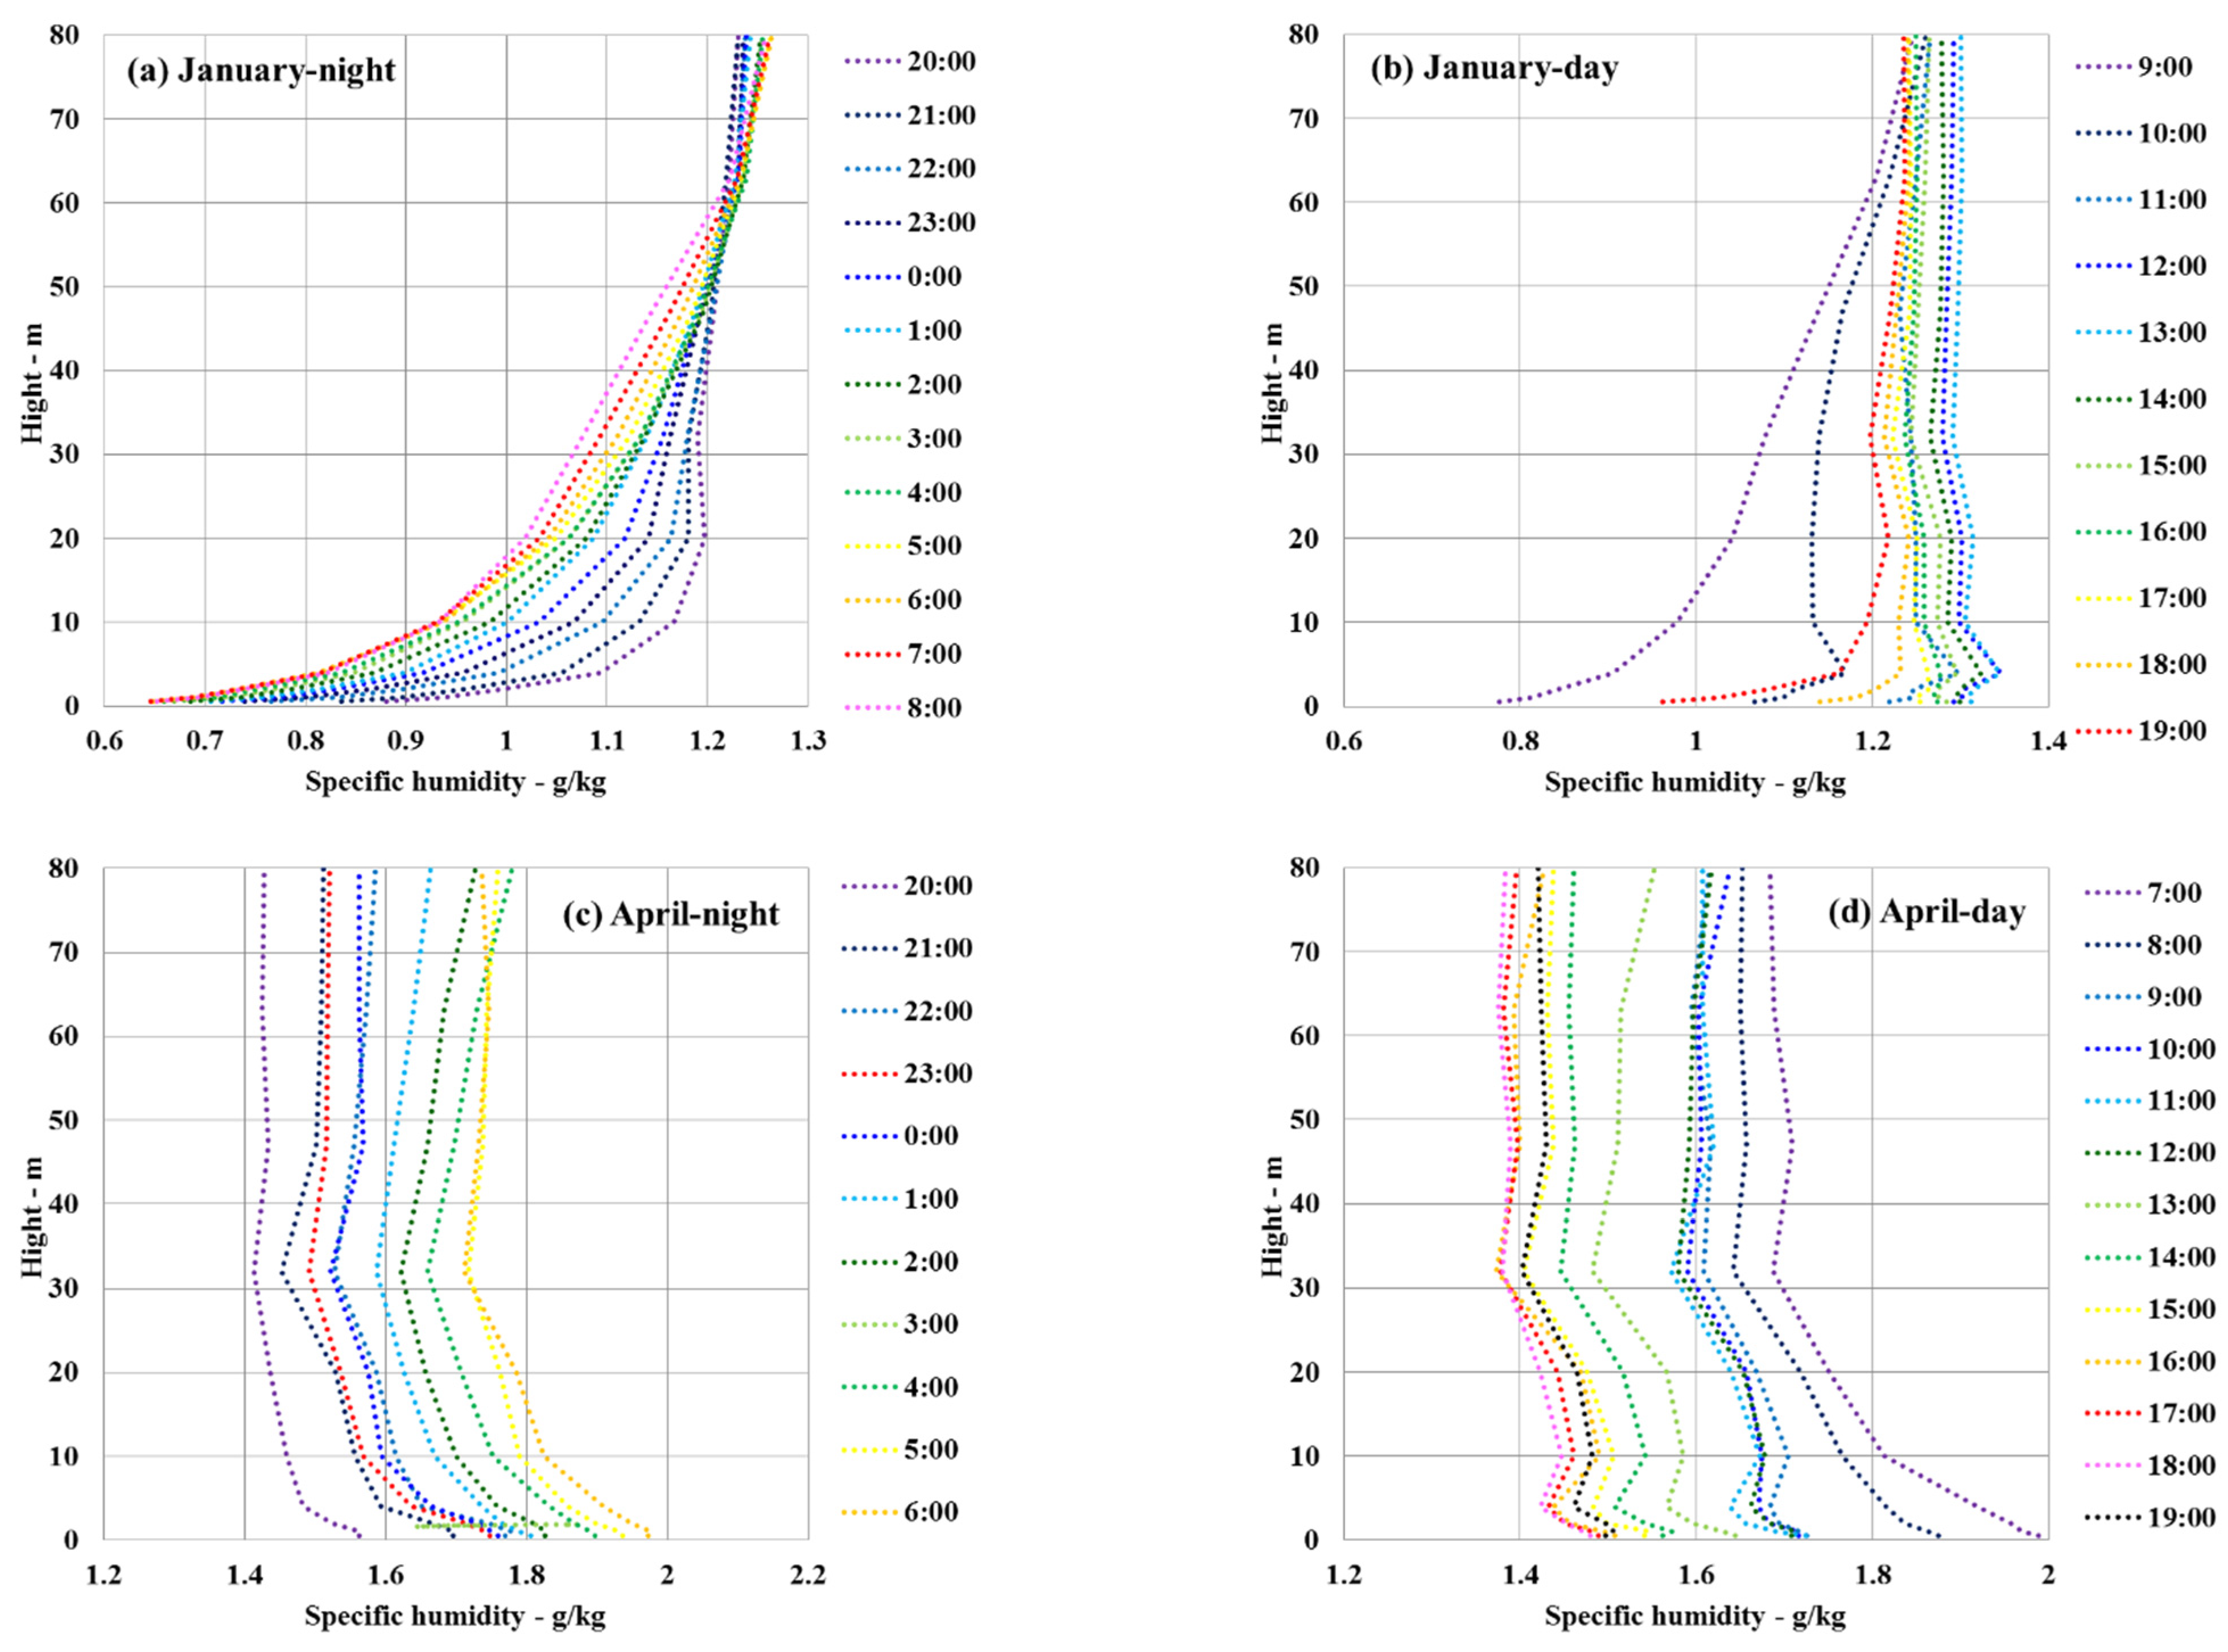
To better explain the phenomenon that the specific humidity at night was greater than that during the day, the 80 m gradient observation data were used to further analyze the change in humidity with height. As shown in
Figure 12, the specific humidity of July and September in summer and autumn with relatively lush vegetation was greater than that of winter and spring overall. The threshold interval of specific humidity was 3–9 g/kg in summer, 2–4 g/kg in autumn, 0–2 g/kg in spring, and 0–1.5 g/kg in winter. The summer specific humidity interval was obviously affected by the underlying surface vegetation, and the specific humidity threshold interval of the vegetation growing season was obviously greater than that of the nongrowing season. The specific humidity of the air above the ground in the lower layer was obviously greater than that in the upper layer. Apart from the normal specific humidity changes with height, the moisture storage function of vegetation itself could not be ignored. From the daytime and night humidity profiles in January, April, July, and September, it was found that in January, the phenomenon of inverse humidity was obvious at night and during the day during all periods except for the period from 13:00 to 17:00. Slight inverse humidity appeared at 15:00 in summer, and at 14:00 and 16:00, slight inverse humidity appeared from the ground to a height of 32 m. At 16:00 in autumn, there was a slight inverse humidity from the ground to a height of 10 m. At 12:00 in spring, there was a slight inverse humidity from the ground to a height of 10 m. This phenomenon proved that the wet island effect on the western boundary of green space appeared at different times in the four seasons.
4. Discussion
China has been under the attack of wind and sand for years, and the government has attached great importance to it and has implemented great desert control practices, especially since the beginning of the 21st century. Ecological protection has been highly emphasized in China. However, detailed studies on the vegetation dynamics of all deserts in China and the extent to which they are affected by climatic factors and human activities are still lacking [
30]. Therefore, it is necessary to carry out scientific experiments and continuously focus on the problem of CGL in desert areas, which is of great significance to the sustainable development of the desert and its surrounding oases.
Temperature, wind speed, and humidity are the most important meteorological factors when characterizing microclimates. Each single meteorological factor has a regular conclusion, but inevitable connections exist between different meteorological factors. In addition to the main factor of solar radiation, temperature change is affected by humidity. Due to the various surface heat capacities of different underlying surfaces, the heat absorption in the process of liquid water turning to a gaseous state will inevitably change the trend of temperature. Therefore, the physical properties of vegetation, plant transpiration and surface water evaporation jointly affect the humidity variation, thereby influencing the temperature variation. In fact, changes in temperature are due to complex interactions between multiple factors. Except for the heat capacity of the NSL in the daytime being lower than that of the CGL, the underlying surface of sand grains is smoother under the effect of wind erosion, and the warming of the NSL is faster than that of the CGL under the influence of solar radiation. The heated warm air over the NSL at night is transported to the CGL through the local circulation effect (the effect of local wind circulation), forming an inversion layer with hot upper and cold lower layers and keeping the cooler air below stable. As a result, a cooler and more humid microclimate than that of the NSL is formed, which is actually the microclimate effect of the CGL (
Figure 13). Oasis-desert interactions lead to a series of microclimate effects, including the oasis cold-wet island effect, air humidity inversion effect within the surrounding desert and oasis wind shield effect, which are important for the stability and sustainability of the oasis–desert ecosystem [
31].
5. Conclusions
The Taklimakan Desert is one of the most typical mobile deserts in the world. In the desert, with the improvement of human living conditions, the nature of the local underlying surface has been changed, and the area of artificial green space has been increasing. With the changing underlying surface pattern, a unique local desert microclimate has been produced. This paper analyzed the artificial green space in the hinterland of the desert from the perspective of observed facts. The results are as follows.
At night, the temperature of the CGL was higher than that of the NSL. In the daytime, before the temperature reached its peak, the temperature of the NSL was higher than that of the CGL. After the peak, the temperature of the NSL was lower than that of the CGL. The diurnal temperature range in the center of CGL was the largest, followed by that in the NSL. The diurnal temperature ranges in the west and east boundaries of the CGL were the smallest. In seasons with sparse vegetation or no vegetation, the NSL had the lowest night temperature, followed by the CGL, which was mainly affected by low terrain. In the lush vegetation season, the CGL had the lowest night temperature, followed by the NSL. The CGL was affected by both the cold island effect and the low terrain. Therefore, it was concluded that the impact of the microclimate effect on the CGL was much greater than that of the low terrain effect.
The period of continuous decrease in the warming rate of the CGL was very stable, which was 6 h in all four seasons. Stability also existed in the period length of the continuous increase in the warming rate of the growing season, that is, 3 h in all seasons. The variation range of the maximum increasing rate in all seasons was small. In the NSL, the scope of the maximum warming rate fluctuated over a large range except in winter, when a relatively stable maximum warming period lasted for 2 h. There were obvious temperature inversions at night in all seasons. The intensity of the temperature inversion was greatest in winter. The maximum temperature inversion difference could reach 12.8 °C at 3:00 in January, followed by autumn, and third in spring. The stable period of temperature inversion was short. In July, the temperature inversion difference was the smallest, and the maximum temperature inversion difference was 6.4 °C. The temperature inversion fluctuated greatly, and there was no stable period.
During the windy seasons in spring and summer, the wind speed of the microclimate in the desert green space decreased significantly, and the wind speed decline rate in the core area of the CGL was higher than that in the boundary area. In spring and summer, with vegetation growth, the vegetation coverage of the CGL increased, leading to the aerodynamic roughness increasing and the wind speed decreasing more significantly. Compared with the boundary, the central area of the CGL had an obvious wet island effect. The western boundary was the upstream boundary of the local circulation, and the duration of the wet island effect was short, while the eastern boundary was the downstream boundary of the local circulation, and the duration of the wet island effect was long. It was obvious that the vegetation coverage in the central area of CGL was greater than that in the boundary area. In the daytime, the transpiration of vegetation in the central area was greater than the boundary. At night, because the air was in a stable state, the water vapor near the ground did not easily diffuse after condensation, so the specific humidity at night was greater than that in the daytime.
The average wind speed was highest in spring, second in summer, third in autumn and lowest in winter. The average wind speed in the daytime was higher than that at night. The turbulence in the daytime was intense, and the air temperature changed drastically. The wind speed was high and tended to be stable at night. The temperature inversion was strong, and the wind speed was low. The variation range of wind speed in the NSL was larger than that in the CGL. In the spring, when the wind speed was highest, the daily average wind speed difference was 3 m/s in the NSL, 1.8 m/s at the center of the CGL, and 2.0 m/s and 2.2 m/s at the east–west boundary of the CGL. If the average wind speed of the NSL was quantified as 1 m/s, the average wind speed of the CGL boundary in spring was 0.65 m/s, and the decreasing rate of wind speed reached 35%; if the average wind speed in the center of the CGL was 0.32 m/s, the decreasing rate of wind speed reached 68%. In summer, the average wind speed at the boundary of the CGL was 0.70 m/s, and the decreasing rate of wind speed reached 30%; if the average wind speed in the central area of the CGL was 0.29 m/s, the decreasing rate of wind speed reached 71%.
The specific humidity of the NSL reached a peak value of 0.064 g/kg at 06:00 and a minimum value of 0.049 g/kg at 16:00. Taking the CGL (middle) as an example, the specific humidity reached a peak value of 0.071 g/kg at 09:00 and a minimum value of 0.029 g/kg at 16:00. The specific humidity of the NSL reached the maximum value 3 h earlier than that of the CGL. The decreasing period of specific humidity in the NSL from maximum to minimum was the longest. In January, humidity inversion was obvious at night and during the day. Except for the period from 13:00 to 17:00, all other periods showed inversion. Slight humidity inversion appeared at 15:00 in summer and appeared from the surface to a height of 32 m at 14:00 and 16:00. At 16:00 in autumn, there was a slight humidity inversion from the surface to a height of 10 m. A slight humidity inversion appeared from the surface to a height of 10 m at 12:00 in spring.


 ,
, 


