
Development and Simulation of Cyberdisaster Situation Awareness Models


Abstract
:1. Introduction
- The need to develop an effective method of testing a team’s level of awareness regarding disaster response;
- Insufficient data and inaccurate calculation of risk impact values for determining priority actions to deal with disaster risk;
- The conditions of the COVID-19 pandemic disaster resulting in changes in carrying out disaster simulations.
- Provide a situational awareness framework model to be used for tabletop simulation in facing cyberdisaster preparedness if an earthquake occurs and pandemic conditions with ransomware attacks were to occur;
- Introduce a concept of how to prioritise cyberdisaster risk values using the FMEA fuzzy method;
- Assist organizations in planning business continuity in the face of cyberdisasters to improve organizational sustainability.
2. Theoretical Framework
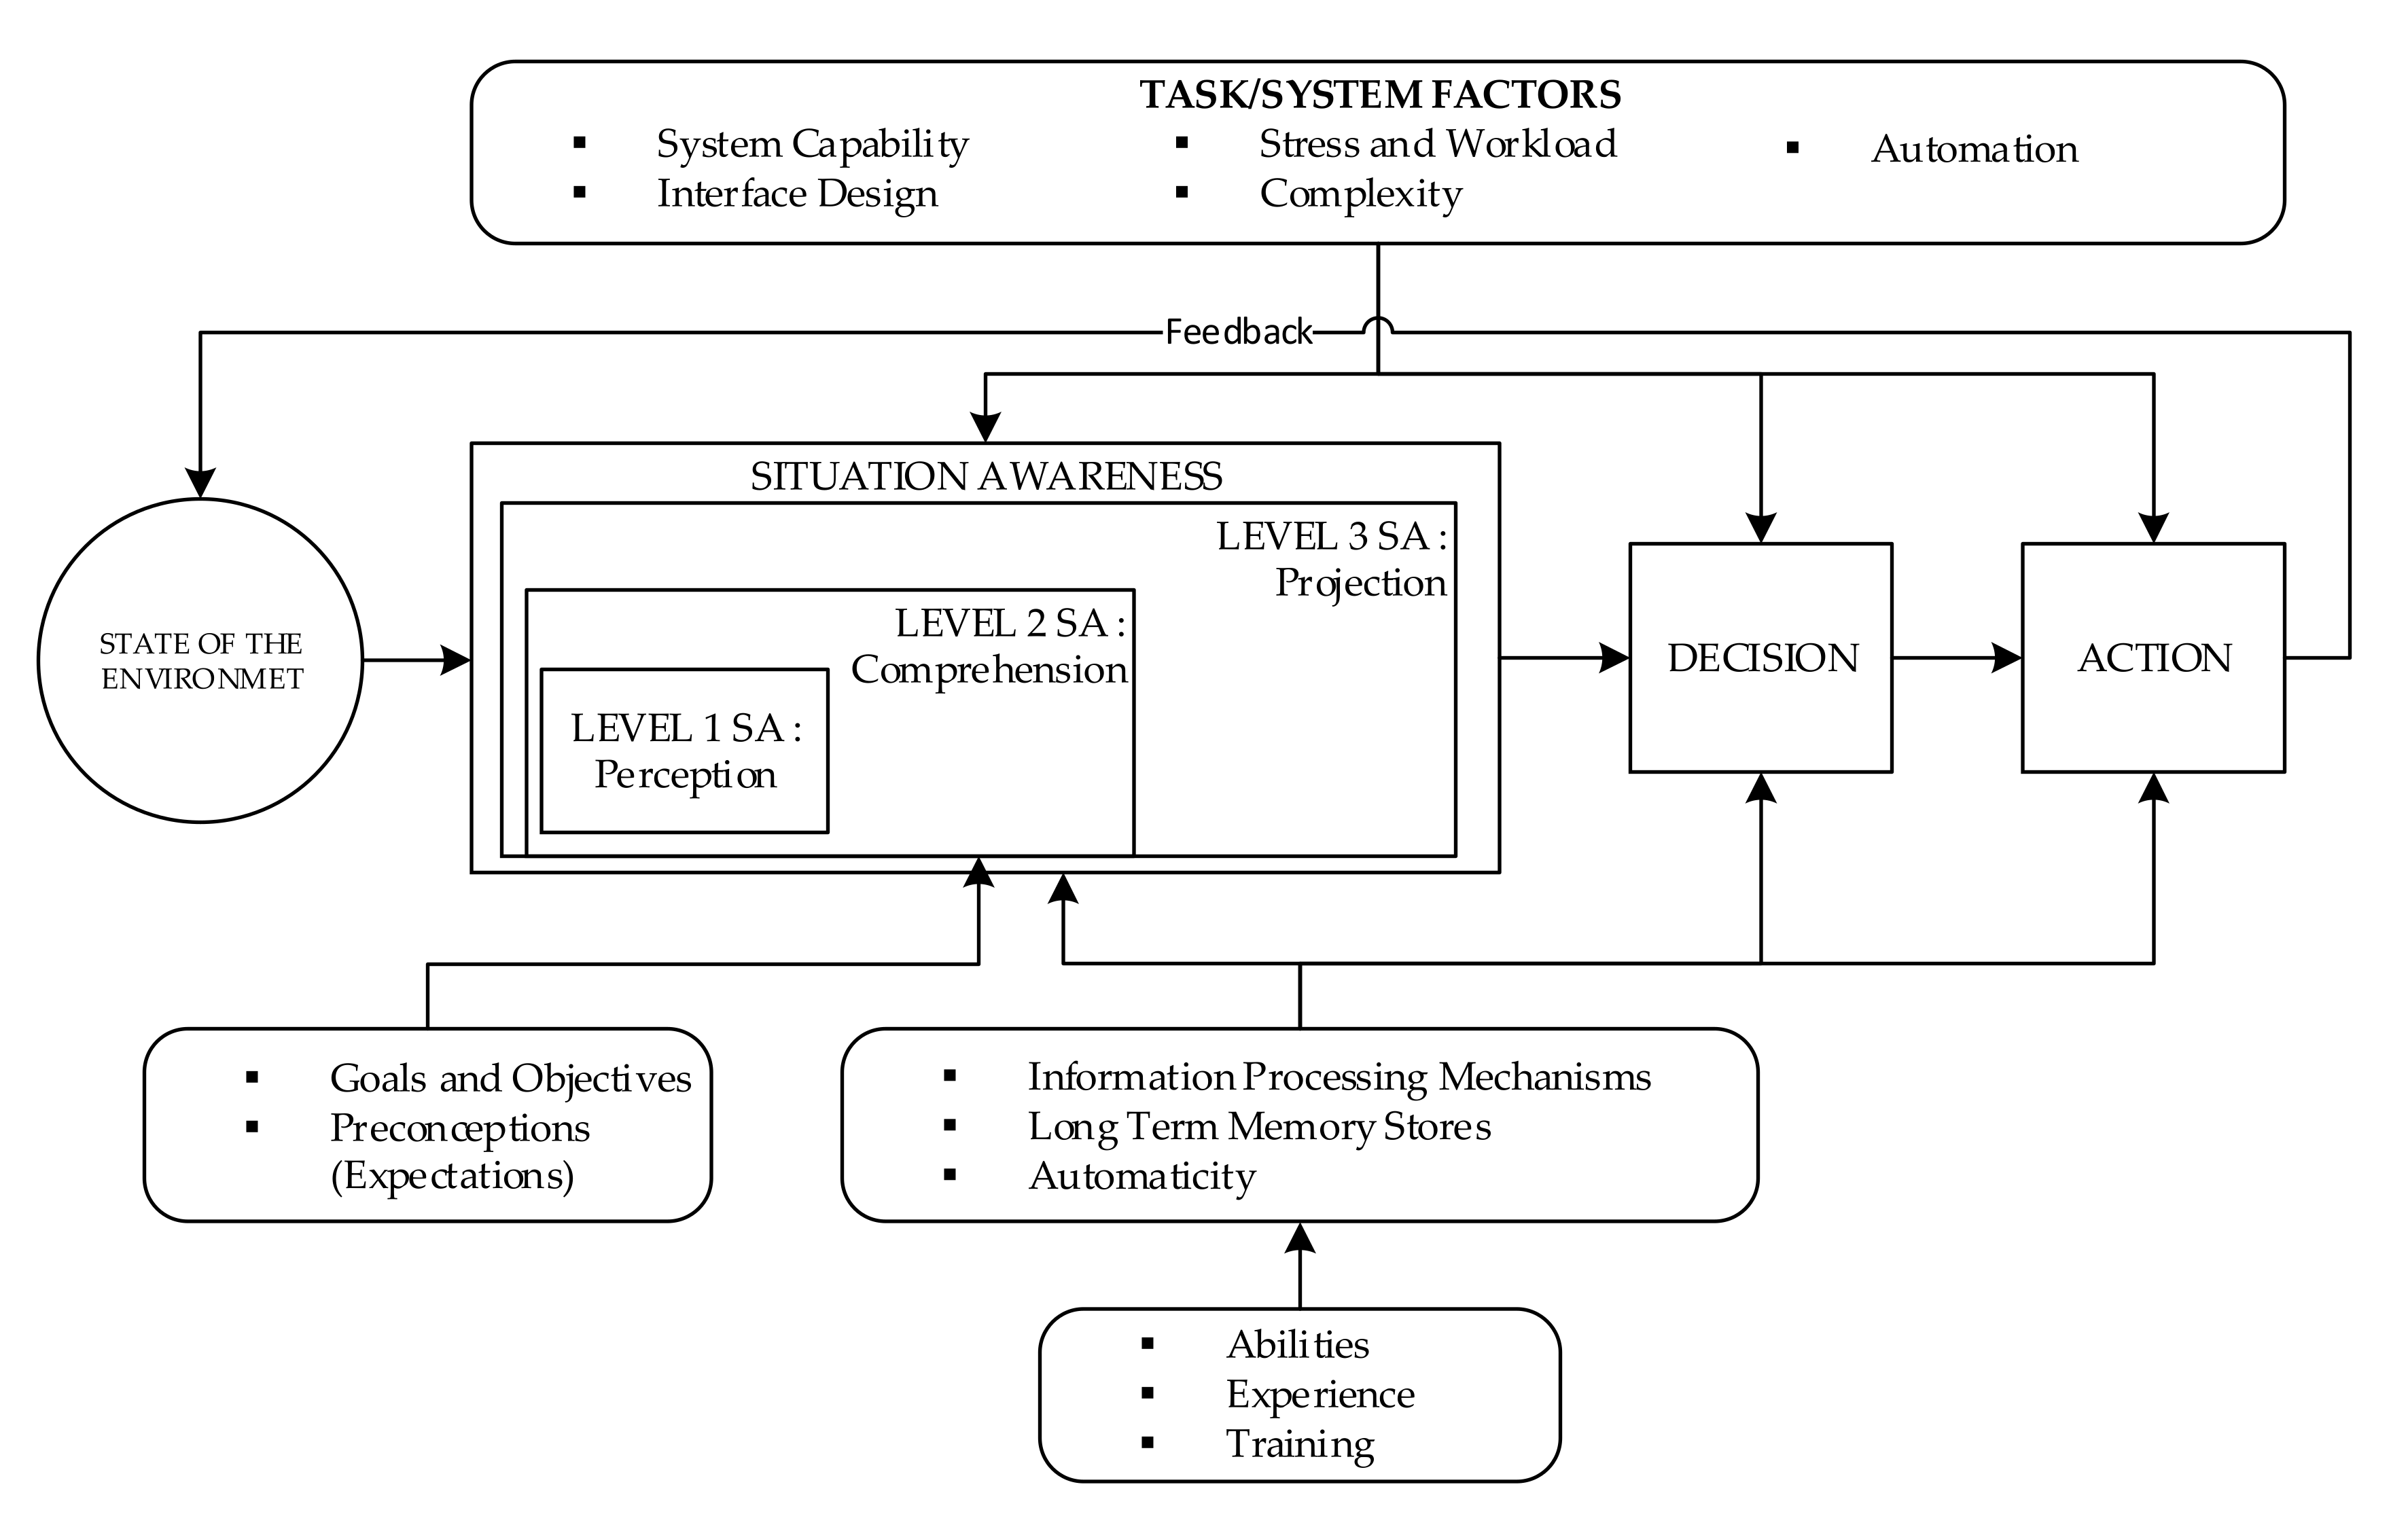
2.1. Risk of Cyber Situation Awareness
- Situation awareness factors;
- Information-processing mechanisms based on one’s ability, experience and training (knowledge); and
- System capabilities, interface design, workload, stress and complexity (system capabilities).
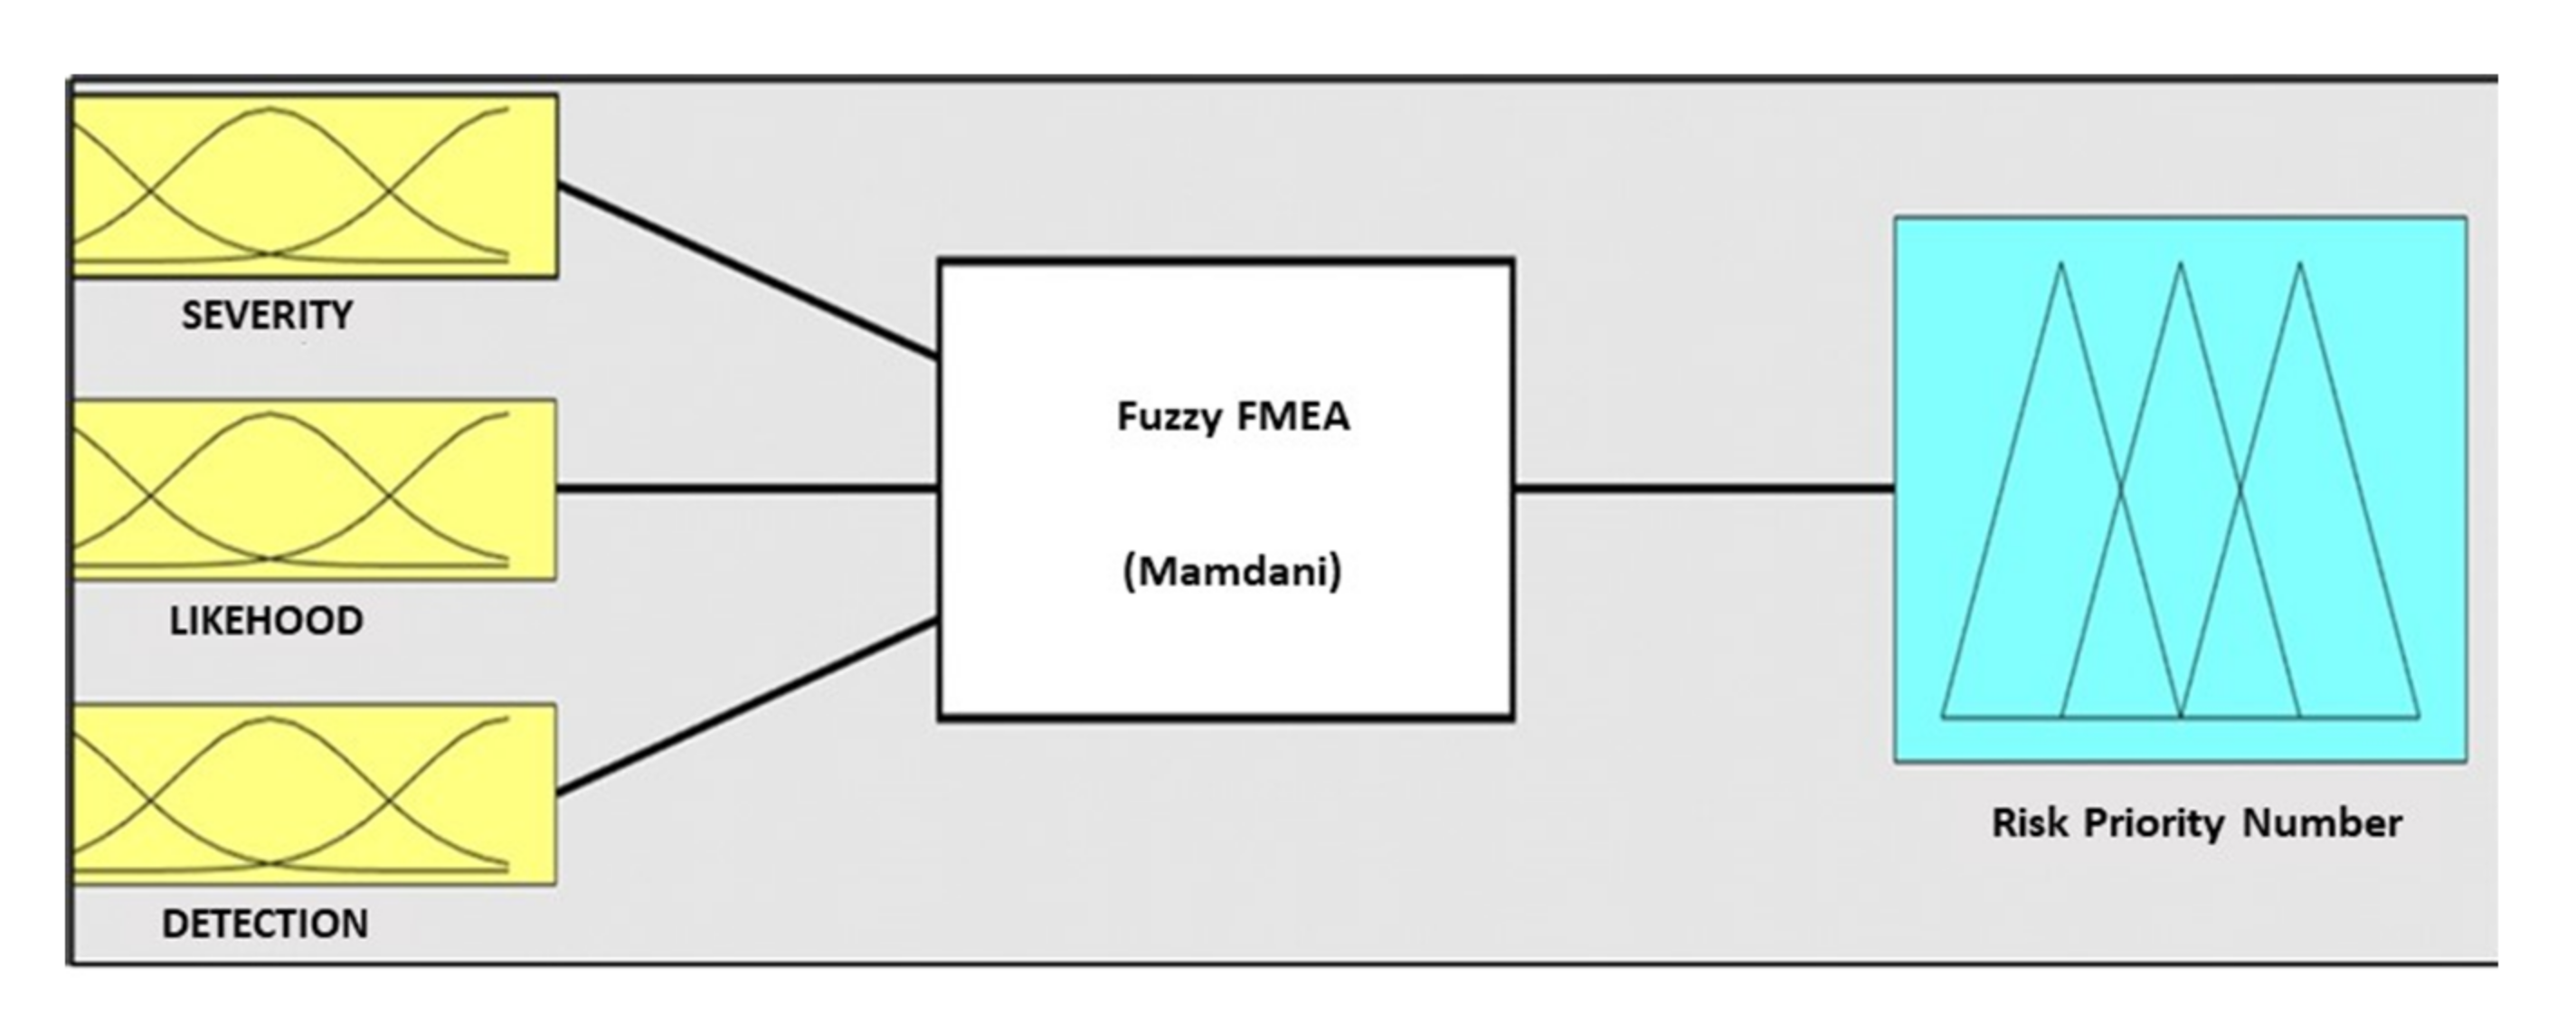
2.2. Fuzzy FMEA
- Fuzzification;
- Establishment of a fuzzy knowledge base (fuzzy rule);
- Implementation of the implication function using a minimum and inter-rule composition using the maximum; and
- Defuzzification using a centroid method with the following equation:
2.3. Disaster Simulation
2.4. Validation Process
- PBc = point-biserial correlation coefficient;
- Mc = average value calculated for true items;
- M = average value of the total value;
- S = standard deviation of the total value; and
- Pc = proportion of respondents who answered and agreed to the items being tested for item validation.
- = Cronbach’s alpha reliability coefficient;
- K = number of questions;
- = variance of the score for each question item;
- = total score variants.
3. Materials and Methods
- Cyberdisaster risk analysis using the FMEA fuzzy method;
- Disaster management scenario;
- Determining disaster management priorities;
- A simulation programme using the tabletop method; and
- Evaluation of the implementation of a simulation using a survey.
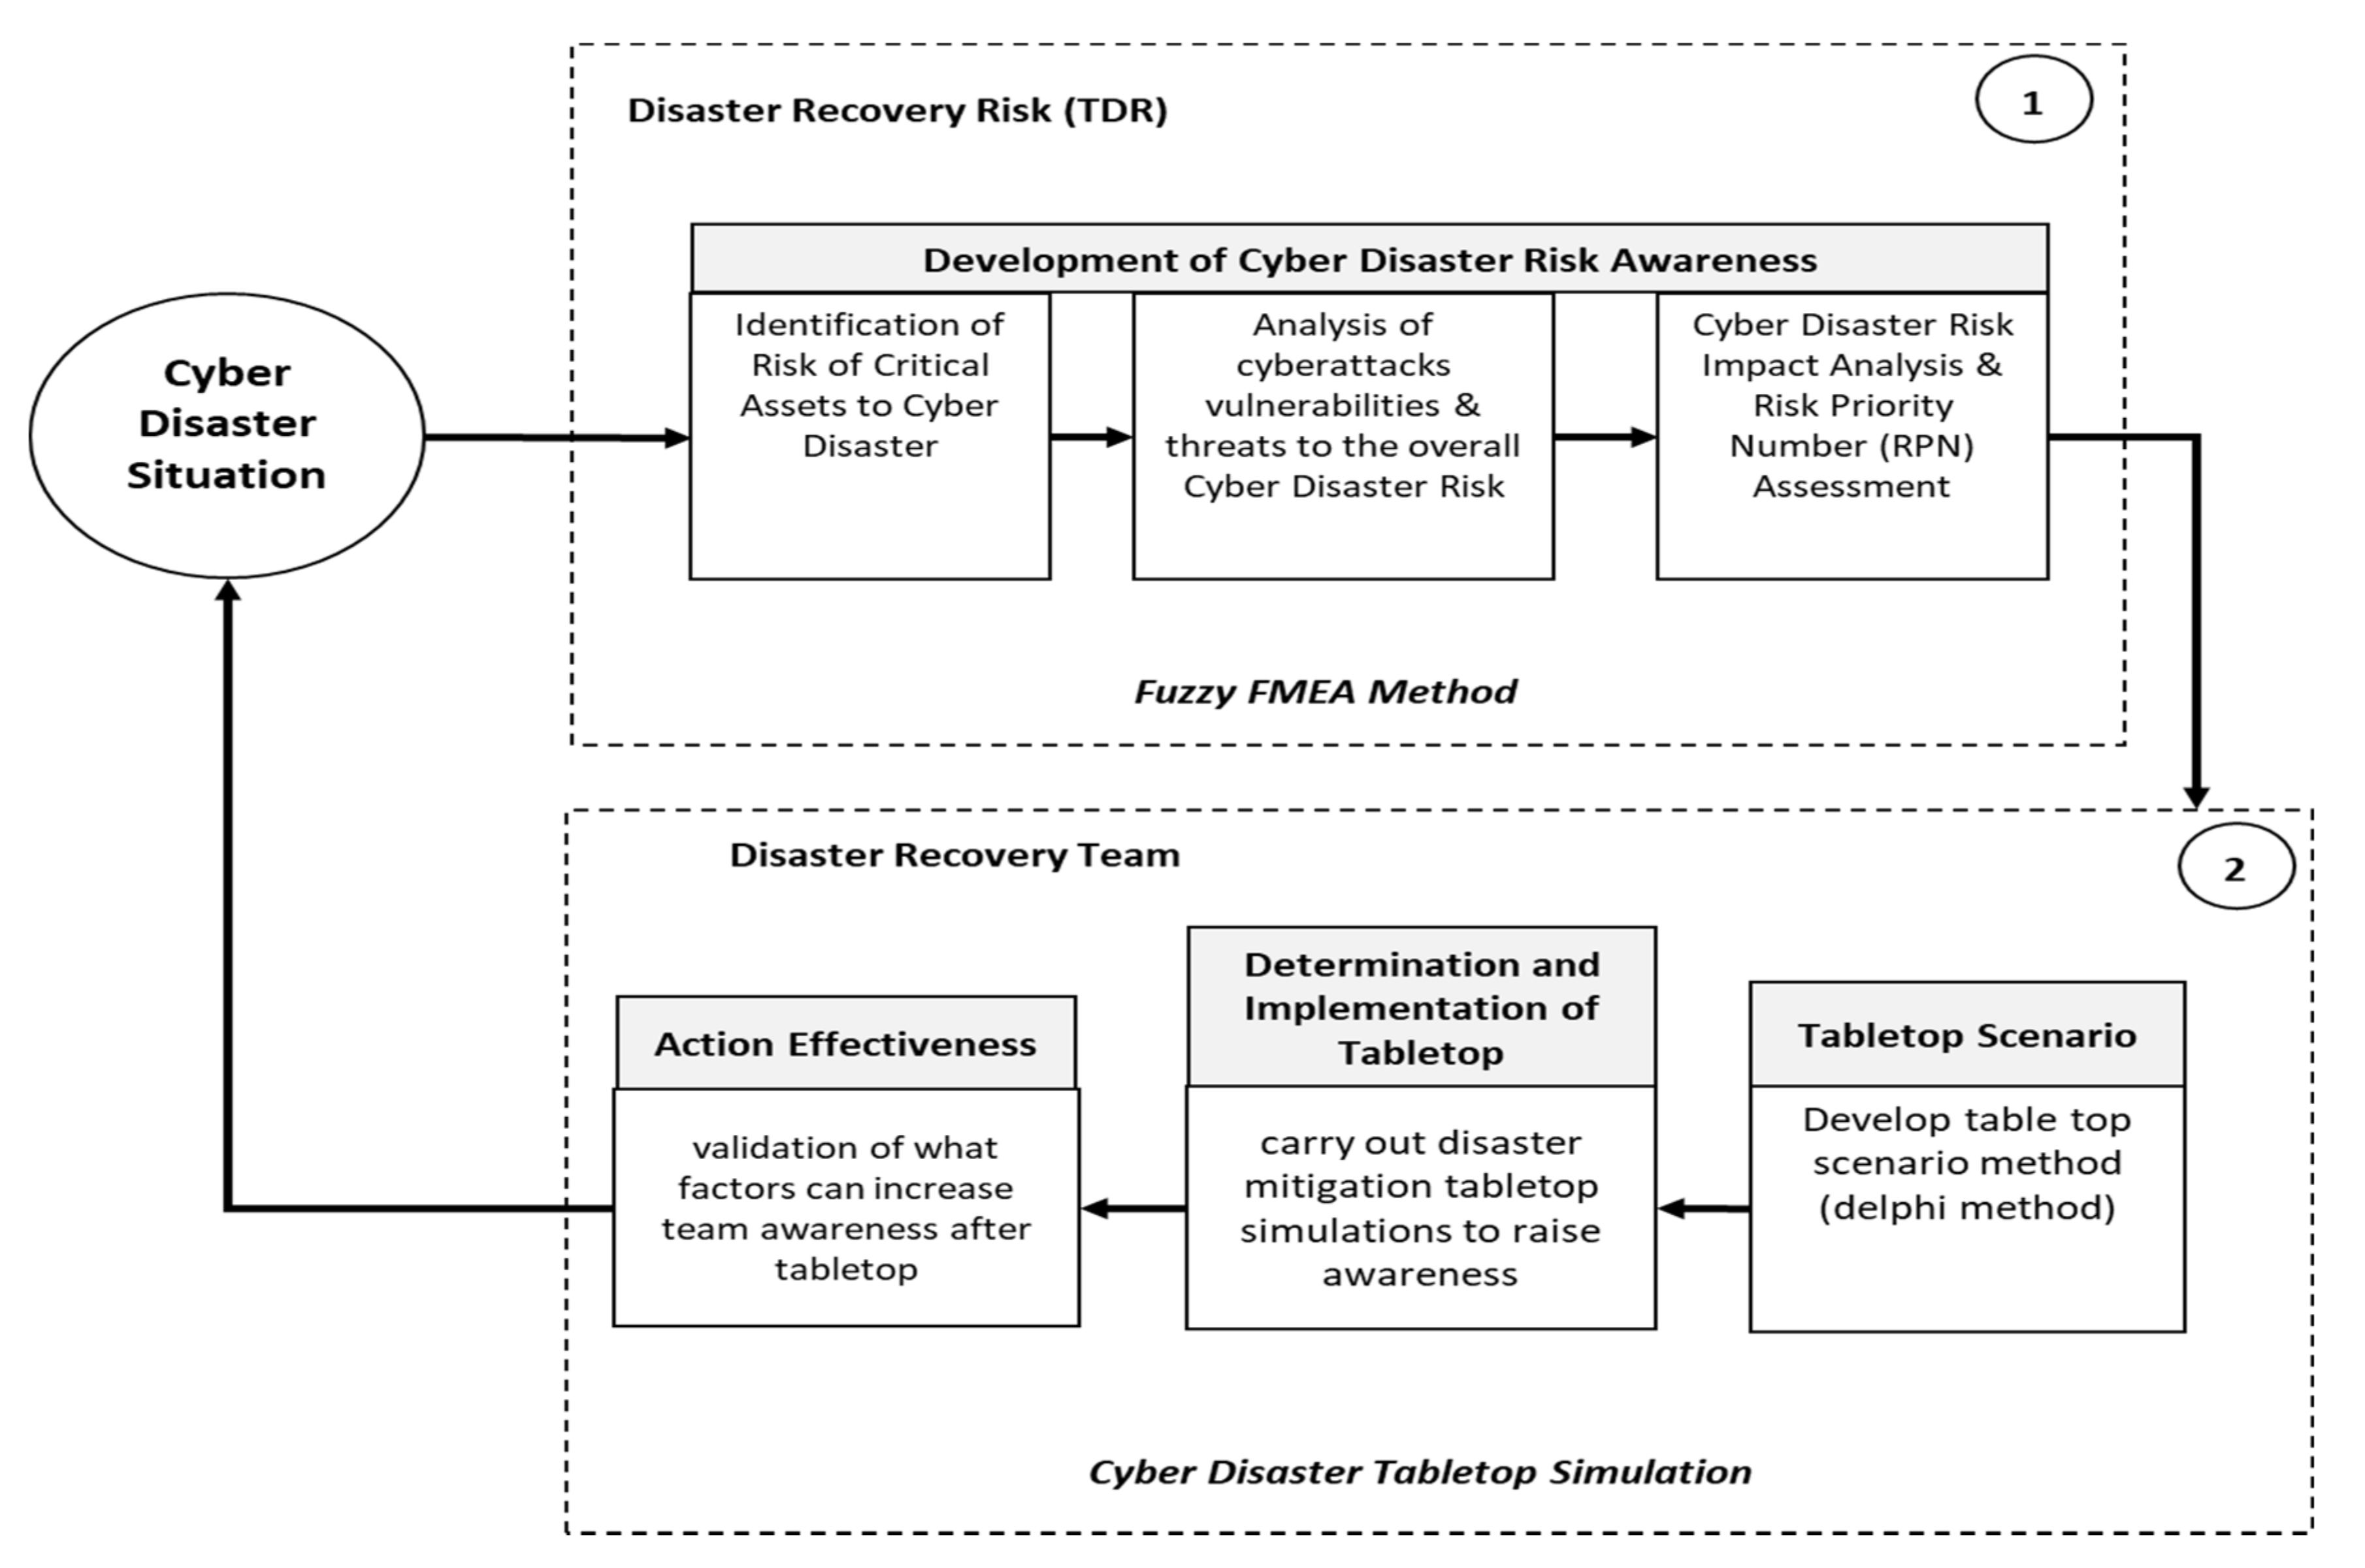
3.1. Development of Cyberdisaster Risk Awareness
- Table 6 presents a definition of a rating scale of likelihood (L), impact (S), ease of detection (D) and risk value and a design of fuzzy membership degrees for likelihood, impact and ease of detection.
- 2.
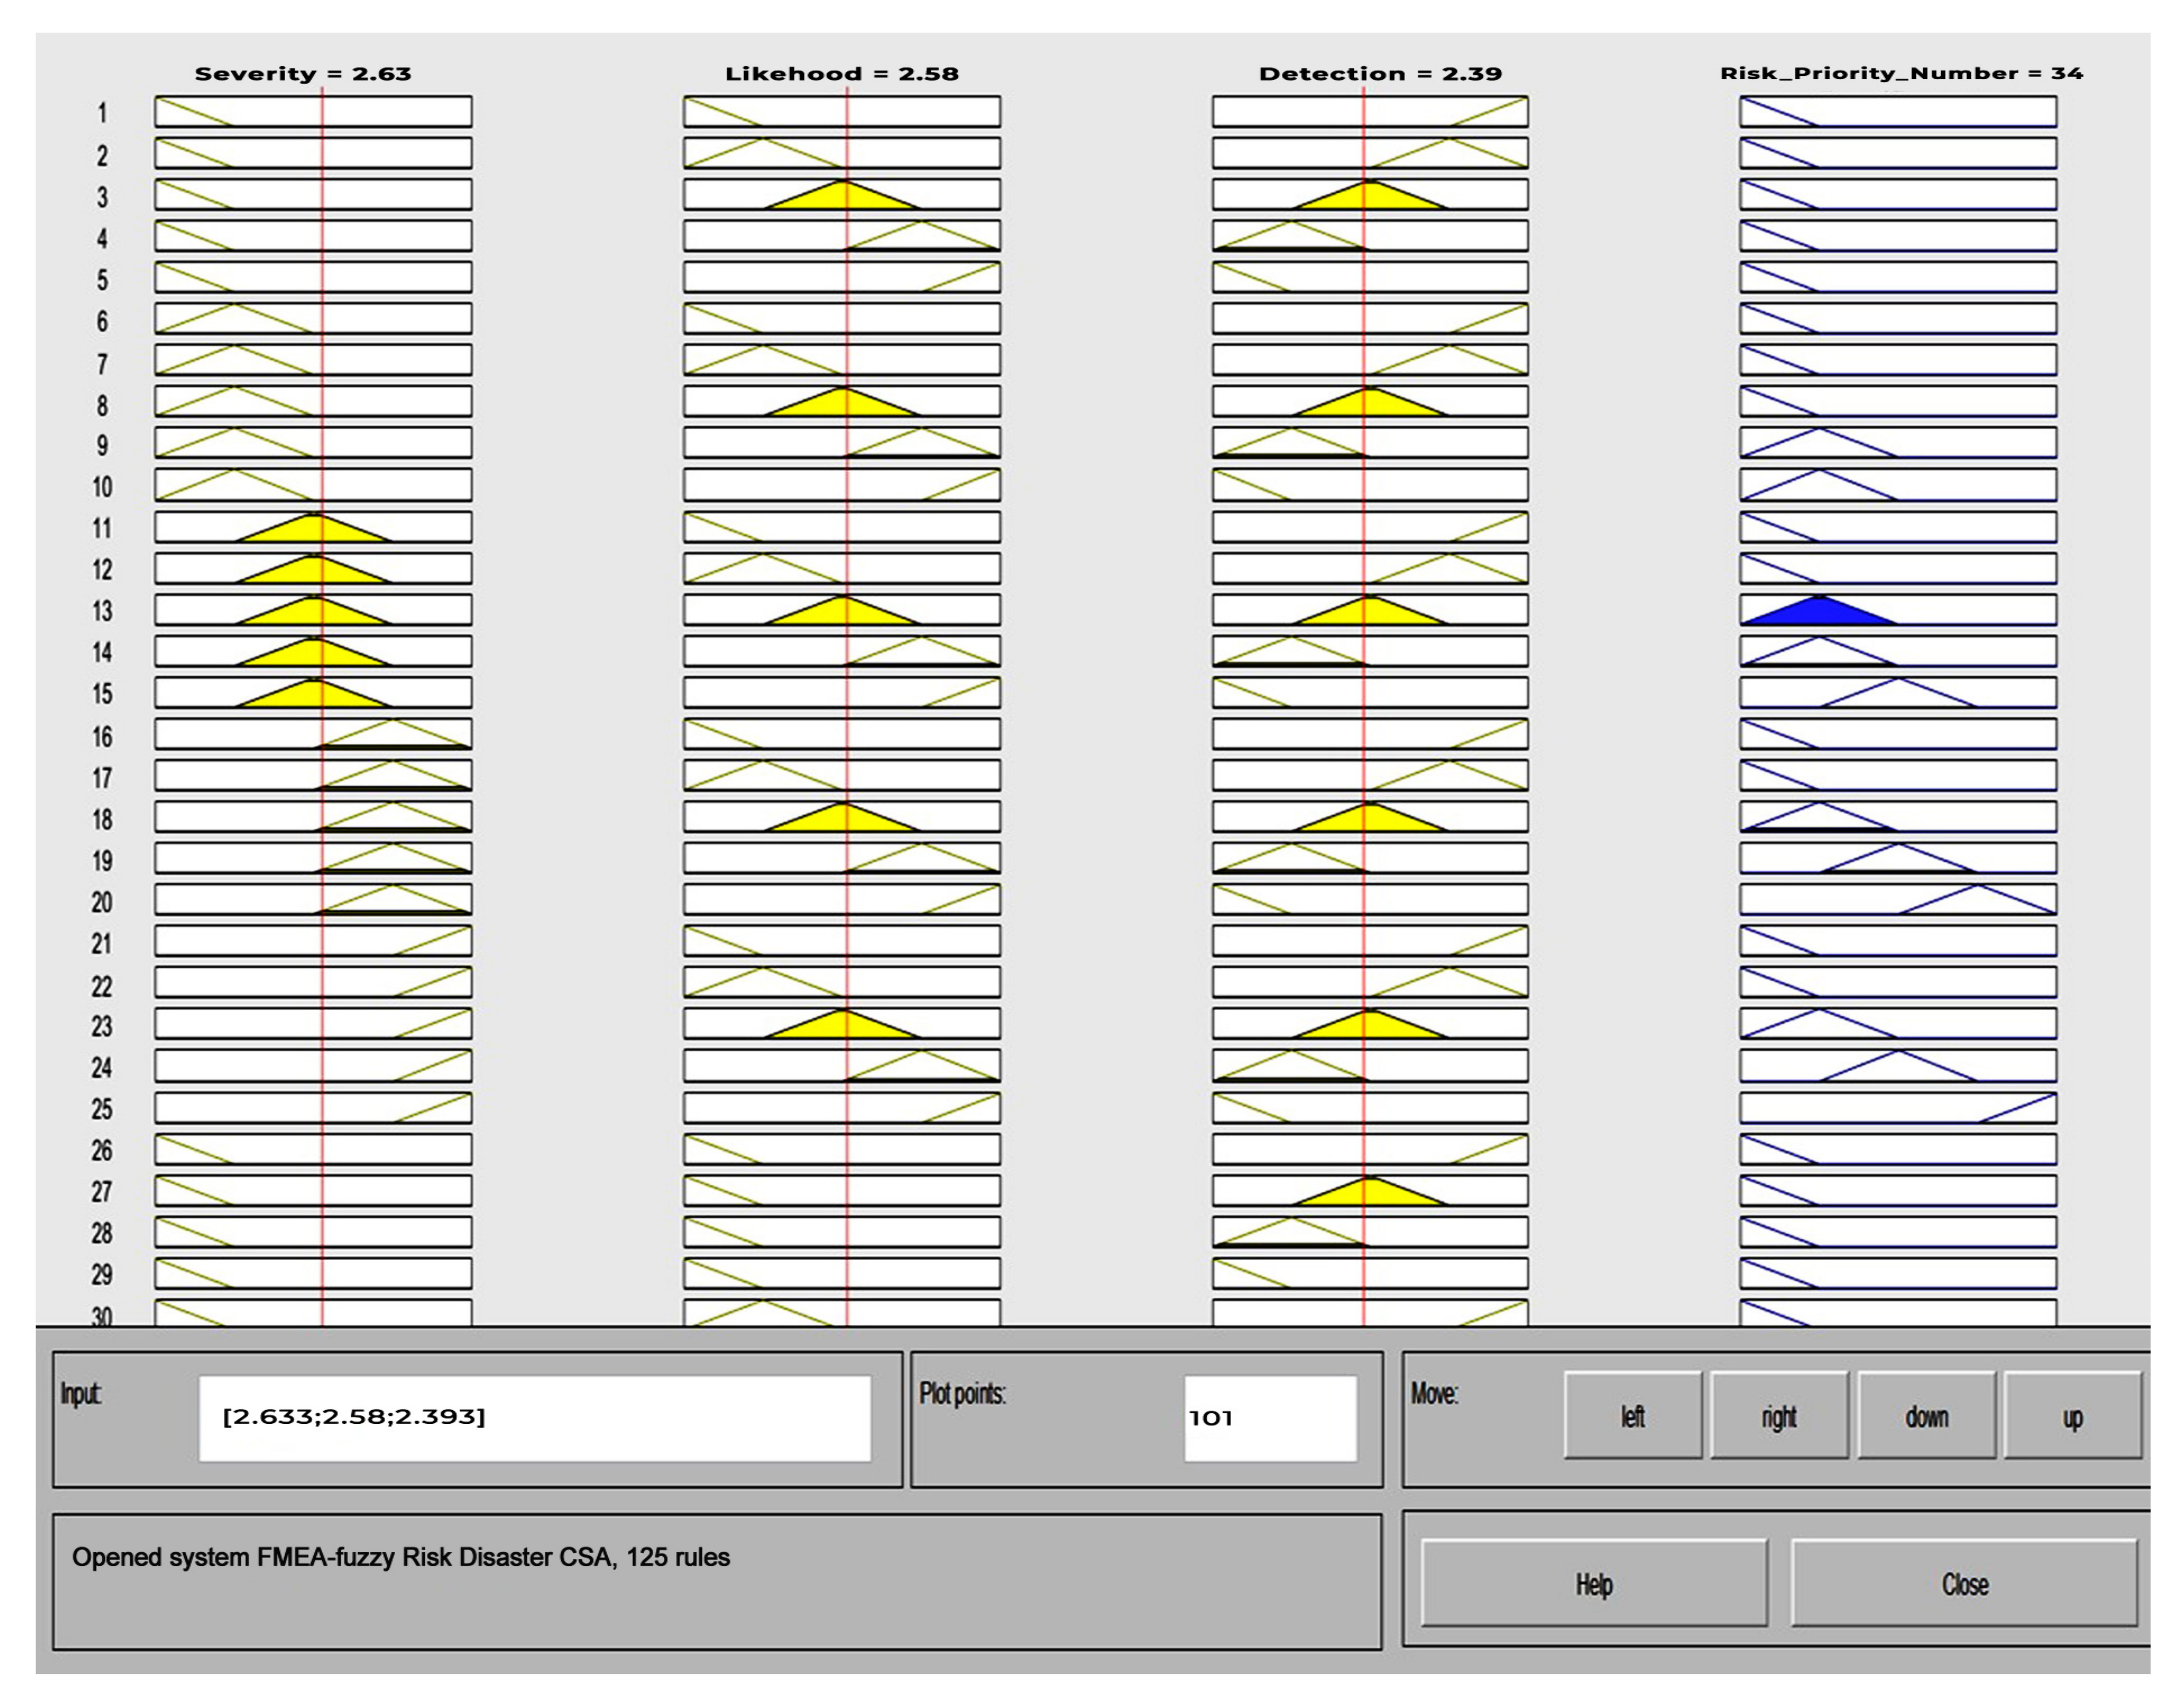
- The fuzzy FMEA rule is carried out by a team of experts or disaster specialists who share their knowledge. MATLAB can be a tool for calculating the RPN output factor value based on the input factor value for multiplying the factors of severity, likelihood and detection. An example of calculating fuzzy FMEA rules is shown in Table 9.
- 3.
- The next stage was to determine the RPN fuzzy FMEA assessment with cases of cyberdisasters during the COVID-19 pandemic in Indonesia. This RPN value was determined using the Delphi method. The results of the RPN fuzzy FMEA analysis are shown in Appendix A Table A1
3.2. Tabletop Simulation
- When a ransomware attack occurs on a user’s computer, it also attacks certain servers, resulting in blocked services and data access to the server that cannot be used. This ransomware attack needs to update the patch immediately. The scenarios carried out temporarily stop activities and inform disaster events, provide quarantine/lockdown on network areas infected with ransomware, disconnect internet connections for data centre servers, activate disaster recovery centres, check for updated data backups and divert service directions directly to data centres.
- If an earthquake occurs, the disaster team will first save itself. Then, it will activate the disaster recovery centre to run the service, check the updated data backup and then divert the direction of the service directly to the data centre.
- Using the Delphi method to gather input from the cyberdisaster recovery team, we designed a questionnaire based on the factors that affect situational awareness.
- Based on the questionnaire, we validated the questionnaire results to determine measurement accuracy.
- We then performed a reliability process to determine the reliability and consistency of the questionnaire as a measuring tool.
4. Results
4.1. Development of a Survey Questionnaire for Simulation Evaluation
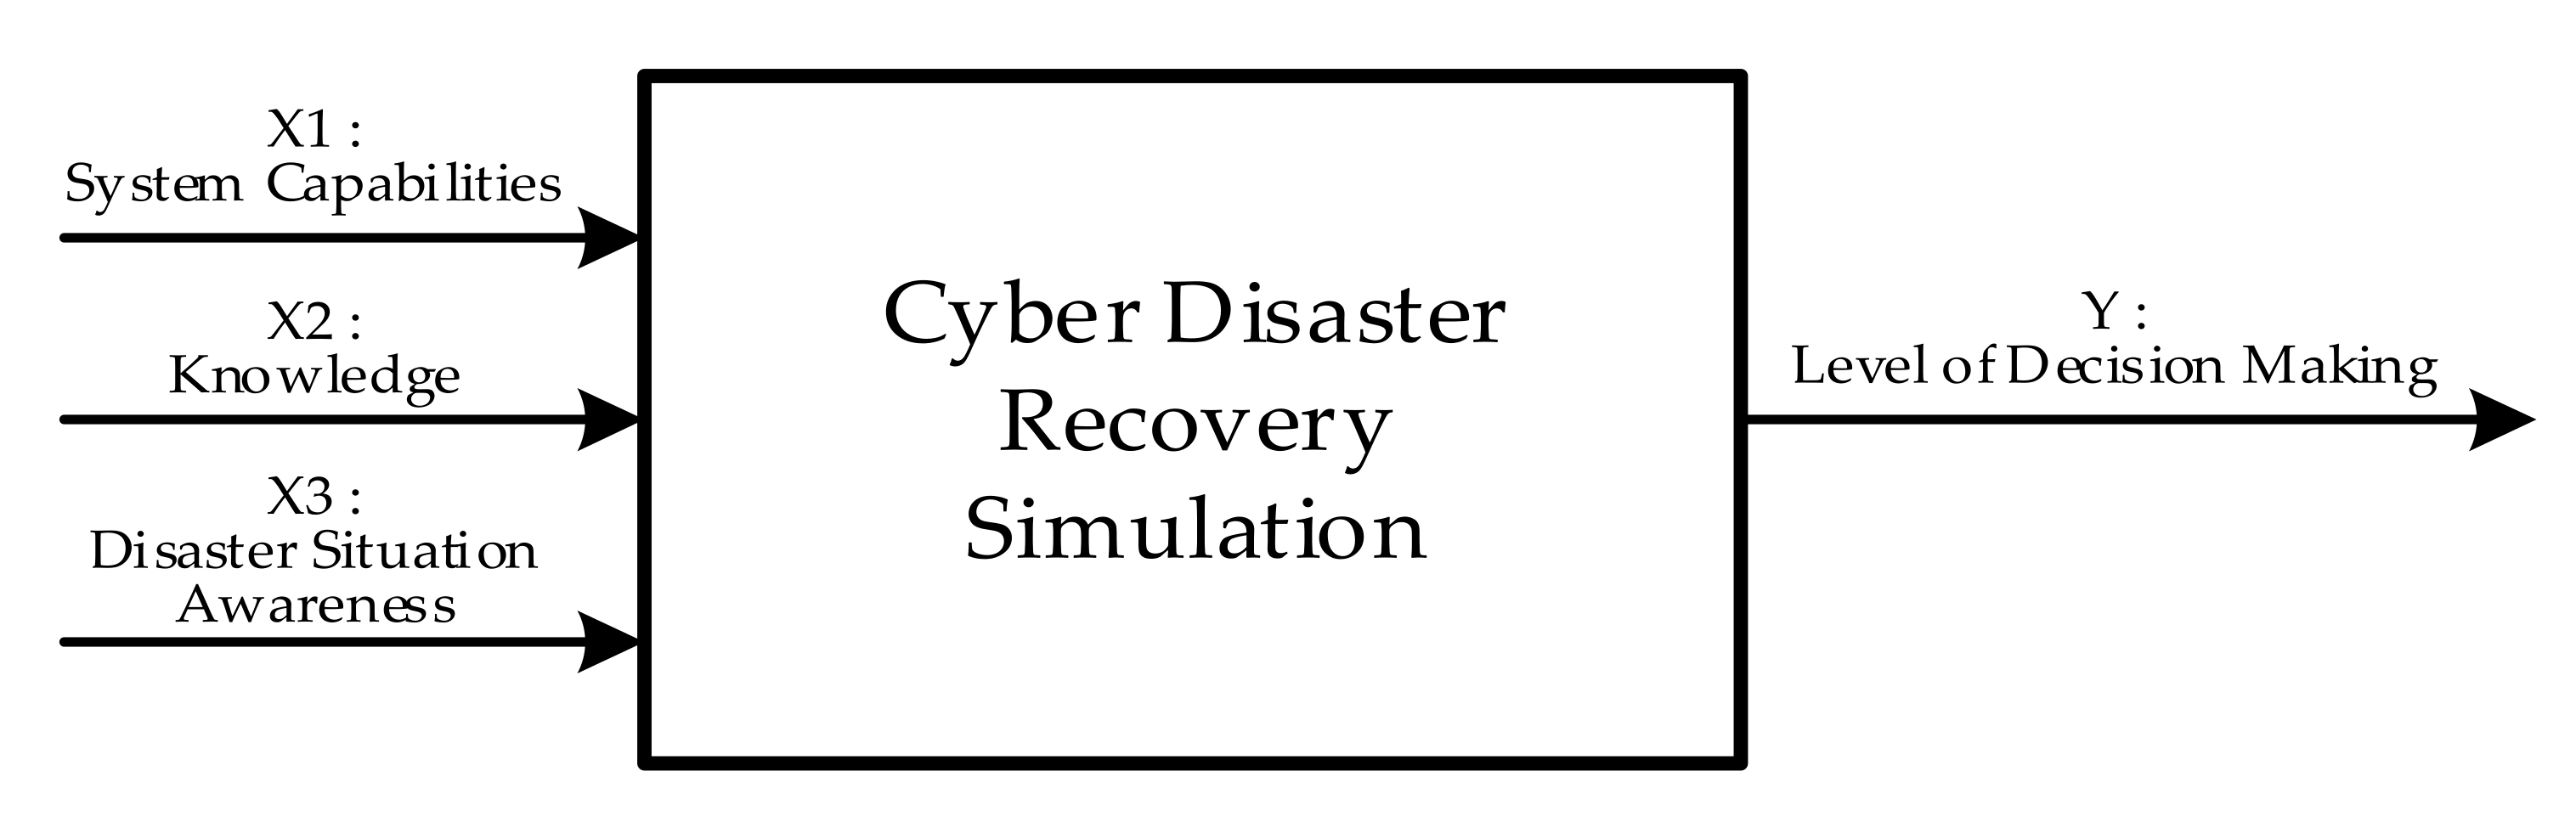
- Level of decision making: Decision-making levels were used to evaluate the purpose and extent of the disaster team’s effectiveness in dealing with cyberdisaster actions during a simulation. This included evaluating post simulation actions to determine whether the team had improved the simulation results. This was an output variable.
- System capabilities: These were related to effective simulation methods and infrastructure to support cyberdisaster management simulations. This was an input variable.
- Knowledge: This included training, experience and procedures. This was an input variable.
- Disaster situational awareness: An evaluation was carried out to assess the extent of the disaster team’s concern about the dangers of cyberdisasters, especially ransomware attacks during the COVID-19 pandemic and earthquakes. The participants had to determine whether ransomware was a threat and whether simulations could help improve responses to cyberdisasters. It was considered an input variable simulation.
4.2. Validation and Reliability Test for the Survey Results
5. Conclusions and Future Lines of Research
5.1. Conclusions
5.2. Future Research
- Simulation with a single cyberdisaster case on individual situation awareness;
- Simulation of multi-cyber-hazard cyberdisaster cases on system situation awareness; and
- Development of risk assessment methods in determining risk, such as machine learning methods, game theory, Markov chains and others.
Author Contributions
Funding
Institutional Review Board Statement
Informed Consent Statement
Data Availability Statement
Conflicts of Interest
Appendix A

| Risk Number | Asset | Failure Potential | Impact of Failure (Confidentiality, Availability, Integrity) | Caused of Failure | Current Risk | Current Scenario Decisions | ||||
|---|---|---|---|---|---|---|---|---|---|---|
| Attack | Vulnerability | Level of Severity | Level of Likehood | Level of Detection | Fuzzy Risk Priority Number | |||||
| R1 | Data Center Building | Fire | The building does not have a fire protection system and the fire emergency team is unprepared | Data not available, data cannot be accessed | Failure in the selection or design of the data center building does not have a fire protection or handling system, the addition of another data center in a different location and the competence of the fire emergency handling team | H | M | L | MR | Developing fire management scenarios and simulations, Provision of fire safety systems such as fire extinguishers, provision of emergency telephone lists, emergency teams and data back up in a disaster recovery center |
| R2 | Data Center Building | Flood | The building lacks a flood protection system and the flood emergency team is unprepared | Data not available, data cannot be accessed | Failure in the selection or design of the data center building does not have a flood handling system, the addition of another data center in a different location and the competence of the flood emergency handling team | H | M | M | MR | Developing flood management scenarios and simulations, providing drainage systems, providing emergency telephone lists, emergency teams and data backup in a disaster recovery center |
| R3 | Data Center Building | Earthquake | The building does not have a disaster protection system and an earthquake emergency team is unprepared | Data not available, data cannot be accessed | failure in the selection or design of the data center building does not have an earthquake handling system, the addition of other data centers in different locations and the competence of the earthquake emergency handling team | H | M | H | HR | Developing scenarios and simulations for handling earthquakes, providing anti-earthquake systems, providing emergency telephone lists, emergency teams and backing up data in a disaster recovery center |
| R4 | Data Center Room | Fire | The data center does not have a fire protection system and the fire emergency team is unprepared | Data not available, data cannot be accessed | The absence of a fire protection system and the provision of data center locations in different locations | H | M | L | MR | Developing fire management scenarios and simulations, Provision of fire safety systems such as fire extinguishers, provision of emergency telephone lists, emergency teams and data back up in a disaster recovery center |
| R5 | Data Center Room | Flood | The data center does not have a flood protection system and the flood emergency team is unprepared | Data not available, data cannot be accessed | The absence of a good drainage system, and the provision of data centers in different locations that are flood free | H | M | M | MR | Developing flood management scenarios and simulations, providing drainage systems, providing emergency telephone lists, emergency teams and data backup in a disaster recovery center |
| R6 | Human Resource | Infectious/pandemic diseases | Risk analysis and information security tools for access during teleworking are still inadequate, so there is potential for malware, ransomware, phishing attacks. | The absence of competent human resources to perform operations | There is no business continuity plan procedure related to pandemics or infectious diseases, and the provision of teleworking devices to prevent attacks | H | M | H | HR | Developing scenarios and simulations for handling pandemic conditions or infectious diseases and providing teleworking tools and mechanisms to prevent attacks from malware, ransomware, phishing |
| No. | Variable | Question | Mc | M | S | Pc | 1-Pc | PBc (Count) | PBc (Table) | Validation (PBc Count > PBc Table) | |
|---|---|---|---|---|---|---|---|---|---|---|---|
| 1 | Decision Making Level (Y) | 1 | During the simulation, the decision in the response team to handle or act on the threat of a ransomware or earthquake disaster was relatively fast in under 2 h)? | 11.58 | 10.93 | 1.96 | 0.86 | 0.14 | 0.82 | 0.304 | Valid |
| 2 | Did the team make a decision to evaluate the simulation results of the ransomware and earthquake disasters? | 11.23 | 10.93 | 1.96 | 0.93 | 0.07 | 0.56 | 0.304 | Valid | ||
| 3 | Did the team make any corrective action decisions after evaluating the simulated ransomware and earthquake disasters? | 11.35 | 10.93 | 1.96 | 0.88 | 0.12 | 0.59 | 0.304 | Valid | ||
| 2 | System Capabilities (X1) | 4 | Does the direct method simulation increase awareness and understanding more than the remote method? | 11.26 | 10.93 | 1.96 | 0.90 | 0.10 | 0.53 | 0.304 | Valid |
| 5 | Is the team provided with infrastructure in handling or communication during the simulation? | 11.02 | 10.93 | 1.96 | 0.98 | 0.02 | 0.31 | 0.304 | Valid | ||
| 6 | Does the team provide and perform a data backup facility to save data during disaster simulations? | 11.02 | 10.93 | 1.96 | 0.98 | 0.02 | 0.31 | 0.304 | Valid | ||
| 3 | Knowledge (X2) | 7 | Does the team have sufficient training on how to deal with an earthquake or ransomware disaster before the simulation is carried out? | 11.34 | 10.93 | 1.96 | 0.90 | 0.10 | 0.65 | 0.304 | Valid |
| 8 | Are there any disaster management procedures, whether earthquake or ransomware? | 11.30 | 10.93 | 1.96 | 0.88 | 0.12 | 0.51 | 0.304 | Valid | ||
| 9 | During the disaster simulation, the team responds to disaster management in accordance with earthquake handling procedures or ransomware attacks? | 11.34 | 10.93 | 1.96 | 0.90 | 0.10 | 0.65 | 0.304 | Valid | ||
| 4 | Disaster Situation Awareness (X3) | 10 | Does the response team care to understand what is being done when simulating the threat of an earthquake and ransomware? | 11.46 | 10.93 | 1.96 | 0.88 | 0.12 | 0.74 | 0.304 | Valid |
| 11 | Are ransomware and earthquakes a threat to cybersecurity? | 11.38 | 10.93 | 1.96 | 0.88 | 0.12 | 0.63 | 0.304 | Valid | ||
| 12 | Is the simulation able to increase the awareness of the team in responding to a disaster? | 11.13 | 10.93 | 1.96 | 0.95 | 0.05 | 0.45 | 0.304 | Valid | ||
References
- Eraso, A.B.; Garces, A.E. Teleworking in the context of the COVID-19 Crisis. Sustainability 2020, 12, 3662. [Google Scholar] [CrossRef]
- Statista. 2020. Available online: www.statista.com (accessed on 15 March 2021).
- Honeynet. Available online: https://honeynet.bssn.go.id (accessed on 15 March 2021).
- Panafrican Emergency Training Centre. Disasters & Emergencies WHO/EHA, Addis Ababa. Available online: https://www.who.int (accessed on 15 March 2021).
- Snedaker, S. Business Continuity & Disaster Recovery; Syngress Publishing Inc.: Burlington, MA, USA; Elsevier, Inc. 30 Corporate Drive: Burlington, MA, USA, 2007; pp. 123–181. [Google Scholar]
- Khan, A.; Gupta, S.; Gupta, S.K. Multi-hazard disaster studies: Monitoring, detection, recovery, and management, based on emerging technologies and optimal techniques. Int. J. Disaster Risk Reduct. 2020, 47, 101642. [Google Scholar] [CrossRef]
- Torabi, A.S.; Giaha, R.; Sahebjamnia, N. An enhanced risk assessment framework for business continuity management systems. Saf. Sci. 2016, 89, 201–218. [Google Scholar] [CrossRef]
- Swanson, M.; Wohl, A.; Pope, L.; Grance, T.; Hash, J.; Thomas, R. Contingency Planning Guide for Federal Information Systems; NIST Special Publication: Washington, DC, USA, 2010; pp. 800–834. [Google Scholar]
- Zhai, W.; Peng, Z.R.; Yuan, F. Examine the effects of neighborhood equity on disaster situational awareness: Harness machine learning and geotagged Twitter data. Int. J. Disaster Risk Reduct. 2020, 48, 101611. [Google Scholar] [CrossRef]
- Yu, M.; Huang, Q.; Qin, H.; Scheele, C.; Yang, C. Deep learning for real-time social media text classification for situation awareness–using Hurricanes Sandy, Harvey, and Irma as case studies. Int. J. Digit. Earth 2019, 12, 1230–1247. [Google Scholar] [CrossRef]
- Shah, A.A.; Gong, Z.; Pal, I.; Sun, R.; Ullah, W.; Wani, G.F. Disaster risk management insight on school emergency preparedness—A case study of Khyber Pakhtunkhwa, Pakistan. Int. J. Disaster Risk Reduct. 2020, 51, 101805. [Google Scholar] [CrossRef]
- Parham, M.; Teeuw, R.; Solana, C.; Day, S. Quantifying the impact of educational methods for disaster risk reduction: A longitudinal study assessing the impact of teaching methods on student hazard perceptions. Int. J. Disaster Risk Reduct. 2021, 52, 101978. [Google Scholar] [CrossRef]
- Ghiga, I.; Richardson, S.; Alvares, A.M.R.; Kato, M.; Naidoo, D.; Otsu, S.; Nguyen, P.T.; Nguyen, P.N.; Nguyen, T. PIPDeploy: Development and implementation of a gamified table top simulation exercise to strengthen national pandemic vaccine preparedness and readiness. Vaccine 2021, 39, 364–371. [Google Scholar] [CrossRef] [PubMed]
- Borgardt, J.; Canaday, J.; Chamberlian, D. Results from the second Galaxy Serpent web-based table-top exercise utilizing the concept of nuclear forensics libraries. J. Radioanal. Nucl. Chem. 2017, 311, 1517–1524. [Google Scholar] [CrossRef]
- Hunter, J.; Porter, M.; Phillips, A.; Brave, M.E.; Williams, B. Do paramedic students have situational awareness during high-fidelity simulation? A mixed-methods pilot study. Int. Emerg. Nurs. 2021, 56, 100983. [Google Scholar]
- Mazur, L.M.; Adams, R.; Mosaly, P.R.; Stiegler, M.P.; Nuamah, J.; Adapa, K.; Chera, B.; Marks, L.B. Impact of simulation-based training on radiation therapists’ workload, situation awareness, and performance. Adv. Radiat. Oncol. 2020, 5, 1106–1114. [Google Scholar] [CrossRef] [PubMed]
- Estrada, A.M.C.; Santos, L.L.G.; Torres, C.A.B.; Lopez, J.E.R. Sustainability and resilience organizational capabilities to enhance business continuity management: A literature review. Sustainability 2021, 13, 8196. [Google Scholar] [CrossRef]
- Caputo, F.; Carrubbo, L.; Sarno, D. The influence of cognitive dimensions on the consumer-SME relationship: A sustainability-oriented view. Sustainability 2018, 10, 3238. [Google Scholar] [CrossRef] [Green Version]
- Franke, U.; Brynielsson, J. Cyber situation awareness—A systematic review of the literature. Comput. Secur. 2014, 46, 18–31. [Google Scholar] [CrossRef]
- Abraham, S.; Nail, S. Cyber security analytics: A stochastic model for security quantification using absorbing Markov chains. J. Commun. Dec. 2014, 9, 899–907. [Google Scholar] [CrossRef]
- Park, M.; Oh, H.; Lee, K. Security risk measurement for information leakage in IoT-based smart homes from a situational awareness perspective. Sensor 2019, 19, 2148. [Google Scholar] [CrossRef] [Green Version]
- Rongrong, X.; Xiaochun, Y.; Zhiyu, H. Framework for risk assessment in cyber situation awareness. IET Inf. Secur. 2019, 13, 49–156. [Google Scholar] [CrossRef]
- Webb, J.; Ahmad, A.; Maynard, A.B.; Shanks, G. A situation awareness model for information security risk management. Comput. Secur. 2014, 44, 1–15. [Google Scholar] [CrossRef]
- Endsley, M.R. Toward a theory of situation awareness in dynamic systems. Hum. Factors J. 1995, 37, 32–64. [Google Scholar] [CrossRef]
- ISO Organization. ISO 27005:2018 Standard; International Electrotechnical Commission: Geneva, Switzerland, 2018; p. 3. [Google Scholar]
- Chen, Z.; Wu, X.; Qin, J. Risk assessment of an oxygen-enhanced combustor using a structural model based on the FMEA and fuzzy fault tree. J. Loss Prev. Process Ind. 2014, 32, 349–357. [Google Scholar] [CrossRef]
- Balaraju, J.; Raj, M.G.; Murthy, C.S. Fuzzy-FMEA risk evaluation approach for LHD machine—A case study. J. Sustain. Min. 2019, 18, 257–268. [Google Scholar] [CrossRef]
- Silva, M.M.; De Gusmao, P.A.; Poleto, T.; e Silva, L.C.; Costa, A.P.C.S. A multidimensional approach to information security risk management using FMEA and fuzzy theory. Int. J. Inf. Manag. 2014, 34, 733–740. [Google Scholar] [CrossRef]
- Dagsuyu, C.; Gocmen, E.; Narli, M.; Kokangul, A. Classical and fuzzy FMEA risk analysis in a sterilization unit. Comput. Ind. Eng. 2016, 101, 286–294. [Google Scholar] [CrossRef]
- Behzad, M.A. Using fuzzy FMEA to increase patient safety in the fundamental process of the operation room. J. Ind. Syst. Eng. 2018, 11, 146–166. [Google Scholar]
- Kerk, Y.W.; Tay, K.M.; Lim, C.P. An analytical interval fuzzy inference system for risk evaluation and prioritization in failure mode and effect analysis. IEEE Syst. J. Sept. 2017, 11, 1589–1600. [Google Scholar] [CrossRef]
- Poller, B.; Hall, S.; Bailey, C.; Gregory, S.; Clark, R.; Roberts, P.; Tunbridge, A.; Poran, V.; Crook, B.; Evans, C. ‘VIOLET’: A fluorescence-based simulation exercise for training healthcare workers in the use of personal protective equipment. J. Hosp. Infect. 2018, 99, 229–235. [Google Scholar] [CrossRef] [PubMed] [Green Version]
- Musharraf, M.; Khan, F.; Veitch, B. Modeling and simulation of offshore personnel during emergency situations. Saf. Sci. 2019, 111, 144–153. [Google Scholar] [CrossRef]
- Afulani, P.A.; Dryer, J.; Calkins, K.; Aborigo, R.A.; Mcnally, B.; Cohen, S.R. Provider knowledge and perceptions following an integrated simulation training on emergency obstetric and neonatal care and respectful maternity care: A mixed-methods study in Ghana. Midwifery 2020, 85, 102667. [Google Scholar] [CrossRef] [PubMed]
- Gomes, J.O.; Borges, M.; Huber, G.J.; de Carvalho, P.V.R. Analysis of the resilience of team performance during a nuclear emergency response exercise. Appl. Ergon. 2014, 45, 780–788. [Google Scholar] [CrossRef]
- Watson, K.E.; Waddel, J.J.; McCourt, E.M. Vital in today’s time: Evaluation of a disaster table-top exercise for pharmacists and pharmacy staff. Res. Soc. Adm. Pharm. 2020, 17, 858–863. [Google Scholar] [CrossRef]
- Grance, T.; Nolan, T.; Burke, K.; Dudley, R.; White, G.; Good, T. Guide to Test, Training, and Exercise Programs for IT Plans and Capabilities; National Institute of Standards and Technology: Washington, DC, USA, 2006; p. 2.
- Sandström, B.C.; Eriksson, H.; Norlander, L.; Thorstensson, M.; Cassel, G. Training of public health personnel in handling CBRN emergencies: A table-top exercise card concept. Environ. Int. 2014, 72, 164–169. [Google Scholar] [CrossRef] [PubMed]
- Chi, C.H.; Chao, W.H. Emergency medical technicians’ disaster training by tabletop exercise. Am. J. Emerg. Med. 2001, 19, 433–436. [Google Scholar] [CrossRef] [PubMed]
- ISO 22301:2019; ISO/TC 292 Security and Resilience—Business Continuity Management System—Requirements; ISO Organization, Technical Committee: Geneva, Switzerland, 2020; pp. 13–14.
- Landig, J.; Erhardt, J.G.; Bode, J.C.; Bode, C. Validation and comparison of two computerized methods for obtaining a diet history. Clin. Nutr. 1998, 17, 113–117. [Google Scholar] [CrossRef]
- Peña, N.L.; Gasch, A.C.; Chilleron, M.J.V.; Chorda, V.M.G.; Alcazar, M.P.S.; Tudela, S.M. Nursing students’ knowledge about breastfeeding: Design and validation of the AprendeLact questionnaire. Educ. Today 2020, 93, 104539. [Google Scholar] [CrossRef] [PubMed]
- Attali, Y.; Fraenkel, T. The point-biserial as a discrimination index for distractors in multiple-choice items: Deficiencies in usage and an alternative. J. Educ. Meas. 2000, 37, 77–86. [Google Scholar] [CrossRef]
- Blazeby, J.M.; Hall, E.; Aaronson, N.K.; Llyod, L.; Waters, R.; Kelly, J.D.; Fayers, P. Validation and reliability testing of the EORTC QLQ-NMIBC24 questionnaire module to assess patient-reported outcomes in non-muscle-invasive bladder cancer. Eur. Urol. 2014, 66, 1148–1156. [Google Scholar] [CrossRef] [Green Version]
- Taber, K.S. The use of Cronbach’s alpha when developing and reporting research instruments in science education. Res. Sci. Educ. 2018, 48, 1273–1296. [Google Scholar] [CrossRef]
- Computer Security Division. Guide for Conducting Risk Assessments. National Institute of Standards and Technology Special Publication 800-30 Revision 1; Computer Security Division: Washington, DC, USA, 2012; p. H-3. [Google Scholar]


| Rating | Description | Definition |
|---|---|---|
| 1 | No danger | Failure causes no injury and has no impact on the system |
| 2 | Slight danger | Failure could cause no injury and the customer is unaware of the problem; however, the potential for minor injury exists. There is little or no effect on the system |
| 3 4 | Low to moderate danger | Failure could cause a very minor or no injury but annoys customers and/or results in minor system problems that can be overcome with minor modifications to the system or process |
| 5 | Moderate danger | Failure could cause a minor injury with some customer dissatisfaction and/or major system problems |
| 6 7 | Dangerous | Failure could cause a minor to moderate injury with a high degree of customer dissatisfaction and/or major system problems requiring major repairs or significant re-work |
| 8 9 | Very dangerous | Failure could cause a major or permanent injury and/or serious system disruption with interruption in service, with prior warning |
| 10 | Extremely dangerous | Failure could cause the death of a customer (patient, visitor, employee, staff member, business partner) and/or total breakdown, without any prior warning |
| Rating | Description | Potential Failure Rate |
|---|---|---|
| 1 | Remote probability of occurrence | Failure almost never occurs; no one remembers the last failure |
| 2 | Low probability of occurrence | Failure occurs rarely, or failure occurs about once per year |
| 3 4 | Moderate probability of occurrence | Failure occurs occasionally, or failure occurs once every 3 months |
| 5 6 | Moderately high probability of occurrence | Failure occurs approximately once per month |
| 7 8 | Very high probability of occurrence | Failure occurs frequently, or failure occurs about once per week |
| 9 | Failure is almost inevitable | Failure occurs predictably, or failure occurs every 3–4 days |
| 10 | Certain probability of occurrence | Failure occurs at least once a day, or failure occurs almost every time |
| Rating | Description | Definition |
|---|---|---|
| 1 | Almost certain chance of detection | There are automatic “shut-offs” or constraints that prevent failure |
| 2 | Very high chance of detection | There is 100% inspection of the process, but it is automated |
| 3 4 | High chance of detection | There is 100% inspection or review of the process, but it is not automated |
| 5 | Moderate chance of detection | There is a process for double-checks or inspections, but it is not automated and/or is applied only to a sample and/or relies on vigilance |
| 6 7 | Remote chance of detection | The error can be detected with a manual inspection, but no process is in place, so that detection left to chance. |
| 8 9 | Very remote/unreliable chance of detection | The failure can be detected only with a through inspection, and this is not feasible or cannot be readily performed |
| 10 | No chance of detection | There is no known mechanism for detection the failure |
| No. | Requirements | Description of ISO 22301:2019 |
|---|---|---|
| 1 | 8.2. | Business impact assessment and risk assessment |
| 2 | 8.3. | Determination of business continuity strategies and solutions |
| 3 | 8.4. | Business continuity planning |
| 4 | 8.5. | Exercise program |
| 5 | 8.6. | Document evaluation and business continuity capabilities |
| No. | Requirements | Description of ISO 22301:2019 | Cyber Disaster Planning Process |
|---|---|---|---|
| 1 | 8.2. | Business impact assessment and risk assessment | Risk Analysis |
| 2 | 8.3. | Determination of business continuity strategies and solutions | Disaster management scenario |
| 3 | 8.4. | Business continuity planning | Determination of Priority for Disaster Management |
| 4 | 8.5. | Exercise program | Simulation Program |
| 5 | 8.6. | Document evaluation and business continuity capabilities | Evaluation of simulation implementation |
| Fuzzy Membership Degree Value Level 3 Performance Factors(S,L,D) | Performances Level |
|---|---|
| [0, 0, 1.25] | Very Low (VL) |
| [0, 1.25, 2.5] | Low (L) |
| [1.25, 2.5, 3.75] | Medium (M) |
| [2.5, 3.75, 5] | High (H) |
| [3.75, 5, 6.25] | Very High (VH) |
| Description | |||
|---|---|---|---|
| Performances Level | Severity | Likelihood | Detection |
| Very Low (VL) | The threat event could be expected to have a negligible adverse effect on organizational operations, organizational assets, individuals other organizations, or the Nation. | Adversary is highly unlikely to initiate the threat event. Error, accident, or act of nature is highly unlikely to occur; or occurs less than once every 10 years. If the threat event is initiated or occurs, it is highly unlikely to have adverse impacts. | It is very certain to be able to detect attacks and cyber security vulnerabilities |
| Low (L) | The threat event could be expected to have a limited adverse effect on organizational operations, organizational assets, individuals other organizations, or the Nation. A limited adverse effect means that, for example, the threat event might: (i) cause a degradation in mission capability to an extent and duration that the organization is able to perform its primary functions, but the effectiveness of the functions is noticeably reduced; (ii) result in minor damage to organizational assets; (iii) result in minor financial loss; or (iv) result in minor harm to individuals. | Adversary is unlikely to initiate the threat event. Error, accident, or act of nature is unlikely to occur; or occurs less than once a year, but more than once every 10 years. If the threat event is initiated or occurs, it is unlikely to have adverse impacts. | The possibility of an attack and cyber security can be detected |
| Medium (M) | The threat event could be expected to have a serious adverse effect on organizational operations, organizational assets, individuals other organizations, or the Nation. A serious adverse effect means that, for example, the threat event might: (i) cause a significant degradation in mission capability to an extent and duration that the organization is able to perform its primary functions, but the effectiveness of the functions is significantly reduced; (ii) result in significant damage to organizational assets; (iii) result in significant financial loss; or (iv) result in significant harm to individuals that does not involve loss of life or serious life-threatening injuries | Adversary is somewhat likely to initiate the treat event. Error, accident, or act of nature is somewhat likely to occur; or occurs between 1–10 times a year. If the threat event is initiated or occurs, it is somewhat likely to have adverse impacts | A moderate possibility of detecting attacks and cyber security vulnerabilities |
| High (H) | The threat event could be expected to have a severe or catastrophic adverse effect on organizational operations, organizational assets, individuals, other organizations, or the Nation. A severe or catastrophic adverse effect means that, for example, the threat event might: (i) cause a severe degradation in or loss of mission capability to an extent and duration that the organization is not able to perform one or more of its primary functions; (ii) result in major damage to organizational assets; (iii) result in major financial loss; or (iv) result in severe or catastrophic harm to individuals involving loss of life or serious life-threatening injuries | Adversary is highly likely to initiate the threat event. Error, accident, or act of nature is highly likely to occur; or occurs between 10–100 times a year. If the threat event is initiated or occurs, it is highly likely to have adverse impacts. | It is unlikely to be able to detect attacks and cyber security vulnerabilities |
| Very High (VH) | The threat event could be expected to have multiple severe or catastrophic adverse effects on organizational operations, organizational assets, individuals, other organizations, or the Nation. | Adversary is almost certain to initiate the threat event. Error, accident, or act of nature is almost certain to occur; or occurs more than 100 times a year. If the threat event is initiated or occurs, it is almost certain to have adverse impacts | Cannot detect potential attack failures and cyber security vulnerabilities |
| Fuzzy Membership Degree Value Risk Level | Performances Level | Description |
|---|---|---|
| [93.75,125,156.3] | Very High Risk (VHR) | Very high risk means that a threat event could be expected to have multiple severe or catastrophic adverse effects on organizational operations, organizational assets, individuals, other organizations, or the Nation |
| [62.5, 93.75, 125] | High Risk (HR) | High risk means that a threat event could be expected to have a severe or catastrophic adverse effect on organizational operations, organizational assets, individuals, other organizations, or the Nation |
| [31.25, 62.5, 93.75] | Medium Risk (MR) | Moderate risk means that a threat event could be expected to have a serious adverse effect on organizational operations, organizational assets, individuals, other organizations, or the Nation. |
| [0, 31.25, 62.5] | Low Risk (LR) | Low risk means that a threat event could be expected to have a limited adverse effect on organizational operations, organizational assets, individuals, other organizations, or the Nation. |
| [0, 0, 31.25] | Very Low Risk(VLR) | Very low risk means that a threat event could be expected to have a negligible adverse effect on organizational operations, organizational assets, individuals, other organizations, or the Nation. |
| No. | Severity (S) | Likehood (L) | Detection (D) | RPN |
|---|---|---|---|---|
| 1 | VL | VL | VL | VLR |
| 2 | VL | L | L | VLR |
| 3 | VL | M | M | LR |
| 4 | VL | H | H | MR |
| 5 | VL | VH | VH | MR |
| 6 | L | VL | VL | VLR |
| 7 | L | L | L | LR |
| 8 | L | M | M | MR |
| 9 | L | H | H | MR |
| 10 | L | VH | VH | HR |
| 11 | M | VL | VL | VLR |
| 12 | M | L | L | LR |
| 13 | M | M | M | MR |
| 14 | M | H | H | HR |
| 15 | M | VH | VH | HR |
| 16 | H | VL | VL | VLR |
| 17 | H | L | L | LR |
| 18 | H | M | M | MR |
| 19 | H | H | H | HR |
| 20 | H | VH | VH | VHR |
| 21 | VH | VL | VL | LR |
| 22 | VH | L | L | MR |
| 23 | VH | M | M | HR |
| 24 | VH | H | H | HR |
| 25 | VH | VH | VH | VHR |
| 26 | VH | VL | L | VLR |
| 27 | VH | VL | M | VLR |
| 28 | VH | VL | H | VLR |
| 29 | VH | VL | VH | LR |
| 30 | VH | L | VL | VLR |
| No. | Variable | Question | |
|---|---|---|---|
| 1 | Decision Making Level (Y) | 1 | During the simulation, the decision in the response team to handle or act on the threat of a ransomware or earthquake disaster was relatively fast in under 2 h)? |
| 2 | Did the team make a decision to evaluate the simulation results of the ransomware and earthquake disasters? | ||
| 3 | Did the team make any corrective action decisions after evaluating the simulated ransomware and earthquake disasters? | ||
| 2 | System Capabilities (X1) | 4 | Does the direct method simulation increase awareness and understanding more than the remote method? |
| 5 | Is the team provided with infrastructure in handling or communication during the simulation? | ||
| 6 | Does the team provide and perform a data backup facility to save data during disaster simulations? | ||
| 3 | Knowledge (X2) | 7 | Does the team have sufficient training on how to deal with an earthquake or ransomware disaster before the simulation is carried out? |
| 8 | Are there any disaster management procedures, whether earthquake or ransomware? | ||
| 9 | During the disaster simulation, the team responds to disaster management in accordance with earthquake handling procedures or ransomware attacks? | ||
| 4 | Disaster Situation Awareness (X3) | 10 | Does the response team care to understand what is being done when simulating the threat of an earthquake and ransomware? |
| 11 | Are ransomware and earthquakes a threat to cybersecurity? | ||
| 12 | Is the simulation able to increase the awareness of the team in responding to a disaster? | ||
Publisher’s Note: MDPI stays neutral with regard to jurisdictional claims in published maps and institutional affiliations. |
© 2022 by the authors. Licensee MDPI, Basel, Switzerland. This article is an open access article distributed under the terms and conditions of the Creative Commons Attribution (CC BY) license (https://creativecommons.org/licenses/by/4.0/).
Share and Cite
Chandra, N.A.; Ratna, A.A.P.; Ramli, K. Development and Simulation of Cyberdisaster Situation Awareness Models. Sustainability 2022, 14, 1133. https://doi.org/10.3390/su14031133
Chandra NA, Ratna AAP, Ramli K. Development and Simulation of Cyberdisaster Situation Awareness Models. Sustainability. 2022; 14(3):1133. https://doi.org/10.3390/su14031133
Chicago/Turabian StyleChandra, Nungky Awang, Anak Agung Putri Ratna, and Kalamullah Ramli. 2022. "Development and Simulation of Cyberdisaster Situation Awareness Models" Sustainability 14, no. 3: 1133. https://doi.org/10.3390/su14031133