Article

The Role of a Hazardous Waste Intermediate Management Plant in the Circularity of Products

by
David Viruega Sevilla
,
Ahinara Francisco López
and
Pastora M. Bello Bugallo
*
Department of Chemical Engineering, School of Engineering, Universidade de Santiago de Compostela, Av. Lope Gómez de Marzoa, s/n, E-15782 Santiago de Compostela, Spain
*
Author to whom correspondence should be addressed.
Sustainability 2022, 14(3), 1241; https://doi.org/10.3390/su14031241
Submission received: 3 December 2021 / Revised: 11 January 2022 / Accepted: 12 January 2022 / Published: 22 January 2022
(This article belongs to the Special Issue Sustainable Environmental Management of Hazardous Wastes)

Abstract

:
Zero-pollution goals and the reduction in environmental pressures related to production and consumption have become a priority in recent environmental policies such as the 8th European Environment Action Program proposal. Adapting current industrial processes is essential to this transition towards a regenerative economy. This work presents a redesign plan for an industrial system that includes mechanical workshops and a hazardous waste intermediate management plant, covering all management activities (both off-site and on-site), such as collection, transport, and treatment. The waste management hierarchy is modified/amplified considering the original definition and the circular economy focus. This includes the improvement of existing processes and/or the design of new sustainable processes from waste to energy and useful materials, with different foci (integrated pollution prevention and control, industrial ecology, the circular economy, system dynamics, and life-cycle thinking (LCT)) and different tools employed (Best Available Techniques inventory (BAT), process simulation, BAT analysis, industrial symbiosis, dynamic material and energy flow analysis, and LCT tools). These tools help us to improve the sustainability of waste to energy and useful materials processes and improve symbiotic behaviour in the industrial system. This study shows the real possibility of achieving the circularity of products, transforming the waste sector into a productive one. Meanwhile, it contributes to the extinction of the traditional concept of waste.

Graphical Abstract

1. Introduction

The way we design, produce, use, distribute, and discard products has a strong impact on the economy, society, and environment. Waste management opportunities occur at different speeds for developed and developing countries [1]. Products and processes designed circularly can minimise resource use and foster materials’ reuse, recovery, and recyclability down the road. The European Waste Framework Directive [2] introduces the end-of-waste criteria as a concept which is adequate when some waste ceases to be waste and is given the status of a product or a secondary raw material (SRM). End-of-waste criteria are linked to the idea of the circular economy (CE). In a CE system, “waste” materials that can be recycled are injected back into the economy as new raw materials, thus increasing the security of supply [3]. These new raw materials can be traded like primary raw materials; however, still only a small fraction of secondary raw materials are used in the European Union (EU).
The current European legal framework on waste, Directive 2008/98/EC [2], modified by Directive 2018/851 [4], has the aim of controlling the whole waste lifecycle. The Waste Management Hierarchy (WMH) is a priority order for waste management and is based on prevention, preparing for reuse, recycling, and other forms of recovery, and finally disposal.
Small- and medium-sized enterprises (SMEs), defined by the European Commission in 2003 [5], are normally highly connected among stakeholders [6], where waste managers are the most important. Owing to SMEs being unable to manage their wastes in some cases, waste intermediate managers are required both to collect and manage wastes before sending them either to final waste managers or to producers again (after proper treatment).
Pursuing the “end-of-waste criteria”, several approaches and tools are used to achieve product circularity. Models are often developed to evaluate household waste management policies regarding WMH and check that waste targets are being achieved [7]. Other models aim to develop appliance waste recovery, also integrating fuzzy cognitive mapping models [8].
Regarding electronic scrap, different perspectives and models have been developed. Processing funds are analysed to see how their policies influence economic and environmental conditions [9] within the management system. Regarding mobile phone and computer waste, increasing amounts are released every year, which means that a big environmental challenge will have to be faced later on. Waste management and recycling strategies are analysed by combining approaches such as life-cycle thinking (LCT) and system dynamics (SD) to determine the optimum components of mobile phones [10]. Modelling also allows the representation of the whole PC recycling cycle through a systematic perspective [11].
Regarding food and biodegradable waste, some models emphasize municipal waste separation as a key factor concerning environmental benefits, applying it in several scenarios [12]. Even certain cities combine SD with modern methods of management, such as benchmarking [13], to build models that deal with biodegradable waste.
Finally, general solid waste management involves problems raised in distribution networks with central treatment facilities, transfer stations, landfills, and coordination issues, so models can contribute to building a solid waste management system that is geared towards cost reduction [14]. Optimization of these types of systems is often used in regional models developed to improve waste management [15].
Furthermore, LCT and SD can be combined [16] to create a methodological framework that applies to solid waste management. Other models focus on landfill capacity and on environmental impacts and their interactions to develop a framework and comprehend its dynamic nature [17].
Other issues, such as material selection and policies, are also addressed. SD has been used to determine the raw materials that represent key factors within a wire firm [18] when appropriate materials were not being utilised. Policies can foster material efficiency in the context of product packaging employing increasing recycling rates [19].
Industrial symbiosis (IS) can contribute to “end-of-waste” criteria, coupled with other approaches such as WMH, CE, and so on [6]. For instance, matter flow exchange between two close industrial plants is a way of avoiding unnecessary waste disposal. Industrial symbiosis can be achieved through a system dynamics approach. This approach allows for the creation of models that assess either waste utilisation or recycling, aiming to reach symbiotic benefits in determined IS cases [20] and a decrease in emissions to landfills [21].
However, SD and IS are applied even to commerce and governmental issues. Moreover, this approach can be coupled with other approaches, such as agent-based modelling, to improve IS contexts [22].
IS also includes the relationship between production processes and supply chains. The main purpose is to look for the dynamic stability needed to maintain the symbiotic alliance [23]. Policies often determine both economic and environmental performance due to the fact that IS development depends on social, technological, political, and economic factors [24]. It is necessary to investigate these policies from different levels of governmental structure.
Process simulation (PS) tools are often used in complex chemical processes, such as waste polyethene gasification [25], or in different models that can develop simulation–optimization systems to enhance environmental performance, for example, by preventing petroleum leaks and spillages from pipes [26]. To sum up, a process simulator develops an approximation of a real process and tries to predict its behaviour. PS tools can be applied in several contexts, including sustainability-based strategies [27].
The main objective of this work is to demonstrate the real possibility of advancing towards the circularity of products acting on the waste management actors. The idea is to use different approaches, including integrated pollution prevention and control, industrial ecology, the circular economy, system dynamics, and life-cycle thinking (LCT), to introduce improvements and evaluate them from a sustainable point of view. The best available techniques inventory (BAT), process simulation, BAT analysis, industrial symbiosis, dynamic material and energy flow analysis, and LCT tools, are combined in a new methodology to fulfil the end-of-waste criteria.
The involved actors are the mechanical workshops as waste producers and an intermediate plant in which residues are managed to send them either to final waste managers or to mechanical workshops again. Concretely, this management facility manages residues from automotive mechanical workshops. Waste oils (nonchlorinated mineral oils), spent solvents, battery waste, and dirty wipes are the selected residues.

2. Materials and Methods

Different approaches and tools were employed to try to minimize waste or transform it into resources that can be reintroduced into the economic system through proper management. The steps followed were:
  • Case study, system definition and boundaries. The selection of some waste producer plants and a representative intermediate waste manager. The two actors involved were identified and defined. Every involved part of the defined system was based on a real, nonsymbiotic system.
  • Qualitative analysis of the system. This analysis should be supported by technical visits to the reference plant, together with a bibliographic review. Identification of waste flows within the selected process: inputs, outputs, and the relations between them. In addition, information on waste types were shown. A flow diagram helped to understand the process.
  • Selection of the waste flows for the case study. Of all waste managed in the process, only some was selected to be studied. The criteria used referred to economics, amounts, danger, and recyclability potential.
  • General inventory of BAT candidates for waste management.
  • Sustainable processes definition for each waste flow:
    -
    Technique inventory. Collection of all candidate techniques (BAT) for each selected waste.
    -
    Quantitative analysis. Based on data from a real waste transfer facility (plant-specific documents, such as the constructive project, administrative permissions, environmental documents, and so on), the quantification of material and energy flows were carried out. Depending on the waste stream and the recovery process, the tools used were a process simulator (Aspen Hysys® [28]) or material and energy balances; the necessary data were obtained from the literature.
    -
    Identification of IF and BAT proposal.
  • Building of the symbiotic system, including all sustainable processes for each waste.
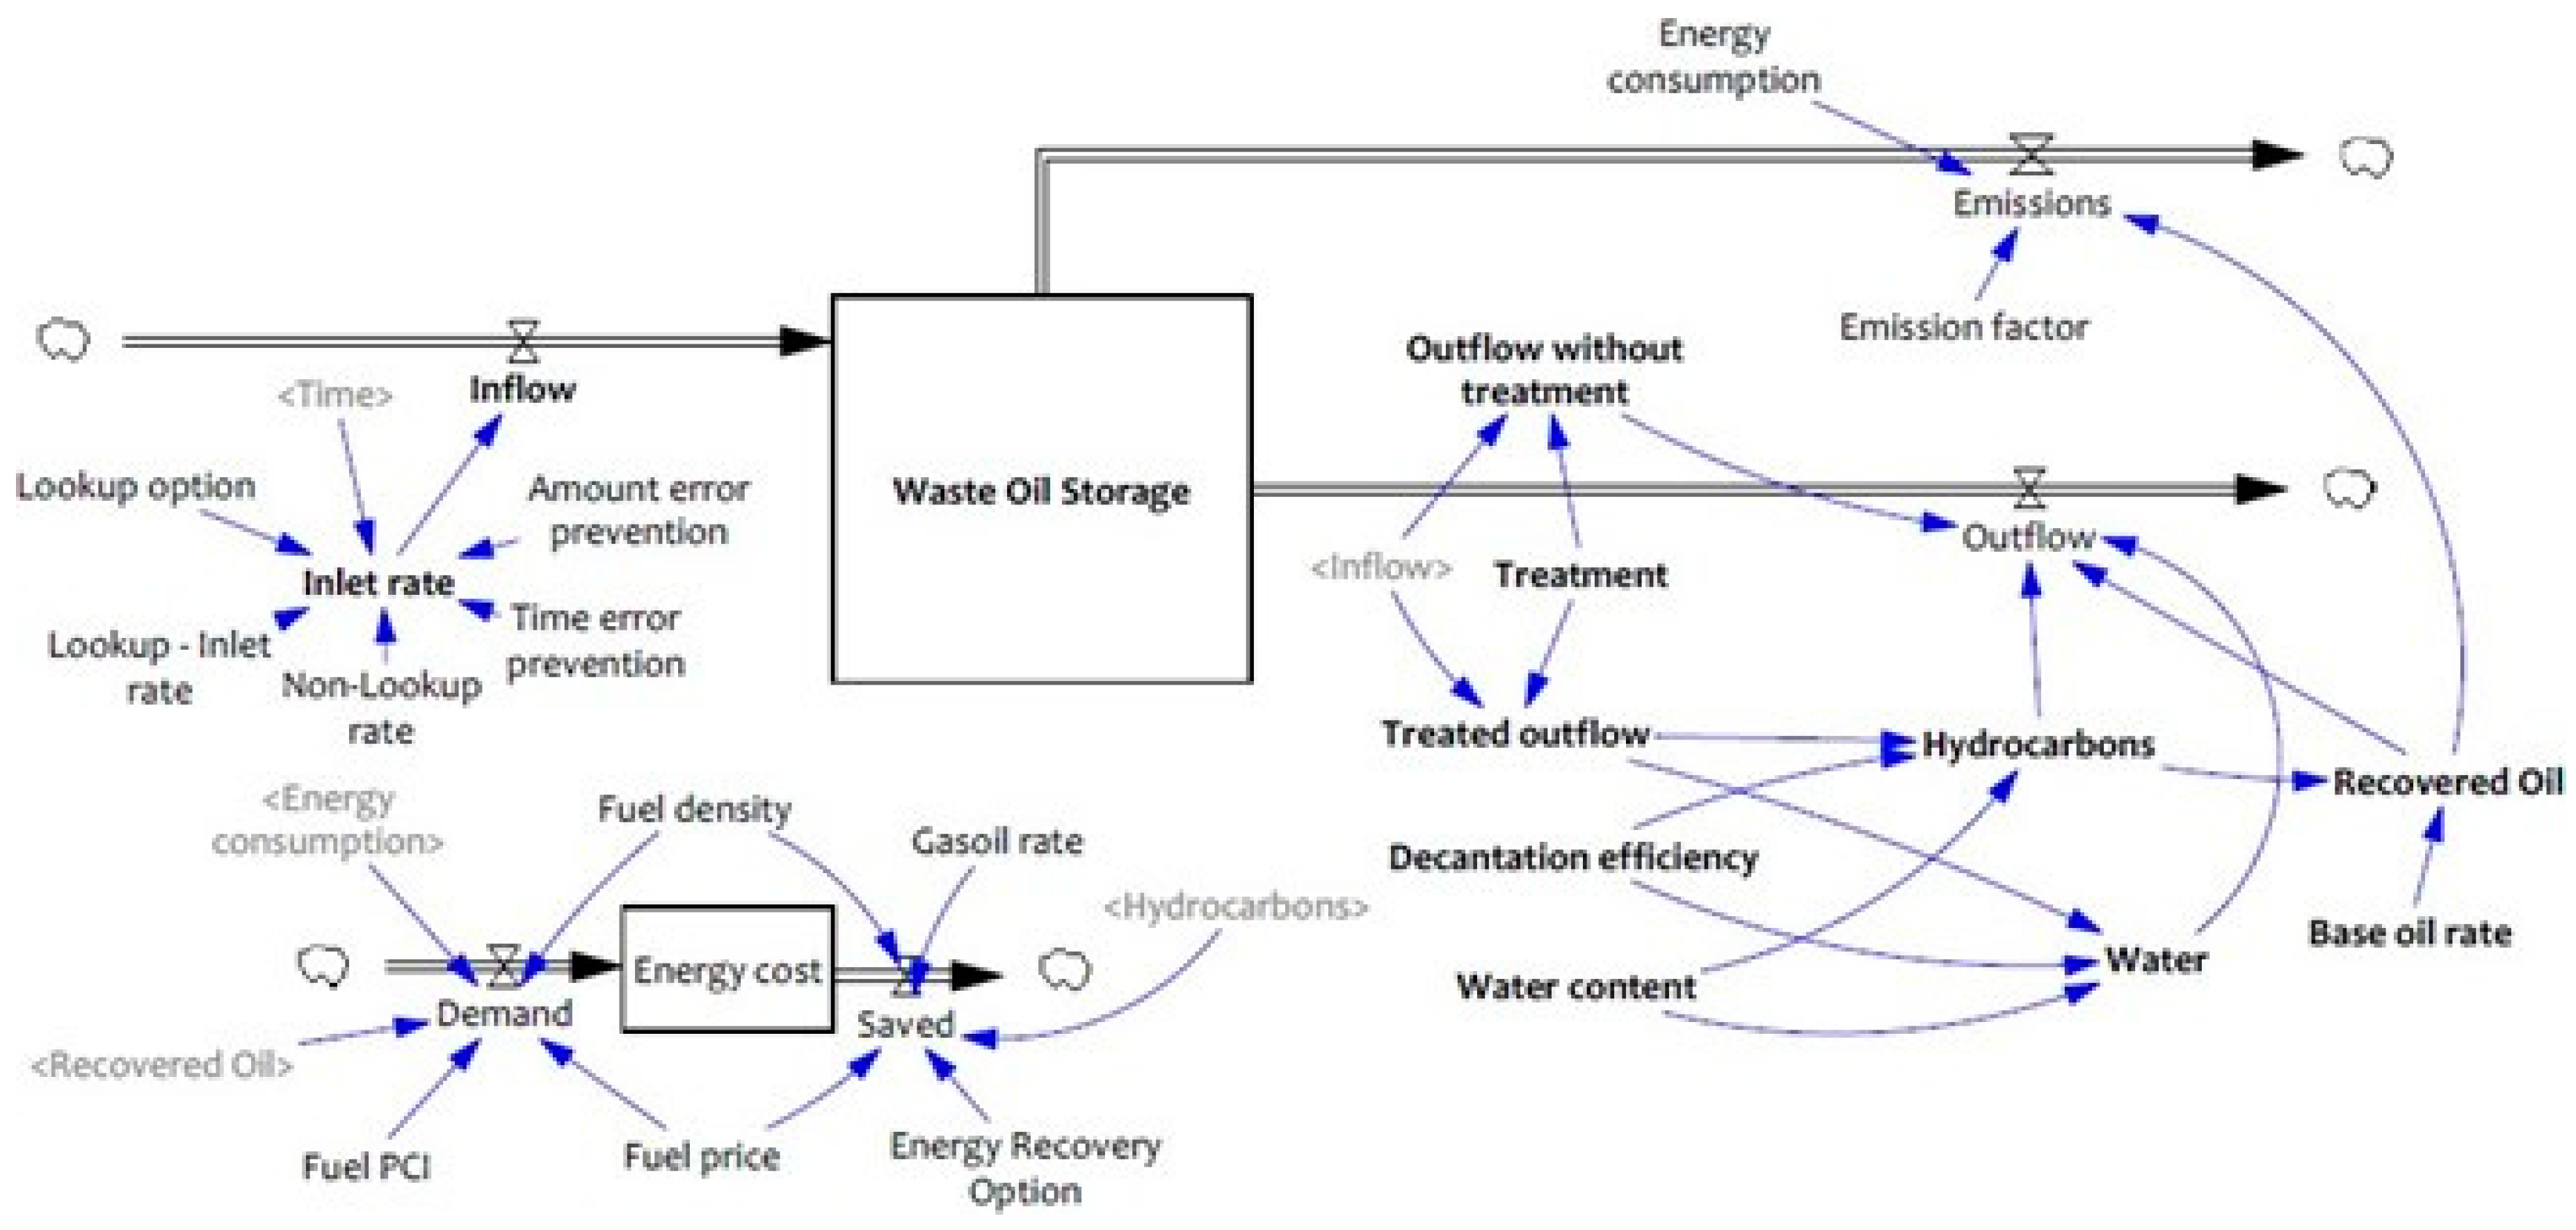
  • Dynamic MFA. Selected residue flows were evaluated through different scenarios. For this, a system dynamics approach was developed along with a stock and flow tool. The results allowed for conclusions about environmental performance within the waste management plant. VenSim PLE® was the selected software. This tool was provided by Ventana Systems, Inc. [29]. VenSim PLE® is free for educational use. It is an industrial-strength simulation software for improving the performance of real systems.
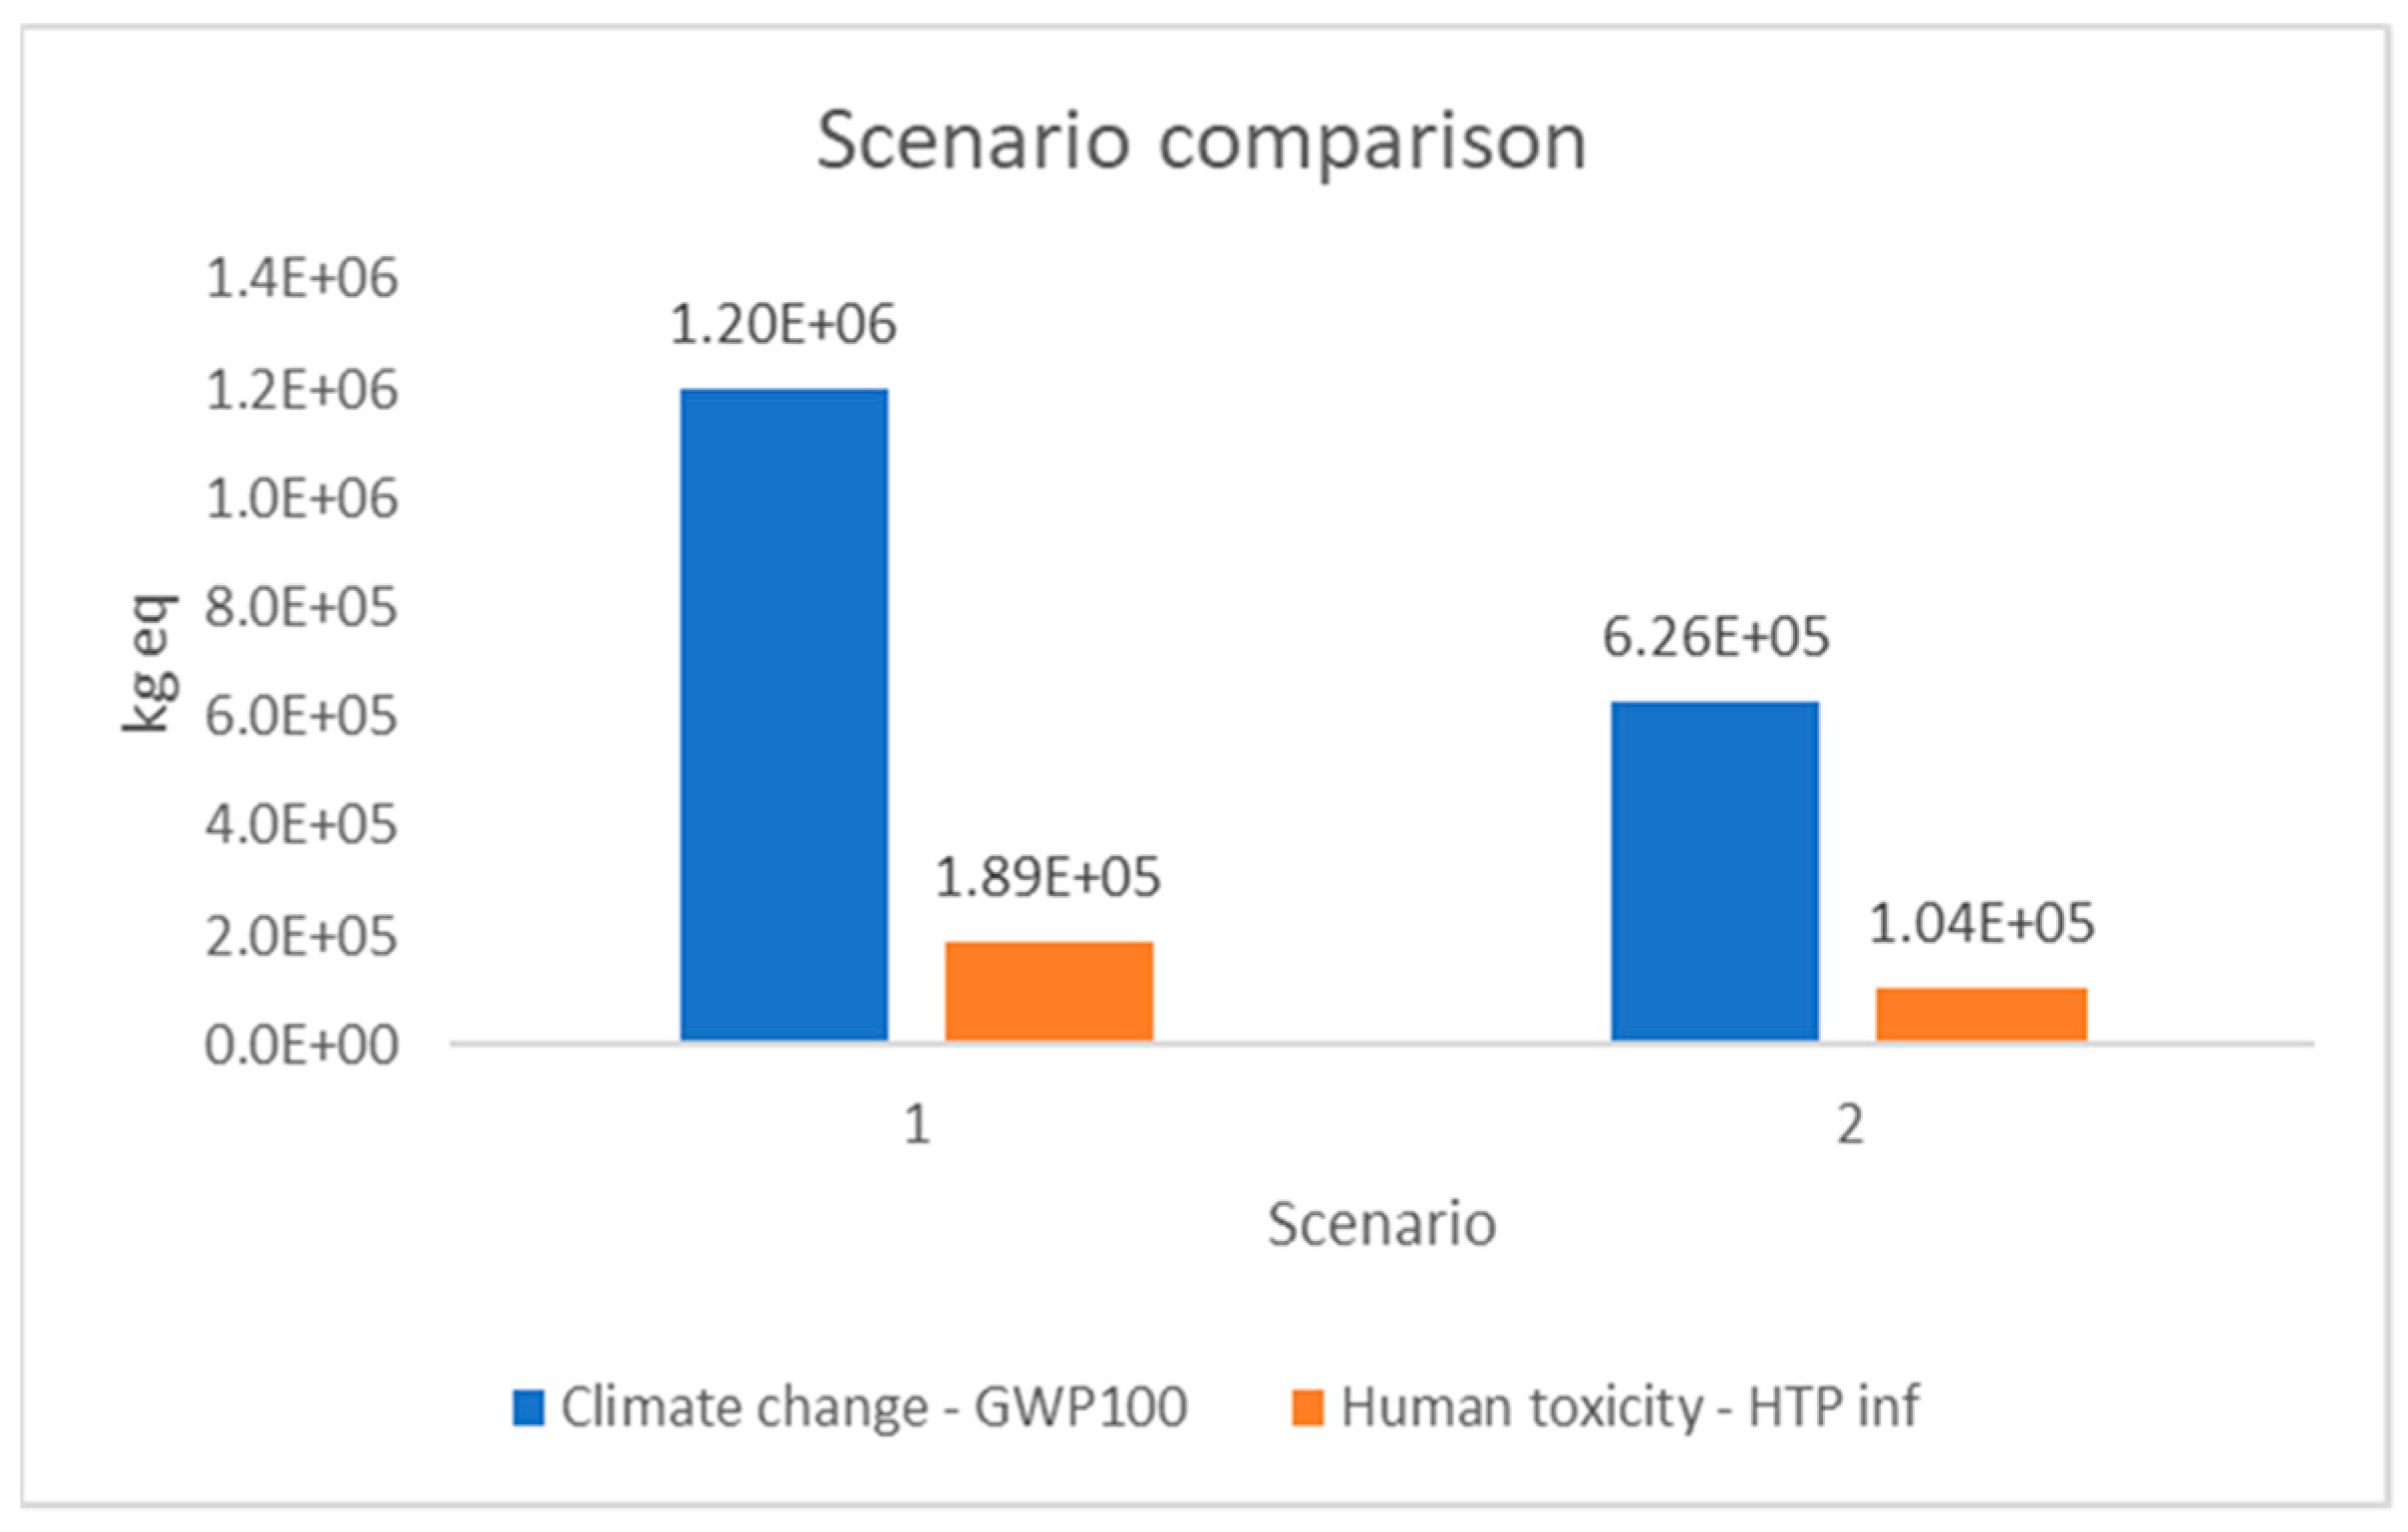
  • Impact Assessment. Comparison between two scenarios using LCT tools. The first referred to the current scenario in which symbiotic behaviour was only achieved using spent solvent distillation. On the other hand, the second scenario posed symbiotic behaviour when selected residues were subjected to treatment. The chosen software was openLCA® [30]. The procedure consisted of acquiring an open database, which in this case was provided by ELCD-JRC (European reference Life Cycle Database of the Joint Research Centre) and then creating flows and processes to perform the system process.

3. Methodology’s Development and Partial Results

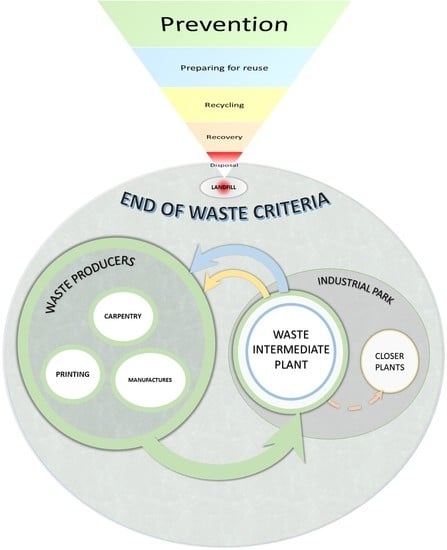
3.1. Case Study, System Definition and Boundaries

Even though the motor industry moves great amounts of money in the world market, also generates waste which is often difficult to arrange. Within this industry, mechanical workshops become relevant because their task is to repair vehicles and to change pieces. Enterprises that usually carry out this activity are globally dispersed SMEs which do not even have enough resources to manage their wastes. For this reason, waste managers are fundamental in the process, and this activity has been selected to develop the research. The involved actors in the system are the waste producers, which are some mechanical workshop facilities placed in Galicia (Spain) and the intermediate waste manager.
In Spain, the mechanical workshop sector is regulated by a corresponding regulation. Firstly, Royal Decree 2822/1998 [31] refers to the General Regulation of Vehicles. Industrial activity and mechanical workshop services are regulated by Royal Decree 1457/1986 [32], modified backwards by Royal Decree 455/2010 [33].
Finally, vehicles become either damaged or useless. Thus, Royal Decree 20/2017 [34] establishes measures related to waste production, prevention from reception, preparing for reuse, recycle and other valorisation options including components, before final vehicles disposal.
In this part of the system, those included activities are “Maintenance and repair of motor vehicles” and “Sale, maintenance and repair of motorcycles and their spare parts and accessories” [35], usually developed by SMEs. These activities are encoded following NACE nomenclature. Royal Decree 1457/1986 [32] defines mechanical workshops. Activities’ data are shown in Table 1.
The local waste intermediate plant acts as a transfer facility receiving waste from other parts of the system. Furthermore, this plant arranges waste flows and stocks to divide the output into final waste (sent to final waste managers) and returning treated waste on its own as SRMs (sent back to producers) [6].

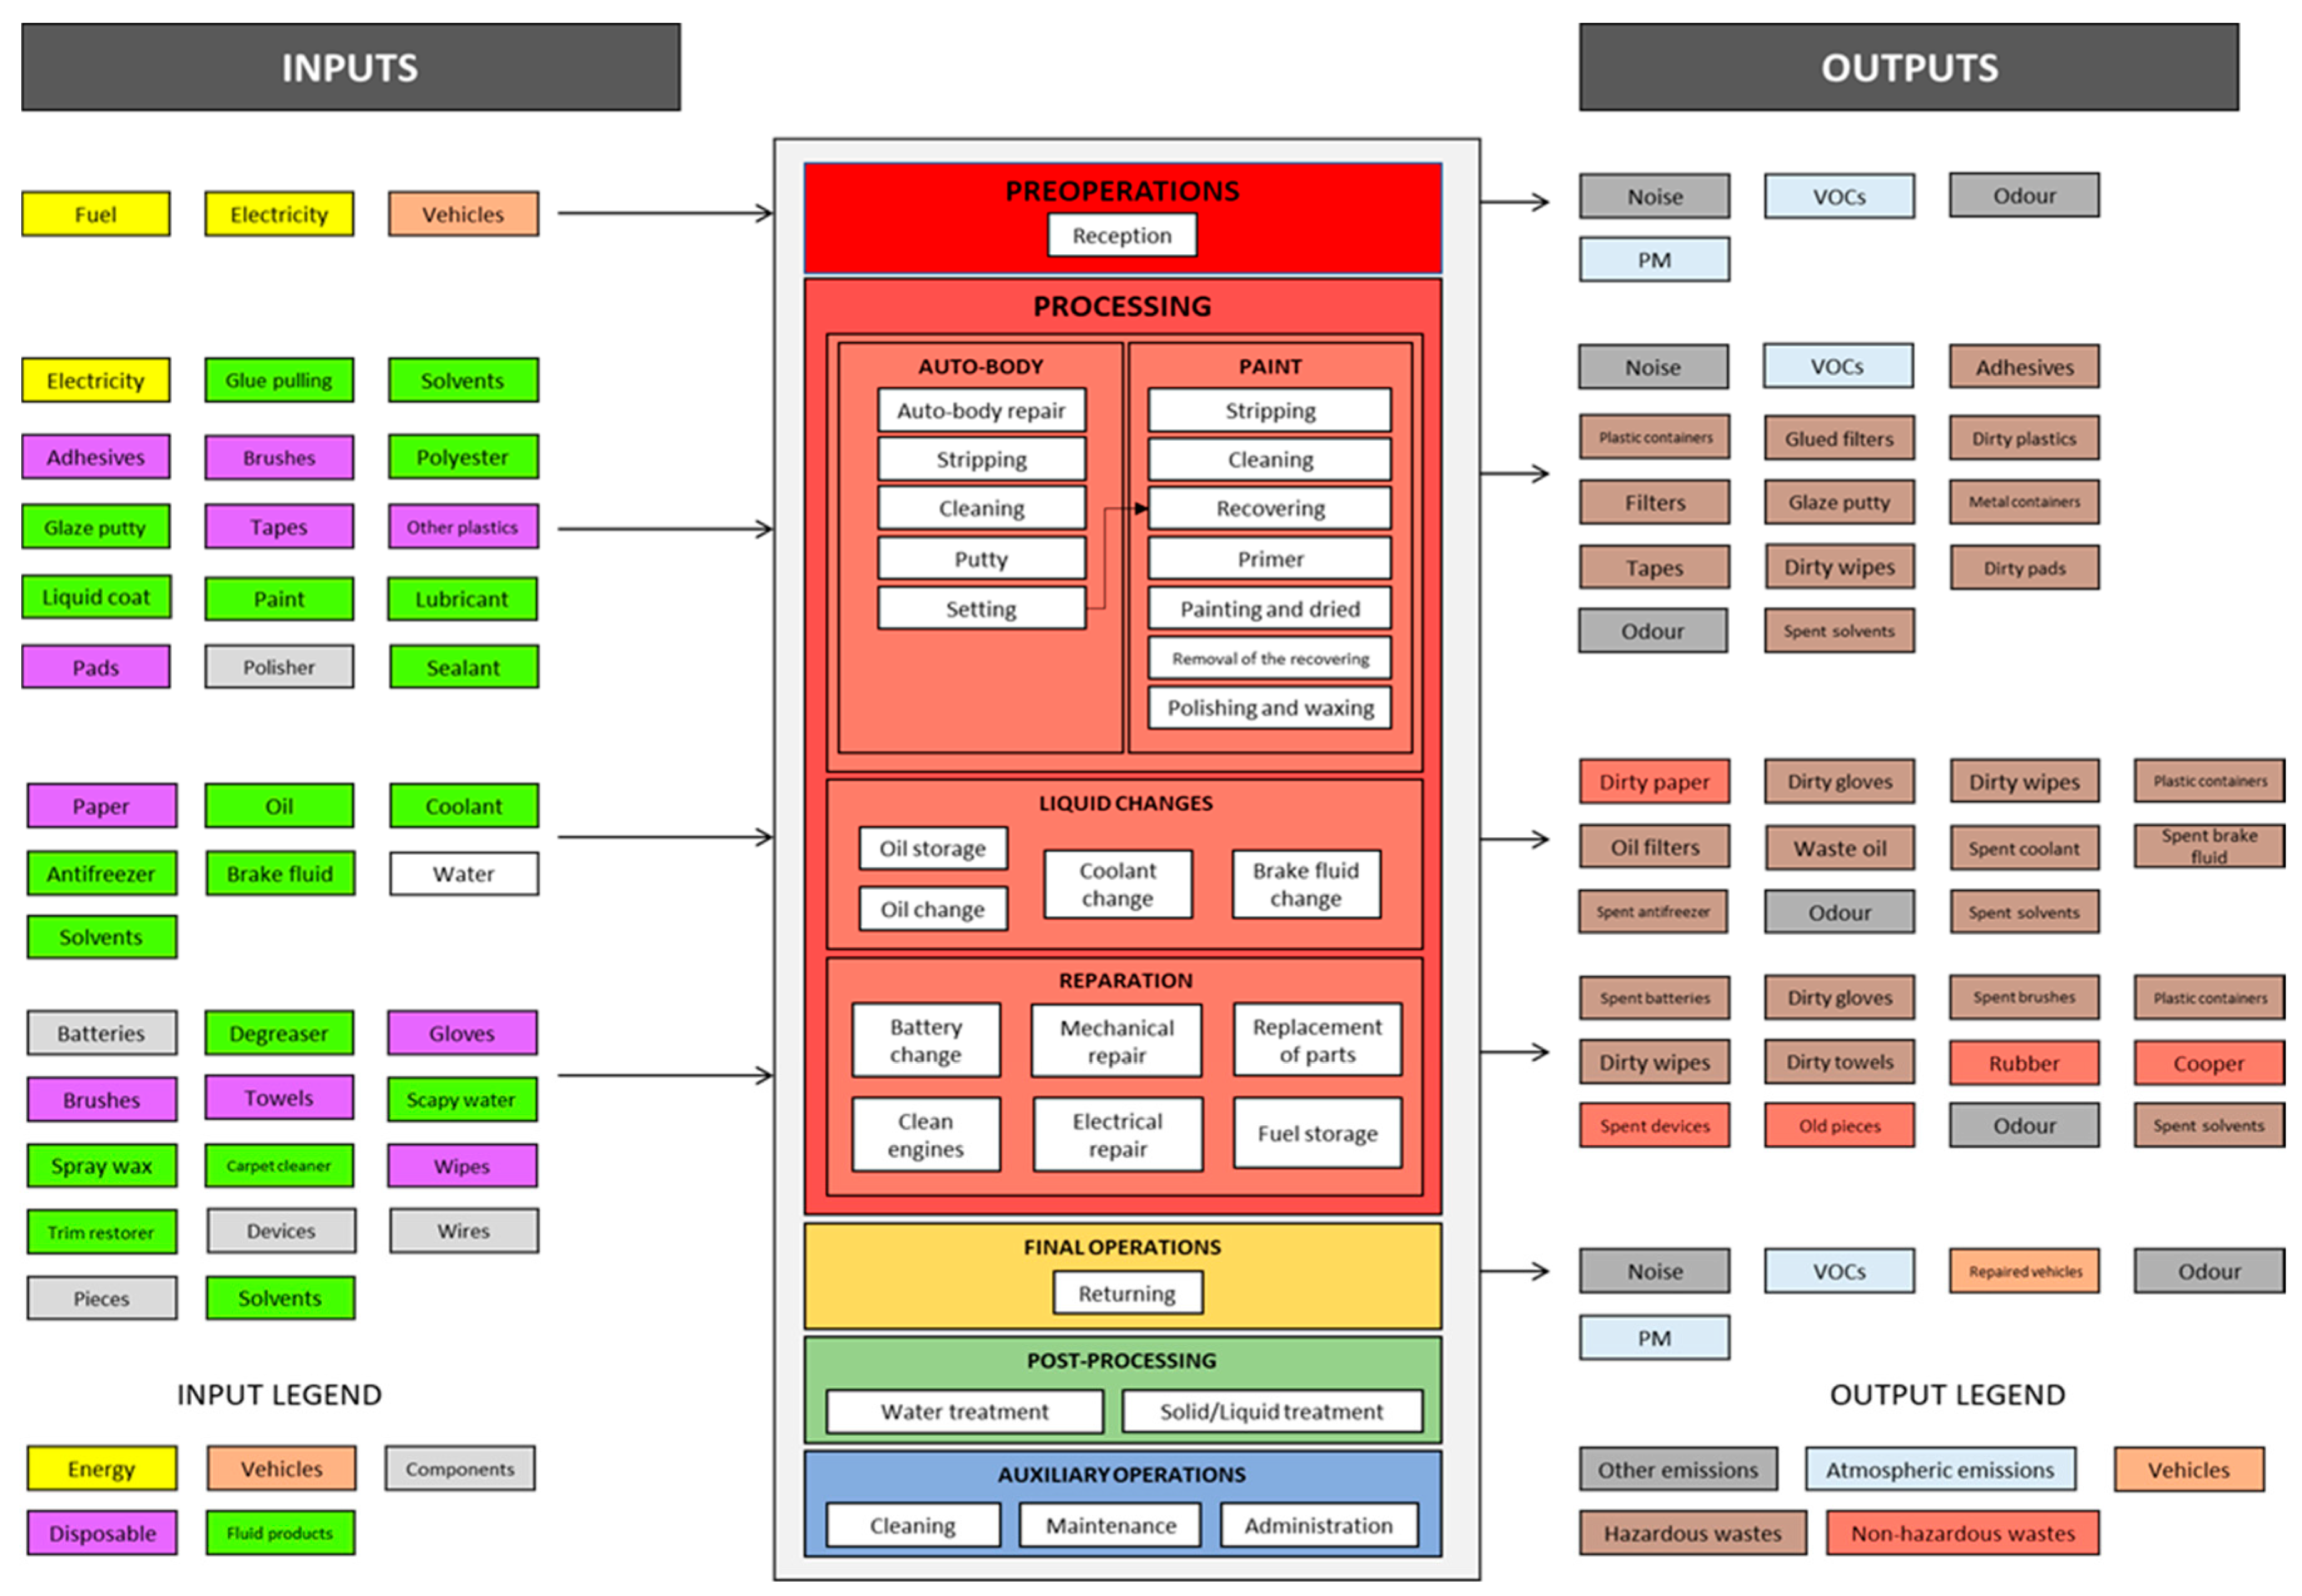
3.2. Qualitative Analysis of the System

Within methodology, this step describes the selected process to study using both explanations and flow diagrams. Two parts are involved within this system. On the one hand are the mechanical workshops, which are waste producers in Galicia, whose activities are identified through their NACE code. On the other hand, is a particular waste intermediate management plant in which residues are managed to send them either to final waste managers or to mechanical workshops again. Specifically, this management facility manages carpentry, printing, and automotive residues, although only spent solvents’ distillation and solids’ compaction are carried out.

3.2.1. Mechanical Workshops

The mechanical workshop process is represented as a big block in which inputs and outputs are included (Figure 1). At the same time, that block is divided into smaller blocks representing specific activities’ categories. Inside these category blocks, single activities are distributed. It is important to point out that activities are carried out by demand, which means vehicles do not pass through all activities.
Before transporting, all waste must be labelled and allocated based on its danger. Outgoing residues are sorted according to current legislation. Some outgoing waste flows can be potentially polluting if not treated. Waste flows from preoperations include vehicle emissions as Particulate Matter (PM), Volatile Organic Compounds (VOCs) and unavoidable odours and noise pollution. The Processing block has both autobody repair and painting activities residues, due to the use of disposables such as pads, tapes, and adhesives. These are polluted with hazardous products, such as glues and paints. Regarding liquid change activity, spent fluids, their containers and disposable items to carry them out are the main residues. Reparations often involve outgoing hazardous residues such as disposable items, spent solvents and absorbents. However, other nonhazardous wastes such as old pieces and devices are delivered to scrapping facilities. Regarding final operations, the bringing-out activity involves the same emissions as when a vehicle is brought in. Outgoing residues are treated with both water and solid/liquid treatment to comply with spilling regulations. Waste generation from auxiliary operations is minimally quantified and is related especially with cleaning activities.

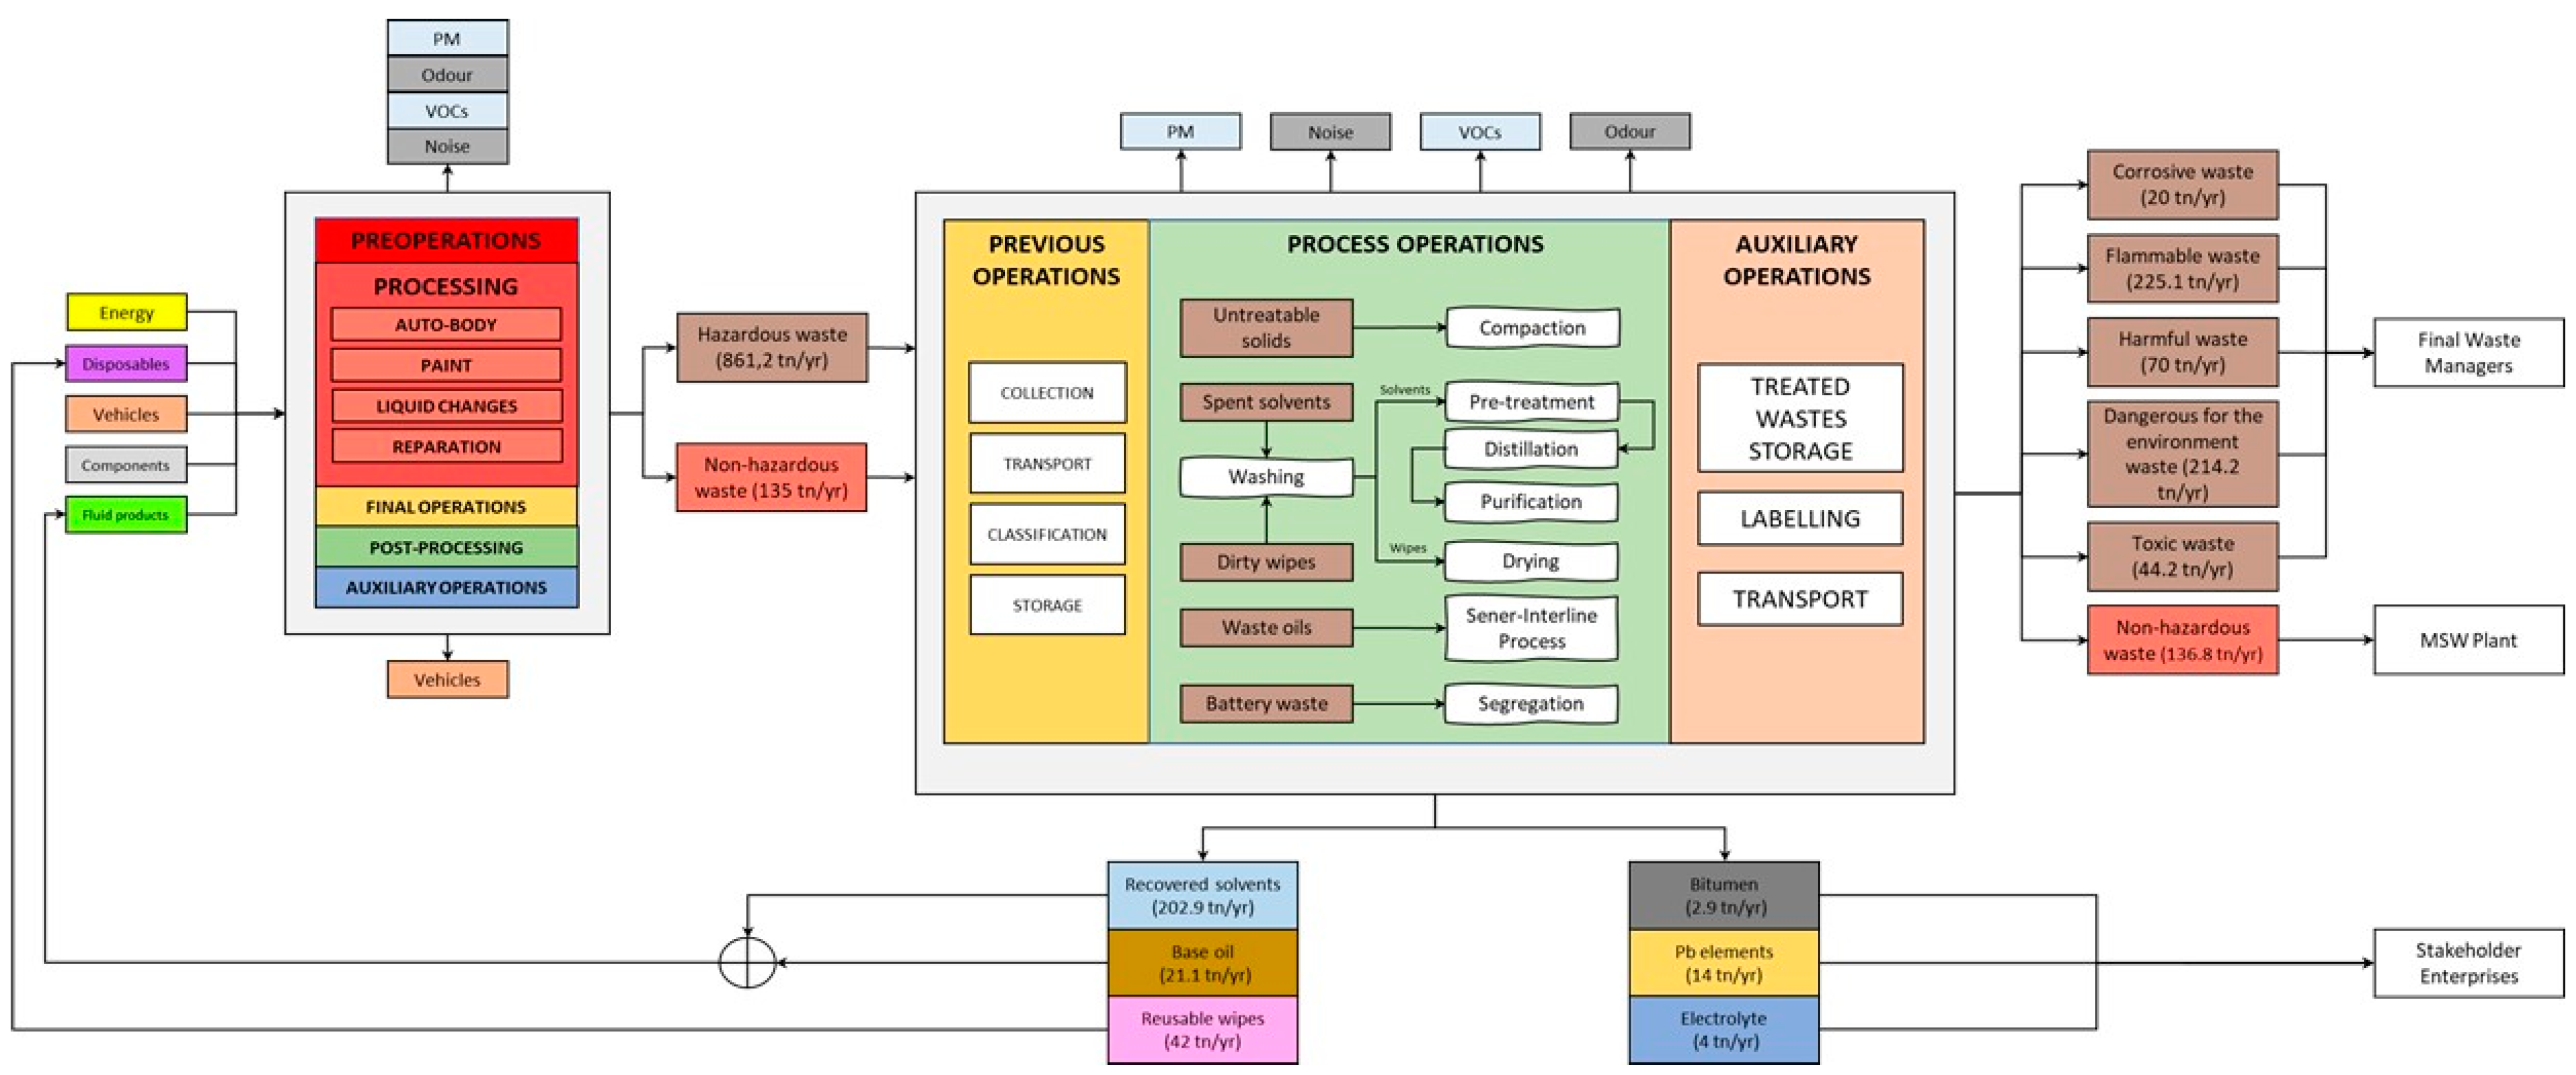
3.2.2. Waste Intermediate Plant

Throughout the described process, many output residues are delivered to waste managers. An intermediate waste management plant acts as a transfer station to sort different amounts of waste and then send them to final waste managers. Even waste intermediate plants can treat some waste to achieve a valuable product. Thereby, this allows the waste to be incorporated again as an SRM. Qualitative analysis is supported by technical visits to the reference plant. Its operation is known due to continuous contact through interviews with workers, inventories, the 2017 integrated environmental authorization, internal documentation, and projects.
This stakeholder follows a strict method for waste management, fulfilling in-force regulations. At first, this intermediate plant notifies waste producers of the acceptance of residues according to established criteria. Then, a truck (or more) brings the waste from producers to the intermediate facility. Once the waste is received, its sorting and storage begins. Besides automotive residues, this plant receives waste from the carpentry and printing industries.
Received waste can be classified into processable and others. The latter are set apart from processable waste and then packaged. The next steps are labelling, storage and finally, these are delivered to final waste managers. To abbreviate this sequence, these last steps will be called the last managing steps. Currently, processable waste inside this plant can be divided into compactable solids and spent solvents.
Compactable solids are often solids that are compressed, applying the best environmental technique to date, and thus reducing their volume. Then, these solids are ready for the final management steps. On the other hand, spent solvents are firstly sorted and labelled before temporary storage. After that comes solvent recovery treatment based on distillation to recover around 65% of the initial amount. Hence, both recovered solvent and distillation waste are separated so that the last management steps can conclude the process. Nevertheless, recovered solvents do not go to final waste managers but are sold back to producers and thus the process ends (Figure 2).

3.3. Selection of the Waste Flows for the Case Study

EU stats quantify end-of-life vehicles waste. Waste oils (nonchlorinated mineral oils), spent solvents, battery waste and dirty wipes are the selected residues. Table 2 specifies their code and hazardousness. Every year, the considered waste intermediate plant must show public data about its waste management activity.

3.3.1. Waste Oils

This residue’s main source is oil change activity. The oil is used either as a lubricant or as a hydraulic fluid, and it is usually composed of different hydrocarbons (the fraction of low- or high-boiling-point hydrocarbons can vary depending on the purpose) and additives (5–20% weight) [37]. When oil becomes used, some impurities appear in the final waste such as a low percentage of heavy metals (Cr, Cu…etc). Framework Directive [2] defines “waste oil” and establishes a labelling procedure. Table 2 shows managed used oils in 2016.

3.3.2. Spent Solvents

Spent solvents are usually a mixture of organic compounds that are used in cleaning or painting activities within the described process. Many industries such as pharma, chemical or coating industries [37] generate this waste too. Besides the possibility of recovery, these spent solvents include an additional danger related to VOCs emissions. For this reason, Directive 2004/42/EC [38] prevents air pollution when vehicle-refinishing activities are carried out. The Directive’s transposition to Spanish legislation is Royal Decree 227/2006 [39]. Table 2 shows how many tons per year of spent solvents were managed in the EU in 2016.

3.3.3. Battery Waste

The main batteries in the automotive industry are Pb-acid and Ni-Cd batteries, Pb-acid being the most representative. Pb-acid batteries become residues when new batteries replace old ones. This vehicle component is quite complex because it is formed by an electrolyte (diluted sulphuric acid with impurities), plastic pieces, alloyed lead components and other materials [40]. Currently, high-matter-recovery performances are achieved when recycling, even though this depends on equipment availability. Table 2 shows data from 2016.

3.3.4. Dirty Wipes

In mechanical workshop activities, some absorbents are used in cleaning or other tasks. Usually, these absorbents are wipes that become dirty when used. Mentioned activities can be developed using either disposable or reusable wipes.
The latter are made with natural textile fibres. An advantage of using this kind of wipes is the possibility to put them back into circulation. However, a high volume of dirty wipes is needed because of their low absorbent performance in addition to unavoidable emissions when treated.
On the other hand, disposable wipes have a better absorbent capability, so the number of dirty wipes is lower than reusable ones. These are made of synthetic fibres. The main drawback is that these are incinerated after use, generating pollution.
Solvents are removed from dirty wipes usually by centrifugation, wringing out or gravitational draining [41].

3.4. BAT Candidates’ Inventory for Waste Management

Table 3 lists the Best Available Techniques which are sorted by the process’s general aspects or specific residues.
Candidate techniques are selected to develop the best environmental performance for each residue. The proposal candidate techniques must comply with WMH priorities so that wastes become new products.

3.5. Sustainable Processes Definition for Each Waste Flow

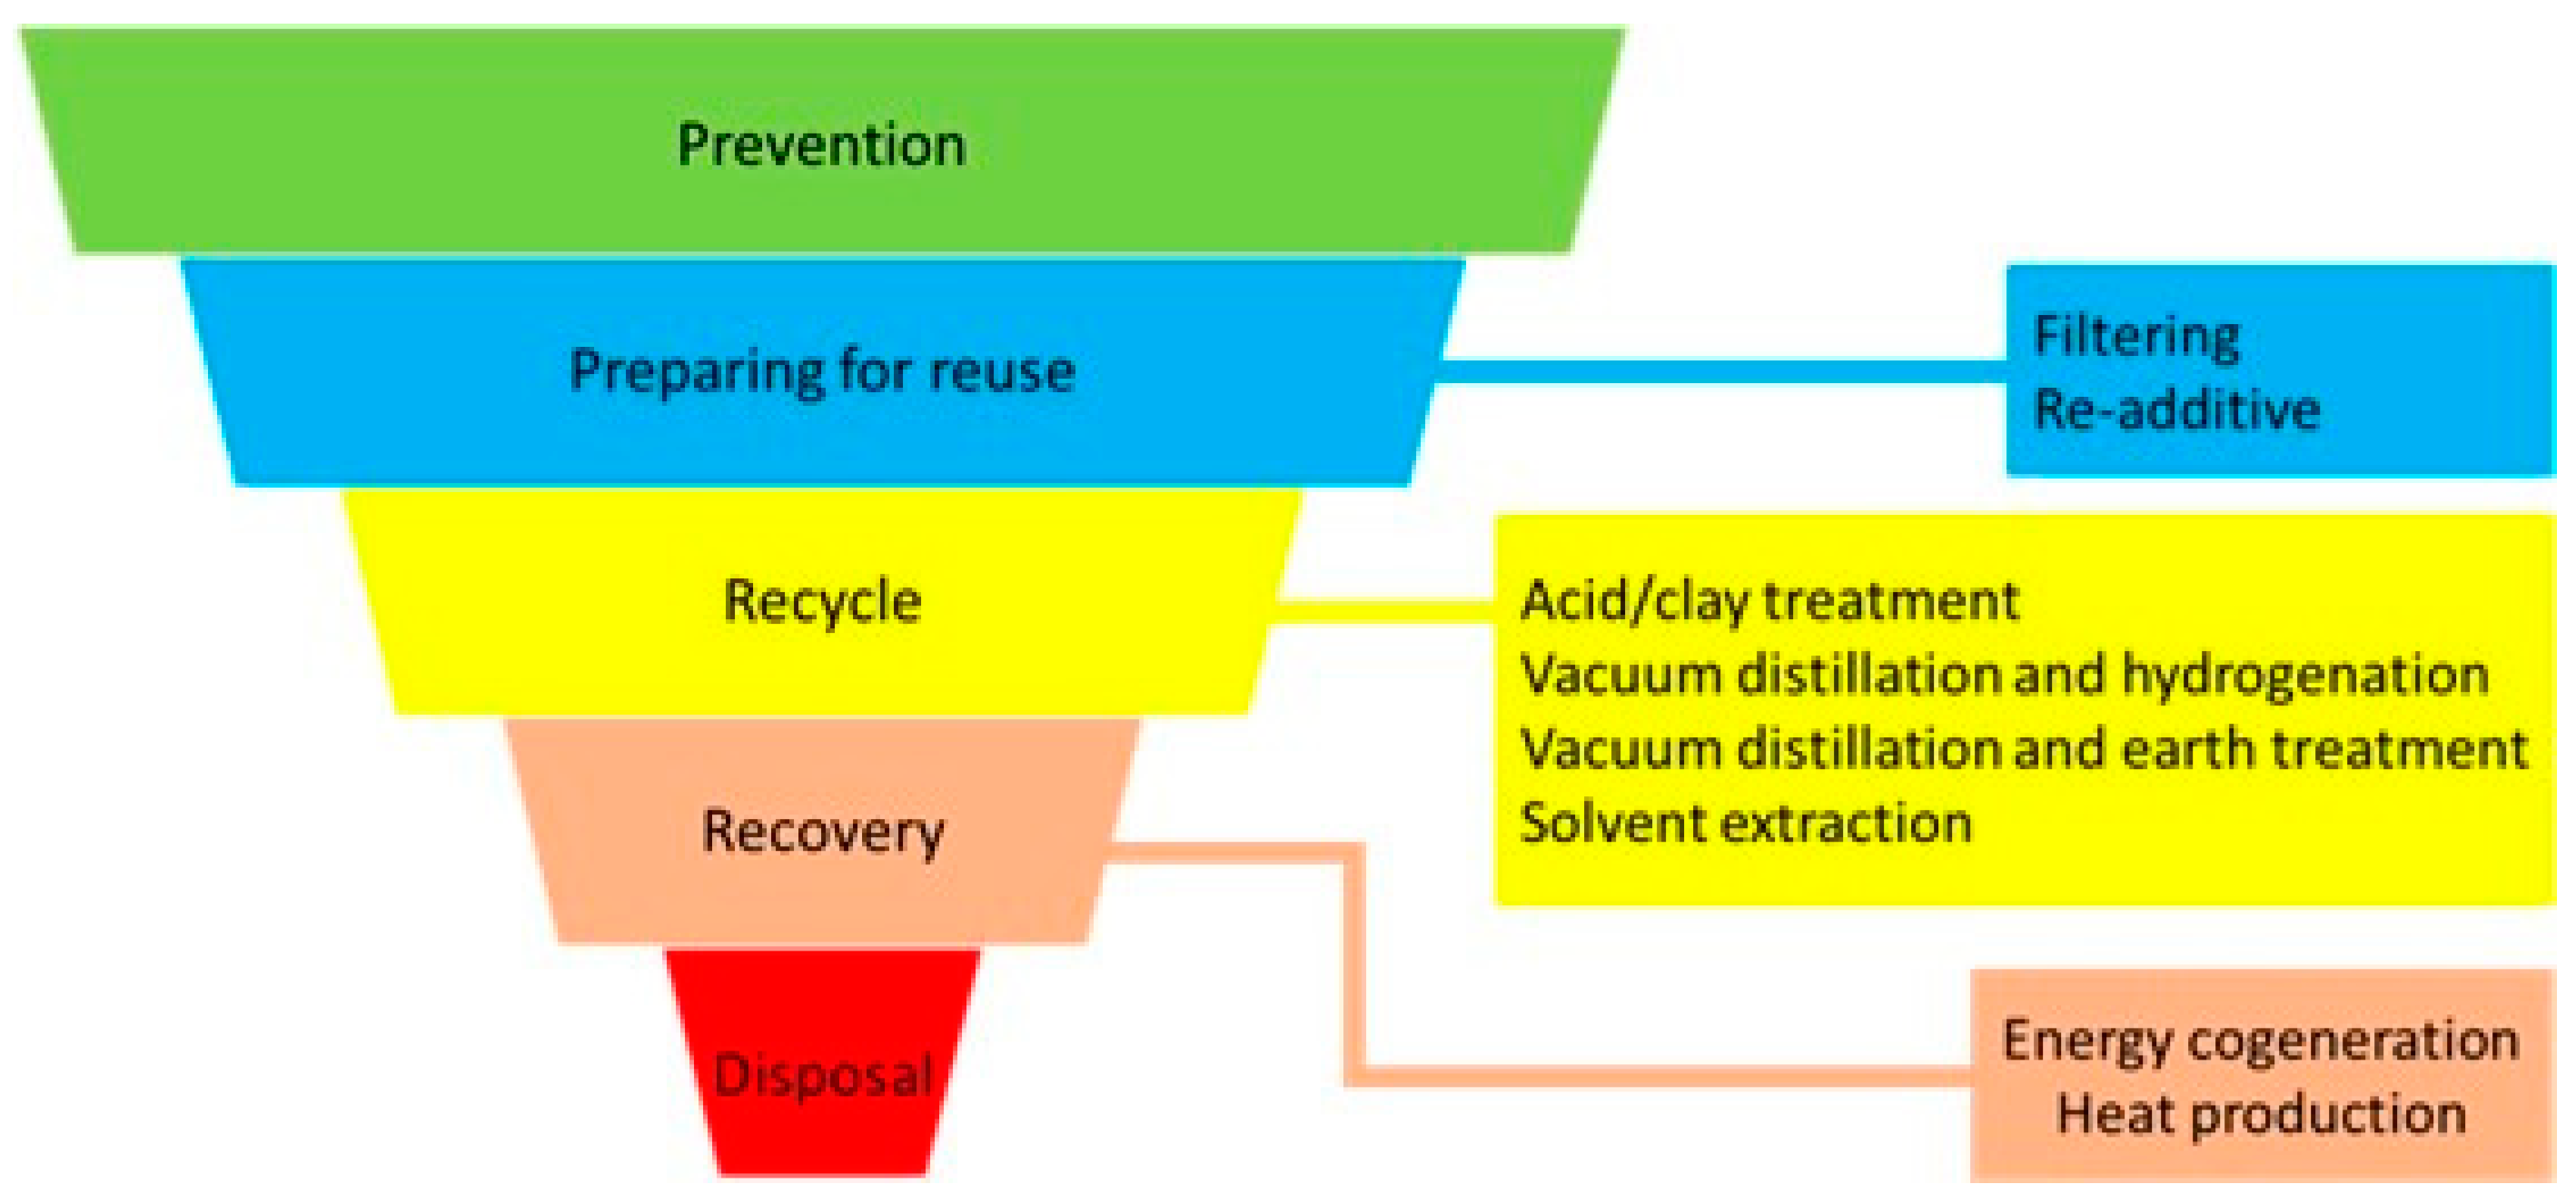
3.5.1. Technique’s inventory

(a) Waste oils
It is known that waste oils can be recovered with great environmental performances, so matter recovery becomes the first option [37]. The aim is to separate base oil from other pollutants such as water, bitumen, or heavy metals. The main alternatives are re-refining and straight burning, and each one includes several options [6].
Re-refining: The aim is to transform waste oils into new base oils to use them as new products again. Usually, this involves several complex steps and it is also a highly energy-consuming process. Among the re-refining techniques are acid/clay processes, distillations, chemical or clay treatments and solvent extraction.
-
Acid/clay: Waste oil is treated with sulphuric acid which is neutralized with clay later. Residual clay involves environmental drawbacks.
-
Vacuum distillation and hydrogenation: At first, one distillation is carried out at atmospheric pressure to remove water and light hydrocarbons. Then, a vacuum distillation divides the fractions. Finally, hydrogenation removes S and N compounds.
-
Vacuum distillation and clay treatment: At first, vacuum distillation removes water and light hydrocarbons, and subsequent thermal clay treatment removes any impurity. In the end, the final stream is filtered so that product achieves great quality.
-
Solvent extraction: The previous step is to apply a pretreatment to ensure posterior operations. After that, both waste oil and chosen solvent are mixed to separate impurities from hydrocarbons.
-
Energy recovery: This is often the chosen option in the EU [46]. It is mainly carried out in three ways:
-
Heat production through boilers’ combustion or by burning in cement kilns.
-
Fuel production by cleaning waste oils, thermal cracking, and gasification [37]. Other options are mild cleaning methods such as settling, heating, filtration, or centrifugation [47].
-
Cogeneration to produce energy into engines along with generators.
Further options: Based on the waste oil pollution level, filtering or readditive options could be applied to fulfil product specifications. WMH establishes the priorities to manage waste oils, shown in Figure 3.
Filtering and readditive operations are classified as preparing for reuse options, but are only suitable when waste oil is not highly polluted. Refining techniques are included within recycling treatments because the aim is to obtain treated oil as a new product. Finally, cogeneration and heat production are classified as recovery options.
These treatment options must be reviewed by the IPPC approach. Even though preparing for reuse treatments are above recycling options, these are not applicable when waste oils are highly polluted. In addition, acid/clay treatment is discarded because it only increases residues such as clay waste. Thereby, vacuum distillation along with earth/clay treatment is rejected too.
So, vacuum distillation plus hydrogenation treatment looks suitable when high concentrations of both chlorine and sulphur are present, by converting them to chloride acid and hydrogen sulphur, respectively. However, these pollutants are not abundant, so this treatment must be discarded. The last recycling option is solvent extraction, which removes both additives and pollutants [48]. Before sending waste oil to the distillation column, this is precleaned to avoid hydrogenation treatment.
A well-known procedure is the Sener Interline process [49], which combines several cited treatments: solvent liquid–liquid extraction and both atmospheric and vacuum distillations [48]. L–L extraction can be carried out by different solvents, for instance, propane [46] and ethane [47], although others have been evaluated [50].
Unlike propane solvent, when ethane is utilised, further hydrogenation treatment after distillation is not needed because it takes apart pollutants of the waste oil. Specifically, it provides lower values of viscosity, sulphur content, phosphorus content and heavy metals content [47]. For this reason, ethane is the selected solvent for this process [51]. Thus, the selected process can be divided into modules (Figure 4).
-
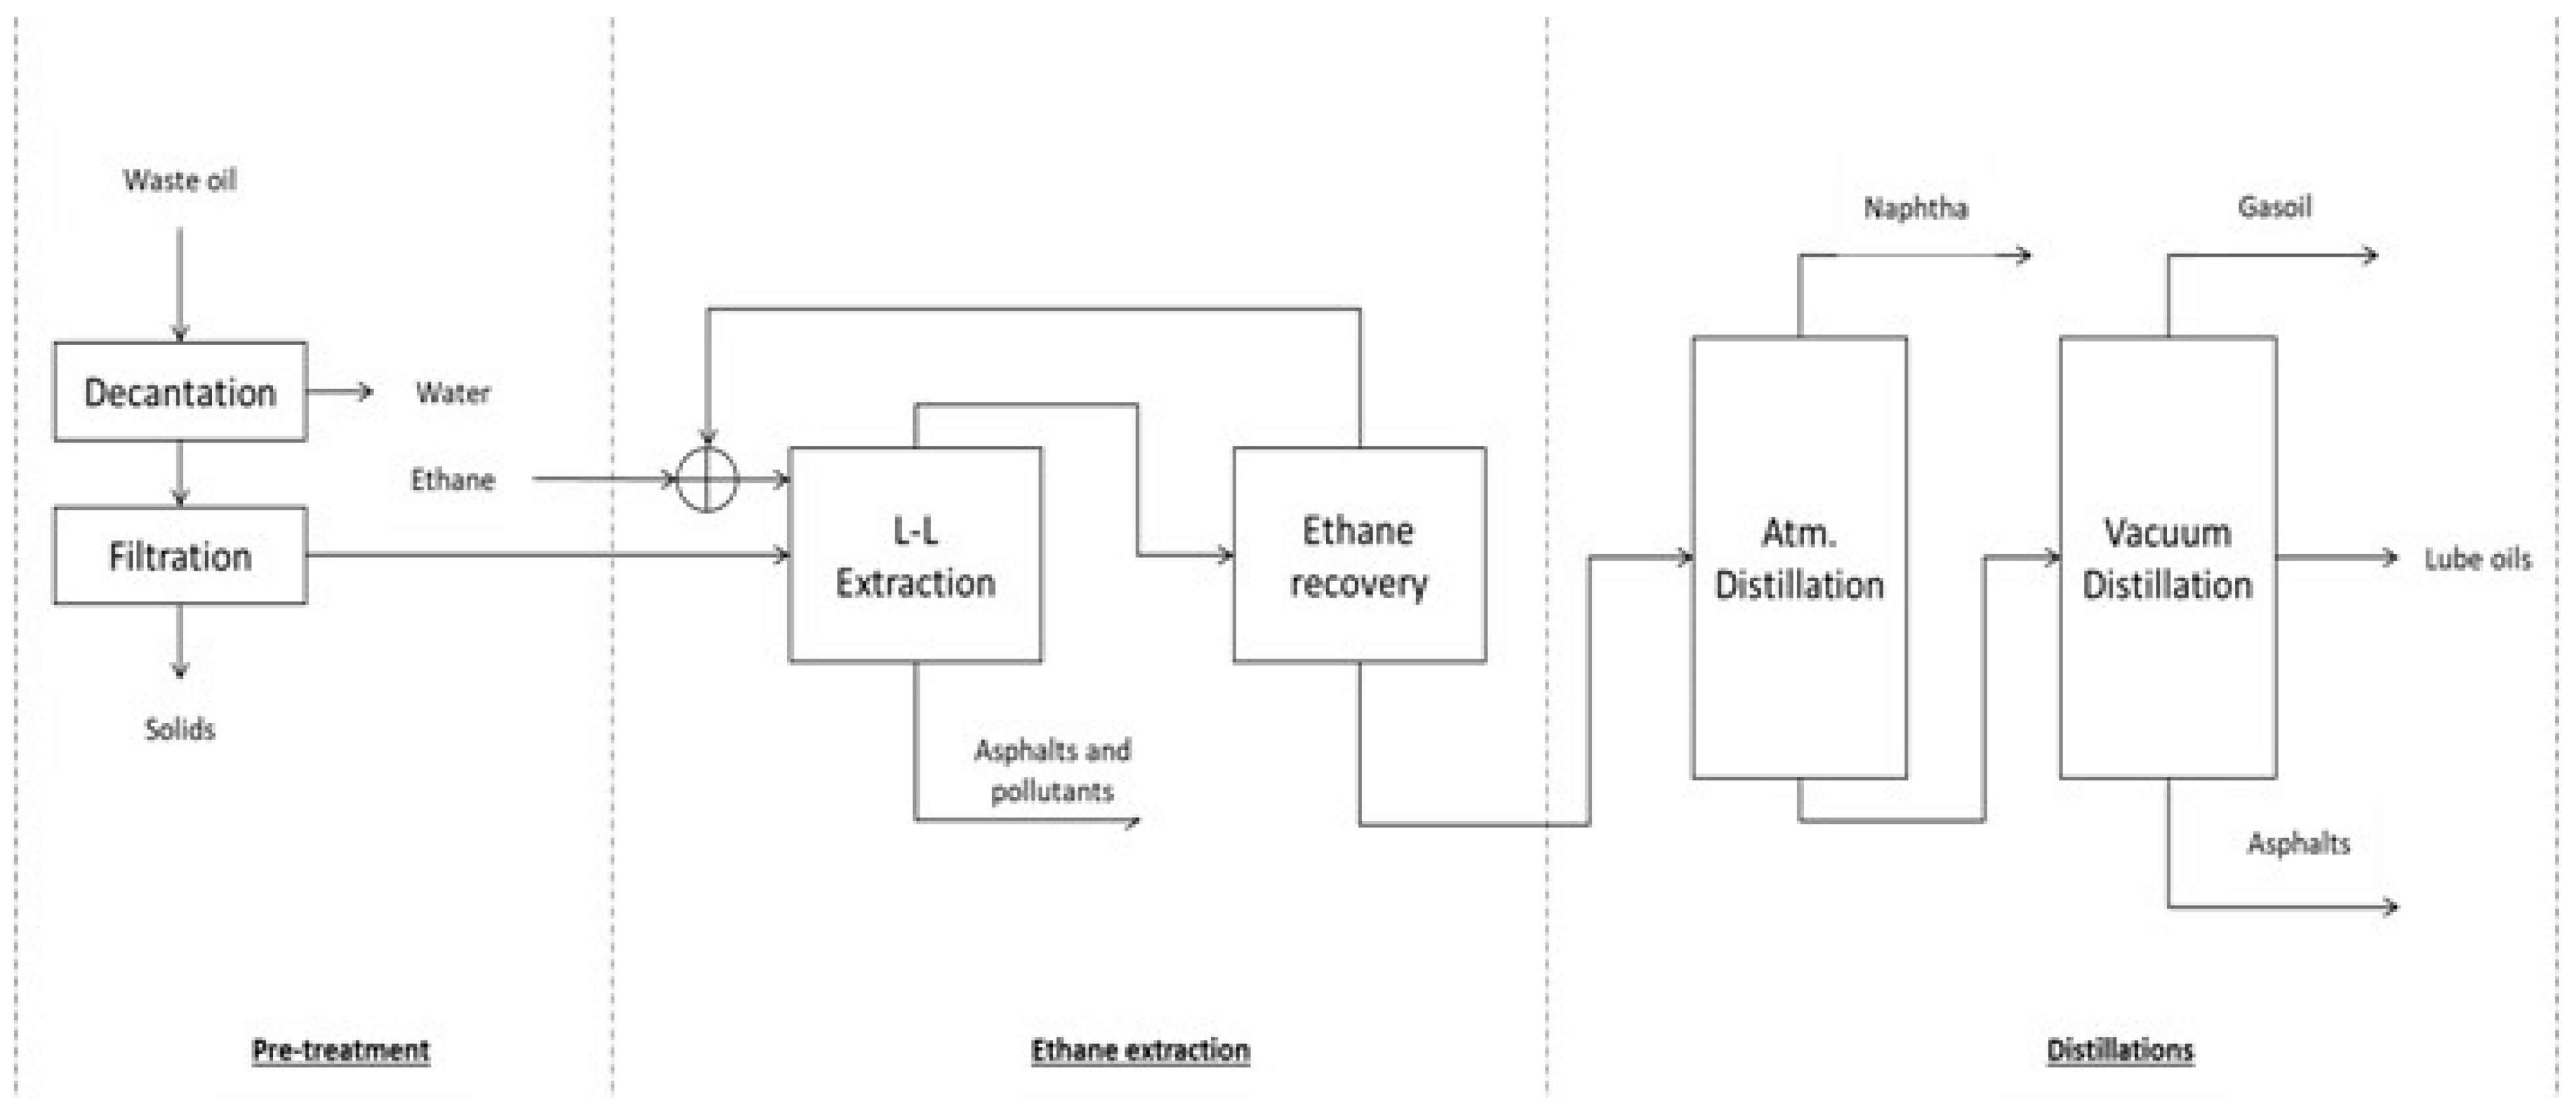
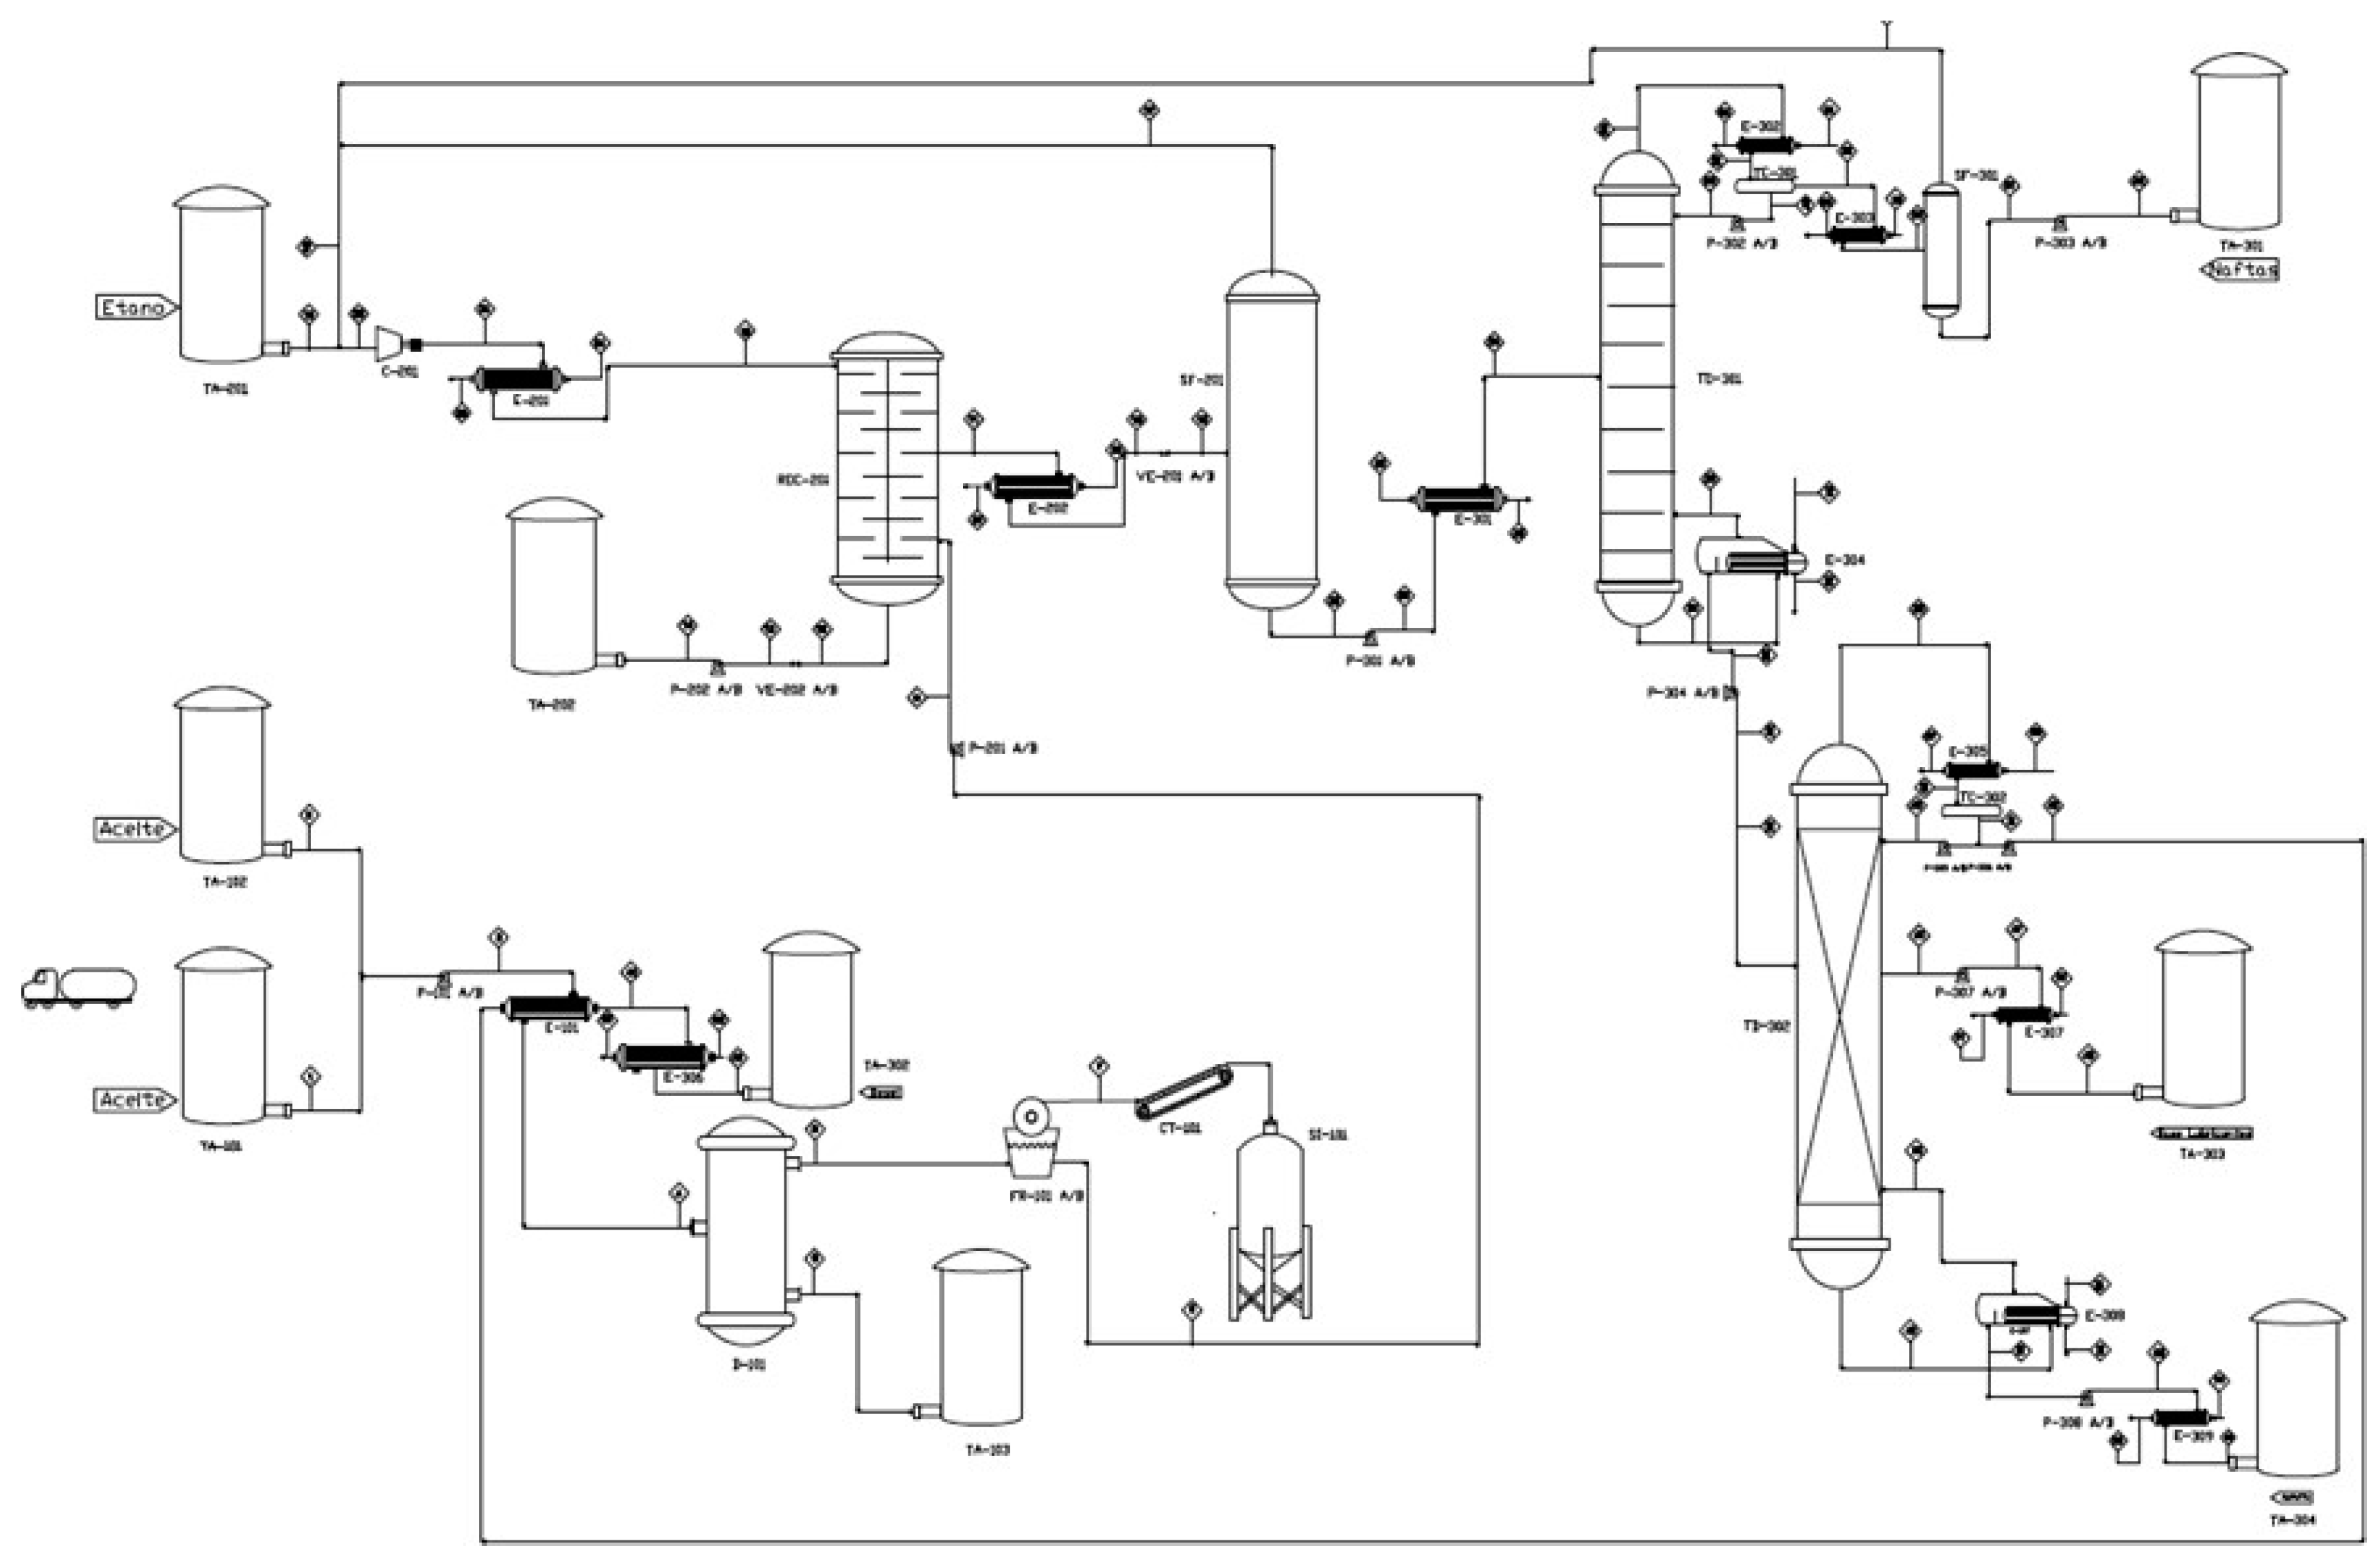
Pretreatment: to remove solids and water, waste oils are decanted and filtered.
-
Solvent extraction: Pollutants are taken apart from base oil by ethane extraction. A flash stage is added to ethane recovery, driving it again towards extraction.
-
Distillation: both atmospheric and vacuum distillation detach naphtha, products, and distillation residues.
(b) Spent solvents
Even though energy recovery is the easiest and fastest method to treat spent solvents, matter recovery is preferable due to the WMH. Often distillation is the technique used to separate the useful solvent from pollutants [37], and other techniques are posed such as pervaporation or centrifugation, if needed. Simple distillation is only posed depending on the original composition. The recovery process can be divided into two main sections [52].
-
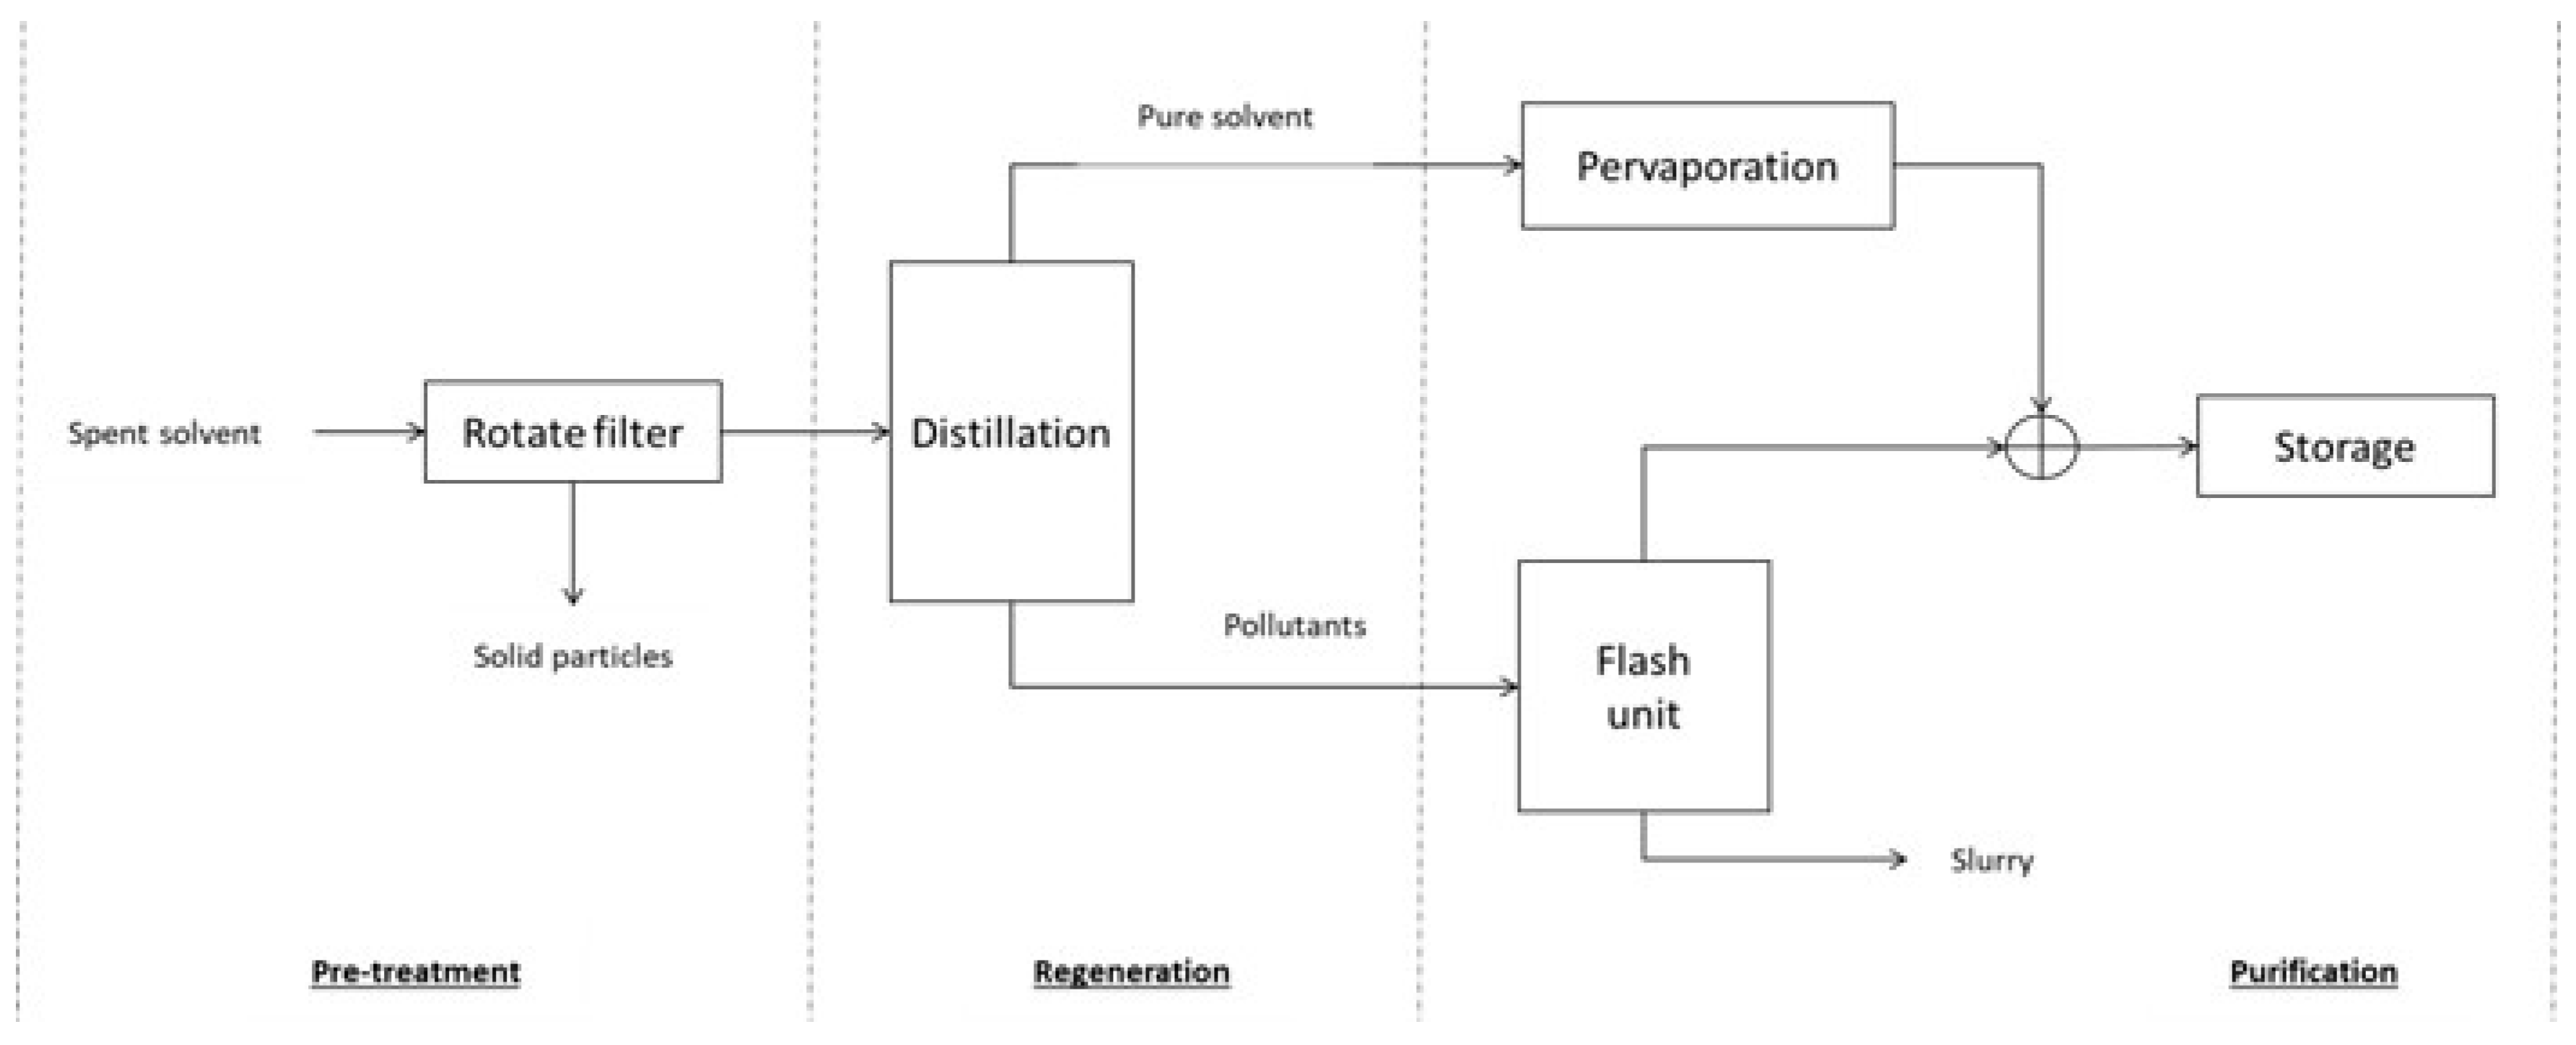
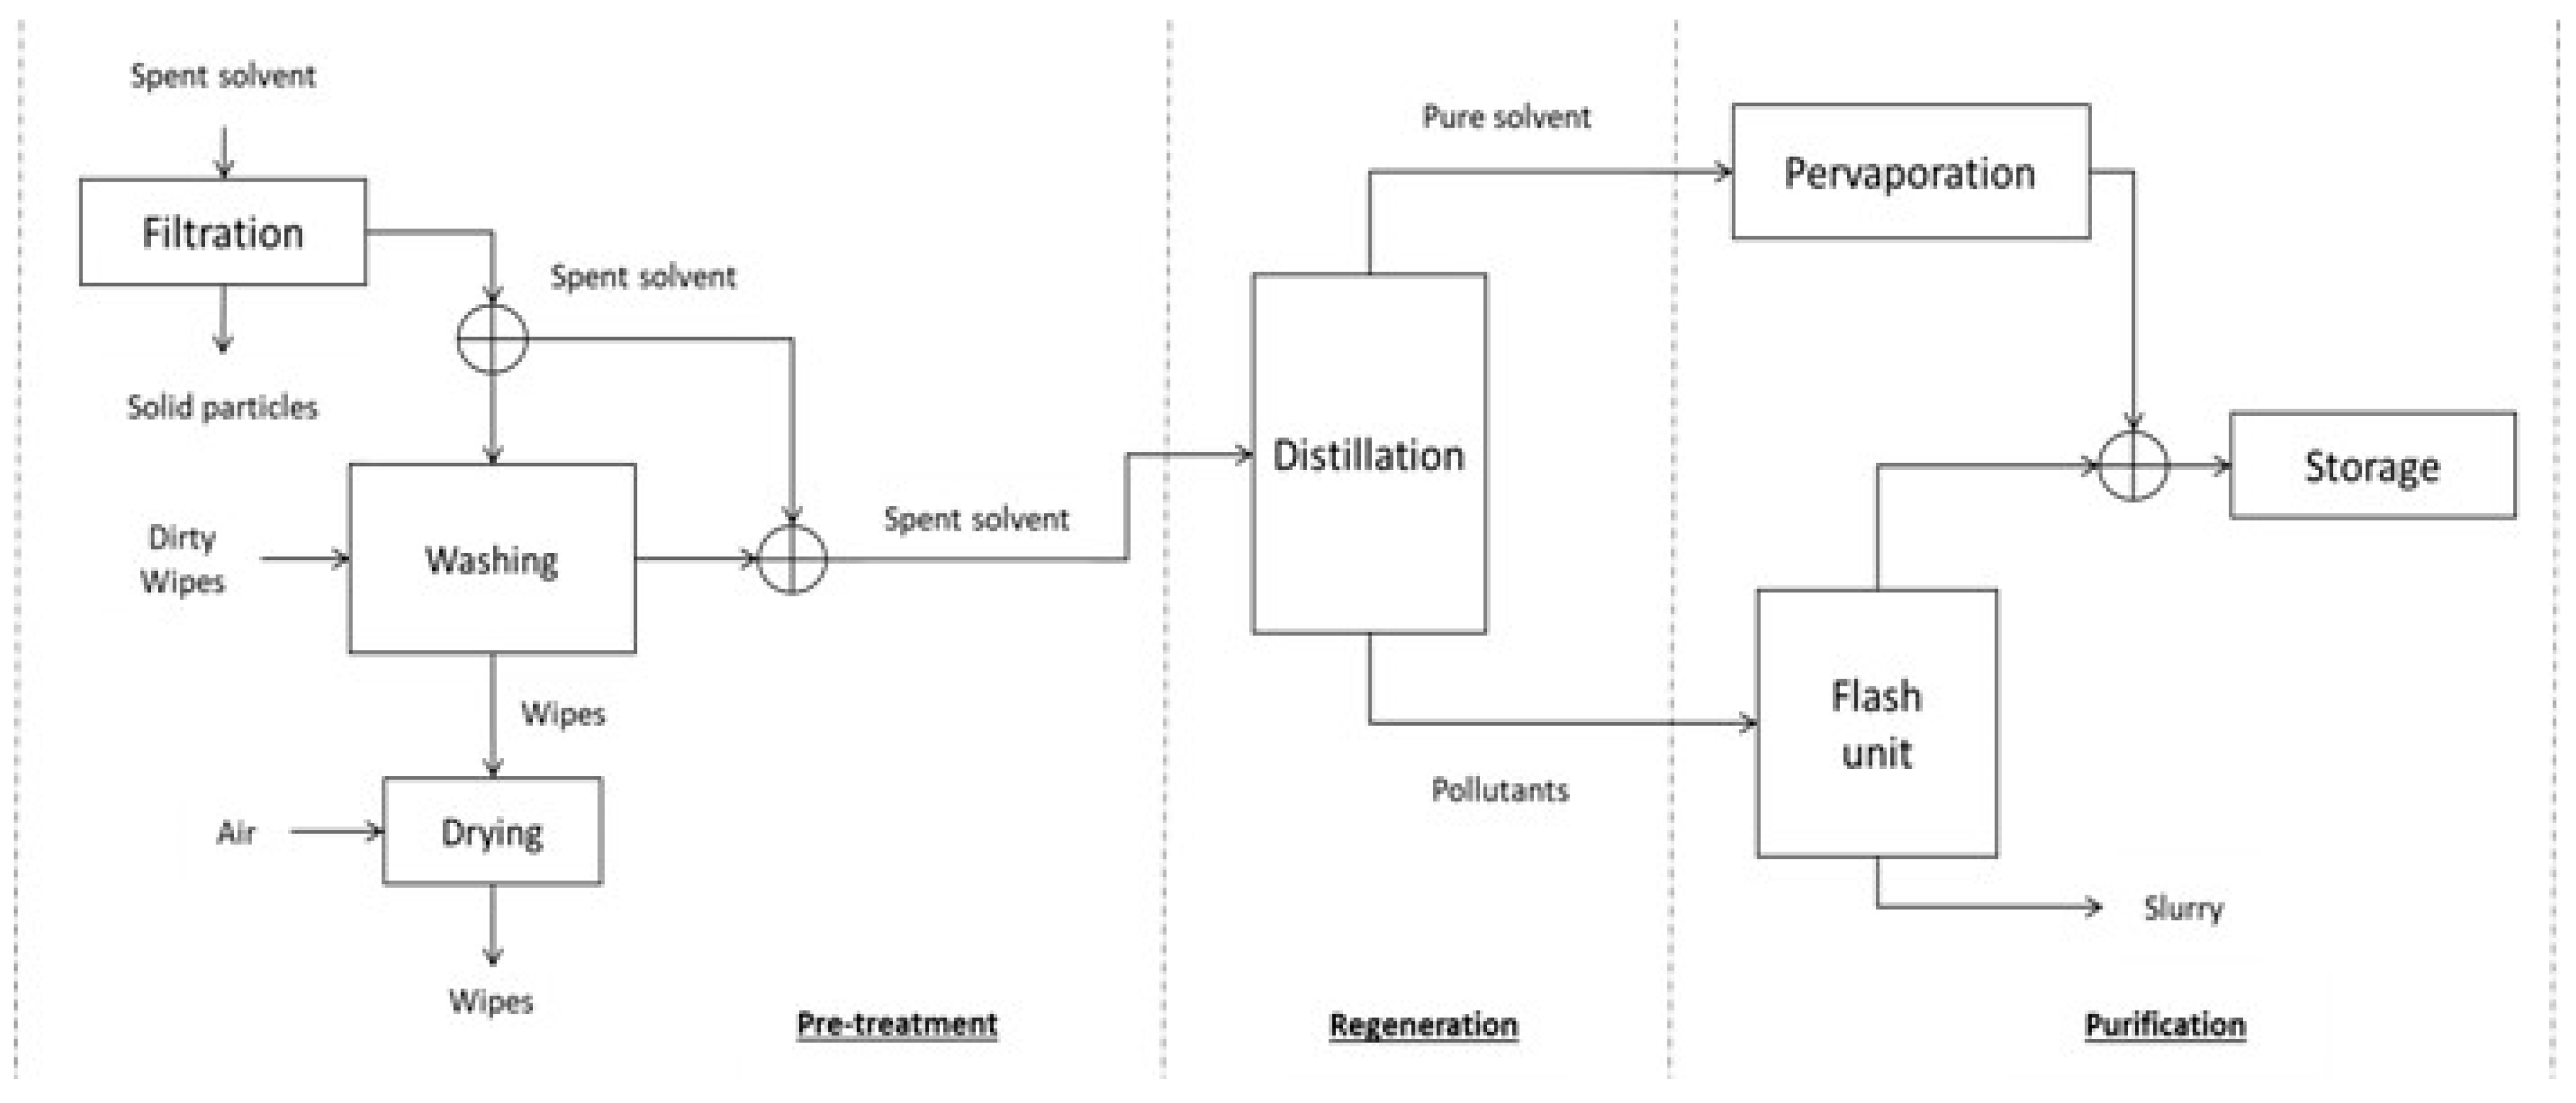
Pretreatment: separation of the solid particles from the original mixture by decantation process.
-
Regeneration: those pollutants are separated from the clean solvent by batch distillation.
Despite the solvent recovery, the process involves environmental impacts in which both resource consumption and emissions are included. Regarding resource consumption, the pump system and distillation step are the main consumers. Specifically, the distillation column needs a steam supply to warm-up components through indirect heating with a jacket. Electricity consumption per kilogram of waste solvent rises to 0.015 kWh. Either solvent storage or solvent vapours during distillation generate VOC emissions. In addition, those emissions from leaks and spillages are classified as fugues.
Pollutants and solid particles refer to components such as oils, greases, waxes, pigments, dissolved metals, or resins. Composition varies due to its origin. These residues represent about 30% of the initial flow [53].
However, another module can be added to the current process. Purifying operations contribute to enhancing the final product. The final process is shown in Figure 5. Purification includes two techniques from the material recovery approach: pervaporation and flash separation. The first consists of a membrane separation process, in which a fluid stream is selectively permeated through a dense membrane driven by a gradient in partial vapour pressure. On the other hand, flash separation aim is to separate solvent as vapour from pollutants, which release as a slurry at the bottom. These techniques involve both high selectivity and waste minimization.
(c) Battery waste
The first step to take advantage of battery waste is to recover its electrolyte by drainage. This solution must be purified by separating the valuable solution from Pb sulphate to obtain benefits, if possible, when sold back to producers. After that, solid waste undergoes crushing treatment when possible. Electrode paste must be taken apart as well as metals and plastics for proper management [40]. If the intermediate plant affords investment for technology requirements, metal recovery could be applied by either pyrometallurgical or hydrometallurgical treatment [54], the last one being the most suitable technique for environment quality. However, this is not always possible.
The procedure is explained in Figure 6, and the aim is to separate components by function of their nature so that profit becomes higher when sold.
(d) Dirty wipes
Although other treatment options have been evolving through recent years, solvent recovery from dirty wipes has become stuck. To prevent excessive use of solvent when cleaning, it is preferable to preimpregnate wipes before. In addition, the use of reusable wipes provides for wipes to return to producers despite generating a bigger amount of waste. Nevertheless, it is preferable to incinerate both disposable wipes and pollutants. Therefore, solvent recovery can be performed by centrifugation technique and matter recovery [41], this being a reliable and affordable technique for an intermediate waste plant.
There can be a process crossover between both spent solvents and dirty wipes’ recovery [55]. To remove impregnated solvent from dirty wipes, several processes are posed. Before wipes’ washing, the filtration separates those solid and heavy particles that would hinder the next operations. The washing operation takes out the solvents from dirty wipes for later recovery. Clean wipes are then driven to drying. Accordingly, these are ready to return to mechanical workshop waste producers (only if reusable wipes). The spent solvent stream goes to recovery, but this time as shown in Figure 7.

3.5.2. Quantitative Analysis for Waste Oils

The main objective of the process simulation is to obtain model data and flow information so that improvable points can be identified. To sum up, the system process is modelled by a process simulator.
Data collection: 30 tonnes per year (plant-specific documents) arrive at the intermediate plant to be managed but not treated. However, there are methods for waste oil treatment. It is assumed that waste oil composition for process simulation is composed of 5% polluted water, 5% heavy metals (mainly copper, zinc, and lead) and 90% hydrocarbons [6]. The Sener Interline process [37] is a commonly used resource for oil recovery due to the fact average recovery percentage (70–80%) allows this recovery to be a cost-effective one.
Modelling: Waste oil data are often taken from either Normal Boiling Point (NBP) curves or estimated compositions. In this work, the composition has been taken as an NBP from a case study on automotive oils [56]. Ethane is the used solvent [47]. The chosen fluid package is Peng–Robinson. Its cubic equation of state is used to calculate the fugacity coefficients, commonly applied in refinery and petrochemical applications [57].
It is assumed that metals are removed by solvent extraction operation as part of the bitumen. In the current model, solvent extraction is modelled as a liquid–liquid extractor that separates hydrocarbons and pollutants [6]. The reached extraction yield is 72% when defined conditions (p = 9802 kPa, T = 40 °C) are applied [47].
After solvent extraction operation, a flash unit recovers ethane from the base oil/ethane mixture to send it back to the L–L extractor. Likewise, the flash unit is modelled as a separator through which 99.9% of the solvent is recovered. Then, base oils are driven to a distillation column which operates at 300 °C and atmospheric pressure, so that lighter fractions or naphtha are recovered, employing a partial condenser. Specifically, 98.5% of naphtha is retrieved and the remaining ethane is separated [6]. Recovered ethane is fed back to the L–L extractor from both the flash unit and the first column.
Finally, atmospheric distillation residue goes to the vacuum distillation column which operates at 10 kPa pressure and 327.2 °C in the posed model. Three different fractions release from this column. Total condenser is assumed. The first fraction is a gas–oil distillate, whereas the intermediate fraction corresponds to base oil product. The remaining heavy fraction (bitumen) is also separated.
Besides described equipment, this model (Figure 8) includes heaters and coolers to set temperature, and pressure changers such as valves, compressors, and pumps.
Simulation: The model runs in a steady state making both energy and material balances for each block through a loop calculation. This method leads to lubricating oil recovery besides other valuable products (Table 4). High percentages of separation are achieved [6]. Releasing products are ready for use because there is no pollutant content.
Regarding energy consumption, 6.56 MJ/kg recovered oil is consumed in the process, so a high energy duty is required. The distillation module is the most consuming one, specifically atmospheric distillation. Besides this module, L–L extraction requires high energy too, because of the high pressures needed to obtain the optimal conditions. Despite these data, this alternative aims to recover products from waste, avoiding disposal options as shown in Figure 3.
Improvable flows identification: Results provided from waste oil recovery process simulation are analysed to identify the IF. These are inputs, outputs or internal flows highlighted in comparison to the rest [58]. Table 5 sorts those IF according to their type along with their description.
BAT proposal according to IF: candidate techniques in Table 3 are proposed to enhance the current process according to the identified IF.
-
Energy IF: Regarding fuel duty, energy recovery becomes a suitable technique to solve this problem. Either diesel oil or naphtha products can be used for combustion due to the fact it provides energy even though emissions increase. In addition, residue from vacuum distillation could be applied to energy integration so that other heaters decrease their energy requirements. Regarding the need for ethane compression, maybe the way to solve this problem is potentially carrying out L–L extraction at lower pressures. Specifically, SMEs may not have the chance to afford the costs of high pressures.
-
Material IF: Even though bitumen involves pollution, this can be a valuable product if it is used in paving. If so, producers (in this case the waste intermediate plant) deserve incentives to face this kind of residue. To minimize further emissions, proper storage operations must be carried out. The final Flow Diagram shows the scenario if these techniques would be applied. Base oil is sent back to producers along with recovered solvent. After being used in energy integration, bitumen flow is delivered to qualified managers. On the other hand, naphtha and diesel oil flows are invested into energy integration using combustion as fuel. In this case, the main objective is to reduce energy duty. It is assumed that decanted water and filtered solids remain dangerous for environmental waste.

3.5.3. Quantitative Analysis for Spent Solvents

Data collection: Owing to its different sources, the inlet spent solvent stream has variable composition and features [52]. In total, 200 tonnes per year (plant-specific documents) come to the waste intermediate plant, and often arrives from the printing industry too. Considering the features of the automotive industry, the composition of spent solvent is detailed in Table 6.
Modelling: The entire model is carried out by Gomez Miguez et al. (2012) [52]. At the beginning of the process, pretreatment consists of solid particles’ removal, so continuous filtration is required. To represent this step, a rotating filter is chosen. It is based on a mass balance where 100% of solid removal is posed. This means the process simulator is not used yet. The filter surface value is 0.25 m2 in this model.
In the next stage, the process simulator starts to be used. Inlet stream is a multicomponent saturated liquid whereby solid traces are negligible in distillation separation. Therefore, the inlet stream composition is 70% toluene, 20% acetone and 10% methanol, to ease the modelling task [52].
In this case, the UNIQUAC model (Universal Quasi-Chemical) is selected. Among others, this can be used to describe vapour–liquid equilibrium, liquid–liquid equilibrium and enthalpic behaviour of highly nonideal systems [57].
The distillation column is modelled considering previous tests with a short-cut column [52]. Total condenser is considered. The column’s separation efficacy reaches 75% so that toluene becomes almost null in the distillate. The optimal reflux ratio is 1.1. In addition, the optimal number of tower stages is 15, the feed-in being the 10th one. Since the flow is not quite high, the column is designed as a packed tower so that separation becomes higher.
In the final module, purification and both flash and pervaporation operations are carried out. The bottom’s stream from the distillation column goes to the flash separator before passing through a throttling valve. The feed is a vapour–liquid mixture whereby traces of heavy compounds represent 3% mole, their boiling temperature being 450 °C in the model [52]. Additionally, adiabatic process condition is considered.
Pervaporation operation cannot be implemented in the current process simulator. Thus, a membrane separation operation is suggested because it approximates to required behaviour. The aim is to break the methanol–acetone azeotrope from the distillate stream. Toluene content is negligible. Employing a polytetrafluoroethylene membrane, the system can break the azeotrope at 59 °C [52]. Enrichment factor β of 2.7 and selectivity α of 4.61 are required for the membrane.
The pervaporation system is based on modules in series disposition, to enhance membrane efficiency and avoid temperature drop. Both mass and energy balances are developed, so a four-module system is set. Permeate temperature is the dew point at the permeate vacuum pressure set at 60 mmHg. Between each module (2.03 m2 area needed for each one), heat exchangers are installed that raise the retentate temperature until its boiling point [52].
Simulation: The simulation is carried out in a steady state to obtain results for solvent recovery in the process. In decantation, 100% of solid retention is reached, so particles are stored apart until being delivered to final waste managers.
Improvable Flows Identification: The process simulation provides useful information for a better process. IF aids in applying techniques from the inventory in Table 3. At the time of making an IF inventory, its arrangement (Table 7) diverts energy resources and emissions.
BAT proposal according to IF: some candidate techniques in Table 3 are proposed to enhance the current process according to the identified IF.
-
Resource consumption: To reduce energy requirements, energy recovery in the form of energy integration could help. If waste oil recovery provides for enough fuel resources (diesel oil and naphtha), these can supply enough energy to fulfil energy requirements in the hotspots (both the distillation column and flash evaporator). Even so, if flash evaporator residues were environmentally suitable for being burned, these could aid in the same way as waste oil products. A further condition is that steam generation occurs without electricity as has been the case up to now.
-
VOCs emissions: Apart from emissions derived from vents, this problem is often brought on by leaks and spillages owing to either design deficiencies or wrong maintenance. Moreover, wrong storage practices can generate more emissions than necessary. For this, safe storage operations described in Table 3 must be carried out.

3.5.4. Quantitative Analysis for Battery Waste

Data collection: Around 20 tons per year of spent Pb-acid batteries (plant-specific documents) arrive at the waste intermediate plant. This residue is the main source in the production of secondary lead. For this, an effective way to chase the circularity of products is to disassemble batteries so segregation can provide for clean management. Table 8 shows the typical composition of lead-acid batteries [54], known as battery scrap when rejected by producers.
Incoming battery scrap needs proper segregation to become profitable. This task is often carried out by handling. At first, the battery cover gets drilled to allow for posterior draining and electrolyte release. After being drained, the electrolyte solution is decanted to separate it from impurities. The electrolyte solution may contain lead sulphate traces (low percentages), so this is a problem when trying to sell it.
Scrap battery goes ahead in the process. The next step is to saw off the cover and grids/cells which are mainly made of plastics (PP). When cleaned, plastics do not pose a danger so are labelled as nonhazardous waste. Finally, the last step is to segregate internal parts based on their nature, with PE, Pb and Pb paste being the remaining parts of the battery. It is assumed that the entire original quantity of the battery is properly separated and managed. See Figure 9.
Improvable Flows Identification: Although battery segregation provides profit opportunities, some IFs were identified (Table 9). The main issues were related to means to deal with the amount of battery waste. On the other hand, some problems come up owing to present impurities in products.
BAT proposal according to IF: some candidate techniques (Table 3) are proposed to enhance the current process according to the identified IFs.
-
Inlet battery waste amount: To make the process as profitable as possible, a well-designed machine must be developed so that process become automatic. This machine should include an enclosed conveyer as well as enclosed equipment and it must collect possible emissions. Different parts of the battery are properly collected and then stored.
-
Clean electrolyte: If electrolyte presents lead sulphate at the end of the process, it decreases its market price. For this reason, proper filtration must be posed. When this is not possible, a study must be conducted to derive electrolyte use to the production of gypsum or Na2SO4.
-
Segregation of Pb products: In the same way as clean electrolyte, Pb products could contain sulphates, which decreases the market price. To increase profits, a study must be carried out to pose the production of gypsum or Na2SO4. On the other hand, when costs can be affordable, another study would be aimed at the pyrometallurgical or hydrometallurgical process.

3.5.5. Quantitative Analysis for Dirty Wipes

Data collection: 70 tons per year of dirty wipes (plant-specific documents) arrive in the waste intermediate plant. About 40% of the content is spent solvent, usually applied by waste producers when cleaning and handling [6]. Regarding Figure 6, it is assumed that 100% of the solvent adsorbed in the wipes is removed and driven to decantation to start the spent solvent process. In this case, 28 tons per year of solvents are separated from dirty wipes. The remaining wipes are dried through an air supply. Finally, reusable wipes are ready to go back to producers.
Additionally, it is considered that adsorbed solvents have the same composition as spent solvents in Table 7 to ease the symbiosis achievement in this work. Therefore, the same efficiency (89%) is assumed as spent solvent’s recovery [52]. See Figure 9.
Improvable Flows Identification: selection of IF is performed (Table 10) according to those issues that come up when treating dirty wipes and are related to either energy consumption or emissions.
For BAT proposal according to IF, some candidate techniques in Table 3 are proposed to enhance the current process according to the identified IFs.
-
Inlet dirty wipes: Although it is not proven, reusable wipes’ usage is environmentally better than disposable ones, and industrial symbiosis cannot be reached in the other way. Currently, while the CE concept is growing, awareness and incentives may help to achieve only the use of reusable wipes. In addition, to reduce inlet solvent content in dirty wipes, manual cleaning with preimpregnated wipes should be the proper method for cleaning in producers’ activities.
-
Energy consumption: Due to the great amount of incoming dirty wipes, both washing and drying operations require energy consumption. A waste-stream-specific technique can be implemented. This consists of optimizing the spent solvent stream in addition to removing those absorbed in dirty wipes. In this way, the internal weight of the chamber and energy consumption will be reduced.
-
VOCs emissions: along with proposed techniques for “inlet dirty wipes”, safe operations of storage should be applied to decrease VOCs emissions flowing to the atmosphere.

3.6. Building the Symbiotic System
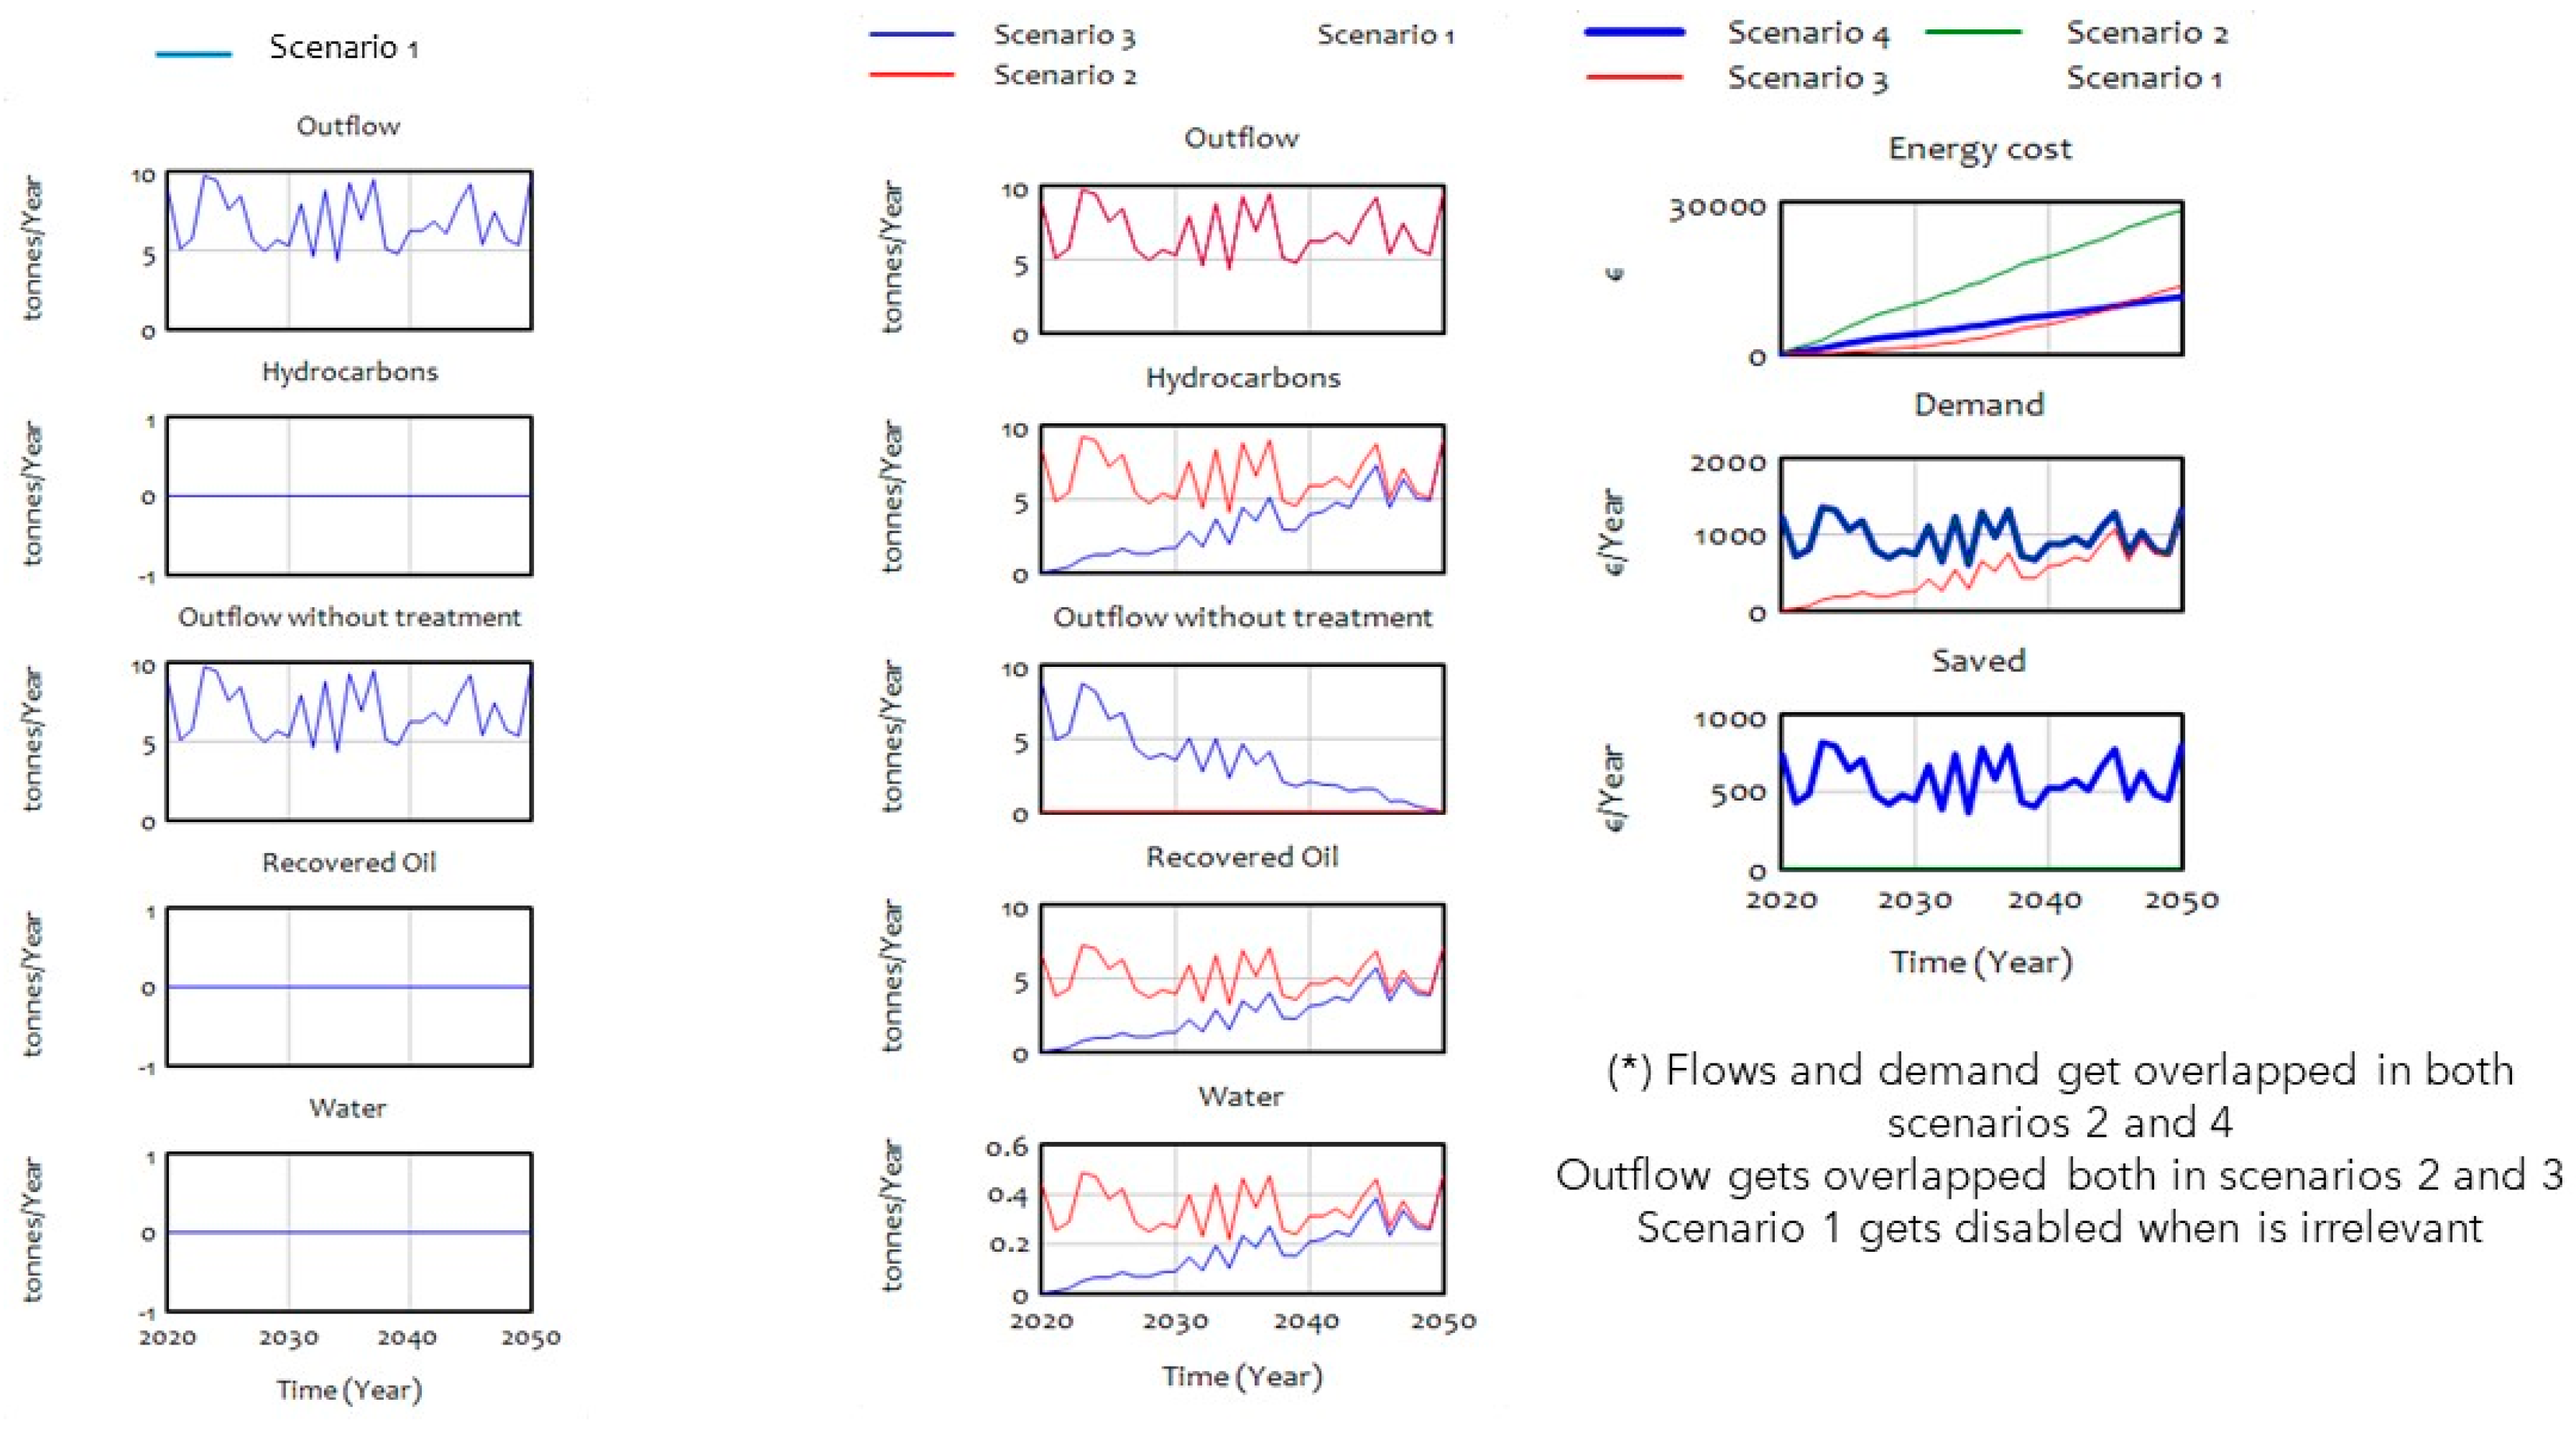
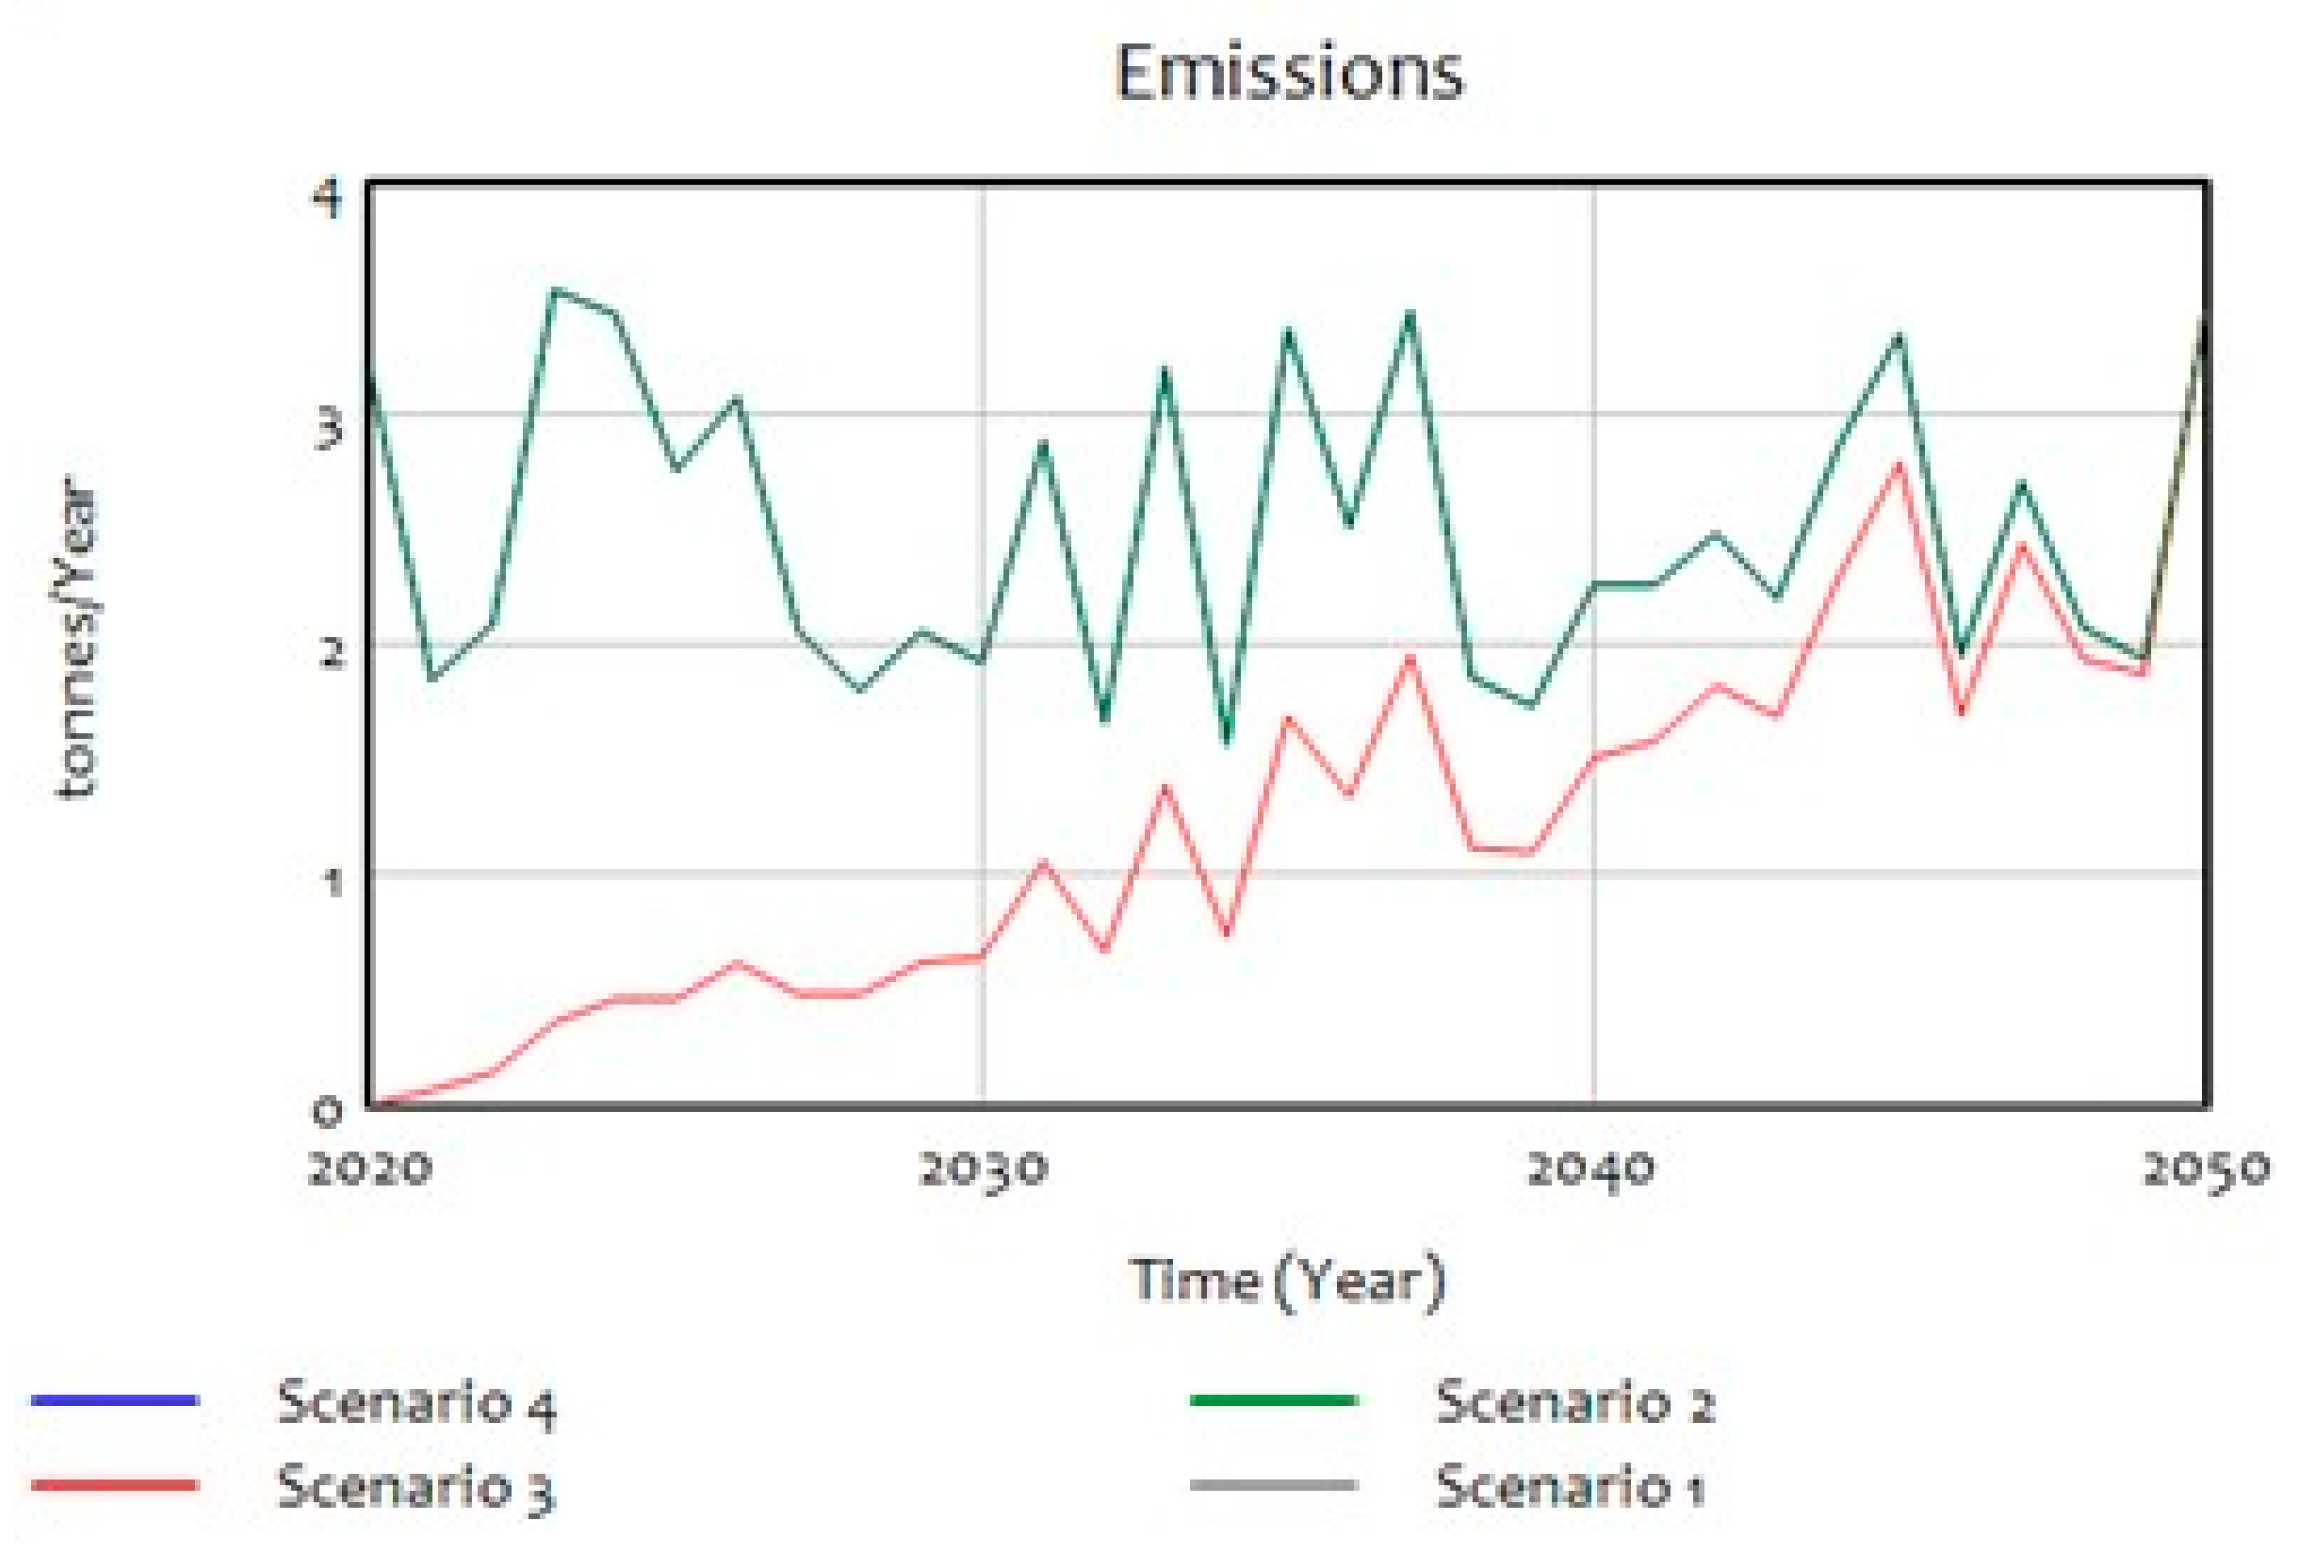
This section shows the performance of the quantitative analysis, the results of which indicate a reduction in hazardous waste. It is necessary to remember that only four wastes (used oils, used solvents, battery waste and dirty wipes) were chosen to develop the quantitative analysis. In addition, two of them (waste oil and waste solvent treatment processes) were simulated with a process simulator. Recovered lubricating oil, solvents and reusable wipes could go back to waste producers and provide revenue for the intermediate facility owner as well as power SRMs.

3.7. Dynamic MEFA

Among the wastes studied, only the used oils were subjected to a simulation within the Systems Dynamics approach.

Waste Oils Analysis

Every year, a countable amount of waste oils arrives at the intermediate plant that comes from waste producers. The used oils are then stored and sent to final waste managers. However, a treatment has been posed using process simulation, which provides some recovery yield estimates.
Waste oil inflows rarely describe a uniform trendline over time, but it changes yearly. This means waste oils’ management have a dynamic behaviour along the time horizon whose threshold addresses several years. To date, arriving waste oils have never been treated. So, the reference mode (current system behaviour) in this case is the nontreated waste oil amount that comes out of the plant regarding historic data.
However, there is limited space and time for storage within the plant and initial stocks must be considered. This takes relevance in waste or products outflows. Outflows depend directly on previous variables and are subjected to recovery values given by the process simulator. Consequently, product outflows also have a dynamic behaviour over time.
The main objective of the model is to pose different situations or scenarios based on known problems within waste oil management, so that flows’ (both inflows and outflows) and stocks’ (waste oil storage volume) dynamic behaviour are forecasted. This provides a rigorous outlook and awareness of the consequences when key parameters of the management vary. Finally, the best scenario should be implemented to the system as default.
The stock “Waste Oil Storage” represents the amount of waste oil inside the intermediate plant, so it is characterized by both flow (incoming and outcoming ones) dynamics and initial stocks. It is shown in Figure 10.
Inflow is represented by the “Inflow” variable. This variable depends on the Inlet rate. The “Inlet rate” variable poses a conditional formula to choose between both possibilities. “Lookup option” is the key parameter to define “Inlet rate”.
Outlet stream is represented by “Outflow”. When there is a lack of treatment for waste oils within the intermediate plant, the outflow is characterized by “Outflow without treatment”, meanwhile “Water” and “Hydrocarbons” are the main result of decantation when “Treated outflow” (this implies a treatment is done).
To split the amount of each decantation stream, “Decantation efficiency” manages this issue along with the “Water content” variable according to composition and decantation yield. When decantation has a lower value than 100% it is assumed that water joins the hydrocarbons.
Products from Sener Interline process leave from the “Hydrocarbons” variable using fraction/rate allocation with the converter variable’s so-called rates. These variables oversee splitting the final products according to the obtained values in the process simulation (with process simulator). Concretely, product outflows are naphtha, diesel oil, base oil, and bitumen, but only “Base Oil” is used now. In addition, the metal content of the initial waste oils is included in the bitumen flow.
“Emissions” refers to leaving CO2 in the plant because of waste oils. In the process simulation, the “Energy consumption” per recovered kilogram of oil was reported. By joining the “Emission factor” of fuel (diesel oil assumed as default) it is possible to obtain CO2 emissions annually.
“Energy cost” is typed as a level variable where the accumulation function reports the total cost of the energy supply if treatment is carried out. The current box involves two flows: “Demand” and “Saved” (EUR /year). The first one refers to the energy needed to carry out the waste oil treatment. Considering “Fuel PCI (Lower Heating Value)”, “Fuel density” and “Fuel price”, there is a chance to calculate this and “Saved” if any product from waste oil treatment could help to cover “Demand”.
Regarding parameter value estimation, the time horizon must be defined to obtain reliable results when the model is run. Configuration addresses the dates included between 2010 and 2019 because of available data about waste oil flows, thereby years become the Time Unit. Regarding Time Step, it is fixed at one.
Reference Mode is established according to historic data (Table 11). To date, waste oils had not been subjected to any treatment so “Outflow without treatment” gives representative information about current behaviour. To obtain the Reference Mode is enough to allocate it with a variable. Data are accompanied by PRTR (Pollutant Release and Transfer Register) values.
Sensitivity Analysis is used to check the model’s validity, and the parameters must be set with current values to represent reality. Due to the lack of data in some years, the Lookup variable ensures creation of a correlation between data and gaps.
“Treatment” value must be zero because no treatment has already been applied. Table 12 shows results for model validation with its implied variables.
Table 12 describes the current behaviour of the system. Incoming waste oils are stored in the plant and without any treatment leave the plant towards final waste oils managers.
To assess the model, sensitivity analysis allows checking the model’s behaviour to changes in the system. Some variables are acting as regulators. This means changes would turn around the model results. Hence, those variables are TIME STEP, Treatment, Decantation efficiency and “Base Oil rate”. The model is robust if historic data and initial parameters are respected.
The impacts of scenarios are based on techniques from Table 3. Once results have been obtained, these are assessed to see whether the posed scenario is suitable to be applied.
Scenario number 1 is characterized by doing nothing regarding current activity. It implies every waste oil amount is stored, labelled, and then leaves the intermediate plant towards final waste oil managers. Results (Figure 11) indicate that these two variables are equal. Waste oils amount varies from 4.3 to 10.0 tons per year. In addition, it is observed that treatment is not carried out because the value of water and hydrocarbons is zero.
Scenario number 2 allows for applying material recovery technique in Waste Oils block through the Sener Interline process. “Decantation efficiency” is set as an obtained value in process simulation (99.9%) and so is “Water content” (5%), which determines hydrocarbons/water proportion. Base Oil recovery is set as in Table 10. Results (Figure 11) again describe a random path. However this time, recovered products from the treatment are obtained. In the end, the “Outflow” value is the same as in the previous scenario, but this time “Outflow without treatment” has no value distinct from zero.
Scenario number 3 repeats scenario number 2 patterns. Unlike the last one, this scenario applies waste oil treatment progressively. Results are compared with the last scenario in Figure 11. The red line describes the Scenario 2 path meanwhile the blue one does so for Scenario 3. Notice that the “Outflow” variable is overlapped in both scenarios. In this scenario, divided flow starts at 0 tons/year because treatment is not applied. At every time step, these values increase until they achieve the same value as in Scenario number 2. This scenario reports fewer expenses than Scenario 2, but also fewer profits, as shown in Figure 11c. Regarding CO2 emissions (Figure 12), it is observed that this variable goes on with the same path as the other obtained flows.
Energy cost is higher in Scenario 2 than in Scenario 3, but profits are also lower. Although it implies a lower cost, the sale of recovered oil is not considered and here is the key to profitability. Notice that emissions in Scenario 2 and Scenario 4 are overlapped. There is no difference because the main change in the last one is that products are sent to energy recovery. Moreover, the trend line for Scenario 1 is at the bottom of the X-axis due to the fact there is no treatment. Assuming diesel oil is the employed fuel, its emission factor is considered at 74.1 kgCO2/GJPCI [59].
Scenario number 4 poses the chance to apply one of the techniques in Table 3. This time, energy recovery is applied using diesel oil valorisation to supply the energy waste that the oil process needs. Its density rounds to 832.5 kg/m3, and PCI reaches 43 GJ/ton [60]. Finally, the fuel price was fixed at the consulting moment (0.8 EUR /l). Results are detailed in Figure 11. Scenario 1 results were disabled because there are not any energy costs owing to treatment.
This time, recovered diesel oil is applied for energy recovery. This means the amount of bought fuel decreases, thus providing less cost. As shown in Figure 11, energy cost is the highest one in Scenario 2 when no product is recovered for energy demand. Scenarios 3 and 4 are similar because in the first one, treatment is carried out progressively. It is cheaper to apply the treatment since the beginning of the threshold time.
Regarding demand, Scenarios 2 and 4 are overlapped. Energy demand overpasses 1000 EUR /year in 2050 in both paths, but Scenario 3 involves lower profits. Finally, the saved window shows saved money due to diesel oil utilisation in energy recovery.

3.8. Life-Cycle Assessment (Between the Current Scenario and the Symbiotic One)

This study aims to compare the environmental impact between two scenarios in the hazardous waste intermediate plant. The first one refers to the current scenario in which symbiotic behaviour is only achieved using spent solvent distillation. On the other hand, the second scenario poses the symbiotic behaviour when selected residues are subjected to treatment.
The system (Figure 13) addresses those processes involved when materials are used by waste producers until residues leave the waste intermediate plant. The function of the system is to treat and manage the residues according to WMH to achieve symbiotic behaviour in the process throughout a year.
The functional unit is made up of the product system consisting of the tons of waste managed and the energy required.
Regarding system boundaries, the selected approach in this assessment is gate-to-gate. The first gate refers to the material used by waste producers, in this case, the mechanical workshops. On the other hand, the final gate is the limit where residues leave the intermediate plant towards the final waste managers. Nevertheless, energy and emissions due to the manufacturing of the product are also included to conduct a proper comparison.
Assumptions: Energy supply is provided either by diesel oil (waste oil recovery) or electricity (the rest of the processes). Containers’ material in which residue content is stored is negligible and uncertain. The annual amount of waste is determined by the last year which is registered into data.
Cut-off criteria:
  • Transport costs and their emissions are not included due to the lack of data. However, in some cases, these data are included because they are taken from a specific database. This will be justified when suitable.
  • Emissions because of internal machinery running are ruled out due to the lack of data.
  • Due to a lack of data, VOC emissions from waste management are ruled out.
  • Pumping and decantation energy consumption are ruled out due to the lack of data.
In terms of time, quality data requirements address the last annual period where data are available, in this case, it begins on 1 January 2019 and ends on 31 December 2019. Regarding the geographical situation, waste producers are scattered throughout Galicia’s territory, meanwhile, the intermediate plant is situated in a municipality in A Coruña.

3.8.1. Inventory Analysis (LCIA)

This part of the LCA collects data and calculation procedures to quantify important inputs and outputs in the product system. It also includes the utilisation of resources and emissions to soil, water, and air.
Both Table 13 and Table 14 represent data inventory compilations. The main selected residues’ (waste oil, spent solvent, battery waste and dirty wipes) inlet amount is taken from the last enterprise exercise of the intermediate plant in 2019.
In Scenario 1, outputs respond to the current situation whereby only spent solvents are treated by distillation. The recovery percentage is 65%. However, Scenario 2 expands the possibility of treatment to other residues. Recovery yields and compositions are taken from quantitative analysis.
The main concept is that recycled residues behave as a feedback stream that returns to the mechanical workshops. Thus, these facilities have the chance to buy recycled products instead of raw ones so that the circularity of the products becomes closer. Finally, new products from raw materials are obtained as the difference between residue data in 2019 (“Total” streams) and the feedback (SRMs).
Additionally, other parameters must be considered. Energy flows are also included within the system boundaries. Waste oil treatment is carried out using fuel combustion (diesel oil) to generate steam which provides heat in a boiler. Therefore, energy supply must be calculated so a necessary parameter is the energy per treated kilogram of waste. Moreover, if this one multiplies the emission factor of the fuel and the waste amount, then is possible to calculate the emissions of CO2 in kilograms. The considered emission factor is 74.1 kg CO2/GJPCI [59].
Unlike in the waste oil treatment, electricity is the energy source for the rest of the residue’s treatments. Fuel-oil emission factor 77.4 kg CO2/GJPCI is assumed [59].
As for the breaking down of battery waste, it is assumed that consumption reaches 260 kWh per 5 MTPH (metric tonnes per hour). This value is taken from a commercial complex device [61] that is widely used in secondary lead recycling. The principle of the current system is to crush the battery waste in a closed chamber using the impact of rotating hammers and the separation of heavy material from lighter material employing a sink and float mechanism.
Regarding energy and emissions in the manufacture of the products:
Waste oils: Available database does not provide enough data about lubricant/base oils processing. Hence, heavy fuel oil data are used instead, owing to proximity.
Spent solvents: Unlike in the other residues, the software database has not had any information about the components. Therefore, this information is searched for outside. As for the methanol, its production is assumed as 33 GJ/ton [62]. On the other hand, collected data from toluene and acetone are based on their carbon dioxide kilogram emissions per compound kilogram production, at 1.8 and 1.79, respectively. These values were calculated thanks to the SimaPro software database whose data belong to Boustead Consulting.
Batteries: Production of lead refers to both primary and secondary lead production in the software database. It is obtained either from batteries’ recycling or mining. In the same database, it is possible to find out procedures to manufacture plastics. However, the only available sources are related to granulate plastics (PP and PE). It is assumed that energy consumption and emissions are similar. Finally, energy consumption for sulphuric acid processing rises to 2.7 GJ/ton H2SO4 (ESA and EFMA).
Dirty wipes: Evidently, the software database includes neither treatment operations nor processing activities for wipes. Therefore, the wipes are supposed to be renewable, and the composition is a kind of natural kenaf fibre. Consumption rises to 15 MJ/kg when manufactured and 15% when treated [63].

3.8.2. Life-Cycle Impact Assessment

This assessment is aimed to evaluate environmental impact potential through life-cycle inventory analysis results. Impact assessment is carried out by the software when LCIA methods are allocated to calculate impacts.
OpenLCA LCIA methods were imported to the database. Both scenarios are put into the same project to carry on with the comparison using the CML Baseline 2015 method. The selected impact categories were Climate Change and Human Toxicity (Figure 14) and (Table 15) are shown below.
Regarding climate change, the released quantity in scenario number 1 (Table 15) almost doubles the emissions in scenario number 2 (Table 15).
Regarding human toxicity, emissions related to Scenario 1 are almost double the emissions of Scenario 2.

4. Results and Discussion

The system which is subjected to an integrated study is performed by two stakeholders within the automotive industry in Galicia. The first one refers to waste producers whose activities can be summed up into four main blocks as seen in Figure 1. It was not possible to quantify the accurate number of enterprises involved. The other stakeholder is a hazardous waste intermediate management plant that currently only carries out two treatments, compaction and distillation for compactable solids and spent solvents, respectively.
To simplify the study, four residues were chosen (waste oil, spent solvent, battery waste and dirty wipes) to investigate the availability of the circularity of products within the sector. Altogether, 320 tons per year of hazardous waste were subjected to be studied.
The developed inventory to gather all candidate techniques contains 32 identified techniques. These were found out from different sources such as Best Environmental Management Practices (BEMPs), Best Available Techniques Reference Document (BREF) and others.
Stakeholders take relevance since it does not make sense to propose any technique that cannot be applied either in mechanical workshops or in the intermediate facility. Even so, a wide techniques inventory provides an outlook of the treatment possibilities and prevention. BEMPs can be carried out by mechanical workshops with the aim of waste prevention, but it is further useful to encourage them either with awareness or with incentives. If more data were available, such as the number of truck journeys, distances among every facility and so on, other parameters would have been considered when modelling and in the LCA. By the time the intermediate facility owner agreed to attend, it was easier to comprehend how the waste management process is carried out. Suggested treatment processes for each residue address matter and energy recovery within the inventory. The plant-specific documents show that 861.2 ton/year of hazardous waste are managed within the intermediate plant.
As for the selected residues, just two of them (waste oils and spent solvents) were subjected to a process simulation due to their nature. On the other hand, battery waste and dirty wipes were not able to undergo a simulation, so recovery percentages were set by literature references.
Waste oil’s main recovery product is lubricating base oil, followed by bitumen and diesel oil. In a lower quantity, naphtha represents 3.72% of the products. Energy consumption per recovered kg is 6.56 MJ. High percentages of separation are achieved [6]. Water is almost totally (99.9%) separated by decantation and the remaining water is removed by the flash unit. In addition, ethane recovery reaches 99.95% which is sent back towards the L–L extraction. More than 62% of bitumen is removed because the use of ethane instead of propane as a solvent provides high recovery rates. The remaining bitumen is removed by a vacuum distillation column. Released products are ready for use because there is no pollutant content. To sum up, according to calculations, 70.5% of the initial waste oil flow become recovered oil. The rest of the products can be utilised for other uses. See Figure 9.
In future studies, other settings would lead to better recovery percentages. However, this also supposes a huge energy cost. Two IFs were identified: energy consumption (could be fixed by energy integration) and matter flow (further products can be managed to obtain revenues).
Spent solvents’ recovery percentage reaches 89.0% in the considered composition when modelling. Furthermore, 100% of solid retention is reached in decantation so that particles are stored apart until being delivered to final waste managers. Afterwards, the distillation column achieves 75% efficiency [52]. As a consequence, distillate becomes rich in acetone (65%), so the residue stream is enriched in toluene (95%) [52]. The first one feeds the pervaporation step whereby the solvent product becomes cleaner. On the other hand, the flash unit operates at 10 kPa and 115.5 °C. Outlet vapour stream mole composition shows 97% toluene and 3% acetone, meanwhile, liquid stream shows 20% toluene and heavy components make up the rest. As a result, total solvent recovery performance reaches 89% of the spent solvent feed stream [52]. See Figure 9.
In this way, the modelled process provides for a better recovery rate than the current one, where 35% of the spent solvent is refused. Two IFs were identified: energy consumption (again could be fixed by energy integration) and VOCs emissions (only safe operations and practices could solve this issue).
For battery waste it is assumed that the recovery is total. However, some items such as Pb paste must be managed by other enterprises to be retrieved as SRM. Three IFs were identified: inlet amount (a specific machine must be installed), the impurities of the electrolyte and the handicap to sell sulphated products.
For dirty wipes, 40.0% of the weight corresponds to the attached solvent which is distilled afterwards along with the other spent solvents. It is assumed that no wipes are rejected. Even so, three IFs were identified: using reusable wipes involves a higher volume of them, the energy consumption both in washing and drying, and VOCs emissions (good and safe practices must be carried out).
Waste oils were subjected to a simulation within the system dynamics approach. Four scenarios were posed, the fourth one being the most suitable to apply:
  • Doing nothing. No changes are observed.
  • To apply the Sener Interline process to recover the lubricating base oil and other products. By the first time, there is the chance to obtain revenues.
  • The same pattern as the last one. However, the application of the recovery process is progressive. Lower cost is observed except in the long term, but also lower revenues.
  • Using recovered diesel oil as fuel, which provides a 60.36% energy cost saving. Here, both the matter and energy recovery techniques are used from the inventory.
The final report shows that scenario 4 becomes the most suitable option to enhance the current intermediate plant situation. Therefore, it means that IFs in waste oil management have been improved using techniques from BATs inventory. Common issues in industry and management refer to energy consumption and matter disposal, as seen in previous IF’s tables. Waste oil treatment provides profits by selling recovered oil and savings if diesel oil is utilised as fuel in waste oil treatment. The dynamic model shows which is the best scenario to achieve circularity.
Dynamic models should be developed regarding spent solvents [55], waste batteries, dirty wipes and waste oils. According to the same approaches and philosophies, those models will be able to forecast the future flows and stocks within the intermediate plant [20] so that the most suitable techniques could be chosen and applied afterwards. The flows and stocks model along with a system dynamics approach has proven the importance of the dynamic analysis. Through different scenarios, it is possible to forecast amounts, emissions and costs related to waste oil treatment. Cost estimation calculates savings in the energy bill of 60.36% up to 2050 when diesel oil is used as an energy resource.
Finally, beneath the instructions of the ISO 14040 norm, a comparison within an LCA between the current scenario and the symbiotic one is proposed, focusing on two categories: climate change and human toxicity. Regarding climate change, the released quantity in scenario number 1 (Table 15) almost doubles the emissions of scenario number 2 (Table 15). This is the main consequence of adopting the CE approach in which a closed loop returns recycled products to mechanical workshops so that facilities avoid buying new products. Furthermore, recycled products could be cheaper than the new ones and create a stronger link between stakeholders. Similar behaviour is found regarding human toxicity. In the same manner as before, emissions related to Scenario 1 almost double the emissions of Scenario 2. This means that the CE approach also contributes positively to human health. The symbiotic scenario collects all the guidelines in the work and reports a carbon dioxide emission drop of 47.83% (climate change category) and a drop of 44.97% in 1–4-dichlorobenzene within the human toxicity category. LCA shows how the circularity of products could aid in achieving a reduction in resources.
It is proven that waste treatment contributes to reducing emissions and provides revenues to the facility’s owner. The revenues would be even higher if the facility were able to treat battery waste completely. Likely, these results could be subjected to improvement due to the fact the chosen database is limited, so several data had to be taken from outside. Moreover, a cost estimation could be conducted with another database or by adding values into the current inventories. Additionally, the current database is quite scarce regarding chemical compounds’ processing, besides refinery fractions. As for the industrial symbiosis, the LCA shows how the reduction in raw materials is contributing to but maintaining the links between supply chain and manufacturing processes [23].
The collection and study of different approaches and tools provide the possibility to forecast a symbiotic behaviour within the considered system.
Figure 1 explains the demands of the mechanical workshops as one of the stakeholders. Despite no values being entered, the main objective is to be aware of both the mechanical facilities demands and the generated waste. Once accomplished, the other stakeholder takes relevance. As for the waste treatment, only spent solvents’ processing is carried out, and its performance reaches 65% of solvent recovery. Accordingly, hazardous waste is subjected to a weight reduction of 15%. Thus, the aim is to improve the recovery performance, expanding the approach to other residues.
It is possible to propose BATs and to look for current ways to manage the residues to achieve circularity. In the long term, the facility will likely be able to acquire more surface and equipment to manage more residues. However, currently, only spent solvents and containers can be managed indoors. These results show an outlook towards the symbiotic behaviour within the selected process, if we can understand how the different approaches and tools contribute to getting closer to the end of waste. Firstly, quantitative analysis was developed considering the amounts of the plant-specific documents. Secondly, involved parameters in process simulation could change when put into practice on a pilot scale or in a real scenario. Otherwise, shown data are reliable enough to observe that the circularity of products is feasible as well as the efficiency of the different approaches and tools.

5. Conclusions

Combining different approaches and tools allows us to develop an integrated study that provides an empirical outlook on the achieved circularity between two stakeholders. IPPC-WMH-CE philosophies assist in carrying out the end-of-waste criteria. The importance of stakeholders’ relationship is noticeable. The identification of matter flows and candidate techniques enhances the entire process, and simulation provides the chance to identify hotspots.
The impact assessment reports that the circularity provides a better scenario than the current one. WMH establishes the priorities in waste management so that the most suitable technique (IPPC philosophy) among others gets selected.
Currently, 65% of the spent solvents are recovered. The automotive industry seems to be closer to circularity of the products used in mechanical workshops.
The process simulation and the entire quantitative process led to pointing out 10 Ifs, where those related to both material and energy recovery can be subjected to a posterior analysis employing other tools. Therefore, a reduction of 33.4% (considering all the residues in the inventory) was achieved according to the inventory of the plant-specific documents.
The system dynamics approach is relevant for waste oils’ treatment. Unlike without treatment, waste oil processing leads to revenues and even savings if the diesel oil product is applied as fuel, as seen in scenario 4.
The LCA simplified the approach of the symbiotic behaviour of the process through two scenarios: symbiotic and nonsymbiotic ones. Results pointed out that symbiosis behaviour involves almost a 50% CO2 emissions reduction when some treated residues were turned back to mechanical workshops.
To sum up, used tools and adopted approaches have provided an outlook on the circularity of the products between the stakeholders. Many of the treated residues were recovered as products, carrying out the philosophy of the end-of-waste criteria which allow the material to be marketed for use as a “product”. Both the mechanical workshops and the intermediate waste plant will adopt measures in accordance with these results over a long-term period. These procedures could also be exported to other sectors with the aim of applying end-of-waste criteria.

Author Contributions

Conceptualization, A.F.L., D.V.S. and P.M.B.B.; methodology, A.F.L., D.V.S. and P.M.B.B.; software, A.F.L. and D.V.S.; validation, A.F.L. and D.V.S.; investigation, A.F.L., D.V.S. and P.M.B.B.; data curation, A.F.L. and D.V.S.; writing—original draft preparation, A.F.L. and D.V.S.; writing—review and editing, A.F.L., D.V.S. and P.M.B.B.; supervision, P.M.B.B. All authors have read and agreed to the published version of the manuscript.

Funding

This research received no external funding.

Data Availability Statement

The data presented in this study are available on request from the corresponding author. The data are not publicly available due to confidentiality reasons of the case study company.

Conflicts of Interest

The authors declare no conflict of interest.

Abbreviations

BATAvailable Techniques
BEMPBest Environmental Management Practice
BREFBest Available Techniques Reference Document
CECircular Economy
ELCD-JRCEuropean reference Life Cycle Database of the Joint Research Centre
EUEuropean Union
IFImprovable Flow
IPPCIntegrated Pollution Prevention and Control
ISOInternational Organisation of Standardization
LCALife-Cycle Assessment: Life-Cycle Impact Assessment
LCTLife-Cycle Thinking
MEFAMaterial and Energy Flows Analysis
MTPHMetric tonnes per hour
NACEStatistical Classification of Economic Activities in the European Community
NBPNormal Boiling Point
PMParticulate Matter
PRTRPollutant Release and Transfer Register
SDSystem Dynamics
SMESmall- and Medium-sized Enterprise
SRMSecondary Raw Material
VOCVolatile Organic Compound
WMHWaste Management Hierarchy
WWTPWastewater Treatment Plant

References

  1. Iqbal, S.; Naz, T.; Abdul Sattar, M. Challenges and opportunities linked with waste management under global perspective: A mini review. J. Qual. Assur. Agric. Sci. 2021, 1, 9–13. [Google Scholar]
  2. European Union. Directive 2008/98/EC of the European Parliament and of the Council of 19 November 2008 on waste and repealing certain directives. Off. J. Eur. Union 2008, 34, 99–126. [Google Scholar]
  3. European Commission. COM/2015/0614 final: Communication from the Commission to the European Parliament, the council, the European economic and social committee, and the committee of the regions. Closing the loop—An EU action plan for the Circular Economy. Off. J. Eur. Union. 2015, 614, 11. [Google Scholar]
  4. European Union. Directive (EU) 2018/851 of the European parliament and of the council of 30 May 2018 amending Directive 2008/98/EC on waste. Off. J. Eur. Union 2018, 150, 109–140. [Google Scholar]
  5. European Commission. Commission Recommendation of 6 May 2003 concerning the definition of micro, small and medium-sized enterprises. Off. J. Eur. Union 2003, 88, 39–40. [Google Scholar]
  6. Andrade, L.C.; Míguez, C.G.; Gómez, M.T.; Bugallo, P.B. Management strategy for hazardous waste from atomised SME: Application to the printing industry. J. Clean. Prod. 2012, 35, 214–229. [Google Scholar] [CrossRef]
  7. Inghels, D.; Dullaert, W. An analysis of household waste management policy using system dynamics modelling. Waste Manag. Res. 2011, 29, 351–370. [Google Scholar] [CrossRef]
  8. Konyalioğlu, A.K.; Bereketli Zafeirakopoulos, I. An integrated model of system dynamics and fuzzy cognitive mapping approach for waste management in Turkey. Glob. Nest J. 2019, 21, 539–545. [Google Scholar]
  9. Guo, Q.; Wang, E.; Nie, Y.; Shen, J. Profit or environment? A system dynamic model analysis of waste electrical and electronic equipment management system in China. J. Clean. Prod. 2018, 194, 34–42. [Google Scholar] [CrossRef] [Green Version]
  10. Yao, L.; Liu, T.; Chen, X.; Mahdi, M.; Ni, J. An integrated method of life-cycle assessment and system dynamics for waste mobile phone management and recycling in China. J. Clean. Prod. 2018, 187, 852–862. [Google Scholar] [CrossRef]
  11. Wang, C.-S.; Chou, T.-H. Personal Computer Waste Management Process in Taiwan via System Dynamics Perspective. In Proceedings of the International Conference on New Trends in Information and Service Science (NISS 2009), Beijing, China, 30 June–2 July 2009; p. 1227. [Google Scholar]
  12. Babalola, M.A. A System Dynamics-Based Approach to Help Understand the Role of Food and Biodegradable Waste Management in Respect of Municipal Waste Management Systems. Sustainability 2019, 11, 3456. [Google Scholar] [CrossRef] [Green Version]
  13. Plaček, M.; Půček, M.; Čurda, S. The Utilization of System Dynamics in the Environment: An Example of Waste Management from the City of Znojmo. Lex Localis J. Local Self-Gov. 2015, 13, 205–227. [Google Scholar] [CrossRef]
  14. Mitropoulos, P.; Giannikos, I.; Mitropoulos, I.; Adamides, E. Developing an integrated solid waste management system in western Greece: A dynamic location analysis. Int. Trans. Oper. Res. 2009, 16, 391–407. [Google Scholar] [CrossRef]
  15. Biedugnis, S.; Smolarkiewicz, M.; Podwojci, P. Regional optimization model for system of municipal waste management in dynamic version—Evaluation of relationships among input and output model parameters. In Proceedings of the VI National Polish Scientific Conference on Complex and Detailed Problems of Environmental Engineering, Koszalin, Poland, January 2003; pp. 683–699. [Google Scholar]
  16. Kubanza, N.S.; Simatele, D. Sustainable solid waste management in sub-Saharan African cities: Application of system thinking and system dynamic as methodological imperatives in Kinshasa, the Democratic Republic of Congo. Local Environ. 2018, 23, 220–238. [Google Scholar] [CrossRef]
  17. Kollikkathara, N.; Feng, H.; Yu, D. A system dynamic modeling approach for evaluating municipal solid waste generation, landfill capacity and related cost management issues. Waste Manag. 2010, 30, 2194–2203. [Google Scholar] [CrossRef]
  18. Saryazdi, A.H.G.; Ghavidel, M. Waste management in a wire and cable company through system dynamics approach. Int. J. Qual. Reliab. Manag. 2018, 35, 1445–1458. [Google Scholar] [CrossRef]
  19. Dace, E.; Bazbauers, G.; Berzina, A.; Davidsen, P.I. System dynamics model for analyzing effects of eco-design policy on packaging waste management system. Resour. Conserv. Recycl. 2014, 87, 175–190. [Google Scholar] [CrossRef]
  20. Cui, H.; Liu, C.; Côté, R.; Liu, W. Understanding the evolution of industrial symbiosis with a system dynamics model: A case study of Hai Hua Industrial Symbiosis, China. Sustainability 2018, 10, 3873. [Google Scholar] [CrossRef] [Green Version]
  21. Geng, Y.; Tsuyoshi, F.; Chen, X. Evaluation of innovative municipal solid waste management through urban symbiosis: A case study of Kawasaki. J. Clean. Prod. 2010, 18, 993–1000. [Google Scholar] [CrossRef]
  22. Demartini, M.; Tonelli, F.; Bertani, F. Approaching Industrial Symbiosis Through Agent-Based Modeling and System Dynamics. In Service Orientation in Holonic and Multi-Agent Manufacturing; Borangiu, T., Trentesaux, D., André Thomas, O.C., Eds.; Springer: Cham, Switzerland, 2018; pp. 171–185. [Google Scholar]
  23. Ding, Y.; Zhou, B.; Dan, L. Analysis of supply-chain alliance symbiosis system’s dynamic stability. In Proceedings of the International Conference on Risk Management and Engineering Management, Beijing, China, 4–6 November 2008; pp. 214–221. [Google Scholar]
  24. Costa, I.; Massard, G.; Agarwal, A. Waste management policies for industrial symbiosis development: Case studies in European countries. J. Clean. Prod. 2010, 18, 815–822. [Google Scholar] [CrossRef]
  25. Kannan, P.; Al Shoaibi, A.; Srinivasakannan, C. Process simulation and sensitivity analysis of waste plastics gasification in a fluidized bed reactor. WIT Trans. Ecol. Environ. 2012, 163, 177–186. [Google Scholar]
  26. Qin, X.S.; Huang, G.H.; He, L. Simulation and optimization technologies for petroleum waste management and remediation process control. J. Environ. Manag. 2009, 90, 54–76. [Google Scholar] [CrossRef] [PubMed]
  27. Cristóbal Andrade, L.; Bernal Pampín, M.A.; Taboada Gómez, M.C.; Bello Bugallo, P.M. Optimization of Improvable Flows by combining BAT Analysis and process simulation. Chem. Eng. Res. Des. 2014, 92, 1976–1987. [Google Scholar] [CrossRef]
  28. AspenTech. Asset Optimization Software Asset Performance Management, Process Engineering for Chemicals, Energy and Engineering & Construction [WWW Document]. 2020. Available online: https://www.aspentech.com/ (accessed on 5 March 2020).
  29. Ventana Systems Inc. Vensim Software Vensim [WWW Document]. 2020. Available online: http://vensim.com/vensim-software/ (accessed on 30 March 2020).
  30. Grendelta. OpenLCA [WWW Document]. 2020. Available online: https://www.openlca.org/ (accessed on 5 January 2020).
  31. Spanish Government. Real Decreto 2822/1998 de 23 de diciembre, por el que se aprueba el Reglamento General de Vehículos. Boletín Of. Estado 1999, 22, 15–17. [Google Scholar]
  32. Spanish Government. Real Decreto 1457/1986, de 10 de enero, por el que se regulan la actividad industrial y la prestación de servicios en los talleres de reparación de vehículos automóviles, de sus equipos y componentes. Boletín Of. Estado 1986, 169, 19–23. [Google Scholar]
  33. Spanish Government. Real Decreto 455/2010, de 16 de abril, por el que se modifica el Real Decreto 1457/1986, de 10 de enero, por el que se regulan la actividad industrial y la prestación de servicios en los talleres de reparación de vehículos automóviles, de sus equipos. Boletín Of. Estado 2010, 103, 3–15. [Google Scholar]
  34. Spanish Government. Real Decreto 20/2017, de 20 de enero, sobre los vehículos al final de su vida útil. Boletín Of. Estado 2017, 18, 5397–5414. [Google Scholar]
  35. European Union. Regulation (EC) No 1893/2006 of the European Parliament and of the Council of 20 December 2006 establishing the statistical classification of economic activities NACE Revision 2 and amending Council Regulation (EEC) No 3037/90 as well as certain EC Regula. Off. J. Eur. Union 2006, 393, 1–39. [Google Scholar]
  36. European Commission. Database Eurostat [WWW Document]. 2017. Available online: https://ec.europa.eu/eurostat/web/waste/data/database (accessed on 15 February 2020).
  37. European Commission. Best Available Techniques (BAT) Reference Document for Waste Treatment; Publications Office of the European Union: Luxembourg, 2018. [Google Scholar]
  38. European Union. Directive 2004/42/CE of the European Parliament and of the Council of 21 April 2004 on the limitation of emissions of volatile organic compounds due to the use of organic solvents in certain paints and varnishes and vehicle refinishing products and amendi. Off. J. Eur. Union 2004, 143, 87–96. [Google Scholar]
  39. Spanish Government. Real Decreto 679/2006, de 2 de junio, por el que se regula la gestión de los aceites industriales usados. Boletín Of. Estado 2006, 132, 21061–21070. [Google Scholar]
  40. European Commission. Best Available Techniques (BAT) Reference Document for the Non-Ferrous Metals Industries; European Commission: Brussels, Belgium, 2017. [Google Scholar]
  41. European Commission. Reference Document on Best Available Techniques on Surface Treatment using Organic Solvents; European Commission: Brussels, Belgium, 2007; p. 722. [Google Scholar]
  42. Zhang, X.; Li, L.; Fan, E.; Xue, Q.; Bian, Y.; Wu, F.; Chen, R. Toward sustainable and systematic recycling of spent rechargeable batteries. Chem. Soc. Rev. 2018, 47, 7239–7302. [Google Scholar] [CrossRef] [PubMed]
  43. European Commission. Best Environmental Management Practice for the Waste Management Sector; European Commission: Brussels, Belgium, 2018. [Google Scholar]
  44. European Commission. Best Environmental Management Practice for the Car Manufacturing Sector; European Commission: Brussels, Belgium, 2017. [Google Scholar]
  45. US EPA. Managing Used Oil: Advice for Small Businesses | Common Wastes & Materials [WWW Document]. 2019. Available online: https://archive.epa.gov/wastes/conserve/materials/usedoil/web/html/usedoil.html (accessed on 27 February 2020).
  46. Botas, J.A.; Moreno, J.; Espada, J.J.; Serrano, D.P.; Dufour, J. Recycling of used lubricating oil: Evaluation of environmental and energy performance by LCA. Resour. Conserv. Recycl. 2017, 125, 315–323. [Google Scholar] [CrossRef]
  47. Rincón, J.; Cañizares, P.; García, M.T. Regeneration of used lubricant oil by ethane extraction. J. Supercrit. Fluids 2007, 39, 315–322. [Google Scholar] [CrossRef]
  48. Rincón, J.; Cañizares, P.; García, M.T. Regeneration of used lubricant oil by polar solvent extraction. Ind. Eng. Chem. Res. 2005, 44, 4373–4379. [Google Scholar] [CrossRef]
  49. SENER. Plantas rerrefino aceites usados [WWW Document]. 2020. Available online: https://www.energy.sener/es/plantas-de-rerrefino (accessed on 17 March 2020).
  50. Mohammed, R.; Ibrahim, I.A.; Taha, A.H.; McKay, G. Waste lubricating oil treatment by extraction and adsorption. Chem. Eng. J. 2013, 220, 343–351. [Google Scholar] [CrossRef]
  51. Barcala del Caño, N. Diseño de una Planta de Tratamiento de Aceites Residuales de los Sectores de Automoción y Maquinaria Industrial en Base a la Nueva Jerarquía de Gestión de Residuos. Final Project. Master’s Thesis, Universidade de Santiago de Compostela, Santiago de Compostela, Spain, 2010. [Google Scholar]
  52. Gómez Míguez, C.; Cristóbal Andrade, L.; Bello Bugallo, P.M. BAT Analysis and Process Simulation to implement the WMH: Application to used solvents regeneration. In Proceedings of the 4th International Conference on Engineering for Waste and Biomass Valorisation, Porto, Portugal, 10–13 September 2012; pp. 10–13. [Google Scholar]
  53. EU. Directive 2010/75/EU of the European Parliament and of the Council of 24 November 2010 on industrial emissions (integrated pollution prevention and control). Off. J. Eur. Union 2010, 334, 17–119. [Google Scholar]
  54. Worrell, E.; Reuter, M.A. Handbook of Recycling: State-of-the-Art for Practitioners, Analysts, and Scientists, Handbook of Recycling: State-of-the-Art for Practitioners, Analysts, and Scientists; Elsevier: Amsterdam, The Netherlands, 2014. [Google Scholar]
  55. Alfaya Gómez, S. Modelización de un Sistema Industrial Simbiótico Para la Optimización de su Funcionamiento. In Simulation & Gaming through Times and across Disciplines; Kozminski University: Warsaw, Poland, 2012; p. 687. [Google Scholar]
  56. Ott, L.S.; Smith, B.L.; Bruno, T.J. Composition-Explicit Distillation Curves of Waste Lubricant Oils and Resourced Crude Oil: A Diagnostic for Re-Refining and Evaluation. Am. J. Environ. Sci. 2010, 6, 523–534. [Google Scholar] [CrossRef] [Green Version]
  57. Haydary, J. Chemical Process Design and Simulation: Aspen Plus and Aspen Hysys Applications; John Wiley and Sons Inc.: Hoboken, NJ, USA, 2019. [Google Scholar]
  58. Rodríguez, M.T.; Andrade, L.C.; Bugallo, P.B.; Long, J.C. Combining LCT tools for the optimization of an industrial process: Material and energy flow analysis and best available techniques. J. Hazard. Mater. 2011, 192, 1705–1719. [Google Scholar] [CrossRef] [PubMed]
  59. Gómez, R.D.; Watterson, J.D. Stationary Combustion. IPCC Guidelines for National Greenhouse Gas Inventories; Institute for Global Environmental Strategies: Kanagawa, Japan, 2006; Volume 2, pp. 1–47. [Google Scholar]
  60. Spanish Government. Información Completa para la toma de Decisiones Sobre la Sección de Proyectos de Absorción de Dióxido de Carbono y la Sección de Compensación del Registro. [WWW Document]. 2018. Available online: https://www.miteco.gob.es/es/cambio-climatico/temas/mitigacion-politicas-y-medidas/informeanual2018 (accessed on 20 April 2020).
  61. GRAVITA Group. Battery Breaking System, Battery Breaker, Battery Shredders, Hydro Separation System [WWW Document]. 2020. Available online: https://www.gravitatechnomech.com/equipments/battery-hydro-separation.html (accessed on 11 May 2020).
  62. AmmoniaKnowHow. Upgrading Methanol Plants for Increase in Capacity and Energy Efficiency [WWW Document]. 2020. Available online: https://www.ammoniaknowhow.com/upgrading-methanol-plants-increase-capacity-energy-efficiency/ (accessed on 28 May 2020).
  63. Wu, Y.; Xia, C.; Cai, L.; Garcia, A.C.; Shi, S.Q. Development of natural fiber-reinforced composite with comparable mechanical properties and reduced energy consumption and environmental impacts for replacing automotive glass-fiber sheet molding compound. J. Clean. Prod. 2018, 184, 92–100. [Google Scholar] [CrossRef]
Figure 1. Waste producers flow diagram. (Incoming and outgoing materials are distinguished by different colours according to either their nature or function).
Sustainability 14 01241 g001
Figure 2. Limits and activities including car shops and waste intermediate plant. The intermediate plant collects the residues to manage them in the facility. Recovered residues are sent back to waste producers the other ones release the facility towards the final waste managers. (Current case study without symbiosis).
Sustainability 14 01241 g002
Figure 3. WMH applied to waste oils.
Sustainability 14 01241 g003
Figure 4. Proposal of modified Sener Interline process.
Sustainability 14 01241 g004
Figure 5. Proposal of the improved waste solvent regeneration process.
Sustainability 14 01241 g005
Figure 6. Proposal of battery waste management.
Sustainability 14 01241 g006
Figure 7. Proposal solvent recovery from dirty wipes.
Sustainability 14 01241 g007
Figure 8. Model of the treatment process of the waste oils.
Sustainability 14 01241 g008
Figure 9. Flow diagram with symbiosis behaviour. Waste returns to the waste producers. Others cannot be handled by the intermediate plant, so they are sent to other companies.
Sustainability 14 01241 g009
Figure 10. Stock-and-Flow Diagram for Waste Oils.
Sustainability 14 01241 g010
Figure 11. Comparison of scenarios. 1st Scenario: doing nothing, waste oils not treated. 2nd: Sener Interline process. 3rd: Sener Interline process, treatment process implanted progressively. 4th: based on scenario 2, diesel oil product used as fuel. (a) Outflow features in Scenario 1. (b) Outflow features in Scenario 2 and 3. (c) Energy cost in Scenarios 1, 2, 3, and 4.
Sustainability 14 01241 g011
Figure 12. Emissions of carbon dioxide. Both scenarios 2 and 4 overlap, scenario 1 is disabled.
Sustainability 14 01241 g012
Figure 13. Flow diagram with marked boundaries.
Sustainability 14 01241 g013
Figure 14. LCA report.
Sustainability 14 01241 g014
Table 1. Mechanical workshops activity data according to NACE code (2012).
ActivityNACE CodeNº of Enterprises SpainNº of Enterprises GaliciaNº of Facilities SpainNº of Facilities Galicia
Maintenance and repair of motor vehicles 452045,851325852,3273700
Sale, maintenance and repair of motorcycles, spare parts and accessories454034131923592199
Table 2. Data and characterization of the residues selected for study [36].
ResiduesActivityHazardEU 27 (t/yr)Spain (t/yr)
Waste oilAll NACE activities plus householdsHazardous3,780,000240,607
Nonhazardous--
Services (except wholesale of waste and scrap)Hazardous570,00080,864
Nonhazardous--
LER CodeHazardHazard typeAmount (t/yr)
13 02 05 *HazardousDangerous for
environment
30.0
Spent solventsAll NACE activities plus householdsHazardous2,200,000180,196
Nonhazardous--
Services (except wholesale of waste and scrap)Hazardous120,0008055
Nonhazardous--
LER CodeHazardHazard typeAmount (t/yr)
14 06 03 *HazardousFlammable200.0
Battery wasteAll NACE activities plus householdsHazardous1,530,000225,617
Nonhazardous90,0007248
Services (except wholesale of waste and scrap)Hazardous630,000186,459
Nonhazardous 50,000 3399
LER CodeHazardHazard typeAmount (t/yr)
16 06 01 *HazardousToxicant20.0
Dirty wipesLER CodeHazardHazard typeAmount (t/yr)
15 02 02 *HazardousFlammable70.0
* Hazardous waste.
Table 3. Techniques inventory list [37,40,41,42,43,44,45].
IssueTechniqueObjectiveBenefits
GeneralComponent and material takeback networksSpecific components properly treatedNot quantifiable
Enhanced depollution of vehicles Later recycling/remanufacturing activities’ efficiencyIncrease in removed liquid from vehicle
Best practices for plastic and composite partsMinimise environmental impactCurrently not clear
WasteCost benchmarkingIdentification of optimisation optionsNot associated
Advanced waste monitoringDetailed stats of waste streams
Pay-as-you-throwProducers pay according to their waste amounts release Reduces waste amounts and fosters recycling
Awareness-raisingFoster’s prevention, reuse, recycling within a waste management systemReduce source extraction and waste disposal
Network of waste advisersRaise the awarenessWaste prevention
PreventionLocal waste prevention programmes Waste preventionDisposal of waste is higher without them
CollectionWaste collection strategyProper and segregated waste collectionIncrease recycling rate
Logistics optimizationOptimization in waste collectionEnvironmental savings
Use low-emissions vehiclesImprove fuel consumption/emissionsReduced emissions
ProducersWaste producers’ incentivesAchieve waste separation, improve recycling ratesDecrease in disposal, increase in recycling rates
Waste containers and storageSafe storage operations: labelling, heat-sensitive waste is isolated from such an environment, proper container fitting Reduce the environmental risk associated with the storage of waste
Techniques: minimising residence times, using chemical treatment, optimise aerobic treatmentPrevent or reduce odour emissions
Maximise reuse of packaging Reduce the quality of waste sent for disposal
Containment, collection, and treatment of diffuse emissions including the following: implementation of a detailed inspection procedure for baled waste before shredding, removal of dangerous items from the waste input stream and their safe disposal, treatment of containers only when accompanied by a declaration of cleanlinessImprove the overall environmental performance, prevent emissions due to accidents and incidents
Waste oilsLabel all containers as used oilProper identificationSafe handling of used oil, maximize recycling, minimize disposal
Keep containers in good condition Prevent leaks and spillages
Monitor waste input both in preacceptance and acceptanceImprove environmental performance
Material/energy recovery: re-refining, burningReduce waste sent for disposal
Adsorption, thermal oxidation, wet scrubbingReduce emissions of organic compounds to air
Spent solventsMaterial/energy recoveryImprove environmental performance
Adsorption, thermal oxidation, wet scrubbingReduce emissions of organic compounds to air
Pb-acid batteriesUse enclosed conveyer, use enclosed equipment and collect possible emissionsReduce diffuse emissions from material pretreatment
Use a bag filter or scrubberReduce dust and metal emissions to air from battery preparation
Operate in WWTP sent acid mistReduce emissions to water from battery preparation
Separate plastics properly before the smelting stageAllow polypropylene and polyethene recovery from lead battery
Reuse as a pickling agent, reuse as raw material in a chemical plant, regeneration of the acid by cracking, production of gypsum, production of sodium sulphateRecover the sulphuric acid from the battery recovery process
Pyrometallurgical or hydrometallurgical processMetal recoveryHigh enough recoveries
Dirty wipesCombination of minimising solvent-based cleaning agents and manual cleaning with preimpregnated wipesReduce VOCs emissions from the cleaning process
Have a waste management plan along with waste quantities monitoring. In addition: recovery/recycling of solvents, waste-stream-specific techniquesReduce the quantity of waste sent for disposal
Table 4. Output products.
Distillation FractionWeight%
Naphtha3.72
Diesel–oil7.21
Lube base oil78.29
Bitumen10.82
Table 5. IF in waste oil recovery.
Flow StreamFlow TypeBlock UnitDescription
InputEnergy flow (fuel)L–L extractionOwing to ethane compression
FlashAdjustment for ethane separation
Atm. DistillationFuel input to carry out this unit
OutputMaterial flowL–L extractionBitumen or asphalt that involves pollution potential
Table 6. Composition of Spent Solvents.
CompoundFormula or Average StructureMole%
Toluene Sustainability 14 01241 i00168.5
Acetone Sustainability 14 01241 i00220.0
MethanolCH3OH10.0
Solid particlesNot specified 1.5
Table 7. IFs in spent solvent recovery.
Flow TypeBlock UnitDescription
Resource consumptionDistillation Flash separatorThe steam requirement increases energy consumption
VOCs emissionsStorage tank vents, condenser vents, incinerator stacks, fugitive lossesSome emissions are a consequence of boiling but others of simple storage and handling besides either leaks or spills
Table 8. Battery scrap composition.
CompoundFormula or Average StructureWeight%
Pb (alloyed or elem.)Pb30
Electrode pastePbO, PbO240
Dilute sulphuric acid with impuritiesH2SO4 20
Polyethylene (PE) Sustainability 14 01241 i003 5
Polypropylene (PP) Sustainability 14 01241 i0044
Others (glass, etc.)-1
Table 9. IFs from battery waste treatment.
Flow TypeBlock UnitDescription
Inlet battery waste amountEntire processHandling procedure is not enough to deal with several such batteries
Clean electrolyteDecantationDiluted sulphuric acid may contain impurities of Pb sulphate
Segregation of Pb productsFinal segregationIt is difficult to sell sulphated products to recycling enterprises
Table 10. IFs in dirty wipes recovery.
Flow TypeBlock UnitDescription
Inlet dirty wipesWashing centrifugation unitUsing reusable wipes involves a greater volume of dirty wipes
Energy consumptionWashing and dryingAdditional energy consumption in the spent solvent recovery process
VOCs emissionsCleaning, handling, storage, transport, treatment activitiesUsing excessive solvent involves further emissions of organic compounds and its treatment later
Table 11. “Outflow without treatment” as Reference Mode (Tonnes/Year).
Time2010201120122013201420152016201720182019
Variable
Outflow without treatment 30.0---5.64.56.78.410.04.3
Table 12. Model validation (Tonnes/Year).
Time2010201120122013201420152016201720182019
Variable
Reference mode (Outflow without treatment)30.0---5.64.56.78.410.04.3
Outflow without treatment30.023.917.811.75.64.56.78.410.04.3
Outflow30.023.917.811.75.64.56.78.410.04.3
Table 13. Scenario 1 (current scenario) Inventory.
ItemAmountUnitStream
Waste oil4.280TonInput
Spent solvent202.085TonTotal *
Spent solvent70.730TonRaw Input
Energy1.091 × 104MJInput
CO2 emissions0.845TonOutput
Recovered solvent131.355TonFeedback
Sludge70.730TonOutput
Dirty Wipes92.814TonInput
Battery waste130.870TonInput
* Total = Sum of raw (new) and feedback (previously treated).
Table 14. Scenario 2 (residues subjected to treatment) Inventory.
ItemAmountUnitStream
Waste oil4.280TonTotal *
Waste oil1.264TonRaw Input
Energy (from diesel oil)1.978 × 10⁴MJInput
CO2 emissions1.466TonOutput
Recovered base oil3.016TonFeedback
Naphtha0.143TonOutput
Gasoil0.278TonOutput
Bitumen0.417TonOutput
Spent solvent239.211 **TonTotal *
Spent solvent26.313TonRaw Input
Energy (from electricity)1.292 × 10⁴MJInput
CO2 emissions1.000TonOutput
Recovered solvent212.897TonFeedback
Sludge26.313TonOutput
Battery waste130.870TonTotal *
Battery waste130.870TonRaw Input ***
Energy (from electricity)2.449 × 10⁴MJInput
CO2 emissions1.896TonOutput
Lead scrap39.261TonOutput
Lead paste52.348TonOutput
Polyethene waste6.544TonOutput
Polypropylene waste5.235TonOutput
Sulphuric acid electrolyte26.174TonOutput
Other waste1.309TonOutput
Dirty Wipes (with solvent)92.814TonTotal ****
Wipes0.000TonRaw Input
Energy (from electricity)1.253 × 10⁵MJInput
CO2 emissions9.698TonOutput
Fibre Wipes55.688TonFeedback
Spent Solvent37.126Ton**
* Total = Sum of raw (new) and feedback (previously treated), ** This amount has considered that 40% of dirty wipes’ weight contain spent solvent which is added here, *** Currently, the facility does not have the proper equipment to manufacture batteries, **** Total = Sum of feedback fibre wipes and impregnated solvent in mechanical workshop activities.
Table 15. LCA report.
IndicatorScenario 1Scenario 2Unit
Climate change—GWP1001.20 × 1066.26 × 105kgO2 eq.
Human toxicity—HTP inf1.89 × 1051.04 × 105kg1,4-dichlorobenzene eq.
Publisher’s Note: MDPI stays neutral with regard to jurisdictional claims in published maps and institutional affiliations.

