Article

Network Analysis of Industrial Symbiosis in Chemical Industrial Parks: A Case Study of Nanjing Jiangbei New Materials High-Tech Park

School of Architecture, Southeast University, Nanjing 210096, China
*
Author to whom correspondence should be addressed.
Sustainability 2022, 14(3), 1381; https://doi.org/10.3390/su14031381
Submission received: 16 December 2021 / Revised: 20 January 2022 / Accepted: 22 January 2022 / Published: 26 January 2022
(This article belongs to the Collection Industrial Symbiosis and Sustainability)

Abstract

:
As the primary drivers of the chemical industry, chemical industrial parks should be characterized by industrial symbiosis, which is essential for realizing the worldwide transformation from linear to circular economies based on sustainable development. At present, a lack of sufficient attention is paid to analyzing the structural characteristics and interaction patterns of industrial symbiosis networks in chemical industrial parks, especially in large-scale specialized chemical industrial parks on a national scale. In this context, with Nanjing Jiangbei New Materials High-Tech Park as an example, this study applies a social-network analysis to empirically investigate the structural characteristics and interaction patterns of an industrial symbiosis network. The results revealed that the industrial symbiosis network of Nanjing Jiangbei New Materials High-Tech Park is currently in a state of low-level agglomeration with a poor transitivity index and that short-distance straight chains are the main connections between enterprises with few transverse connections. Recycling enterprises occupy the core position in the network, while chemical manufacturing enterprises are mostly located on the periphery of the network and fail to establish sufficient effective connections. In terms of individuals, stakeholders’ understanding and evaluation of industrial symbiosis are insufficient; in terms of enterprises, the obstruction of byproducts and waste information circulation and other factors are the main obstacles restricting the industrial symbiosis activities in Nanjing Jiangbei New Materials High-Tech Park. Some policy recommendations are proposed to improve the industrial symbiosis network in large-scale specialized chemical industrial parks on a national scale, and these include establishing industrial symbiosis information systems for the parks, fostering multiple central nodes, and advancing nested development among industrial chains.

1. Introduction

1.1. Background

Controlling increasing surface temperatures and effectively mitigating climate change have become major global issues in recent years [1]. Developing of a circular economy as a key strategy to achieve net-zero greenhouse gas emissions has been recognized by more and more countries [2,3]. At the same time, guiding the industrial sector in its transition from a linear to a circular economy will also assist the global economy in becoming more resilient. As one of the most effective ways to facilitate a circular economy, industrial symbiosis is defined as the physical exchange of raw materials, energy, water and other byproducts to enable separate enterprises to operate in a cooperative manner, thus realizing the closed circulation of materials and the cascading use of energy in a symbiotic system [4,5]. This approach can not only reduce resource consumption but also lead to numerous environmental and economic benefits for all societies. Therefore, symbiosis has received extensive attention from both academia and government.
Nationally, the chemical industry (Appendixe A, 1) is not only a crucial pillar of the industrial sector but also one that consumes the most energy and resources and produces the most waste and pollutants [6]. Improving the ecological efficiency of the chemical industry has long been considered an important aspect of implementing a circular economy policy and practicing industrial symbiosis. As one of the world’s largest chemical producers and consumers [7], China has contributed more than 50% of the growth of the global chemical market over the past two decades [8]. In 2017, there were 29,307 enterprises above a designated size (Appendixe A, 2) in China’s chemical industry, with total assets of CNY (Appendixe A, 3) 13.03 trillion, cumulative revenue of CNY 13.78 trillion from their main business and a total profit of CNY 846.20 billion, accounting for 11.60%, 11.80% and 11.30% of total assets, revenue and profit, respectively, of national industrial enterprises above a designated size [9]. On the other hand, in 2017 China’s chemical industry consumed 558.62 million equivalent tons of standard coal, accounting for 26.75% of all industrial energy consumption in the country [10]. Emissions of sulfur dioxide, nitrogen oxide, particulate matter and solid waste attributed to the chemical industry amounted to 665,530, 770,759, 1.08 million and 435.69 million t, respectively, accounting for 12.56, 11.92, 10.13 and 11.27% of total emissions of each type [11], and the carbon intensity was nearly 1.5 times that of the general industry average [12]. Promoting the industrial symbiosis of China’s chemical industry and its transformation into a circular economy would help it tackle its environmental problems and would be of great significance for achieving sustainable development goals.
Since the 1990s, the Chinese government has embraced chemical industrial parks as an effective means of controlling and reducing environmental pollution in a national circular economy policy [13]. In 2016, the State Council of China issued the “Guiding Opinions on the Structural Adjustment of the Chemical Industry to Promote Transition and Increase Benefits”, in which it required all new chemical projects and existing hazardous chemical manufacturing enterprises to enter chemical industrial parks. By 2018, a total of 676 chemical industrial parks had been built in [8], and chemical industrial parks had become the primary drivers of China’s chemical sector growth. The construction of eco-chemical industrial parks has also become a significant component of China’s plan for a circular economy in the chemical industry. Realizing industrial symbiosis is at the core of the eco-industrial parks [14]: the more developed the industrial symbiosis system comprising a chemical industrial park becomes, the more efficient the system is at using resources and the lower the negative impact on the environment. Therefore, this study investigates industrial symbiosis activities in China’s chemical industrial parks to serve as a guide for developing circular economy policies to promote green and high-quality development and to provide a useful reference for other countries.

1.2. Literature Review

The research on industrial symbiosis in chemical industrial parks includes three main aspects.
The first aspect includes evaluative research on the benefits of industrial symbiosis activities in chemical industrial parks. Park and Park (2014) [15] analyzed the direct and indirect economic and environmental benefits of the industrial symbiosis system formed by waste-to-energy incinerators and chemical plants through steam sharing in Ulsan city, South Korea. Geng et al. (2014) [16] and Zhe et al. (2016) [17] used energy analysis to calculate the resource inputs and energy consumption saved by implementing industrial symbiosis in the Shenyang Economic and Technological Development Zone and Dalian Economic Development Area. Guo et al. (2016) [18] constructed an indicator system from the perspective of material flow and conducted a quantitative analysis of the environmental and economic benefits of industrial symbiosis activities in Midong Chemical Industrial Park. Zhang et al. (2017) [19] and Wang et al. (2019) [20] used the life cycle assessment method to assess the reduced environmental impact of the industrial symbiosis systems in the Songmudao Chemical Industrial Park and Yongcheng Economic Development Zone.
The second aspect includes research on the approaches and influencing factors of industrial symbiosis implementation in chemical industrial parks. Based on interviews, questionnaires and statistics, Taddeo et al. (2012) [21], Puente et al. (2015) [22] and ElMassah (2018) [23] discussed business models and potential scenarios for the Bussi Chemical Site, Besaya Region and the third industrial zone of Borg El-Arab City, respectively, to implement industrial symbiosis systems. By applying the three-level approach and the enhanced energy and resource efficiency and performance in process industry operations via onsite and cross-sectorial Symbiosis (EPOS) method separately, Liu et al. (2015) [24] and Cervo et al. (2019) [25] identified the opportunities and obstacles regarding the implementation of an industrial symbiosis system for the Weifang Binhai Economic and Technological Development Area and Hull cluster in the Humber region. Gang et al. (2014) [26] and Cui et al. (2018) [27] used the agent-based modeling approach and the system dynamics method, respectively, to establish models and analyze the evolution of a hypothetical coal chemical industrial system and the Hai Hua Industrial Symbiosis system. Ren et al. (2016) [28] established a model that could verify and design sustainable industrial symbiosis implementations in chemical complexes with energy-based innovative indices. Yu et al. (2015) [29] explored the main driving factors that influence the development of the industrial symbiosis system in the Rizhao Economic and Technological Development Area from both the enterprise and governmental aspects. Ji et al. (2020) [30] took the Tianjin Economic and Technological Development Area as an example to analyze the main factors affecting enterprise participation in industrial symbiosis.
The third aspect comprises research into the structural characteristics of industrial symbiosis systems in chemical industrial parks. By measuring and simulating disruptive scenarios using network metrics, Chopra and Khanna (2014) [31] analyzed the resilience and node vulnerability of the industrial symbiosis network in the Kalundborg Eco-industrial Park. Based on the flows of sulfur, Zhang et al. (2015) [32] adopted the ecological network analysis method to study the integral flow weight of the industrial symbiosis system in Shandong Lubei Eco-industrial Park and divided the hierarchy of producers, primary consumers and secondary consumers. On the basis of complex network theory, Li and Shi (2015) [33] built an interdependent network model to analyze the relationship between resilience and interdependency within and among various industrial symbiosis networks in the Yixing Economic and Technological Development Zone. Zhang and Chai (2019) [34] applied the social network analysis method to study the characteristics of the average clustering coefficient, average path length and power-law distribution of degrees of the industrial symbiosis network in the Shandong Lubei Eco-industrial Park.
Overall, there are still some deficiencies in the existing research, mainly from two aspects. First, in terms of research objects, there is a lack of analysis of national large-scale specialized chemical industrial parks. The current research objects are mostly provincial and municipal small and medium-sized chemical industrial parks, chemical complexes, or comprehensive economic and technological development zones and industrial clusters in which the chemical industry is one of the leading industries. Due to differences in the types and numbers of enterprises and types of production organization methods, existing research experience and conclusions are not fully applicable for guiding the industrial symbiosis of large, specialized chemical industrial parks on a national scale. Second, in terms of research content, analyses of the overall structural characteristics and interaction patterns of the industrial symbiosis networks in chemical industrial parks have not received sufficient attention. Most of the existing research on industrial symbiosis in chemical industrial parks has focused on analyzing environmental and economic impacts based on material or energy flows. However, in addition to technical feasibility, the stability, friendly cooperation and trust relationships among different actors provide the basis for the successful implementation of industrial symbiosis. Consequently, an in-depth study of the key participants in and stability of an industrial symbiosis network and the major obstacles to its functional improvement should be considered from the perspective of social connections for the realization and development of eco-chemical industrial parks. Based on the theory of industrial ecology, this research regards the industrial symbiosis system of a chemical industrial park as an ecosystem and holds that the flow and storage of materials, energy and information of the industrial symbiosis system is not an isolated simple superposition relationship but can be operated in circulation similar to how a natural ecosystem functions; the different parts of the system depend on and interact with one another to form a complex and interconnected network. An ideal industrial symbiosis network of chemical industrial parks can operate in a completely circular manner to achieve zero pollution and zero emissions.

1.3. Aims and Questions

With the national large-scale specialized chemical industrial park in the Yangtze River Delta Region of China as the research object, this study analyzes the overall structural characteristics and interaction patterns of the industrial symbiosis network from the perspective of social connections to fill the current research gap. The Yangtze River Delta Region is among the regions with the most developed economy, the most concentrated chemical industry, and the highest level of chemical industrial park construction in China, and an analysis of the chemical industrial parks here would provide experience and research results that provide good application and reference value. From a theoretical perspective, this study can provide a reference for the operating mechanism of the industrial symbiosis system in national large-scale chemical industrial parks. From a practical perspective, the methods and findings in this paper not only are applicable to China but also can provide valuable references for policy formulation for industrial symbiosis in chemical industrial parks in India, Brazil, Mexico, Thailand and Vietnam. In recent years, the chemical industries in these countries have developed rapidly to rank among the top in the world. These nations are facing the same pressure as China to enhance the ecological efficiency of the chemical industry. The study attempts to answer the following questions: (1) What are the structural characteristics of and existing problems in the industrial symbiosis networks in China’s national large-scale specialized chemical industrial parks? (2) What are the differences in the closeness of symbiosis among different enterprises and industrial chains? (3) What are the main obstacles affecting the establishment of industrial symbiosis? (4) What are the ways to improve the industrial symbiosis network according to the above research results?

2. Materials and Methods
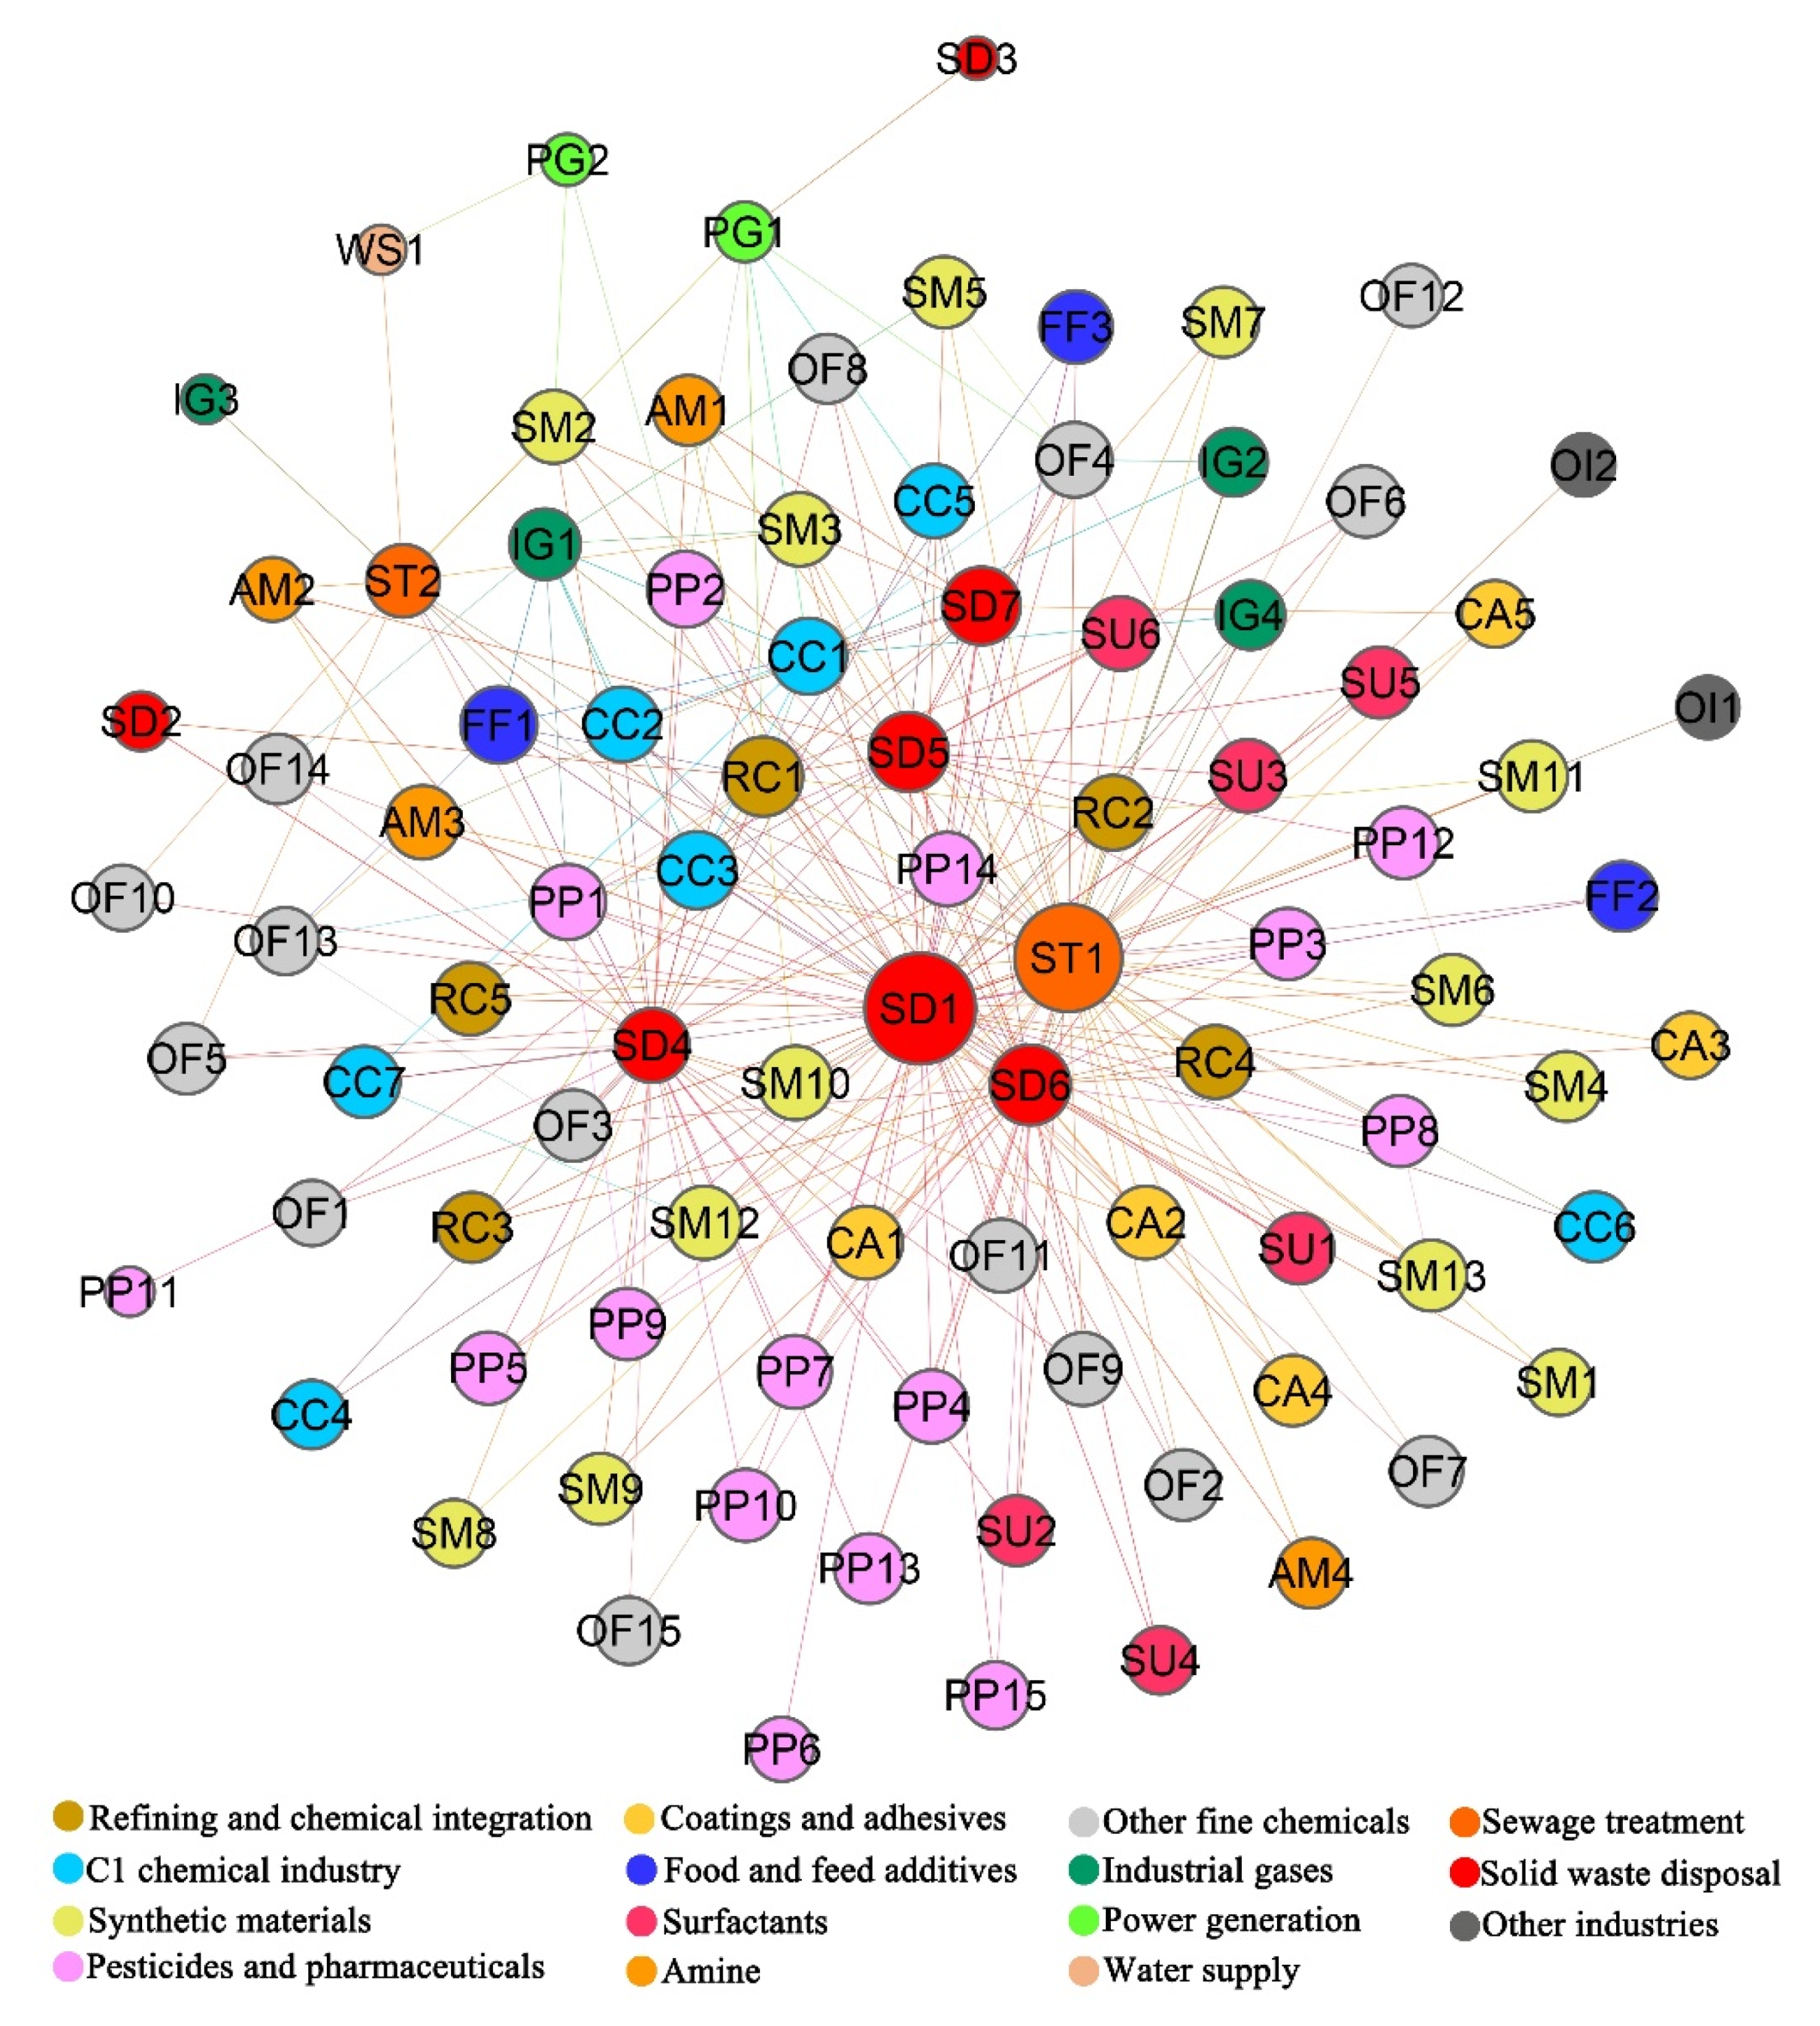
2.1. Study Area

This paper took the Nanjing Jiangbei New Materials High-Tech Park (NJNMHTP) as the research object (Figure 1). It is located in northern Nanjing, the capital of Jiangsu Province, on the north bank of the Yangtze River, 30 km from the downtown area. Nanjing, which is the core city of China’s Yangtze River Delta, is one of the important birthplaces of China’s modern chemical industry dating to the 1930s. NJNMHTP, which was formerly known as Nanjing Chemical Industrial Park and established in October 2001, with a total area of 37.10 square kilometers, including the Changlu area of 32.60 square kilometers and the Yudai area of 4.50 square kilometers, is not only a state-level chemical industrial park in which petrochemicals and synthetic materials are developed but is also the second key petrochemical base approved by the Chinese government [35,36]. By 2020, there were 128 enterprises above a designated size in NJNMHTP, including 60 foreign-funded enterprises and more than 20 key enterprises with an annual output value of more than CNY 1 billion. These enterprises include China Petrochemical Corporation, China National Chemical Corporation, BASF SE, BP (PLC), Huntsman Corporation, Celanese Corporation and other Fortune 500 and Global 50 chemical enterprises. NJNMHTP achieved a total industrial output value of CNY 229.40 billion, ranking first among all chemical industrial parks in China [37]. Furthermore, NJNMHTP is the largest acetic acid production base in the world and the largest alcohol ether solvent production base in Asia. As a result, NJNMHTP is highly representative and so was selected as the research case.
In March 2011, NJNMHTP was designated China’s national standardized experimental unit for a circular economy, and the research park passed the acceptance inspection in June 2014 [38]. Under this project, a “3 + 1” working mode (Appendixe A, 4) was constructed, and multilevel promotion measures were adopted in the park. Enterprises are trained in new technologies and policies with the primary goal of ensuring standardized and cleaner production, and mandatory clean production audits are implemented. Additionally, industrial planning and design are done ahead of time at the park. The park prioritizes introducing enterprises with derivable industrial chains and comprehensive waste utilization in regard to attracting investment and capital for petrochemical and C1 chemical industrial chains while rejecting enterprises that pollute the environment or are not associated with the industrial chain. Organizers plan to promote the network ecological chain of the circular economy among enterprises through the extension and cross-linking of industrial chains to realize the symbiosis and coupling of production processes among enterprises.
Currently, the industrial symbiosis network in NJNMHTP mainly includes two parts (Figure 2). The first part is the petrochemical industrial chain. Petroleum is used as a raw material to produce ethylene, propylene, benzene, and xylene mixtures and other products through cracking, and these products are then supplied to enterprises as synthetic materials, food and feed additives, pesticides and pharmaceuticals as raw materials for production. The produced byproducts, such as C4, C5, C9 and heavy aromatics, are used in the production of petroleum resin and rubber and in the separation of 1,2,4-trimethylbenzene and durene. The second part is the C1 chemical industrial chain. In this chain, coals are used as raw materials to produce carbon monoxide and methanol through the Texaco coal gasification process and the Rectisol process. Methanol can be used to prepare ethylene and propylene. Products such as acetic acid and acetate can be synthesized from carbon monoxide and methanol and supplied to synthetic materials, coatings and adhesives enterprises as raw materials for production. Carbon dioxide byproducts can be used to produce food-grade carbon dioxide, and recycled liquid sulfur can be used to produce sulfur acid. For the recycling of waste, waste heat can be recycled to the generator set to generate power, and ash can be used in the production of building materials.

2.2. Methods

A social network analysis, first proposed by Jacob L. Moreno in the 1930s, is a quantitative analysis method in which the relationships between actors are used as the research object. This method can effectively measure and evaluate the model, structure and attributes of the analyzed network [39,40]. In terms of network nature, both the establishment of a social network and the formation of an industrial symbiosis network are characterized by spontaneity and the potential for the network to survive for a long period of time. In terms of social and industrial symbiosis network structure, both are composed of individuals and their correlations, but the relationships among individuals in a social network generally characterize nonmaterial communication channels, while the relationships among individuals in an industrial symbiosis network generally involve the utilization of materials and energy.
To construct an industrial symbiosis network model G = ( U , E ) , each enterprise in NJNMHTP functions as a “node” in the industrial symbiosis network, and the set of “nodes” can be expressed as U = { u 1 , u 2 , , u n } . The exchange relationships of byproducts and wastes among enterprises function as the “edges” in the industrial symbiosis network, and the collection of “edges” is expressed as E = { ( u i , u j ) , u i , u j U } . In the industrial symbiosis network, since the producers and utilizers of byproducts and waste are different from one another, the adjacency matrix B = { b i , j } N × N is composed of each node and edge and is a directed binary matrix. The term b i , j = 1 indicates that node u i has an edge that points to node u j ; that is, enterprise i outputs byproducts or wastes to enterprise j. The term b i , j = 0 indicates that node u i has no edge that points to node u j or that enterprise j does not accept byproducts or wastes from enterprise i.

2.2.1. Characteristics Analysis

Network density: The network density refers to the coupling degree among nodes in the network. With the same number of nodes, when the network density is higher, the robustness of the network structure is stronger, and the resilience of the network is lower [41]. In the industrial symbiosis network, the greater the number of symbiosis connections among enterprises is, the greater the network density. The network density is calculated with Formula (1); in the formula, L w represents the number of edges that are actually connected among the nodes in the network, and n represents the number of nodes in the network.
N D = L w n × ( n 1 )
Clustering coefficient: The clustering coefficient refers to the local agglomeration degree of the nodes in the network [42]. The calculation method of the clustering coefficient is shown in Formula (2); in the formula, k i represents the number of nodes adjacent to node u i , and E i represents the number of edges that actually exist between adjacent nodes.
C i = E i k i × ( k i 1 )
Average distance: The average distance refers to the convenience degree of matter and energy transfers among the nodes in the network [41]. In the industrial symbiosis network, it refers to the convenience degree of byproducts or waste exchange between enterprises. The calculation method of the average distance is shown in Formula (3); in the formula, d i j represents the number of edges on the shortest path between node u i and node u j .
A D = i = 1 n j = 1 n d i j n × ( n 1 )

2.2.2. Power Quantification Analysis

Degree: The degree refers to the number of edges that are directly related to a node. In a directed network, the degree can be divided into in-degree and out-degree categories [42]. In the industrial symbiosis network, the in-degree represents the number of byproducts or waste relationships received by the enterprise, and the out-degree represents the number of byproducts or waste relationships exported by the enterprise. The calculation method of the total degree is shown in Formula (4).
D u i = i j n D i n + i j n D o u t
Degree centrality: Degree centrality is an indicator used to quantify and determine the importance of a node and reflect the degree of direct correlation between a given node and other nodes in the network [43]. In the industrial symbiosis network, the greater an enterprise’s degree centrality value is, the higher the enterprise’s participation in byproducts or waste exchange activities, the stronger its cooperation ability is, and the closer the enterprise is to the core position of the network. If both an in-degree relation and an out-degree relation exist between two enterprises, the degree centrality is calculated after the total degree is calculated according to the one-way relation [44]. The calculation method of the degree centrality is shown in Formula (5).
D C u i = j = 1 n e i j n 1 , ( i j )
Betweenness centrality: Betweenness centrality is an indicator used to measure the connectivity and control force of a node; this indicator reflects the dependence of two nonadjacent nodes on other nodes [43]. In the industrial symbiosis network, if an enterprise is on the shortest path to other enterprise connections, it plays an important connectivity role in the network and has the ability to control the byproducts or waste exchange among other enterprises. The calculation method of betweenness centrality is shown in Formula (6), and the formula is applied to undirected networks; in the formula, g j k ( i ) represents the number of the shortest paths that pass node u i between node u j and node u k and g j k represents the number of the shortest paths that exist between node u j and node u k .
B C u i = 2 × j n k n g j k ( i ) g j k ( n 1 ) × ( n 2 ) , ( i j k , j < k )
Closeness centrality: Closeness centrality is an indicator used to quantify the minimum path from a given node to other nodes; this term indicates the degree to which a node does not rely on other nodes when transferring matter or energy [43]. In the industrial symbiosis network, the greater the closeness centrality value is, the less easily the enterprise is restricted by other enterprises. The calculation method of closeness centrality is shown in Formula (7), where d i j represents the shortest distance between node u i and node u j .
C C u i = n 1 j = 1 n d i j

2.2.3. Structure Analysis

Core-periphery structure: The core-periphery structure is composed of several interconnected elements and is a special structure with a closely connected center and sparsely scattered periphery. In the industrial symbiosis network, all enterprises can be divided into two categories: one is the strongly connected core group, and the other includes peripheral groups with few connections between each other [45,46]. The enterprises of the core group cannot be further divided into independent cohesive subgroups, and the enterprises of the peripheral groups are sparsely connected and present a scattered distribution.
Block model: The block model refers to dividing actors in the industrial symbiosis network into different blocks according to their structural equivalence, and the relationship between all actors in each block and all actors in other blocks is similar. Each block corresponds to a sub-matrix of the initial matrix, which is a subgroup of the entire industrial symbiosis network. Through the convergence of iterated correlations, the correlation coefficient between each row (or each line) of the initial matrix is calculated, and a correlation coefficient matrix is obtained, which is then repeatedly calculated. After multiple iterations, the partition of each actor is realized. With 3 as the maximum depth of splits, that is, the partition is performed 3 times, and 0.2 as the convergence criteria, the specific measurement of each enterprise partition is realized.

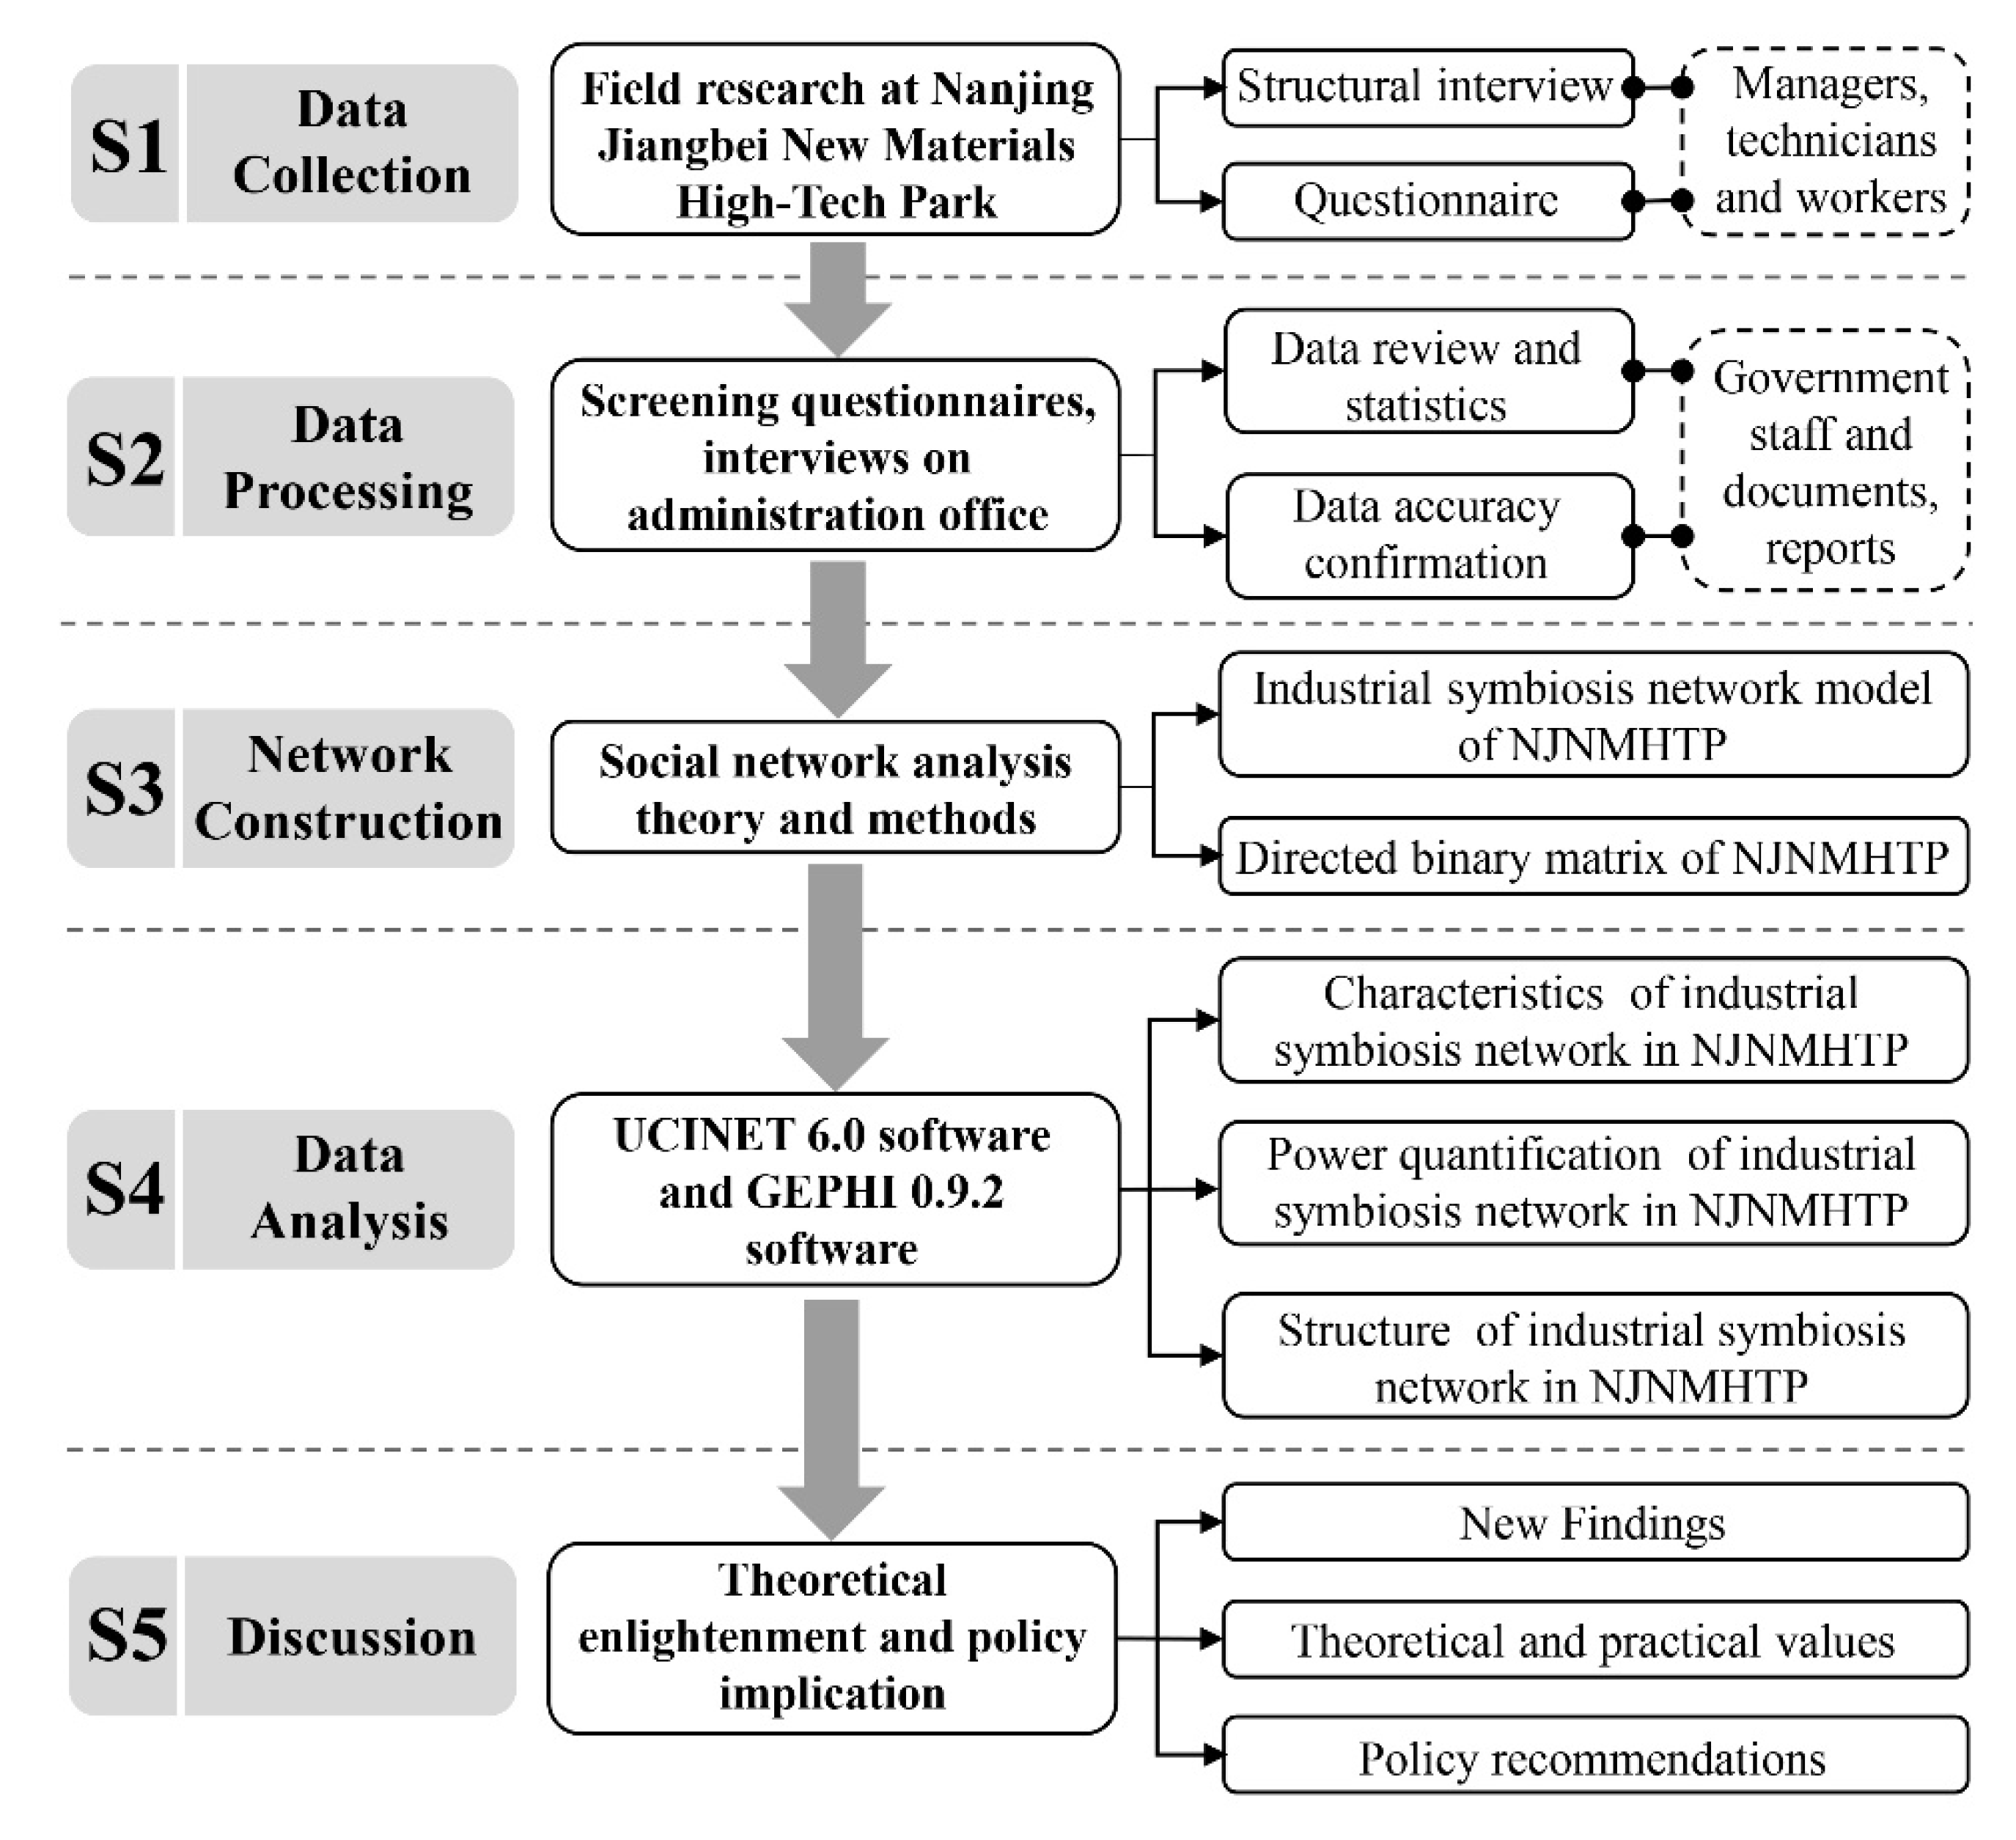
2.3. Research Steps and Data Resources

The research includes five steps (Figure 3). The first step is data collection. In February and March 2021, the research team conducted field research at NJNMHTP. A total of 128 enterprises above a designated size were selected as candidates for research, and 91 industrial manufacturing enterprises were surveyed in terms of managers, technicians and workers, excluding acquired and merged enterprises, trade and sales enterprises, and research and development enterprises. Information on the 91 enterprises is shown in Appendixe B (Table A1). The survey included two parts. The first part was a structural interview designed to determine which enterprises’ byproducts and waste are received by each investigated enterprise and to which enterprises the output byproducts and waste are delivered. The second part was a questionnaire through which the opinions of stakeholders regarding the level of industrial symbiosis and the main factors affecting the establishment of industrial symbiosis among enterprises in NJNMHTP were collected by using 9 questions. A 5-point scale was used for scoring, with 1 representing very low and 5 representing very high. The second step was data processing and review. A total of 386 respondents participated in the survey, among which 32 questionnaires were screened as invalid and 354 questionnaires were screened as valid. In addition, the research team conducted thematic interviews on industrial symbiosis with government staff from the Enterprise Service and Improvement Department and the Security and Environmental Protection Department, the subordinate departments of the NJNMHTP Administration Office, to confirm the validity and accuracy of the collected data. The government staff also provided government documents, reports and other background information on the implementation of industrial symbiosis in NJNMHTP. The third step was to construct an industrial symbiosis network model of NJNMHTP. A social network analysis method was introduced to construct a directed binary matrix consisting of enterprises and exchange relationships of byproducts and waste between enterprises. The fourth step was data analysis. UCINET 6.0 software was used as a tool for mathematical calculations and statistical analysis to study structural characteristics of the industrial symbiosis network in NJNMHTP, and GEPHI 0.9.2 was used to visualize the research results. The fifth step was the discussion regarding the research results. The new findings and the theoretical and practical values of the research results were summarized, and some policy recommendations were put forward.

3. Results

3.1. Characteristics of the Industrial Symbiosis Network in NJNMHTP

The industrial symbiosis network in NJNMHTP is shown in Figure 4. The network density was only 0.036, indicating that the structure of the industrial symbiosis network was relatively loose and the degree of cooperation among enterprises was relatively low. The clustering coefficient was 0.192, and the weighted mean of the clustering coefficient of all the actors with each one weighted by its degree was 0.040, which shows that the local agglomeration level in the entire industrial symbiosis network was relatively low and that the average connectivity among enterprises was still weak. On the other hand, the clustering coefficient was greater than the network density, suggesting that the correlation between adjacent nodes was greater than the overall agglomeration degree of the network, and that small internal groups had formed in the network.
In terms of the path length, node pairs with a distance of 1 appeared 292 times in the industrial symbiosis network of NJNMHTP. This node pair appeared with the highest frequency, accounting for 43.3% of total node pairs. Next were node pairs with a distance of 2, which appeared 205 times in total, accounting for 30.4% of the total number. Node pairs with distances of 3, 4 and 5 appeared 101 times, 61 times and 15 times, respectively, accounting for 15%, 9.1% and 2.2% of the total number of node pairs, respectively. The average shortest distance between interconnected nodes was 1.964; that is, all enterprises in the industrial symbiosis network required at most two intermediate enterprises on average to be connected, indicating that there are more direct connections among enterprises in the industrial symbiosis network, mainly in the form of short chains, and that the transfer of byproducts or waste among enterprises is relatively fast. The compactness and breadth values of the industrial symbiosis network in NJNMHTP were 0.055 and 0.945, respectively, and the compactness was less than the breadth, indicating that the inside of the network was mainly composed of chain-like connections, and the cohesiveness of enterprises was relatively poor.
Respondents’ opinions on the level of industrial symbiosis in NJNMHTP are shown in Figure 5. The average score was 3.88, which was far from the actual situation of the industrial symbiosis in the park. Respondents of enterprises in other industrial categories gave the highest score of 5, followed by respondents of C1 chemical enterprises, who gave an average score of 4.17. Respondents who gave the lowest score were from the power generation enterprises; the average score was 3.30. Judging by the overall score of respondents, the reasons for this result mainly include two aspects. The first is that the lack of in-depth knowledge of industrial symbiosis among stakeholders weakened their ability to accurately evaluate the industrial symbiosis level in NJNMHTP. The second reason is that the NJNMHTP Administration Office lacked comprehensive publicity and the promotion of industrial symbiosis such that the actual situation of industrial symbiosis activities in the park was not well known to most stakeholders. The scores of respondents from different categories of enterprises can be explained by two factors: first, because enterprises of other industries do not have an exchange and utilization relationship with chemical manufacturing enterprises regarding byproducts, respondents tended to score from a single perspective of waste disposal, while the NJNMHTP Administration Office stipulates that all waste must be recycled and disposed of within the park, which resulted in the highest score given by respondents; second, enterprises that occupy the core of the industrial chain in NJNMHTP have more byproduct and waste exchanges with other enterprises, which led to a relatively higher average score given by respondents.

3.2. Power Quantification of Industrial Symbiosis Network in NJNMHTP

3.2.1. Degree

The node degrees and centrality indicators in NJNMHTP are shown in Table 1. In terms of the in-degree value, Nanjing Chemical Industrial Park Tianyu Solid Waste Disposal Co., Ltd. (SD1) had the highest at 62, followed by Sembcorp Nanjing SUIWU Co. (ST1) with 60; these results indicated that 62 and 60 enterprises in NJNMHTP, respectively, transported solid waste and wastewater to these two recycling enterprises, accounting for 68.13% and 65.93% of the total number of enterprises in the park, respectively. In terms of waste producers, the top two were the BASF-YPC Co., Ltd. (RC1) and Nanjing Chengzhi Clean Energy Co., Ltd. (CC1), which had out-degree values of 16 and 12, respectively, indicating that these two enterprises transported byproducts and waste to 16 and 12 other enterprises in the park, accounting for 17.58% and 13.19% of the total number of enterprises in the park, respectively. These two enterprises were also the anchor enterprises identified in NJNMHTP.
For the total degree, SD1 and ST1 were still at relatively high positions, indicating that these two enterprises were key participants in the industrial symbiosis of NJNMHTP. In addition, in terms of chemical manufacturing enterprises, RC1, CC1, Air Products and Chemicals (Nanjing) Co., Ltd. (IG1), Celanese (Nanjing) Chemical Co., Ltd. (CC3), Jiangsu Dynamic Chemical Co., Ltd. (OF4), Nanjing Chengzhi Yongqing Energy Science and Technology Co., Ltd. (CC2), Bluestar Adisseo Nanjing Co., Ltd. (FF1) and Jiangsu Flag Chemical Industry Co., Ltd. (PP1) ranked in the top 15 in terms of total degrees, indicating that these enterprises had the most connections with other enterprises and were important participants in industrial symbiosis in NJNMHTP.

3.2.2. Centrality

Degree centrality is shown in Figure 6. The top-5 enterprises in NJNMHTP are all recycling enterprises, including 4 solid waste disposal enterprises: SD1, with a value of 68.889%; Nanjing Fuchang Environmental Co., Ltd. (SD6), with a value of 42.222%; Nanjing Veolia Tongjun Environmental Service Co., Ltd. (SD4), with a value of 40%; Nanjing ENN Environmental Protection Technology Co., Ltd. (SD5), with a value of 23.333%; and 1 sewage treatment enterprise, ST1, with a value of 67.778%. Overall, waste utilizers have more influence than waste producers on waste flows in NJNMHTP. In terms of various enterprise categories, the average degree centrality values of surfactant, coating and adhesive, water supply and other industry enterprises have relatively low levels, at 3.704%, 3.555%, 2.222% and 1.111%, respectively.
The betweenness centrality is shown in Figure 7. The total betweenness centrality of the top 10 enterprises accounted for 91.5% of that of NJNMHTP overall. The enterprises in the top 10 nodes included 6 categories: solid waste disposal, sewage treatment, refinement and chemical integration, power generation, pesticides and pharmaceuticals, and the C1 chemical industry, among which the number of solid waste disposal enterprises and the total betweenness centrality values were the highest, reaching 4 and accounting for 50.6% of the total betweenness centrality of the park. These results indicated that solid-waste disposal enterprises had the highest potential to connect and control other enterprises in NJNMHTP. In addition, 17 enterprises had betweenness centrality values of 0, including Jiangsu Sunpower Heat Exchanger and Pressure Vessel Co., Ltd. (OI2) and Nanjing Nalcohol New Material Co., Ltd. (CC6). These enterprises failed to play an intermediary role in exchanging byproducts or waste among other enterprises in the park, comprehensively reflecting the extremely uneven distribution of the betweenness centrality in the industrial symbiosis network of NJNMHTP.
The closeness centrality is shown in Figure 8. The average closeness centrality value of all enterprises in NJNMHTP was 47.7%, and the average closeness centrality values of 7 categories of enterprises (sewage treatment, solid waste disposal, refinement and chemical integration, the C1 chemical industry, food and feed additives, synthetic materials and surfactants) were higher than the overall average of the park, showing strong connectivity and less control by other enterprises. Power generation and water supply enterprises had the lowest average closeness centrality values, at 37.9% and 33.5%, respectively, suggesting that they were more controlled by other enterprises.

3.3. Structure of the Industrial Symbiosis Network in NJNMHTP

3.3.1. Core-Periphery Structure

The analysis results of the core-periphery structure are shown in Table 2. There were 19 first-level core enterprises, accounting for 20.88% of the total number of enterprises, including 5 solid waste disposal enterprises, 3 C1 chemical industry enterprises, 2 sewage treatment enterprises, and 2 other fine chemicals enterprises, as well as 1 enterprise for each of the 7 categories of amines, food and feed additives, industrial gases, power generation, refinement and chemical integration, synthetic materials, pesticides and pharmaceuticals. Most of these enterprises are large-scale enterprise groups that were established early in NJNMHTP, and stable cooperative relationships exist in the upstream and downstream industrial chains among them. There were 72 s-level peripheral enterprises, accounting for 79.12% of the total number of enterprises.
From the density results, the relational density between core enterprises was 0.404, that between peripheral enterprises was 0.002, and that between core enterprises and peripheral enterprises was 0.155; these results generally indicate that the core-periphery structure of industrial symbiosis in NJNMHTP is relatively prominent. Although the unevenness of the core-periphery structure was beneficial for the connections among enterprises in the industrial symbiosis network and improved the operational efficiency of the network, the excessive dependence on a few enterprises also greatly increased their corresponding vulnerability. If the core enterprises had not run smoothly, it could have led directly to the collapse of the industrial symbiosis system, which would not have been conducive to the sustainable or efficient development of NJNMHTP.

3.3.2. Block Model

The industrial symbiosis network in NJNMHTP can be divided into eight cohesive subgroups. The composition and connection density values of these cohesive subgroups are shown in Table 3 and Table 4, respectively. From the internal connections of the subgroups, Subgroup 8, which was composed of recycling enterprises, had the highest density of 0.333, representing the closest connection among enterprises in a subgroup. Subgroups 2, 5, 6 and 7 had the lowest density values of 0, indicating that no exchange relationship exists with regard to any byproducts or wastes among enterprises in these subgroups. From the external connections of the subgroups, the top three subgroups are Subgroup 8, 7, and 1, with average external connection densities of 0.412, 0.224 and 0.167, respectively. It should be noted that the average connection density among the five subgroups composed of chemical manufacturing enterprises was lower than the overall network density and was also much lower than the connection density among the other three subgroups composed of supply and recycling enterprises. As a whole, this indicated that not enough effective connections had been established between the chemical manufacturing enterprises in the industrial chain and between the industrial chains in NJNMHTP, and the recycling of byproducts and waste was still at a low level.
The survey results of the main factors affecting the establishment of industrial symbiosis among enterprises in NJNMHTP are shown in Figure 9. The average scores of the eight indicators are 3.97, 3.91, 3.77, 3.95, 3.71, 3.76, 3.80 and 3.91. The circulation and sharing degree of byproducts and waste information among enterprises scored the lowest, with 38.98% of the respondents choosing average, low or very low followed by the quality and stability degree of byproducts and waste supplies (36.16%) and the agglomeration and cross-link degree of industrial chains (34.46%). The blocked circulation of byproducts and waste information has become a key obstacle restricting industrial symbiosis in NJNMHTP; for example, the case of cooperation between Nanjing Yuangang Fine Chemicals Co., Ltd. (RC2) and Bluestar Adisseo Nanjing Co., Ltd. (FF1) interviewed in the survey. RC2 recovers 70 °C steam condensate produced in its chemical production and transfers it to FF1, where it is processed into steam; then, this enterprise returns the steam back to RC2 for use. Based on the annual 8000 h duration, 160,000 tons of industrial water can be recovered, and 2032 tons of standard coal equivalent can be saved through the cooperation of the two parties. However, although the conditions for cooperation are already in place, the two enterprises did not start working together until 2020 due to the lack of information transparency and understanding of the other enterprise’s needs and capabilities. The guidance and restraint degrees associated with regulations and policies on byproducts and waste recycling and the degree of trust in cooperation between enterprises scored the highest, with 74.01% and 75.71% respondents choosing high and very high levels, respectively.

4. Discussion

4.1. Structural Characteristics of the Industrial Symbiosis Network

As for structural characteristics of the industrial symbiosis network, our research results revealed a prominent core-periphery structure in the industrial symbiosis network of NJNMHTP and that the industrial symbiosis network is developed around recycling enterprises such as those focused on solid-waste disposal and sewage treatment. This was in accordance with the findings of Li and Xiao (2017) [47], Song et al. (2018) [48] and Genc et al. (2019) [44], who argue that in the industrial symbiosis network of industrial parks, waste residue and wastewater are of great importance because they come from most industries, and recycling enterprises not only have the most edges directly connected to other enterprises but are also the key points connecting other enterprises. Combined with the actual operation of NJNMHTP, in terms of enterprises, every chemical manufacturing enterprise had considerable demands and pressures regarding waste disposal; in terms of parks, to abide by policies of the circular economy and environmental protection issued by the central and local governments and reduce the transfer of harmful substances to other environmental media, the NJNMHTP Administration Office requires that all waste be recycled and safely disposed of in the park. This has strengthened the central positions of recycling enterprises in terms of both enterprise needs and government requirements.
It is worth noting that in NJNMHTP, chemical manufacturing enterprises are mostly located on the periphery of the industrial symbiosis network with a relatively loose structure overall. A significant cause of this phenomenon is the mode of production organization around leading enterprises adopted by national large-scale specialized chemical industrial parks, which has led to administrators’ inadequate attention to the recycling of byproducts and waste in most small and medium-sized enterprises that support downstream parts of the industrial chain.

4.2. Scale and Agglomeration Characteristics of the Industrial Symbiosis Network

Regarding the agglomeration characteristics of the industrial symbiosis network and their relationship to the network scale, our results showed that the industrial symbiosis network in NJNMHTP is currently characterized by a state of low density, low-level agglomeration, with a poor transitivity index. This finding confirms that the size of the industrial symbiosis network is the key factor determining the level of network agglomeration, and an industrial symbiosis network of a larger scale and with more members is more likely to present a state of weak and loose network connections. Doménech and Davies (2011) [49,50] argued that the expansion of network scale will generate negative effects on the process of building network embedding and limit the social mechanisms that allow cooperation and trust to emerge, transforming a network into an “arm’s length” network. Zhang et al. (2013) [51] noted that each member of a large-scale industrial park will naturally lack sufficient attention to other members in the system, leading to a relatively sparse industrial symbiosis network.
At the same time, we also found that at the individual level, although NJNMHTP has guided and restricted the recycling of byproducts and waste through regulations and policies, the cultivation of knowledge about industrial symbiosis for individuals has been neglected, resulting in stakeholders’ inadequate understanding and evaluation of industrial symbiosis and their inability to deeply explore and realize potential opportunities for industrial symbiosis; at the park level, the insufficient publicity and promotion of industrial symbiosis by the NJNMHTP administration office and the low agglomeration and cross-linkage levels of industrial chains also created institutional obstacles to industrial symbiosis activities. These factors directly prevented the further promotion of the industrial symbiosis network agglomeration in NJNMHTP.

4.3. Enterprise Connection Characteristics of the Industrial Symbiosis Network

With respect to connections and interaction patterns among enterprises in the industrial symbiosis network, our results indicated that the connections among enterprises in NJNMHTP are short-distance straight chains with fewer long-chain node pairs and transverse connections, and enterprises located upstream of the industrial chain have higher total nodal degrees and centrality indicators, which imply that they have more connections with, and more influence on, other enterprises. This confirms the findings of Zhu and Ruth. (2013) [52], Chopra and Khanna. (2014) [31] and Li et al. (2017) [53], who hold that in the industrial symbiosis network of an industrial park, enterprises located further upstream exert a greater influence on the whole while downstream enterprises have relatively little influence on the symbiotic system. According to our research and interview results, the establishment of industrial symbiosis among enterprises in national large-scale specialized chemical industrial parks was mainly influenced by the following two aspects.
On the one hand, due to the characteristics of the chemical industry such as a long product chain and close upstream and downstream production links, the recycling relationships of byproducts and waste in national large-scale specialized chemical industrial parks were mainly concentrated within the same industrial chain with leading enterprises at the core and were directly connected to vertically supporting small and medium-sized enterprises; the number of horizontal recycling long chains among small and medium-sized enterprises across the industrial chain was relatively limited. On the other hand, at present, the technical conditions for industrial symbiosis among enterprises are relatively mature in national large-scale specialized chemical industrial parks. Factors such as the obstruction of byproducts and waste information circulation and the low quality and stability of byproducts and waste supply increase the transaction costs of enterprises and cause a crisis of trust among enterprises, affecting the establishment of effective industrial symbiosis among enterprises. How to enable enterprises with conditions for industrial symbiosis to discover one another in time, understand one another’s needs and establish a stable cooperative relationship have become the focus of future industrial symbiosis work.

5. Conclusions

In this research, based on questionnaire data derived from field surveys and interviews with stakeholders in NJNMHTP, we applied the social network analysis method to conduct quantitative research into the structural characteristics and the interaction patterns of the industrial symbiosis network in the national large-scale specialized chemical industrial park that ranks first in China in terms of social connections; the findings reveal the main existing problems associated with industrial symbiosis and the main factors that affect industrial symbiosis. Based on the research results, the following policy recommendations are proposed for the construction and improvement of the industrial symbiosis network in China’s national large-scale specialized chemical industrial parks.
First, an industrial symbiosis information system should be established. The system should include the functions of byproduct and waste product production and demand registration, the release of symbiosis information, the publicizing of laws and regulations, and the promotion of new technology and online communication. Through this system, individuals can learn and communicate about industrial symbiosis and thus enrich their knowledge about industrial symbiosis; all enterprises can release and query their corresponding sales, demand types, and the quantities and components of all byproducts and waste products in a timely manner. To stabilize and guide the more rapid circulation of byproducts and waste products, the government can also introduce corresponding policies in a timely manner according to the trade and utilization of byproducts and waste products.
Second, multiple central nodes should be fostered. Due to the strong network centrality of recycling enterprises such as solid waste disposal and sewage treatment enterprises, the number of enterprises of the same category can be appropriately increased to reduce dependence on a single core enterprise. Moreover, to increase the number of circulation chains, it is advisable to examine the potential byproducts or waste utilization relationships among chemical manufacturing enterprises that are currently located at the periphery of the industrial symbiosis network. Based on this information, peripheral enterprises can be promoted to become core enterprises, and the degree of agglomeration and stability of industrial symbiosis networks can be improved.
Finally, the nested development among industrial chains should be advanced. The mutual utilization relationships involving raw materials between the industrial chains need to be fully explored to make more effective byproduct tie-points among industrial chains and to build an industrial symbiosis network that covers the entire industrial chain and maximizes the use of all byproducts and waste products. At the same time, the park’s industrial symbiosis network can be expanded to include adjacent enterprises, thus forming a regional circular economy symbiosis system with the park at its center.
The theoretical contribution of this research mainly includes two aspects. First, based on the theory of industrial ecology, this study regards the industrial symbiosis network of a chemical industrial park as an ecosystem and constructs an industrial symbiosis network model on the basis of the recycling relationship between byproducts and waste, providing a new perspective for understanding the operation and organization patterns of the industrial symbiosis systems of national large-scale specialized chemical industrial parks. Second, this study constructs a framework and indicator system for analyzing the industrial symbiosis system by introducing network density, node degrees, centrality and the core-periphery structure and block model, extending the application of network theory in industrial symbiosis research. In addition, this study has some limitations. First, it discusses only the material networks that are related to byproducts and waste products and does not take energy networks or information networks into consideration. Second, social network analyses were systematic methods, and only some major indicators were selected for analysis in this study; thus, the analysis content can be enriched according to different situations in future practical applications.

Author Contributions

Conceptualization, X.W. and K.L.; methodology, K.L.; validation, K.L.; formal analysis, K.L.; investigation, K.L.; resources, K.L.; data curation, K.L.; writing—original draft preparation, K.L.; writing—review and editing, K.L., X.W. and Y.Y.; visualization, K.L. and Y.Y.; supervision, X.W.; project administration, X.W.; funding acquisition, X.W. All authors have read and agreed to the published version of the manuscript.

Funding

This research was funded by China’s National Key Research and Development Plan “Research Cooperation and Exemplary Application in Planning of Overseas Industrial Parks” (No.2016YFE0201000).

Institutional Review Board Statement

Not applicable.

Informed Consent Statement

Not applicable.

Data Availability Statement

Not applicable.

Acknowledgments

We would like to thank Nanjing Jiangbei New Materials High-Tech Park Administration Office for their support.

Conflicts of Interest

The authors declare no conflict of interest.

Appendix A

1. In this study, the chemical industry includes the petroleum industry and chemical industry.
2. Enterprises above a designated size refer to enterprises whose main business income is CNY 20 million or more.
3. Regarding China’s currency, on 3 September 2021, USD 1 was equal to CNY 6.4577.
4. In the “3 + 1” standardized working mode of the circular economy, “3” refers to the three levels of organization, implementation and management, namely, the project’s decision-making level, management level and implementation level. The decision-making level is made up of the leaders of the administration office of the park and the leaders of the enterprises in the park; the management level is made up of the heads of the standardization departments of each enterprise; and the implementation level is made up of personnel from the relevant departments of the park and the experimental enterprises. “1” refers to the technical consultation level, and a project expert group was set up by Jiangsu Institute of Standardization to provide decision-making and technical guidance for the project.

Appendix B

Table A1. Enterprises in NJNMHTP and cataloged information.
No.CategoryEnterprises and Nodes
1Refining and chemical integrationBASF-YPC Co., Ltd. (RC1), Nanjing Yuangang Fine Chemicals Co., Ltd. (RC2), Nanjing Yangzi Eastman Chemical Ltd. (RC3), Nanjing Qidong Chemical Co., Ltd. (RC4), Jiangsu Lianxing New Material Co., Ltd. (RC5)
2C1 chemical industryNanjing Chengzhi Clean Energy Co., Ltd. (CC1), Nanjing Chengzhi Yongqing Energy Science and Technology Co., Ltd. (CC2), Celanese (Nanjing) Chemical Co., Ltd. (CC3), BP YPC Acetyls Company (Nanjing) Limited (CC4), Wacker Chemicals (Nanjing) Co., Ltd. (CC5), Nanjing Nalcohol New Material Co., Ltd. (CC6), Nanjing Rongxin Chemical Co., Ltd. (CC7)
3Synthetic
materials
Nanjing Jinling Plastic and Petrochemical Co., Ltd. (SM1), Nanjing Jinling Huntsman New Material Co., Ltd. (SM2), Nanjing Hongbaoli Polyurethane Co., Ltd. (SM3), Nanjing Stepan Jinling Chemical Co., Ltd. (SM4), KPX Chemical (Nanjing) Co., Ltd. (SM5), Nanjing Jinqi Chemical Group Co., Ltd. (SM6), GPRO Group Jiangsu Zhongshan Chemical Co., Ltd. (SM7), Nanjing Hicol Polymer Material Co., Ltd. (SM8), H.b. Fuller (Nanjing) Chemical Co., Ltd. (SM9), INSA GPRO (Nanjing) Synthetic Rubber Co., Ltd. (SM10), Jinling Aliancys Resins Co., Ltd. (SM11), SI Group (Nanjing) Co., Ltd. (SM12), Dynea (Nanjing) Co., Ltd. (SM13)
4Pesticides and pharmaceuticalsJiangsu Flag Chemical Industry Co., Ltd. (PP1), Nanjing Red Sun Biochemistry Co., Ltd. (PP2), Jiangsu Chengyang Crop Science Co., Ltd. (PP3), Vision Fluorochem(Nanjing) Ltd. (PP4), Jiangsu Pesticide Research Institute Co., Ltd. (PP5), Trust Crop Protection Technology Co., Ltd. (PP6), Nanjing Teva-Chem. Co., Ltd. (PP7), Nanjing Goodagro Co., Ltd. (PP8), Nanjing NAU Pesticide Technology Co., Ltd. (PP9), Jiangsu State Farms Biochemistry Co., Ltd. (PP10), Nanjing White Whale Pharmaceutical Co., Ltd. (PP11), Nanjing Well Pharmaceutical Co., Ltd. (PP12), Nanjing Huicheng Pharmaceutical Co., Ltd. (PP13), Nanjing Hairun Pharmaceutical Co., Ltd. (PP14), Nanjing Pharmaceutical Factory Co., Ltd. (PP15)
5Coatings and adhesivesNanjing Changjiang Paint Co., Ltd. (CA1), NBC (Nanjing) Co., Ltd. (CA2), Nanjing Titanium Dioxide Chemical Co., Ltd. (CA3), Soken High-Tech Material (Nanjing) Co., Ltd. (CA4), Nanjing Night Sight Li Fine Chemical Co., Ltd. (CA5)
6Food and feed additivesBluestar Adisseo Nanjing Co., Ltd. (FF1), Golden Time Chemical (Jiangsu) Co., Ltd. (FF2), Jiangsu Maida New Materials Co., Ltd. (FF3)
7SurfactantsNanjing Yangzi Oxiranchem Co., Ltd. (SU1), Nanjing Regal Polymer Co., Ltd. (SU2), Nanjing Bote New Materials Co., Ltd. (SU3), Nanjing Huashi New Material Co., Ltd. (SU4), Nanjing Maysta New Materials Co., Ltd. (SU5), Jiangsu Jintung Surfactant Co., Ltd. (SU6)
8AmineBasf Speciality Chemicals (Nanjing) Ltd. (AM1), Eastman Chemical (Nanjing) Co., Ltd. (AM2), Evonik Specialty Chemicals (Nanjing) Co., Ltd. (AM3), Nanjing HBL Alkyol Amines Co., Ltd. (AM4)
9Other fine chemicalsNanjing Shuguang Fine Chemical Co., Ltd. (OF1), Nanjing Jinling Chemical Plant Co., Ltd. (OF2), Nalco Industrial Services (Nanjing) Co., Ltd. (OF3), Jiangsu Dynamic Chemical Co., Ltd. (OF4), Ashland Chemicals(Nanjing) Co., Ltd. (OF5), Kemira Chemicals (Nanjing) Co., Ltd. (OF6), Smit (Nanjing) Leather Chemicals Co., Ltd. (OF7), OQ Advanced Derivatives Nanjing Ltd. (OF8), Sino-High(China) Co., Ltd. (OF9), Sinopec Catalyst Nanjing Company (OF10), GPRO New Materials Co., Ltd. (OF11), Superchem Nanjing Limited. (OF12), Heraeus Precious Metal Technology (China) Co., Ltd. (OF13), DyStar Nanjing Colours Co., Ltd. (OF14), Nanjing TOP Chemical Technology Co., Ltd. (OF15)
10Industrial gasesAir Products and Chemicals (Nanjing) Co., Ltd. (IG1), Linde Nanjing Gases Chemical Industrial Park Co., Ltd. (IG2), Nanjing Prax Nanlian Industrial Gas Co., Ltd. (IG3), Messer Gas Products (Nanjing) Co., Ltd. (IG4)
11Power generationNanjing Chemical Industry Park Thermoelectricity Co., Ltd. (PG1), Huaneng Nanjing Thermal Power Co., Ltd. (PG2)
12Water supplySembcorp NCIP Water Co. (WS1)
13Sewage
treatment
Sembcorp Nanjing SUIWU Co. (ST1), Puritek Company Ltd. (ST2)
14Solid waste disposalNanjing Chemical Industrial Park Tianyu Solid Waste Disposal Co., Ltd. (SD1), Nanjing Huihe Environmental Engineering Technology Co., Ltd. (SD2), Nanjing CEC Environmental Protection Bioenergy Co., Ltd. (SD3), Nanjing Veolia Tongjun Environmental Service Co., Ltd. (SD4), Nanjing ENN Environmental Protection Technology Co., Ltd. (SD5), Nanjing Fuchang Environmental Co., Ltd. (SD6), Nanjing Changjiang Jiangyu Environmental Technology Co., Ltd. (SD7)
15Other
industries
Nanjing Fanshun Packaging Co., Ltd. (OI1), Jiangsu Sunpower Heat Exchanger and Pressure Vessel Co., Ltd. (OI2)

References

  1. Intergovernmental Panel on Climate Change. Global Warming of 1.5 °C. An IPCC Special Report on the Impacts of Global Warming of 1.5 °C above Pre-Industrial Levels and Related Global Greenhouse Gas Emission Pathways, in the Context of Strengthening the Global Response to the Threat of Climate Change, Sustainable Development, and Efforts to Eradicate Poverty. Available online: https://www.ipcc.ch/site/assets/uploads/sites/2/2019/06/SR15_Full_Report_High_Res.pdf (accessed on 25 September 2021).
  2. Liu, Z.; Adams, M.; Cote, R.P.; Chen, Q.; Wu, R.; Wen, Z.; Liu, W.; Dong, L. How does circular economy respond to greenhouse gas emissions reduction: An analysis of Chinese plastic recycling industries? Renew. Sust. Energ. Rev. 2018, 91, 1162–1169. [Google Scholar] [CrossRef]
  3. Zhang, X.; Liu, Y. Circular economy is game-changing municipal wastewater treatment technology towards energy and carbon neutrality. Chem. Eng. J. 2022, 429, 132114. [Google Scholar] [CrossRef]
  4. Chertow, M.R. Industrial symbiosis: Literature and taxonomy. Annu. Rev. Energy Environ. 2000, 25, 313–337. [Google Scholar] [CrossRef] [Green Version]
  5. Chertow, M.R. “Uncovering” industrial symbiosis. J. Ind. Ecol. 2007, 11, 11–30. [Google Scholar] [CrossRef]
  6. Levi, P.G.; Cullen, J.M. Mapping global flows of chemicals: From fossil fuel feedstocks to chemical products. Environ. Sci. Technol. 2018, 52, 1725–1734. [Google Scholar] [CrossRef]
  7. Zhu, B.; Zhou, W.; Hu, S.; Li, Q.; Griffy-Brown, C.; Jin, Y. CO2 emissions and reduction potential in China’s chemical industry. Energy 2010, 35, 4663–4670. [Google Scholar] [CrossRef]
  8. Chen, C.; Reniers, G. Chemical industry in China: The current status, safety problems, and pathways for future sustainable development. Saf. Sci. 2020, 128, 104741. [Google Scholar] [CrossRef]
  9. China Petroleum and Chemical Industry Federation. China Chemical Industry Yearbook 2017/18; China National Chemical Information Center: Beijing, China, 2019; pp. 12–20. [Google Scholar]
  10. National Bureau of Statistics of China. China Energy Statistical Yearbook 2018; China Statistics Press: Beijing, China, 2019; pp. 58–93.
  11. Ministry of Ecology and Environment; National Bureau of Statistics of China. China Statistical Yearbook on Environment 2019; China Statistics Press: Beijing, China, 2020; pp. 9–96.
  12. Zhang, Y.; Song, Y.; Zou, H. Transformation of pollution control and green development: Evidence from China’s chemical industry. J. Environ. Manag. 2020, 275, 111246. [Google Scholar] [CrossRef]
  13. He, G.; Chen, C.; Zhang, L.; Lu, Y. Public perception and attitude towards chemical industry park in Dalian, Bohai Rim. Environ. Pollut. 2018, 235, 825–835. [Google Scholar] [CrossRef]
  14. Fan, Y.; Qiao, Q.; Fang, L.; Yao, Y. Emergy analysis on industrial symbiosis of an industrial park—A case study of Hefei economic and technological development area. J. Clean Prod. 2017, 141, 791–798. [Google Scholar] [CrossRef]
  15. Park, J.Y.; Park, H.S. Securing a competitive advantage through industrial symbiosis development. J. Ind. Ecol. 2014, 18, 677–683. [Google Scholar] [CrossRef]
  16. Geng, Y.; Liu, Z.; Xue, B.; Dong, H.; Fujita, T.; Chiu, A. Emergy-based assessment on industrial symbiosis: A case of Shenyang economic and technological development zone. Environ. Sci. Pollut. Res. 2014, 21, 13572–13587. [Google Scholar] [CrossRef]
  17. Zhe, L.; Yong, G.; Hung-Suck, P.; Huijuan, D.; Liang, D.; Tsuyoshi, F. An emergy-based hybrid method for assessing industrial symbiosis of an industrial park. J. Clean Prod. 2016, 114, 132–140. [Google Scholar] [CrossRef]
  18. Guo, B.; Geng, Y.; Sterr, T.; Dong, L.; Liu, Y. Evaluation of promoting industrial symbiosis in a chemical industrial park: A case of Midong. J. Clean Prod. 2016, 135, 995–1008. [Google Scholar] [CrossRef]
  19. Zhang, Y.; Duan, S.; Li, J.; Shao, S.; Wang, W.; Zhang, S. Life cycle assessment of industrial symbiosis in Songmudao chemical industrial park, Dalian, China. J. Clean Prod. 2017, 158, 192–199. [Google Scholar] [CrossRef]
  20. Wang, S.; Lu, C.; Gao, Y.; Wang, K.; Zhang, R. Life cycle assessment of reduction of environmental impacts via industrial symbiosis in an energy-intensive industrial park in China. J. Clean Prod. 2019, 241, 118358. [Google Scholar] [CrossRef]
  21. Taddeo, R.; Simboli, A.; Morgante, A. Implementing eco-industrial parks in existing clusters. Findings from a historical Italian chemical site. J. Clean Prod. 2012, 33, 22–29. [Google Scholar] [CrossRef]
  22. Puente, M.R.; Arozamena, E.R.; Evans, S. Industrial symbiosis opportunities for small and medium sized enterprises: Preliminary study in the Besaya region (Cantabria, Northern Spain). J. Clean Prod. 2015, 87, 357–374. [Google Scholar] [CrossRef]
  23. ElMassah, S. Industrial symbiosis within eco-industrial parks: Sustainable development for Borg El-Arab in Egypt. Bus. Strategy Environ. 2018, 27, 884–892. [Google Scholar] [CrossRef]
  24. Liu, C.; Côté, R.P.; Zhang, K. Implementing a three-level approach in industrial symbiosis. J. Clean Prod. 2015, 87, 318–327. [Google Scholar] [CrossRef]
  25. Cervo, H.; Ogé, S.; Maqbool, A.S.; Mendez Alva, F.; Lessard, L.; Bredimas, A.; Ferrasse, J.H.; Van Eetvelde, G. A case study of industrial symbiosis in the Humber region using the EPOS methodology. Sustainability 2019, 11, 6940. [Google Scholar] [CrossRef] [Green Version]
  26. Gang, W.; Xiao, F.; Hoong, C.K. Symbiosis analysis on industrial ecological system. Chin. J. Chem. Eng. 2014, 22, 690–698. [Google Scholar]
  27. Cui, H.; Liu, C.; Côté, R.; Liu, W. Understanding the evolution of industrial symbiosis with a system dynamics model: A case study of Hai Hua industrial symbiosis, China. Sustainability 2018, 10, 3873. [Google Scholar] [CrossRef] [Green Version]
  28. Ren, J.; Liang, H.; Dong, L.; Sun, L.; Gao, Z. Design for sustainability of industrial symbiosis based on emergy and multi objective particle swarm optimization. Sci. Total Environ. 2016, 562, 789–801. [Google Scholar] [CrossRef]
  29. Yu, F.; Han, F.; Cui, Z. Evolution of industrial symbiosis in an eco-industrial park in China. J. Clean Prod. 2015, 87, 339–347. [Google Scholar] [CrossRef]
  30. Ji, Y.; Liu, Z.; Wu, J.; He, Y.; Xu, H. Which factors promote or inhibit enterprises’ participation in industrial symbiosis? An analytical approach and a case study in China. J. Clean Prod. 2020, 244, 118600. [Google Scholar] [CrossRef]
  31. Chopra, S.S.; Khanna, V. Understanding resilience in industrial symbiosis networks: Insights from network analysis. J. Environ. Manag. 2014, 141, 86–94. [Google Scholar] [CrossRef]
  32. Zhang, Y.; Zheng, H.; Fath, B.D. Ecological network analysis of an industrial symbiosis system: A case study of the Shandong Lubei eco-industrial park. Ecol. Model. 2015, 306, 174–184. [Google Scholar] [CrossRef]
  33. Li, Y.; Shi, L. The resilience of interdependent industrial symbiosis networks: A case of Yixing economic and technological development zone. J. Ind. Ecol. 2015, 19, 264–273. [Google Scholar] [CrossRef]
  34. Zhang, X.; Chai, L. Structural features and evolutionary mechanisms of industrial symbiosis networks: Comparable analyses of two different cases. J. Clean Prod. 2019, 213, 528–539. [Google Scholar] [CrossRef]
  35. Festel, G.; Geng, Y. Chemical industry parks in China. In The Chemical and Pharmaceutical Industry in China: Opportunities and Threats for Foreign Companies; Springer: Berlin, Germany, 2005; pp. 53–62. [Google Scholar]
  36. Hu, X.; Zhang, N.; Liu, Y. In vitro ingestion and inhalation bioaccessibility of soilborne lead, cadmium, arsenic and chromium near a chemical industrial park for health risk assessment. Environ. Pollut. Bioavailab. 2019, 31, 316–322. [Google Scholar] [CrossRef] [Green Version]
  37. People’s Daily Online. Nanjing Jiangbei New Materials High-Tech Park Ranked Second in the List of China’s Top 30 Chemical Industrial Parks in 2021. Available online: http://js.people.com.cn/n2/2021/0604/c360301-34761655.html (accessed on 13 July 2021).
  38. China Association of Circular Economy. Nanjing Chemical Industrial Park Passed the Acceptance Inspection of China’s National Standardized Experimental Project for a Circular Economy. Available online: https://www.chinacace.org/news/view?id=2952 (accessed on 13 July 2021).
  39. Scott, J. Social network analysis. Sociology 1988, 22, 109–127. [Google Scholar] [CrossRef]
  40. Freeman, L. The Development of Social Network Analysis: A Study in the Sociology of Science; Empirical Press: Vancouver, BC, Canada, 2004; pp. 1–43. [Google Scholar]
  41. Butts, C.T. Social network analysis: A methodological introduction. Asian J. Soc. Psychol. 2008, 11, 13–41. [Google Scholar] [CrossRef] [Green Version]
  42. Newman, M.E. The structure and function of complex networks. SIAM Rev. 2003, 45, 167–256. [Google Scholar] [CrossRef] [Green Version]
  43. Otte, E.; Rousseau, R. Social network analysis: A powerful strategy, also for the information sciences. J. Inf. Sci. 2002, 28, 441–453. [Google Scholar] [CrossRef]
  44. Genc, O.; van Capelleveen, G.; Erdis, E.; Yildiz, O.; Yazan, D.M. A socio-ecological approach to improve industrial zones towards eco-industrial parks. J. Environ. Manag. 2019, 250, 109507. [Google Scholar] [CrossRef] [Green Version]
  45. Borgatti, S.P.; Everett, M.G. Models of core/periphery structures. Soc. Netw. 2000, 21, 375–395. [Google Scholar] [CrossRef]
  46. Rombach, M.P.; Porter, M.A.; Fowler, J.H.; Mucha, P.J. Core-periphery structure in networks. SIAM J. Appl. Math. 2014, 74, 167–190. [Google Scholar] [CrossRef] [Green Version]
  47. Li, X.; Xiao, R. Analyzing network topological characteristics of eco-industrial parks from the perspective of resilience: A case study. Ecol. Indic. 2017, 74, 403–413. [Google Scholar] [CrossRef]
  48. Song, X.; Geng, Y.; Dong, H.; Chen, W. Social network analysis on industrial symbiosis: A case of Gujiao eco-industrial park. J. Clean Prod. 2018, 193, 414–423. [Google Scholar] [CrossRef]
  49. Domenech, T.; Davies, M. Structure and morphology of industrial symbiosis networks: The case of Kalundborg. Procedia Soc. Behav. Sci. 2011, 10, 79–89. [Google Scholar] [CrossRef] [Green Version]
  50. Doménech, T.; Davies, M. The role of embeddedness in industrial symbiosis networks: Phases in the evolution of industrial symbiosis networks. Bus. Strategy Environ. 2011, 20, 281–296. [Google Scholar] [CrossRef]
  51. Zhang, Y.; Zheng, H.; Chen, B.; Yang, N. Social network analysis and network connectedness analysis for industrial symbiotic systems: Model development and case study. Front. Earth Sci. 2013, 7, 169–181. [Google Scholar] [CrossRef]
  52. Zhu, J.; Ruth, M. Exploring the resilience of industrial ecosystems. J. Environ. Manag. 2013, 122, 65–75. [Google Scholar] [CrossRef] [PubMed]
  53. Li, B.; Xiang, P.; Hu, M.; Zhang, C.; Dong, L. The vulnerability of industrial symbiosis: A case study of Qijiang Industrial Park, China. J. Clean Prod. 2017, 157, 267–277. [Google Scholar] [CrossRef]
Figure 1. The location and layout of NJNMHTP: (a) location of Jiangsu Province in China; (b) location of Nanjing City in Jiangsu Province; (c) location of NJNMHTP in Nanjing City; (d) layout of NJNMHTP.
Sustainability 14 01381 g001
Figure 2. The brief system network of NJNMHTP.
Sustainability 14 01381 g002
Figure 3. Research framework and steps.
Sustainability 14 01381 g003
Figure 4. The industrial symbiosis network in NJNMHTP.
Sustainability 14 01381 g004
Figure 5. Stakeholders’ opinions on the level of industrial symbiosis in NJNMHTP.
Sustainability 14 01381 g005
Figure 6. Degree centrality of the enterprises in NJNMHTP.
Sustainability 14 01381 g006
Figure 7. Betweenness centrality of the enterprises in NJNMHTP.
Sustainability 14 01381 g007
Figure 8. Closeness centrality of the enterprises in NJNMHTP.
Sustainability 14 01381 g008
Figure 9. Stakeholders’ opinions on the main factors affecting the establishment of industrial symbiosis among enterprises in NJNMHTP.
Sustainability 14 01381 g009
Table 1. Node degrees and centrality indicators of NJNMHTP.
No.NodesDNinDNoutDNDCNBCNCCNNo.NodesDNinDNoutDNDCNBCNCCN
1RC121618203.53153.57147FF20222.222047.368
2RC21566.6670.20050.56248FF31233.3330.01249.180
3RC31233.3330.00847.36849SU10333.3330.01747.872
4RC41344.4440.02949.45150SU20333.3330.06247.368
5RC51233.3330.01249.18051SU31455.5560.03249.180
6CC13121515.5561.52751.42952SU40222.2220.00845.685
7CC22687.7780.35950.56253SU50333.3330.00948.128
8CC3291111.1110.81752.32654SU61344.4440.02149.724
9CC40222.2220.02846.39255AM11344.4440.05547.368
10CC51455.5560.59449.72456AM20444.4440.20443.269
11CC60222.222047.36857AM32355.5560.49449.724
12CC70444.4440.06648.38758AM40222.222047.368
13SM10222.2220.00944.77659OF10222.222044.335
14SM21676.6670.97949.45160OF20333.3330.01747.872
15SM31455.5560.26349.72461OF30555.5560.22348.387
16SM40222.222047.36862OF4279100.85050.562
17SM52244.4440.03048.38763OF50333.3330.08947.619
18SM60444.4440.02948.12864OF60333.3330.00948.128
19SM70333.333047.61965OF70222.222047.368
20SM80222.2220.03245.68566OF80333.3330.05446.632
21SM90333.3330.05648.12867OF90444.4440.09749.451
22SM101344.4440.0725068OF100222.222044.335
23SM111233.333048.12869OF110444.4440.09749.451
24SM121455.5560.17049.72470OF120111.111042.254
25SM131344.4440.01748.12871OF134155.5560.07645.455
26PP13588.8890.52250.84772OF140333.3330.07247.120
27PP22466.6672.14251.42973OF150222.2220.03245.685
28PP30444.4440.02548.38774IG14812100.38147.872
29PP40444.4440.09749.45175IG21344.4440.01545.918
30PP50333.3330.06048.91376IG30111.111033.088
31PP60111.111043.06277IG41233.3330.02046.632
32PP70444.4440.09749.45178PG11677.7782.51140.541
33PP80444.4440.01748.12879PG22243.3330.14835.156
34PP90444.4440.09548.38780WS10222.2220.05733.457
35PP100333.3330.06048.91381ST16016167.77832.08472.581
36PP110111.111033.45782ST21311414.4445.40749.180
37PP121344.4440.02148.38783SD16216368.88935.12175
38PP130333.3330.06247.36884SD21122.222039.823
39PP140555.5560.09349.72485SD31011.111028.939
40PP150222.2220.00845.68586SD4360364010.87550
41CA10444.4440.09749.45187SD51922123.3332.89453.571
42CA20444.4440.09749.45188SD63803842.2229.45654.217
43CA30222.2220.00944.77689SD71031314.4440.92052.632
44CA40333.3330.01747.87290OI10111.111042.254
45CA50333.3330.01345.22691OI20111.111042.254
46FF13588.8890.60551.724
Table 2. The core-periphery division of the industrial symbiosis network in NJNMHTP.
CategoryNodes
Core groupsRC1, SM2, CC1, CC2, CC3, OF4, FF1, PG1, PP1, OF13, AM3, IG1, SD6, SD7, ST1, SD4, SD1, SD5, ST2
Peripheral groupsSM3, SM5, SU6, AM1, OI2, CA3, CC4, CC5, PP12, CC6, SM1, SM11, AM4, RC2, PP2, SU3, FF2, SM9, PG2, SM10, AM2, OF10, PP6, CA1, SM13, SM12, OF3, OF6, OF1, RC3, OF5, OF9, PP4, SM6, OF8, PP7, SU1, CC7, SM4, OF11, FF3, PP3, SU4, PP14, IG3, SU5, PP8, PP13, RC5, IG2, PP5, PP11, CA4, PP15, OF2, PP10, SU2, SD2, WS1, OF7, OI1, OF14, CA2, SM8, PP9, IG4, OF12, OF15, CA5, SM7, SD3, RC4
Table 3. Cohesive subgroups of the industrial symbiosis network in NJNMHTP.
Max Depth of Splits 2Max Depth of Splits 3Nodes
I1RC1, CC2, CC3, FF1, PP1, CC4, SM9, OF5, CC7, OF14
2AM1, CC5, PP2, SM10, CA1, SM12, OF3, OF9, PP4, OF8, PP7, OF11, PP14, PP13, PP5, PP11, PP10, SU2, CA2, SM8, PP9, OF15
II3CC1, SM3, CA3, SM1, SU3, SM13, RC3, SM6, SU1, PP3, SU4, PP8, IG2, CA4, PP15, OF2, SD5, IG4, CA5, RC4
4OF4, SM5, SU6, OI2, OF13, AM3, PP12, IG1, CC6, SM11, AM4, RC2, FF2, PP6, OF6, OF1, SM4, FF3, SU5, RC5, SD7, OF7, OI1, OF12, SM7
III5SM2, AM2, OF10, IG3, WS1
6PG1, SD2
IV7PG2, SD4, ST2, SD3
8SD6, ST1, SD1
Table 4. Connection density matrix of the cohesive subgroups in NJNMHTP.
Subgroup12345678
10.0440.0180.0500.0560.0000.1000.3750.567
20.0180.0000.0090.0050.0000.0450.2610.697
30.0500.0090.0260.0340.0200.0250.0130.833
40.0560.0050.0340.0200.0160.0200.0100.573
50.0000.0000.0200.0160.0000.0000.4500.133
60.1000.0450.0250.0200.0000.0000.3750.000
70.3750.2610.0130.0100.4500.3750.0000.083
80.5670.6970.8330.5730.1330.0000.0830.333
Publisher’s Note: MDPI stays neutral with regard to jurisdictional claims in published maps and institutional affiliations.

