Abstract
Promotion of mental well-being is a desired goal of service in sustainable urban forest management. Microclimate is impacted by forest settings which makes ecosystem services perceived by users. Changes of regional meteorological factors drive responses of emotional perceptions as spatial distribution pattern in accordance with regional urban forest landscapes. In this study, we collected a total of 1422 pairs of happy and sad scores for visitors in 30 urban parks around Shanxi province in North China, where local meteorological were obtained specially for each location as daily matched records. Happy expression scores increased along a latitudinal gradient from south to north. Microclimate did not have any relationship with emotional expressions, but factors of rainfall, wind velocity, average temperature, and relative humidity all had potential contributions to shape distributions of happy and sad scores. The relationship between meteorological records of wind velocity and average temperature and their potential contributions to happy scores can be described by quadratic polynomial functions. Overall, we recommend an environment of urban parks that can optimize emotional well-being with environments of wind velocity of 5.36 m s−1 and average temperature of 6.05 °C in cities around Shanxi in North China. Therefore, microclimates can shape the regional distributions of urban forest ecosystem services of promoting mental well-being, in a way as implicit drivers instead of explicit forces.
1. Introduction
Sustainably developed forests can be taken as a nature-based solution to cope with mental stressors and anxious emotions of frequent city visitors [1,2]. Urban dwellers are subjected to an environment with a high probability to suffer mental stressors in a wide range of demographical characteristics [3,4,5,6]. Contacting green space by experiencing enriched biodiversity and naturalness contributes to improvements of mental well-being [7]. Urban forests account for a large proportion in urban green spaces with topographic features of trees, woods, and undergrowth on wooded lands. Natural settings in green infrastructures have all been demonstrated to benefit mental health and well-being [8,9]. People have accumulated knowledge about the approach and process of urban forest experiences for promoting mental health. However, our understanding is still limited about the mechanism to validate the promotion of mental well-being by an experience in urban forests.
Urban forests have an important service to mediate microclimate in built-up areas [10,11,12]. One of the most well-known consequence following this mediation is the cool-island effect [13]. Trees in urban forests can make surrounding temperature cool down by transpiration and shading for environments in surroundings of canopies [14,15]. Around the edge of a crown, air humidity can be altered to a big extent along the distance away from trunk [16]. Shading of canopy transforms sunlight to solar transmittance, which reduces heating by intense shining and modifies spectrum quality to a more comfortable extent [17,18,19]. All these changes can be a result of improved ecosystem services and a driver that contributes to better responses of perceived emotions [19,20]. Regional forest landscape of patchy distribution of urban tree canopies can be perceived as better emotions in a larger area [21,22]. As a result, regional microclimates can shape spatial distribution of ecosystem services as perceived mental well-being [20]. More is needed to be known about forces to shape emotional responses by forces of micro-environments in fast-established urban forests. This will be an available basis on which designing and planning urban forests to a sustainable development goal.
Thermal comfort is one of the most direct reflects that can be perceived as soon as experiencing forest settings [23]. Heat exposure accounts for significant feeling of mental stress [24] and negatively physiological response [25]. The increase of minimum daily temperature along a latitudinal gradient in temperate city parks was found to be the main force that drove the appearance of smiles on faces of urban forest visitors [20]. Warm temperature was also found to alleviate the increase of diastolic blood pressure [26]. Lower air humidity and higher ratio of green light proportion together accounted for an appearance of comfortable feelings as presented by both physiological and physiological parameters [19,26]. These findings established basic accumulation of our awareness about a general effect of regional climate of forest settings on mental responses of experiencers. Studies were mostly conducted as pilot cases using a crossover design, which made conclusions scattered in different places at different times. Investigations at larger geographical scales are essentially needed because they can reveal more powerful results covering more respondents in wide ranges of geographical and demographical variations.
Studies examining mental response to an experience were mostly reliable on self-reported scores through filling in blanks on questionnaires [27,28]. Hence it was suggested that current attempts to detect mental perception in urban forests were limited by a crucial limit of methodology [29]. In an investigation using questionnaires as a source of data, number of respondents in a recruitment was unlikely to meet the requirement by a large-scale study [27,28,30]. The process to recruit respondents to fill in blanks is heavily site-reliable and time consuming [29]. Subjective errors among human individuals make recalls of data rarely reliable as expected [31]. Social attributes and frequent fatigue may both increase uncertainties of human bias [6,32,33]. Rare of questionnaires have been tested for their validation of matching accuracy, which makes it impossible to verify results in another repeated trial [30,34]. The reliability of accurate assessment of emotional perception of urban forest experiencers in large-scale investigations depends on new approach for reliable data collection.
Mental perception is expressed by short-term emotions which can further be presented as facial expressions [35,36]. It has been proven that assessments of facial expressions are a direct evaluation of ecosystem services of regional forests on mental well-being [20,22,33]. Facial expressions are a direct exhibition of immediate emotions, the examination of emotional perception of grouped respondents can cope with nearly all weaknesses of methodologies relying on questionnaires [6,32]. Pilot studies on spontaneous facial expressions revealed daytime dynamic of emotions of urban park visitors [6,19,30,32]. Data derived from social network service (SNS) enabled analyses of emotional perceptions of users at locations in regional [20,37] or national scales [33]. These trials together suggest a necessity to assess microclimatic effects on emotional perception through rating facial expressions for urban forest visitors in a flexible choice of a regional group of urban parks.
Shanxi province used to depend heavily on coal mining as a main support of regional economy development. Sustainability was vulnerable in Shanxi due to highly contaminated environments and low outcome of well-being. Since 2000, government of Shanxi released a series of policies to transform the economic structure and reinforce the establishment of green infrastructures [38]. Efforts of Shanxi contributes to a promoted connectivity of green infrastructure network in North China [38,39]. The stability of society–economy–environment system in this network has initially confirmed [40]. The further evaluation on sustainability of ecosystem services of green network in this region has not been detected with desired details.
In this study, a group of 30 urban parks were targeted as stands in the region around Shanxi Province in North China. Data about facial expressions of visitors to these parks were collected from SNS platform with regional microclimates recorded. We aimed to map the emotional responses of people in urban forest parks in our chosen region and detect their relationships with microclimates. Based on current findings, we hypothesized that: (1) people in southern parks will show more smiles than those in north because of the gradient of regional temperature, and (2) air humidity can have a positive relationship with positive expressions. Quite less is known about effects of rainfall and wind velocity on facial expressions; hence we will describe their contributions to the form of emotional distribution.
2. Materials and Methods
2.1. Study Area and Investigation Plots
A total of 30 parks were secured as stands for data collection (Table S1). These parks were chosen from 18 cities and 4 provinces in North China. The spatial distribution of these parks and their cities are presented in Figure 1. Host cities where these parks were located together had a total area of host-cities of parks was 243.73 million square kilometers. In the study area, it has a temperate continental climate with hot and rainy summer and chilling and dry winter. Average temperature is 8–13 °C and annual precipitation ranges in 400 mm and 1000 mm. Host cities were administrated by four provinces of, namely, Shanxi, Shandong, Henan, and Hebei, which together have a total area of 0.67 million square kilometers, population of 0.31 billion, and gross domestic product of ¥17.93 trillion.
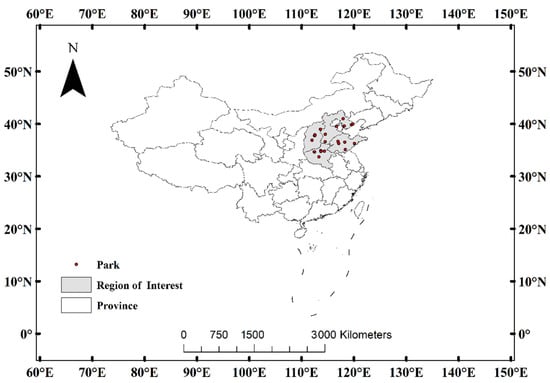
Figure 1.
Spatial distribution of urban forest parks around North China.
2.2. Study Area and Investigation Plots
Photos and selfies about visitors in targeted parks were chosen as study subjects, which were obtained from the SNS platform of Sina Weibo. Sina Weibo is also recognized as Sina Micro-blog that publishes micro-twitters mainly for Chinese users. We only collected photos in micro-twitters with an open policy of Sina, that enables openness to public of all information that was posted by user. Photos were screened by mandatory rules as follows:
- (i)
- Five sense organs of ears, eyebrows, eyes, nose, and mouth need to be all shown on a face.
- (ii)
- Digital decoration of photos can be accepted only at the level to reserve the original look.
- (iii)
- Only visitors with characteristics of typical East Asian face can be documented as objectives because people from East Asian had similar subtle emotions which are quite different from those of western people [30].
When more than one person was captured in one photo, they needed to be divided to keep only one single person per image. All photos per visitor were corrected by cropping to make a face occupying over 60% of a whole imagery area. Cropped photos were rotated to make sure the nose bridge was vertical to horizontal line. These processes have been used for several times in past studies to secure the maximum accuracy by facial analysis [6,19,20,30,32,37]. Finally, we collected a total of 1422 pairs of happy and sad scores for visitors in 30 urban parks around Shanxi province in North China.
2.3. Facial Expression Analysis
Processed photos were analyzed for facial expressions of happy and sad scores using FireFACE v1.0 software (Zhilunpudao Agr. S&T Inc., Changchun, China). This instrument has been successfully used for analyzing posted face expressions in photos from Sina Weibo [20,33,37] and spontaneous face expressions for pedestrians in urban parks [6,19,30,32]. The operational panel of users and the process of facial analyzing can be found in Wei et al. [19]. This software was trained by a dataset of about a total of 30,000 facial records of urban forest visitors with Asian-race faces [33]. The dataset used for training machine learning was established by separations of happy, sad, and neutral emotions on faces which were manually recognized and categorized into classifications with intended emotions. FireFACE v1.0 can recognize happy and sad expressions generally as positive and negative emotions. Typical faces with happy and sad emotions can be seen in Figure S1. Neutral expressions can be recognized when no intended emotions were indicated. All types of facial expressions are rated as percent scores whose sum would be 100%. We chose happy and sad expressions to exhibit our objective emotions because they both passes the validation of recognition accuracy of FireFACE software [30,32].
2.4. Microclimate Records
Records of physical factors in microclimates were obtained from daily records in Climatic Data Centre of National Meteorological Information Center of China [41] for every place of urban park. We chose to document records about rainfall, wind velocity, average temperature, and relative humidity (RH) as our independent variables that can explain the driving forces of facial expressions. Temperature was chosen because it has a strong impact on perception of thermal comfort [23,24,25]. RH was chosen because it was reported to impose positive effects on positive emotions of urban park visitors in Northeast China [19,26]. Rainfall and wind velocity were chosen because they had relationships with temperature and RH in North China [42,43]. We employed daily records of microclimates on days when a photo of urban forest visit was exposed. This can make sure the maximum accurate impact of meteorological conditions on emotional perception because facial expressions.
2.5. Statistical Analysis
We used SAS software (SAS Inst., Cary, NW, USA) to finish all statistical analyses. Our data about facial expressions failed to pass the test of normal distribution. Therefore, we ranked our expressional data to make them distribution free for any analysis that needs normally distributed data [44]. This processing of data has been used for previous studies on facial expressions [32,33,37]. Means with standard errors were shown as results in tables and figures by calculating raw data. One-way analysis of variance (ANOVA) was conducted to detect differences of happy and sad scores in response to variation among parks. Duncan test was used to compared difference among means with regard to the uneven number of replicates. Different letters were given following results with significant differences. Pearson correlation was used to detect relationships between microclimates or topography (longitude and latitude) and facial expressions using logarithm transformed data. Zero-inflation negative regression (ZINR) model was used to detect regressed facial expression scores against the co-existence of all four types of microclimates (temperature, rainfall, RH, wind velocity) as drivers, wherein facial scores were ranked transformed to make their distributions free to be used in regression [19,32,37]. This multivariate regression is sensitive to detect data inflated with zero-near values and can give a list of potential estimates of regressed facial scores against independent variables (meteorological values) [6]. Maximum likelihood parameters (MLPs) of happy and sad scores were estimated by ZINR models according to Wald Chi-square test against original levels of microclimates. Higher MLP estimates of results indicate stronger contributions of metrological factors to affect facial expression scores although the actual effect may not be significant. Finally, a quadratic polynomial regression (QPR) model was employed to detect the relationship between regressed MLP estimates of happy and sad scores and meteorological records. The QPR regression passed the requirement of goodness of fit by dual standards of significant parameter estimates in ANOVA estimates and coefficient of determinant (R2) over the identical value of 0.5. The identical value of 0.5 was used in other studies on regression models against meteorological records [45,46]. Curve fit and critical values were adapted to describe the QPR model. All significance was considered to occur at 0.05 level.
3. Results
3.1. Spatial Distributions of Emotional Expressions
Happy score was lower in parks of central regions of study aera compared to those around to the edges (Figure 2A). For example, happy scores in parks at Luoyang and Pingdingshan cities were lower than those in many other regions near northern and western edges (Table 1). In contrast, sad scores were higher in central parts of study area than in those around surrounding edges (Figure 2B). For example, sad scores in parks of Langfang and Yizhou cities were lower than those in Zhengzhou city.
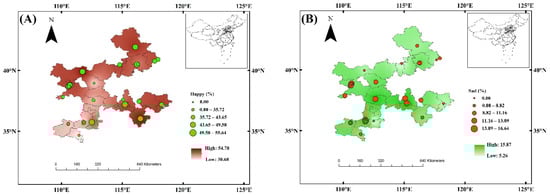
Figure 2.
Spatial distributions of happy (A) and sad (B) scores of visitors in urban forests of North China. Size of a circle indicates percent level of score. Gradient color of study area indicates interpolated levels.

Table 1.
Differences of happy and sad scores of visitors in urban forest parks of North China.
3.2. Spatial Distributions of Microclimates
Rainfall showed a heterogeneous distribution pattern (Figure 3A). Rainfall showed a lower level in northern regions of Chengde city, eastern regions of Qingdao city, and central regions of Handan city. However, rainfall appeared to be higher in Yizhou city and Linyi city.
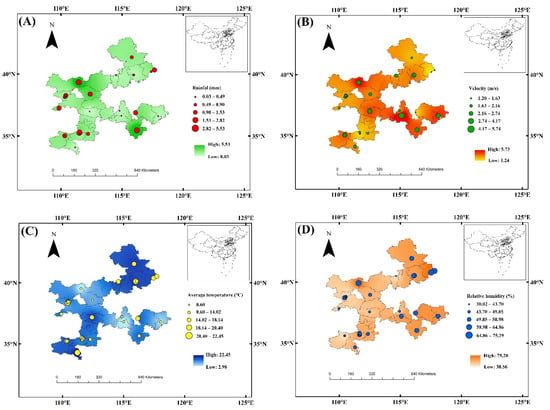
Figure 3.
Spatial distributions of rainfall (A), wind velocity (B), average temperature (C), and relative humidity (D) of urban forests in North China. Size of a circle indicates percent level of score. Gradient color of study area indicates interpolated levels.
Wind velocity appeared to be lower in extremely northern and southern regions than that in central regions (Figure 3B). Wind velocity showed a higher level in a transect along regions around Shijiazhuang, Handan, and Tai’an cities than that in other regions of extremely northern and southern regions.
Average temperature showed a contrasting distribution pattern, that appeared to be higher in regions around cities at northern and southern edges than that in central parts (Figure 3C). For example, average temperature in parks at Chengde and Qinhuangdao cities was higher than that in most central regions.
RH was generally higher in eastern regions than in the west (Figure 3D). RH was generally higher in Qinhuangdao and Qingdao cities than that in Handan and Taiyuan cities.
3.3. Correlation Analysis
As it is shown in Table 2, logarithm happy score had a positive relationship with latitude, which further had a positive relationship with longitude. Logarithm sad score had a negative relationship with logarithm happy score. Neither logarithm happy score nor logarithm sad score had any relationship with microclimatic factors. Among microclimates, RH had a positive relationship with longitude. There was also a positive relationship between RH and rainfall.
Table 2.
Pearson correlation between paired variables among topography (longitude and latitude), emotional expression score (happy and sad), and climatic factors (rainfall, wind velocity, temperature, and humidity).
3.4. Multivariate Regression
Pearson Chi-square ratios for ZINR models were 1.96 and 1.47 for regressed happy and sad scores against four types of microclimates. Although both of our Pearson Chi-square ratios (estimated value divided by degree of freedom) were slightly higher than 1.0 (100% goodness of fit), they did not reach the upper limit of 2.0. Therefore, our regressions passed the criteria for desired goodness of fit in ZINR models.
Significant estimates of MLPs together by four types of microclimates for regressed happy and sad scores are shown in Tables S2 and S3. Rainfall had significant contributions to happy scores that were estimated to range between −98.84 and 30.89, while those to sad scores ranged between 4.85 and 24.34 (Figure 4A,E). Estimates of RH contribution to happy and sad scores ranged in −68.52–48.79 and 6.50–13.39, respectively (Figure 4D,H). Either parameter estimates in ANOVA models or coefficient of determination (R2) failed to pass the required significant standards (Table 3), rainfall and RH were excluded from further detection of parameters in QPR regression.
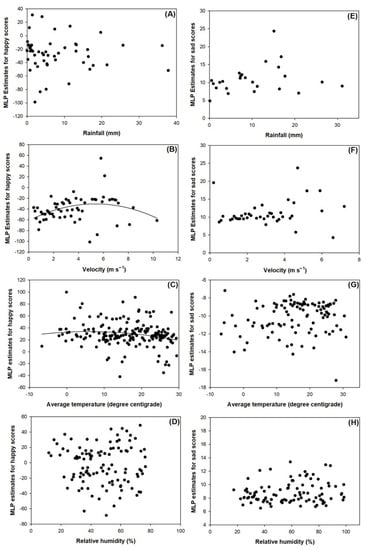
Figure 4.
Scattered spots of paired climatic factors and maximum likelihood parameter (MLP) estimates by zero-inflation negative regression models for happy (left) and sad (right) scores. Regressed spots are scattered with those for rainfall (A,E), wind velocity (B,F), average temperature (C,G), and relative humidity (D,H). Fit curves are given by regressions by quadratic polynomial models.
Table 3.
Summary of analysis of variance (ANOVA) results for quadratic polynomial regressions of predicted estimates by zero-inflation negative regression models against observed climatic records of rainfall, wind velocity, average temperature, and relative humidity.
Instead, the relationship between MLP-happy scores and velocity (Figure 4B) and average temperature (Figure 4C) were also found to be described by QPR models. In these two models, parameters were estimated to be significant in ANOVA models (p = 0.0301 and p = 0.0330, respectively), while their R2 both passed the identical value of 0.5 (R2 = 0.8610 and R2 = 0.5980, respectively) (Table 3). As a result, QPR model of MLP estimates for happy scores (Hs) against wind velocity (Wv) can be described as:
Hs = −1.0893 × Wv2 + 11.6764 × Wv − 61.6124
QPR model of MLP estimates for happy scores again average temperature (At) can be described as:
Hs = −0.0266 × At2 + 0.3218 × At + 32.8807
Plotted spots and fit curve are shown in Figure 4. Wv changed within a range between 0.4 m s−1 and 10.3 m s−1, wherein Hs increased up to a peak of MLP estimate of −30.32 when Wv reached 5.36 m s−1 (Figure 4B). Otherwise, At changed within a range between −6.7 °C and 29.4 °C, wherein Hs would always increase with the increase of At (Figure 4C). When At increased to reach 6.05 °C, Hs will be regressed to be the maximum MLP estimate of 33.85.
4. Discussion
Our happy and sad scores showed a negative relationship with each other. Happy and sad expressions are typically bipolars for positive and negative emotions, respectively. They can be shown on a face as contrasting contributions to a total presentation of facial emotion, but they cannot be characterized as univariate instead of bivariate [47]. The recognitions of happy and sad scores resulted in contrasting scores whose sum, plus that for neutral scores, equal to 100%. This is one of basic rules for FireFACE software version 1.0 that was trained and is used for quantifying facial emotions [33,37]. In Pearson correlation, happy score had a positive relationship with latitude, which suggests a gradient of more happy emotions in urban parks at northern cities with a cooler climate in our study area. This concurs with the study using a dataset in Northeast China [22], but disagrees to another study in urban parks at cities across eastern China [20]. However, the negative relationship of sad score with happy score was not accompanied by any latitudinal gradient of sad scores. Hence, the conflicts between happiness and sadness for visitors in our study were attributed to the nature of presenting two contrasting emotions. This did not mean any thread to a continuous response of presented sadness to latitude gradient although happiness had been shown to. Thus, we cannot accept our first hypothesis.
In detail, with presentation of a positive relationship between temperature and happy scores of urban park visitors, Liu et al. [20] argued that it was the warm climate in southern regions that make people perceive and show more smiles. However, this relationship was not continued in our study because of no relationship between temperature and happy scores. The contribution of average temperature to the change of happy scores can also be understood as a potential relationship between a driving force of temperature and estimated effect on happiness. Even as a potential relationship, happy scores were estimated to increase with temperature in a range up to 6.05 °C; thereafter, any higher temperature records will evoke depressions on smiles. Regarding that the highest record of average temperature in our study was 29.4 °C; hence in most range of temperature records, people would like to show smiles when they perceived low temperature around 6 °C but not a heating feeling nearly 30 °C. This is reasonable for people in Northern China, because they have dwelled well in a society habitat with cool temperatures in most times of a year.
We did not observe any associations of meteorological records with happy or sad scores in Pearson correlation analyses. Our spatial distribution of microclimates did not reflect the pattern of real-time physical environments like those recorded in previous studies [19,24]. Instead, our mapped distribution of environmental factors was derived from means among days when photos were posted to Sina Weibo. Therefore, we surmise that distribution of microclimates in our study do not have applicable meaning to be taken as references for any regional climate observations. Our data about microclimatic records by days of every photo, which donated as a much higher accuracy for the establishment of dataset about independent variables compared to those studies using data across a week-time in a unique season [20,37]. However, our results about spatial distribution of microclimates can be used as a reference for further studies detecting relationship between regional climates and local people’s emotions.
We cannot accept our second hypothesis as well, because we did not find any relationship between happy or sad scores and RH. In addition, RH contributed to the expression of happy scores in a larger range than that of sad scores. Therefore, there were more uncertainties in effects of RH on positive emotion than on negative emotions. This was reasonable because our RH was recorded in a large range between 11.8% and 76.5%. In previous studies where humidity benefited well-being, RH was only ranged in a small variation in a regional investigation [19,26]. In Park et al. [24], although authors detected psychological perceptions in 14 forests across Japan, RH records therein only ranged in a small range between approximately 55–86%. Therefore, we consider that the large variation of RH across a large geographical scale unlikely caused gradient response of emotional perception as it works in a regional scale.
We did not find any relationship between microclimates and existed records or estimated contributions by sad scores. Negative emotions were also reported to have a null response to environmental factors [19,24]. Although we did not observe any relationships between happy scores and environmental factors, we found relationships between wind velocity and average temperature and their contributions to happy scores. According to MLP estimates, potential driving of wind velocity on happy scores was negative, which was diminished to be lowest when facing a velocity of 5.36 m s−1. In contrast, the potential driving of average temperature on happy scores was positive, which can be maximized at 6.05 °C. Overall, average temperature had a stronger potential of driving force to influence the presentation compared to wind velocity.
Our study has three limits:
Firstly, the time for our data collection was 2020 when it was the initial time when pandemic explodes globally. A lot of people took a facial mask during their time in urban forest parks. Others without masks would be infected by negative emotions during pandemic. Another period of data collection will improve the power of dataset and mediate interruptions of subjective emotions.
Secondly, the area of this study was located in a temperate climate zone. A larger geographical scale with forest landscapes in more varied climatic biomes will increase the reliability of results concerning a wide range of climatic ranges.
Thirdly, happy and sad expressions were evaluated in this study as presentations of extreme emotions. The relationship between human emotions and perceived microclimates might be more complicated than these two types. More emotional types are suggested to be analyzed in future studies to enrich our understanding about emotional perception of microclimates in urban forests.
Finally, people in our study showed sentiments in, actually, a conscious way to present posted emotions. This is attributed to by the nature of people use SNS as an outlet to post and share their real-time emotional attitudes to the experience in a nature. Even we employed a big-data way with an aim to control or eliminate systematic errors by a subjective motivation to post sentiments on a face, we still cannot make the best sure that our data can fully reflect realistic affects. Future studies are strongly to employ spontaneous expressions on faces of people with unconsciousness that their sentiments were disclosed by their facial photos.
5. Conclusions
We collected data about happy and sad scores on photos of urban forest visitors to parks in North China from Sina Weibo. Regional microclimate in urban forest parks did not have direct effect on facial expressions. However, all four factors of rainfall, wind velocity, average temperature, and RH all had potential contribution to impact both types of emotions. We recommended a condition that can optimize emotional well-being with environments of wind velocity of 5.36 m s−1 and average temperature of 6.05 °C. Our results can be useful as background information for urban forest planning and designing with an objective of promotion on emotions. Our study can be taken as a trial for investigating sustainability of resource-reliable region, like Shanxin, bridging emotional expressions and geographical landscapes. Because we did not find results all in accordance with previous studies, we conclude that the driving force of microclimate on emotional perception may depend on the geographical place and scale. We suggest conducting more work in a wider scope of geographical scales and regional locations.
Supplementary Materials
The following are available online at https://www.mdpi.com/article/10.3390/su14031648/s1, Table S1. List of coordinates of urban forest parks in North China; Table S2. Analysis of maximum likelihood parameter estimates using zero-inflation negative regression model on climatic factors of rainfall, wind velocity, average temperature, and relative humidity as contributions to affect happy scores of visitors in urban forest parks; Table S3. Analysis of maximum likelihood parameter estimates using zero-inflation negative regression model on climatic factors of rainfall, wind velocity, average temperature, and relative humidity as contributions to affect sad scores of visitors in urban forest parks. Figure S1. Select typical photos presenting extreme scores of happiness (A,C,E) and sadness (B,D,F) in facial photos of urban forest visitors in 30 parks around Shanxi in North China. Date, gender, age, city, and park name for subjects in photos are: (A) 20 Aril 2020, female, youth, Zhengzhou, Yellow river park; (B) 7 October 2020, female, youth, Zhengzhou, People park; (C) 25 April 2020, female, youth, Taiyuan, Jinyang lake park; (D) 8 October 2020, male, youth, Tai’an, Mount Tai resort; (E) 14 October 2020, female, youth, Qinhuangdao, Dove nest park; (F) 4 October 2020, female, youth, Qinhuangdao, Shanhai pass scenery. Eyes of subjects have been covered by black-color banners to protect privacies of subjects.
Author Contributions
Conceptualization, B.M. and F.L.; Data curation, B.M., Z.L. and W.Z.; Formal analysis, F.L.; Funding acquisition, B.M.; Investigation, B.M., Z.L. and W.Z.; Methodology, F.L.; Project administration, B.M.; Resources, F.L.; Software, B.M.; Supervision, B.M.; Validation, B.M. and Z.L.; Visualization, F.L. and W.Z.; Writing—original draft, B.M.; Writing—review and editing, F.L. All authors have read and agreed to the published version of the manuscript.
Funding
This work was supported by Science and Technology Innovation Project of Higher education Institutions in Shanxi Province (grant number: 2019L1008).
Institutional Review Board Statement
The study was conducted in accordance with the Declaration of Helsinki, and approved by the Institutional Ethics Committee of Taiyuan University (protocol code ES-2021-001; 13 May 2021) for studies involving facial expressions as a source of data.
Informed Consent Statement
Not applicable.
Acknowledgments
Authors acknowledge contributions of referees and editors for this manuscript.
Conflicts of Interest
The authors declare no conflict of interest.
References
- Liu, H.-Y.; Jay, M.; Chen, X. The Role of Nature-Based Solutions for Improving Environmental Quality, Health and Well-Being. Sustainability 2021, 13, 10950. [Google Scholar] [CrossRef]
- Hauer, R.J. Special Issue “Urban Forestry and Urban Green Management: Promoting Sustainable Urban Tree Populations” in Sustainability. Available online: https://www.mdpi.com/journal/sustainability/special_issues/Green_Management (accessed on 31 October 2020).
- Vujcic, M.; Tomicevic-Dubljevic, J. Urban forest benefits to the younger population: The case study of the city of Belgrade, Serbia. For. Policy Econ. 2018, 96, 54–62. [Google Scholar] [CrossRef]
- Kim, H.-R.; Koo, C.-D. The Influence of Urban Forest and School Forest Experience Activities on Attitude toward Forest, Psychological Well-being and Stress of High School Student. Korean J. Environ. Ecol. 2019, 33, 341–353. [Google Scholar] [CrossRef]
- Lee, H.J.; Son, Y.-H.; Kim, S.; Lee, D.K. Healing experiences of middle-aged women through an urban forest therapy program. Urban For. Urban Green. 2019, 38, 383–391. [Google Scholar] [CrossRef]
- Wei, H.; Hauer, R.J.; Guo, S. Daytime dynamic of spontaneous expressions of pedestrians in an urban forest park. Urban For. Urban Green. 2021, 65, 127326. [Google Scholar] [CrossRef]
- Reyes-Riveros, R.; Altamirano, A.; De La Barrera, F.; Rozas-Vásquez, D.; Vieli, L.; Meli, P. Linking public urban green spaces and human well-being: A systematic review. Urban For. Urban Green. 2021, 61, 127105. [Google Scholar] [CrossRef]
- Cook, M. Using urban woodlands and forests as places for improving the mental well-being of people with dementia. Leis. Stud. 2020, 39, 1–15. [Google Scholar] [CrossRef]
- Duan, J.; Wang, Y.; Fan, C.; Xia, B.; De Groot, R. Perception of Urban Environmental Risks and the Effects of Urban Green Infrastructures (UGIs) on Human Well-being in Four Public Green Spaces of Guangzhou, China. Environ. Manag. 2018, 62, 500–517. [Google Scholar] [CrossRef] [PubMed]
- Petri, A.C.; Wilson, B.; Koeser, A. Planning the urban forest: Adding microclimate simulation to the planner’s toolkit. Land Use Policy 2019, 88, 104117. [Google Scholar] [CrossRef]
- Georgi, N.J.; Zafiriadis, K. The impact of park trees on microclimate in urban areas. Urban Ecosyst. 2006, 9, 195–209. [Google Scholar] [CrossRef]
- Ren, Z.; Zhao, H.; Fu, Y.; Xiao, L.; Dong, Y. Effects of urban street trees on human thermal comfort and physiological indices: A case study in Changchun city, China. J. For. Res. 2021, 1–12. [Google Scholar] [CrossRef]
- Ren, Z.; He, X.; Pu, R.; Zheng, H. The impact of urban forest structure and its spatial location on urban cool island intensity. Urban Ecosyst. 2018, 21, 863–874. [Google Scholar] [CrossRef]
- Hsieh, C.-M.; Li, J.-J.; Zhang, L.; Schwegler, B. Effects of tree shading and transpiration on building cooling energy use. Energy Build. 2018, 159, 382–397. [Google Scholar] [CrossRef]
- Dong, Y.; Ren, Z.; Fu, Y.; Hu, N.; Guo, Y.; Jia, G.; He, X. Decrease in the residents’ accessibility of summer cooling services due to green space loss in Chinese cities. Environ. Int. 2021, 158, 107002. [Google Scholar] [CrossRef] [PubMed]
- Li, Y.; Kang, W.; Han, Y.; Song, Y. Spatial and temporal patterns of microclimates at an urban forest edge and their management implications. Environ. Monit. Assess. 2018, 190, 93. [Google Scholar] [CrossRef]
- Oshio, H.; Asawa, T. Estimating the Solar Transmittance of Urban Trees Using Airborne LiDAR and Radiative Transfer Simulation. IEEE Trans. Geosci. Remote Sens. 2016, 54, 5483–5492. [Google Scholar] [CrossRef]
- Konarska, J.; Lindberg, F.; Larsson, A.; Thorsson, S.; Holmer, B. Transmissivity of solar radiation through crowns of single urban trees—application for outdoor thermal comfort modelling. Arch. Meteorol. Geophys. Bioclimatol. Ser. B 2014, 117, 363–376. [Google Scholar] [CrossRef]
- Wei, H.; Ma, B.; Hauer, R.J.; Liu, C.; Chen, X.; He, X. Relationship between environmental factors and facial expressions of visitors during the urban forest experience. Urban For. Urban Green. 2020, 53, 126699. [Google Scholar] [CrossRef]
- Liu, P.; Liu, M.; Xia, T.; Wang, Y.; Wei, H. Can Urban Forest Settings Evoke Positive Emotion? Evidence on Facial Expressions and Detection of Driving Factors. Sustainability 2021, 13, 8687. [Google Scholar] [CrossRef]
- Liu, P.; Liu, M.; Xia, T.; Wang, Y.; Guo, P. The Relationship between Landscape Metrics and Facial Expressions in 18 Urban Forest Parks of Northern China. Forests 2021, 12, 1619. [Google Scholar] [CrossRef]
- Zhang, J.; Yang, Z.; Chen, Z.; Guo, M.; Guo, P. Optimizing Urban Forest Landscape for Better Perceptions of Positive Emotions. Forests 2021, 12, 1691. [Google Scholar] [CrossRef]
- Wolf, K.L.; Lam, S.T.; McKeen, J.K.; Richardson, G.R.; Bosch, M.V.D.; Bardekjian, A.C. Urban Trees and Human Health: A Scoping Review. Int. J. Environ. Res. Public Health 2020, 17, 4371. [Google Scholar] [CrossRef] [PubMed]
- Park, B.-J.; Furuya, K.; Kasetani, T.; Takayama, N.; Kagawa, T.; Miyazaki, Y. Relationship between psychological responses and physical environments in forest settings. Landsc. Urban Plan. 2011, 102, 24–32. [Google Scholar] [CrossRef]
- Rathmann, J.; Beck, C.; Flutura, S.; Seiderer, A.; Aslan, I.; André, E. Towards quantifying forest recreation: Exploring outdoor thermal physiology and human well-being along exemplary pathways in a central European urban forest (Augsburg, SE-Germany). Urban For. Urban Green. 2020, 49, 126622. [Google Scholar] [CrossRef]
- An, B.-Y.; Wang, D.; Liu, X.-J.; Guan, H.-M.; Wei, H.-X.; Ren, Z.-B. The effect of environmental factors in urban forests on blood pressure and heart rate in university students. J. For. Res. 2018, 24, 27–34. [Google Scholar] [CrossRef]
- Zhou, C.; Yan, L.; Yu, L.; Wei, H.; Guan, H.; Shang, C.; Chen, F.; Bao, J. Effect of Short-term Forest Bathing in Urban Parks on Perceived Anxiety of Young-adults: A Pilot Study in Guiyang, Southwest China. Chin. Geogr. Sci. 2018, 29, 139–150. [Google Scholar] [CrossRef] [Green Version]
- Guan, H.; Wei, H.; He, X.; Ren, Z.; An, B. The tree-species-specific effect of forest bathing on perceived anxiety alleviation of young-adults in urban forests. Ann. For. Res. 2014, 60, 327–341. [Google Scholar] [CrossRef]
- Liu, R.; Xiao, J. Factors Affecting Users’ Satisfaction with Urban Parks through Online Comments Data: Evidence from Shenzhen, China. Int. J. Environ. Res. Public Health 2020, 18, 253. [Google Scholar] [CrossRef]
- Guan, H.; Wei, H.; Hauer, R.J.; Liu, P. Facial expressions of Asian people exposed to constructed urban forests: Accuracy validation and variation assessment. PLoS ONE 2021, 16, e0253141. [Google Scholar] [CrossRef]
- Bubalo, M.; van Zanten, B.T.; Verburg, P.H. Crowdsourcing geo-information on landscape perceptions and preferences: A review. Landsc. Urban Plan. 2019, 184, 101–111. [Google Scholar] [CrossRef]
- Wei, H.; Hauer, R.J.; He, X. A forest experience does not always evoke positive emotion: A pilot study on unconscious facial expressions using the face reading technology. For. Policy Econ. 2021, 123, 102365. [Google Scholar] [CrossRef]
- Wei, H.; Hauer, R.J.; Zhai, X. The Relationship between the Facial Expression of People in University Campus and Host-City Variables. Appl. Sci. 2020, 10, 1474. [Google Scholar] [CrossRef] [Green Version]
- Evenson, K.R.; Wen, F.; Hillier, A.; Cohen, D.A. Assessing the Contribution of Parks to Physical Activity Using Global Positioning System and Accelerometry. Med. Sci. Sports Exerc. 2013, 45, 1981–1987. [Google Scholar] [CrossRef] [PubMed] [Green Version]
- American Psychological Association. Stress won’t go away? Maybe You Are Suffering from Chronic Stress: Chronic Stress, Which is Constant and Persists over An Extended Period of Time, Can be Debilitating and Overwhelming. Available online: https://www.apa.org/topics/stress/chronic (accessed on 26 April 2021).
- American Psychological Association. APA Dictionary of Psychology. Available online: https://dictionary.apa.org/emotion (accessed on 13 November 2021).
- Wei, H.; Hauer, R.J.; Chen, X.; He, X. Facial Expressions of Visitors in Forests along the Urbanization Gradient: What Can We Learn from Selfies on Social Networking Services? Forests 2019, 10, 1049. [Google Scholar] [CrossRef] [Green Version]
- Hou, W.; Zhai, L.; Feng, S.; Walz, U. Restoration priority assessment of coal mining brownfields from the perspective of enhancing the connectivity of green infrastructure networks. J. Environ. Manag. 2021, 277, 111289. [Google Scholar] [CrossRef]
- Wang, K.; Li, Z.; Zhang, J.; Wu, X.; Jia, M.; Wu, L. Built-up land expansion and its impacts on optimizing green infrastructure networks in a resource-dependent city. Sustain. Cities Soc. 2020, 55, 102026. [Google Scholar] [CrossRef]
- Jing, Z.; Wang, J. Sustainable development evaluation of the society–economy–environment in a resource-based city of China: A complex network approach. J. Clean. Prod. 2020, 263, 121510. [Google Scholar] [CrossRef]
- Climatic Data Centre. Meteorological Data Centre of China Metorological Administration. Available online: https://data.cma.cn (accessed on 18 April 2020).
- Yu, R.; Li, J. Hourly Rainfall Changes in Response to Surface Air Temperature over Eastern Contiguous China. J. Clim. 2012, 25, 6851–6861. [Google Scholar] [CrossRef]
- Fu, Y.; Ren, Z.; Yu, Q.; He, X.; Xiao, L.; Wang, Q.; Liu, C. Long-term dynamics of urban thermal comfort in China’s four major capital cities across different climate zones. PeerJ 2019, 7, e8026. [Google Scholar] [CrossRef] [Green Version]
- Conover, W.; Iman, R.L. Rank Transformations as a Bridge between Parametric and Nonparametric Statistics. Am. Stat. 1981, 35, 124–129. [Google Scholar]
- Fu, G.; Chiew, F.H.; Zheng, H.; Robertson, D.E.; Potter, N.J.; Teng, J.; Post, D.A.; Charles, S.P.; Zhang, L. Statistical analysis of attributions of climatic characteristics to nonstationary rainfall-streamflow relationship. J. Hydrol. 2021, 603, 127017. [Google Scholar] [CrossRef]
- Tsakiri, K.; Marsellos, A.; Kapetanakis, S. Artificial Neural Network and Multiple Linear Regression for Flood Prediction in Mohawk River, New York. Water 2018, 10, 1158. [Google Scholar] [CrossRef] [Green Version]
- Larsen, J.T.; McGraw, A.P.; Cacioppo, J.T. Can people feel happy and sad at the same time? J. Personal. Soc. Psychol. 2001, 81, 684–696. [Google Scholar] [CrossRef]
Publisher’s Note: MDPI stays neutral with regard to jurisdictional claims in published maps and institutional affiliations. |
© 2022 by the authors. Licensee MDPI, Basel, Switzerland. This article is an open access article distributed under the terms and conditions of the Creative Commons Attribution (CC BY) license (https://creativecommons.org/licenses/by/4.0/).