Article

Sustainability Assessment of Solid Biofuels from Agro-Industrial Residues Case of Sugarcane Bagasse in a Mexican Sugar Mill

by
Fabio L. Manzini Poli
1,
Jorge M. Islas-Samperio
1,*,
Carlos A. García Bustamante
2,
Julio C. Sacramento Rivero
3,
Genice K. Grande-Acosta
1,
Rosa M. Gallardo-Álvarez
2,
Ricardo Musule Lagunes
2,
Freddy Navarro Pineda
3 and
Christian Alvarez Escobedo
1
1
Instituto de Energías Renovables, Universidad Nacional Autónoma de México, Priv. Xochicalco s/n, Col. Centro, Temixco 62580, Mexico
2
Escuela Nacional de Estudios Superiores Unidad Morelia, Universidad Nacional Autónoma de México, Morelia 58190, Mexico
3
Facultad de Ingeniería Química, Universidad Autónoma de Yucatán, Periférico Norte Km. 33.5, Tablaje Catastral 13615, Col. Chuburna de Hidalgo Inn, Merida 97203, Mexico
*
Author to whom correspondence should be addressed.
Sustainability 2022, 14(3), 1711; https://doi.org/10.3390/su14031711
Submission received: 2 December 2021 / Revised: 31 December 2021 / Accepted: 31 December 2021 / Published: 1 February 2022

Abstract

:
Motivated by the environmentally driven energy transition we live in, the valorization of biomass residues from the agro-industry as renewable energy can play an essential role in GHG emissions mitigation. To overcome the debate on the production and use of solid biofuels (SBF), in this study, we apply an integrated multicriteria tool for the assessment of the sustainability use of agro-industrial residues (AIR) as solid biofuels. Mexico has a vast AIR production, but frequently, the AIR are considered waste biomass. Still, when valorized, SBF do not have adverse effects on soil quality, are not responsible for biodiversity loss, and compete against food production as first-generation SBF. Nevertheless, the AIR present other environmental, social, and economic impacts that have not been adequately evaluated; therefore, we identified the need for a sustainability assessment of energy systems based on the use of SBF–AIR as input fuels. After reviewing previous work on sustainability assessment methodologies, multicriteria decision analysis methods, and indicator weighting methods, we considered it appropriate for this problem to apply a tool that integrates the entropic indicator weighting method into the discrete multicriteria decision analysis method called PROMETHEE. In terms of selected sustainability indicators, this tool was used to assess four electric energy supply systems of a Mexican sugar mill as a case study: current bagasse cogeneration, efficient bagasse cogeneration, a power generation system fueled only with fuel oil, and grid electricity only. Finally, after evaluating the mentioned energy systems with four sustainability indicators: GHG emissions, PM emissions, employments per energy unit (JOBS), and the net present value (NPV) of each alternative, we found the net outranking flow of the efficient bagasse system (EBS). which is the most sustainable system because it has the highest outranking flow value from the four considered alternatives, since it has the lower GHG emissions, reducing the current bagasse GHG emissions by 55% and the PM emissions by 58%. The EBS also shows the highest NPV system due to surplus electricity sales, resulting in the most profitable energy system analyzed.

1. Introduction

Solid biofuels (SBF) are defined as solid fuels produced directly or indirectly from biomass; their raw material is firewood, residues from forests (FR), from agriculture (AR), and from agro-industries (AIR) mainly. SBF are maintained in a solid state until a combustion reaction occurs to satisfy an end-use [1]. In general, SBF production follows one of two process types: thermochemical (pyrolysis, carbonization, and torrefaction) or densification (briquetting, pelleting, or chipping) [2]. The contribution of SBF to the world’s consumption of primary energy reached 42.2 EJ in 2017, corresponding to 63% of the total participation of renewable energies and 11.4% of the total energy consumed during that year in the world (370 EJ). The traditional use of SBF as firewood still represents 65% (27.4 EJ) of the total amount, mainly in the residential sector for cooking and space heating. Modern technologies consume the remaining 35% (14.8 EJ), 4% (1.6 EJ) for electricity generation and 31% (13.2 EJ) for industrial heat [3]. According to [4], by 2040, SBF’s electricity generation will increase at an average annual growing rate (AAGR) of 5.1%, and SBF’s heat generation will have a 2.7% AAGR, this last mainly due to process heat in industry and space conditioning in the residential sector [5].
Some authors expect that the traditional use of firewood and charcoal will continue mainly in developing countries but globally will decrease at an average annual rate of −0.5% by 2040 [4]. This prediction is based on two assumptions: (1) according to calculations made by [6], between 2015 and 2050, the world’s rural population will decrease at an annual rate of −0.3%, and (2) there will be a substitution of firewood by fossil fuels in urban areas [7]. Additionally, traditional firewood use is associated with unsustainable exploitation of the forest, which translates into 5% of annual deforestation [8] and 34% of yearly forest degradation [9].
In Mexico, in 2017, the final energy consumption was 5363 PJ, where SBF contributed 367 PJ, corresponding to 5.6% of the final energy consumption (4.7% firewood and 0.9% sugarcane bagasse), also corresponding to 50.2% of the total share of renewable energies [10] of the final consumption. Traditional use of SBF represent 68% (250 PJ), firewood 206 PJ and charcoal 44 PJ as primary cooking fuels, adopting shares from [11]. Modern technologies currently burn the remaining 32% (117 PJ).
The modern use of SBF comes from biomass originally from residues from forests, agriculture, and agro-industries. The use of SBF derived from residues avoids negative impacts of plantations such as conflicts over changes in land use and loss of biodiversity [12,13] or those associated with land competition and land for energy crop plantations vs. land for food crops [14]. AIR give rise to other impacts that are not usually adequately evaluated because they are mitigated when they are valued for their nutritional, mechanical, or energy properties [15].
The energy potential from available Mexican AIR amounts to 127.8 PJ/year, according to the recent assessment of [16], where sugarcane bagasse represents 56.4%, maize cob 38.3%, coffee pulp and hull 2.3%, agave bagasse 2.0%, and barley husk, groundnut shells, and rice husk 1.1%. Consequently, sugarcane bagasse currently is the most consumed AIR in the country.
The current AR and AIR management in Mexico generates numerous impacts; among them is the traditional practice of slash-and-burn, which causes at least 44% of forest fires [17]. Additionally, in many cases, the AR that remain in the field after harvesting are burnt. Both activities emit particulate material, 30% of PM is black carbon [18], a greenhouse effect compound [14]. In addition, AIR are left in open air dumps all over the country, providing an appropriate environment for pathogen incubation, sheltering harmful fauna, and affecting local biodiversity [19]. The bacterial decomposition of AIR generates biogas emissions rich in methane (an important GHG) [20]; it may also produce toxic leachate flows contaminating water sources [21]. In summary, this final disposal practice of AIR affects the ecosystem and human health and represents an economical expense [22].
On the other hand, if AIR are transformed into SBF employing appropriate technologies, these SBF can also provide a local source of energy at a low cost and generate security in the energy supply, employment, and a lower environmental impact [23]. Additionally, it can reduce emissions of GHGs and water pollutants, as well as health and biodiversity impacts [24].
Moreover, sustainable management of AR and AIR can generate economic income by converting them into SBF [25], especially when substituting fossil fuels, reducing their consumption and GHG emissions, and developing a bio-economy strategy [26]. The production and service chains of Mexican agribusiness generate many wastes, presumably of non-commercial quality; however, some AIR can be valued as renewable energy in the form of SBF to cover heat energy needs and adequate final waste disposal [27]. AIR can also incorporate significant economic co-benefits such as the zero or low cost of raw material and cost reductions in biomass logistics, in addition to competing favorably against other renewable energies and fossil fuels.
To develop the untapped energy potential of AIR as SBF sustainably and improve the sustainability of the current energy use of AIR in Mexico, a literature review on sustainability assessment methods of solid biofuels derived from agroindustrial residues was undertaken. We found out that a vast number of authors apply LCA to determine only the environmental impacts of SBF energy systems [20,21,22,23,27,28,29,30,31,32]. However, fewer authors incorporate elements of the economic dimension along with environmental impacts through technical–economic assessments (TEA) of the use of AIR for heat generation [19,25,33,34]; this last article presents the TEA of current use of orange peels and the potential use of sugarcane straw to generate heat from a fruit-processing facility in Mexico. Moreover, few articles analyze three sustainability dimensions: the social, economic, and environmental dimensions of energy systems that use SBF–AIR were found. Among the few is [35,36,37] that present a sustainability assessment methodology based on a set of sustainability indicators, each one evaluated independently without aggregation and using LCA. Manara and Zabaniotou [35] apply their methodology to a case study to evaluate an AIR use energy system for heat and electricity generation on a micro-scale. They perform a sensitivity analysis on each indicator’s preliminary results. They manage to identify the critical factors for this kind of energy system’s social adoption and economic feasibility. Finally, they also identify an increase or decrease in these factors as signals towards greater or lesser sustainability.
Myllyviita [38] assessed the sustainability of pellets produced from wood industry co-products using indicators belonging to a recognized sustainability indicator set. These authors applied a Multi-criteria analysis method (MCA) called the analytical hierarchical process (AHP) to convert the stakeholders’ value judgments or preferences (experts and users) on each indicator’s weight. Once the indicators have a value and a specific weight factor, they were added to form an integrated index comprising the social, economic, and environmental dimensions for each alternative.
When searching for methods for sustainability assessment of energy projects, we found out that a large number of studies apply multicriteria analysis methods (MCA) to aggregate sustainability indicators in a single sustainability index [38,39,40,41,42]. This broad application of MCA arises from the multi-dimensional nature of sustainability assessments, which has to make use of indicators of very diverse nature in order to reflect the complexity of the biophysical and socio-economic systems that come into play; condensing into a single value helps to achieve a rational outcome [39], even when stakeholder preferences diverge.
MCA methods may be classified into continuous or discrete types. We observe that in general, sustainability assessments are discrete choice problems because, in contrast to continuous type MCAs, which present a theoretically infinite number of alternatives defined by an objective function [43], sustainability assessments present a reduced number of alternatives [39], which are evaluated by indicators that can be quantitative or qualitative. It is necessary to point out that, in order to include qualitative indicators in an MCA, they must be previously subjectively qualified with a value judgment expressed on a numerical scale. Thanks to this numerical expression of qualitative variables, it is possible to carry out an inclusive formal assessment of sustainability-related aspects to society, such as the level of well-being [38].
Discrete MCA types include the AHP mentioned above [44], the multi-attribute analysis theory (MAUT) [42], preference ranking organization method for enrichment evaluations (PROMETHEE) [45,46] and the elimination and choice translating reality (ELECTRE) Method [47]. The last two are named overclassifying methods because they reduce the size of the alternatives set by comparing indicators between alternatives [38], dividing the set of alternatives into two subsets depending on the indicators’ magnitude differences: more favorable and less favorable alternatives. This overclassification leads to a domination degree of one alternative over the other, facilitating its hierarchical order. An overclassifying method’s advantage is that it can use information with incomplete values. This characteristic is advantageous in evaluating SBF–AIR because intermittence is frequent when collecting measured data in the agro-industry. Another advantage of overclassifying methods is to avoid extreme assumptions concerning the validity of the main actors’ preferences [48]. For this reason, they are considered very suitable for the evaluation of renewable energy projects [49,50] and have also been used successfully in evaluations of energy systems sustainability [51]. However, while ELECTRE ignores the magnitude of differences between indicators of alternatives and only pays attention to preferences to determine a hierarchical order, PROMETHEE measures the difference between indicators by pairs of alternatives and uses preference functions to identify unmistakably the preferred alternative instead, which results in the alternatives hierarchization [52]. According to [36], PROMETHEE performs better than other overclassifying methods due to its ability to measure the differences between alternatives.
However, any problem involving alternatives evaluation through specific criteria or indicators requires the determination of the relative importance or specific impact of those indicators that are usually characterized by the weight assigned to it in an evaluation and have a decisive influence on evaluating the alternatives.
Among the methods to determine the weight factors ( w j ) of the indicators are the hierarchical weighting methods and the equal weights method [39,53,54]. There are three types of hierarchical weighting methods distinguished by the use of quantitative or qualitative information on the relative importance of the indicators: subjective weighting methods, objective weighting methods, and combined weighting methods. In the equal weighting method, as its name implies, the weight assigned to each indicator is the same; a decision-maker uses it when there is not enough knowledge to decide the importance of an indicator. A serious disadvantage of this method is its ignorance of each indicator’s relative importance [39].
In the case of subjective weighting, the experts who evaluate can explain their evaluation clearly; however, this judgment depends above all on the existence of professionals who have the knowledge and information necessary to form a preference and issue an assessment of the relative importance of an indicator [39]. Combined or integrated methods are those that combine a subjective weighting with an objective weighting for the same indicator, in order to reduce, on the one hand, the possible lack of experience or knowledge of the evaluating expert and, on the other hand, obtain weightings opposed to common sense [55]. When these weight factors are combined, they form a hybrid weighting factor.
Objective methods use mathematical methods to process measured quantitative data and consequently obtain a degree of difference between indicators, which signifies their importance. Among the most used objective weighting methods according to [39] are the following three: (1) the horizontal and vertical optimal weighting method, (2) the technique for order preference by similarity to ideal solution (TOPSIS), and (3) the entropic method. The first two methods reflect the differences in the behavior of the entire system to be evaluated. Because our problem involves field measurements of indicators of a very diverse nature, economic, social, and environmental, we consider that it is convenient to use the entropic method because it reflects the relative importance between indicators based on the differences between alternatives of an indicator for the same criterion. While TOPSIS and the horizontal and vertical methods evaluate the data of already integrated indicators, the entropic method performs its evaluation based on the differences of the indicators by criterion [39].
To perform a sustainability assessment of an energy production system with SBF from AIR, we consider it necessary to use sustainability indicators that explicitly display impacts on the environment, economy, or society. For example, we need indicators where the quantitative difference between the impact value of this SBF system and an energy system fueled with fossil fuels could be precisely calculated.
Among the characteristics of these chosen indicators are that they must be measurable and applicable at the local or project level, they must reflect the preferences of all related actors, and also, according to [56,57], an indicator that seeks to measure sustainability must be related to known threshold values, minimum or maximum limits, or both. However, there are indicators for which limit values cannot be defined, and yet they can represent sustainability conditions [58,59].
To evaluate the positive and negative effects of taking advantage of AIR to transform them into SBF and use them in combustion energy systems or devices, it is necessary to measure the variables that reflect the maximum changes concerning a situation in the absence of the proposed energy production system. When regarding the economic dimension, it is necessary to introduce sustainability indicators that show its advantages as the null or low cost of the residues as raw material and the avoided costs of logistics and final disposal that produces their utilization [60]. It is also necessary to introduce social indicators that reflect the creation of jobs involved in logistics and transforming the AIR to SBF and use them in final energy technologies. Other examples are the salary level and health benefits by avoiding infection sources due to open-air dumps [60]. We also need to assess the environmental benefits of avoiding air pollution due to the emission of criteria pollutants and greenhouse gases throughout their life cycle and accounting normally as avoided emissions by the fossil fuels substitution [35].
In an updated literature review, we have found that some authors, refs. [61,62] particularly, use an integrated assessment approach that applies the integration of a multicriteria analysis method called PROMETHEE to rank alternatives and the entropic method to calculate criteria weighting coefficients.
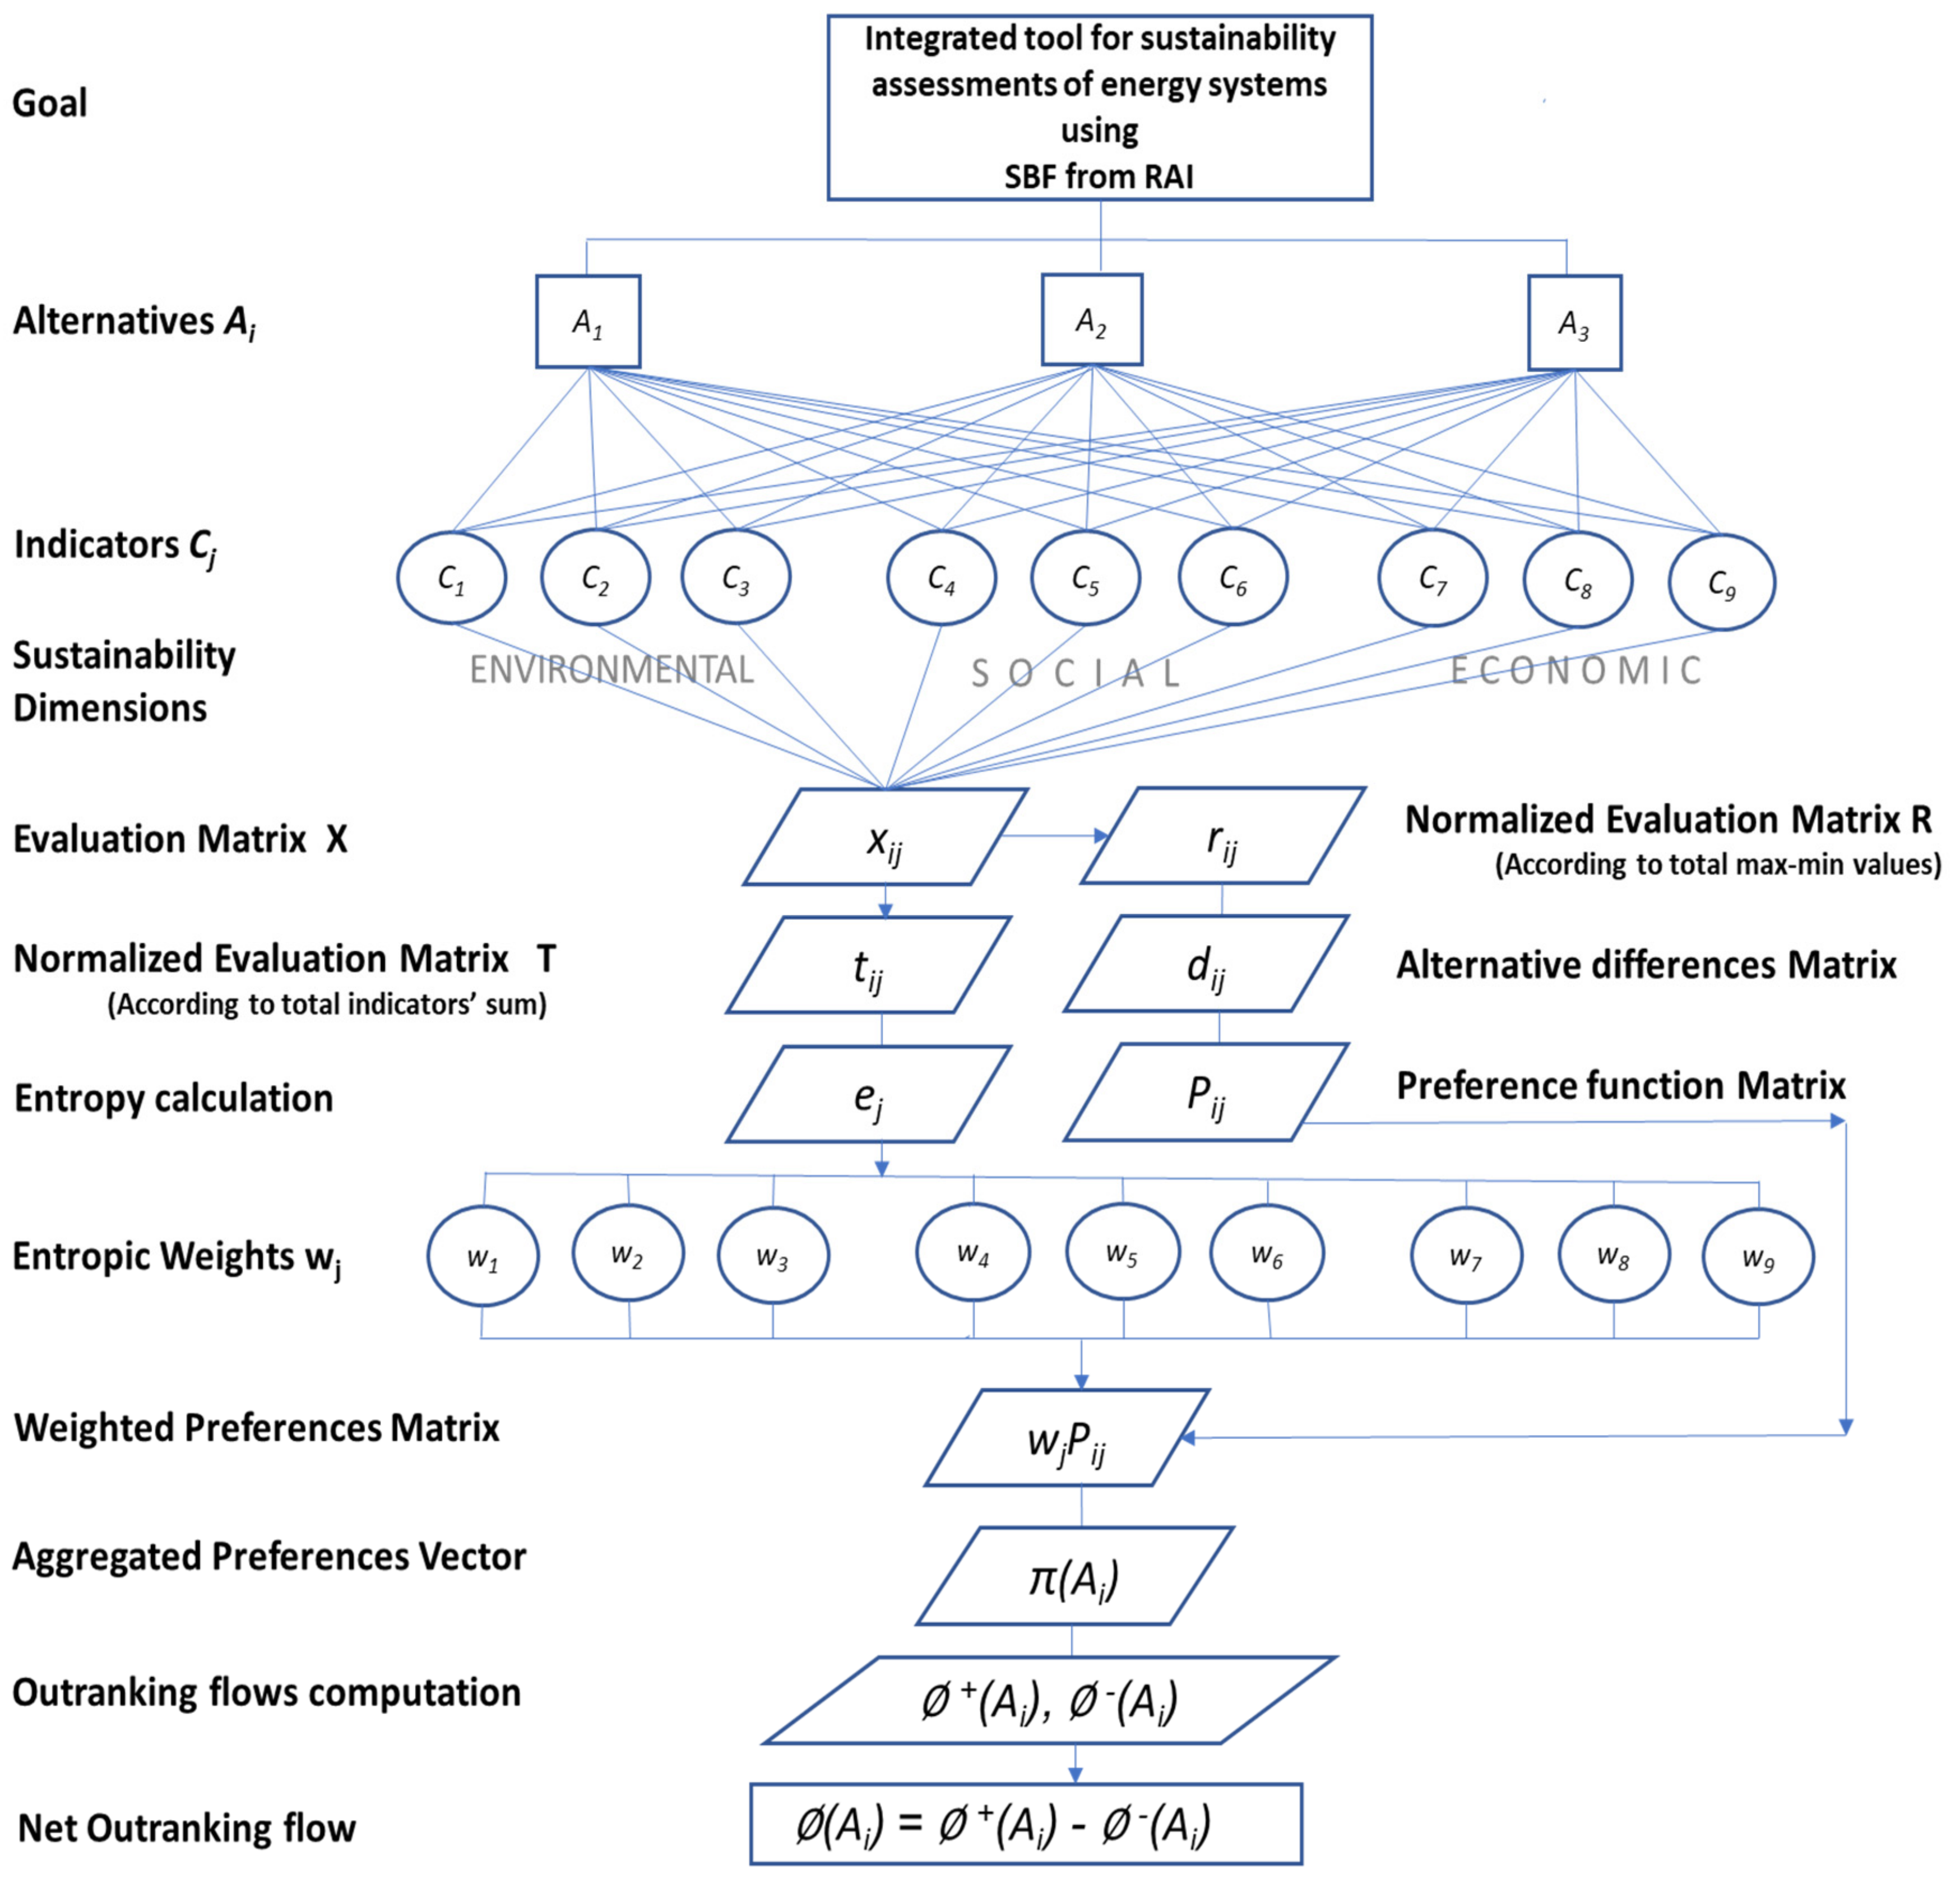
This article aims to make a sustainability assessment of energy systems that use solid biofuels made of agro-industrial residues for heat and power generation. Therefore, we apply a similar tool that integrates the PROMETHEE method to assess energy systems and the entropic method to calculate the weighting coefficients of the sustainability indicators (of the social, economic, and environmental sustainability dimensions) to perform an energy systems evaluation reaching a single aggregated value to rank each energy system sustainability compared to each energy system and considering all sustainability indicators avoiding single indicator calculation bias.
The novelty of this article is to show that the application of this tool can provide adequate sustainability assessments of energy systems/technologies considering the conditions of the Mexican agro-industrial sector. Frequently, it is not very easy to gather a group of experts that can give their opinion on various technological alternatives to SBF–AIR and discuss the relative importance of the few sustainability indicators to be constructed for energy systems using SBF. This indicator’s scarcity is mainly due to a lack of available information for assessing the socio-economic–environmental effects caused by the usage of SBF derived from forestry, agricultural, and agro-industry residues.

2. Theoretical Framework

Among all the MCA methods presented in the previous section, we chose the PROMETHEE method to perform the SBF–AIR systems’ sustainability assessment and ranking. This method is a technical–scientific tool able to handle discrete indicators of quantitative and qualitative nature. Its theory is very understandable, and its calculation procedure is easily programmable [39]. It facilitates performing evaluations clearly and consistently, especially in the renewable energy sector [50], and in particular in the bioenergy sector [63]. Initially, the PROMETHEE method was proposed by Brans in 1982 for multicriteria analysis problems. This method’s base compares values by pairs accounting for the differences between two alternatives for a particular indicator [46]. The idea is that the more significant the difference between alternatives, the greater the degree of preference. Brans and others [46,50,64,65] show a detailed description for implementing PROMETHEE. In general, a sustainability assessment depends mostly on selecting the proper sustainability indicators, in this case, for SBF–AIR systems or alternatives. In particular, this study restrained the selected sustainability indicators to the general characteristics of the 24 indicators of the existing sustainability assessment framework called the Global Bioenergy Partnership (GBEP) [58,66,67]. It is common to employ these GBEP indicators to evaluate sustainability policies at the national level; however, this study applies these sustainability indicators locally since that is the level at which GBEP derived them [58].
As mentioned in the previous section, PROMETHEE requires externally introduced weight factors to determine the relative importance of each sustainability indicator. For that purpose, we will use the integration in our methodology of the entropic weighting method to determine objectively the weight factors of each indicator [59].
The entropic weighting method is so named because it uses Shannon’s concept of information entropy, interpreted as a measure of uncertainty in information formulated in terms of probability theory [68] cited in [69]. It is an objective weighting method of a set of indicators that assesses the relative importance of an indicator concerning the amount of measurable useful information it represents. According to [70], this method allows determining the contrast degree of useful information that an indicator contains when comparing several alternatives through different indicators. If the difference between the value of an indicator’s alternatives is high, the entropy will be small, which shows that the distinctive characteristics of that indicator offer more information by having a higher contrast and, therefore, it should be assigned a higher weight. Otherwise, the relative weight should be reduced [71].
Since most energy projects involve measurable variables and indicators, it is adequate to use the entropic method, instead of subjective methods, to calculate each indicator’s weight because obtaining expert opinion evaluations in SBF–AIR’s energy use is difficult and time-consuming. Nevertheless, the precision of this mathematical weighting method will depend exclusively on data quality.
We chose the integration of the PROMETHEE and entropic weighting methods for the following reasons: (1) It has been successfully applied in numerous sustainability assessments of energy systems. (2) The PROMETHEE method shows multiple advantages over other MCDA outranking methods. (3) The objective entropic weighting method can readily satisfy the need for exogenous weighting factors in PROMETHEE due to its ability to identify the indicators with the most useful information without the need for exhaustive expert information input.

3. Methodological Framework for the Sustainability Assessment of Solid Biofuels Derived from Agro-Industrial Residues

The methodology to integrate the methods described in the previous section to build a tool, useful to evaluate the sustainability of energy systems/projects based on the use of SBF–AIR, is described step by step in the next paragraphs and it is illustrated in a block diagram in Figure 1.
First, identify the m as the number of alternatives A to be compared (m = 3 in Figure 1, as an example); in this case, energy systems involving the use of solid biofuels made from agro-industrial residues for thermal and electrical power generation are identified, and systems using conventional fossil fuels can also be included. Each of the energy systems is considered an energy system alternative; they form a set A1, A2,…Aj,…, Am of m alternatives.
Second, select a number n of recognized sustainability indicators carefully chosen to form a set C1, C2,… Ci,…, Cn, that must comply with the GBEP principles, as promoting energy efficiency and greater bioenergy use in the first place, with the objective of evaluating each alternative of using SBF from AIR. These selected indicators of sustainability’s environmental dimension should highlight the advantage of using AIR instead of biomass obtained from crops or plantations. Thus, the selected economic dimension indicator should demonstrate the economic viability of the AIR. Additionally, the selected indicators aim to capture the avoided impacts to water, soil, and human health, and should promote compliance with AIR’s ultimate disposal government regulations and avoid greenhouse gas emissions by substituting fossil fuels.
Third, with the m alternatives and n indicators, we build an m-by-n evaluation matrix X, where each element x i j (i = 1,2,…,m; j = 1,2,…,n) is the calculated value of the j alternative through the indicator i. In matrix notation, we have:
X = x 12 x 1 j x 1 n x i 1 x i j x i n x m 1 x m j x m n

3.1. Weight Factor Determination with Entropic Method

To obtain each indicator’s weight factor, we apply the Shannon entropy weight method, which follows the next steps, according to [72,73].
Fourth, normalization of the evaluation matrix is performed, dividing each element by the total indicators’ sum (see Equation (2)) and obtaining a normalized matrix T (Equation (3)).
t i j = x i j i = 1 m x i j
T = t 12 t 1 j t 1 n t i 1 t i j t i n t m 1 t m j t m n
Fifth, we calculate the entropy ej related to each indicator using Shannon’s entropy formula (Equation (4)):
e j = 1 ln m i = 1 m t i j l n ( t i j )
Additionally, the entropy weight factor w j is a vector defined in terms 1 e j , which is called the information’s degree of diversity; an indicator with high diversity corresponds a high weight factor of the jth indicator (Equation (5)).
w j = 1 e j m j = 1 n e j
where:   0 w j 1 and
j = 1 n w j = 1

3.2. Alternatives Ranking with PROMETHEE

To obtain an outranking of alternatives A, we apply the Visual PROMETHEE computing program [74], where the PROMETHEE II method is codified and easily accessed. The next step should be followed.
Sixth. The evaluation matrix, previously defined in the third step, is normalized by dividing each element by the difference of the maximum versus the minimum indicator values, defining previously whether the indicator should be maximized (Equation (7)) or minimized (Equation (8)), depending on the indicator’s trend towards greater sustainability in this case.
r i j = x i j m i n j x i j m a x j x i j m i n j x i j
r i j = m a x j x i j x i j m a x j x i j m i n j x i j
where: 0 ≤ rij ≤ 1
Obtaining the normalized matrix. (Equation (9))
R = r 12 r 1 j r 1 n r i 1 r i j r i n r m 1 r m j r m n
Seventh. The differences between each normalized evaluated alternative and the rest of the elements evaluated through that indicator must be calculated.
d i j = d i j r i j , r i j = r i j r i j           i i ,   i = 1 ,   , m ; j = 1 , , n
and
d i j = d i j r i j , r i j = r i j r i j           i i ,   i = 1 ,   , m ; j = 1 , , n
Eight. depending on the magnitudes of the previously computed differences, a preference function is selected depending on the thresholds considered by the stakeholders. We choose the USUAL preference function P i j (defined in Equations (11) and (12)) to exemplify the case when there is not defined threshold values.
P i j = P i j r i j , r i j = 0                     i f   r i j r i j 0 ,     i i
and
P i j = P i j r i j , r i j = r i j r i j         i f   r i j r i j > 0 ,     i i
Ninth. As stated by Brans [46] a weighted preferences matrix is constructed w j P i j , using the two previous equations and the weight factors obtained in the fifth step (Equation (5)). That is used to compute an aggregated preferences vector π A i for each alternative. (Equations (13a) and (13b)).
π A i = π i r i j , r i j = j = 1 n w j P i j r i j , r i j j = 1 n w j
  i i
With, from Equation (6):
j = 1 n w j = 1
Tenth. Outranking flows are obtained from Equations (14a) and (14b), where the aggregated preferences vectors are summed up. A positive or leaving flow is defined by Equation (14a) and the negative or entrance flow is defined by Equation (14b) for each Ai alternative constituting the + and vectors.
+ A i = i = 1 m Π A i m 1
A i = i = 1 m Π A i m 1
Eleventh. The net outranking flow is a net preference index vector calculated for each alternative Ai, where the alternative with the highest value is the one with greatest benefits; it is computed with Equation (15).
( A i ) = + A i A i ,     i i
where:
1 < ( A i ) < 1
The positive leaving flow states the extent to which each alternative outperforms all other alternatives. + A i   represents the strength of A i , its outperformance character. According to Kocmanová [75], + A i expresses how much one alternative is dominating the others. The higher + A i , the better the alternative. The negative entering flow states the extent to which all other alternatives A i outperform each alternative. The lower the A i ,   the better the alternative. A i   represents the weakness of A i , its tendency to be overwhelmed. The net flow ( A i ) is the difference between positive and negative outranking flows in the range of −1 to +1. The higher this value is, the better the alternative [72,73].
Visual PROMETHEE software includes a solution viewer called GAIA, where all criteria are plotted as arrows and all alternatives as points on a two-dimensional plane [46,72,74]. The longer the arrows, the more critical the criteria will be. It is an easy-to-use tool that helps to visualize a decision-making problem in a two-dimensional representation. GAIA helps to identify conflicts between criteria, as is the case if they point in opposite directions. It also helps to identify which criteria favor an energy system; the closer an energy system is to the center of the indicator arrow, the more it will be favored by the indicator.
An important GAIA feature is called the decision axis, represented by a red arrow. It is calculated from the criteria’s plane components and their weighting factors. It is helpful to identify the more favorable energy system, which will be located closest to the decision axis arrow. In our case, due to the criteria we use to evaluate the alternatives/energy systems being sustainability indicators, we will identify the best alternative as the most sustainable energy system among those evaluated.

4. Case Study: Application of the Sustainability Assessment Tool to Sugarcane Bagasse for Cogeneration of Heat and Electricity in a Mexican Mill

Sugarcane bagasse is the main fuel in 51 sugar mills for heat and power cogeneration [10]. In 2015, its total installed capacity was 795 MWe generating an average of 1276 GWh/year, corresponding to 0.46% of the national electricity generation [76].
An important environmental impact of sugar mills is their particulate matter emissions (PM); according to the Mexican National Emissions Inventory [77], the burning of sugarcane bagasse for energy production in sugar mills generated 104.5 thousand tons of particulates in 2015, where 96% corresponds to PM2.5 fraction, constituted by 30% of black carbon (BC), responsible for the 5.3% of Mexican greenhouse gases (GHG) emissions. Sugar mills generate more than one third (34.9%) of BC national emissions [18,77]. These BC emissions are mainly due to the inefficient combustion of bagasse in obsolete boilers, in which the useful life is long due in almost 90% of sugar mills in Mexico [78,79]. In order to mitigate these GHG emissions, there is a line of action in the Mexican Special Climate Change Program [80] for increasing the number of efficient cogeneration systems in sugar mills with surplus electricity sales to the national grid from 895 to 2893 GWh/a in the 2018–2050 period [81] and an emission standard to reduce particulate emissions (Including PM10, PM2.5, and, consequently, BC) and other criteria pollutants due to sugarcane bagasse combustion for steam generation in sugar mills [18].
This standard is programmed to enter into force after December 2021, as stated in the National Quality Infrastructure Programme 2021 [82]. Attending to this important agroindustry, we agreed to identify as our case study a sugar mill located in the state of Veracruz; it is one of the existing sugar mills in Mexico where sugarcane bagasse is used in boilers where steam is generated for sugar manufacturing process and to provide mechanical power through mills, centrifugal pumps, fans, and condensing steam turbines coupled to electricity generators. Additionally, thanks to cogeneration with bagasse, the specific fuel oil consumption per sugar mass unit has been reduced. In 2016, 21 mills no longer consumed fuel oil and used sugarcane bagasse exclusively for their electricity production, inside and outside the harvest season [83].

4.1. Selected Sustainability Indicators Description

As mentioned previously in Section 2, to perform a sustainability assessment of SBF–AIR, we selected a set of sustainability indicators among the 24 Global Bioenergy Partnership (GBEP) indicators [58,66,67]. Additionally, we had access to firsthand information through surveys to field and sugar mill factory workers and management heads. Considering both sources, we chose the following four sustainability indicators to assess the energy systems (see Table 1). The questionnaire used to retrieve the data and the data retrieved are presented in Section C of the Supplementary Materials.

4.1.1. Greenhouse Gas-Specific Emissions (GHG)

This sustainability indicator from the environmental dimension addresses the total GHG life-cycle emissions of a power generation system, divided by the total electricity generated. In this case study, we followed the life cycle analysis methodology of the ISO 14040/14044 standards [84,85] to evaluate GHG emissions in all the studied energy systems, expressed in grams of carbon dioxide equivalent per kilowatt hour of generated electricity (gCO2e/kWh). We adopted the specific GHG emissions of inputs and used fuels from Biograce [86].

4.1.2. Particle Emissions (PM)

This sustainability indicator from the environmental dimension addresses the total PM life-cycle emissions divided by the total electricity generated. We performed the indicator’s evaluation for the stages of the manual harvest of the sugarcane and the bagasse’s combustion for steam generation in the sugar mill. For the sugarcane’s manual harvest, it is common to set fire to the growing areas; in this process, only the dry leaves (also called sugarcane trash) close to the ground are burned, facilitating hand cutting process with a machete and scaring away dangerous fauna such as rodents or snakes. From the official literature, we consider that 95% of the cultivated area is manually harvested according to [87]. The data to evaluate the indicator were obtained from Table S8 of the Supplementary Material, noting that the environmental load was completely attributed to energy. The specific particulate matter emissions per unit power from bagasse energy systems were calculated and expressed in grams of PM per kilowatt hour of generated electricity (gPM/kWh).

4.1.3. Direct Employment Indicator (JOBS)

This sustainability indicator from the social dimension addresses the benefits of adopting a specific energy system expressed in the number of new employments per GWh. We consider direct employments as those that can be directly attributed to bioenergy production, excluding indirect and induced jobs, as defined in [88]. We include the employments needed in sugarcane production, harvest, and transportation and the new employments for power cogeneration in the AS. Since different employments have different terms, for example, the harvest only takes place for four months. Thus, we considered that annual employment in this industry should cover 1800 h [87], for which we multiply the actual working days by 8 h and divide them by 1800. Because the primary process is the production of sugar, and bioenergy is a secondary product, we assigned direct employments to bioenergy following the economic criteria, as was performed in the case of the indicators of greenhouse gas emissions.

4.1.4. Net Present Value (NPV) Indicator

The net present value (NPV) is an economic dimension indicator that allows determining the projects’ viability; bioenergy projects using solid biofuels in this article. The NPV method is well-established and well-known [89]. The equation for calculating the indicator is as follows:
NPV = t = 0 T CF t 1 + i t
NPV is the net present value; i is the discount rate; CF is the cash flow; t is the cash flow year, and T is the evaluation period. We made the following assumptions to undertake NPV calculations: constant 2017 US dollars as monetary unit, a discount rate of 10%, 25 years as the evaluation period, and fuel prices and the electric power selling price at the grid node closest to the sugar mill obtained from official publications. See Table 2 and Supplementary Materials for evaluation data, assumptions, and information sources for this indicator and the previous ones.

4.2. Energy Systems Alternatives

The energy system studied consists of cogeneration through sugarcane bagasse obtained from milling process in sugar production in a sugar mill. The Mexican agency for energy efficiency [94] identified that, once the internal sugar mill electricity requirements are satisfied, a significant electricity surplus from cogeneration potential in Mexican sugar mills may be available. In this case study, where electricity is the only energy product of interest, life cycle indicators are used to evaluate the sustainability of a sugar mill cogeneration system. The following assumptions were made: 1 kWh is the assumed functional unit, the allocation criterion is through economic value; in this sense, it should be noted that, although there is a market value for the sugarcane bagasse, currently the selected sugar mill in Veracruz does not report bagasse sales, so for the evaluation of this indicator, we do not assign emissions to bagasse due to the cultivation, harvesting, and transportation stages. The Mexican electricity system’s specific GHG emission factor comes from official sources [33].
We will provide the sustainability assessment of four energy systems for cogeneration in the Veracruz sugar mill, a current bagasse system (CBS), an efficient bagasse system (EBS), a fuel oil only (FOS), and a grid electricity only (GES) where all the electricity is purchased.

4.2.1. Current Bagasse (CBS)

Initially, the energy system’s boundaries include sugarcane cultivating and harvesting, transportation, preparation, sugarcane milling, and power cogeneration; see the general CBS and EBS scheme in Figure 2. The output considered is the electricity generated by the energy system. The inputs considered in the CBS are the currently used in the selected sugar mill: fossil fuels, chemicals, fertilizers, pesticides, electricity for irrigation, and electricity from the national grid for sugarcane preparing and milling. Additionally, a small amount of residual fuel oil is consumed, and the sketched industrial phase is where electricity is generated for self-consumption within the mill, using approximately 99% bagasse and 1% fuel oil, which is used only during the milling start-up season, at the beginning of the sugarcane harvest period, called “zafra” in Mexico. Figure 3 shows the CBS’s energy generation and use stages scheme, starting at S1, where water is pumped at 15 atm into the bagasse boiler; the generated steam, S2, is split into two lines, both pressurized at 15 atm; S4 is the sugar making process, and S3 is a low-pressure 5 MW steam turbine for power generation. Most of this study’s primary data were obtained first-hand from questionnaires the selected sugar mill’s CEO, and the published official information from the sugar industry was also used [95]. Table 2 and Table 3 provide the technical input data for the analyzed energy system. See Tables S1–S6 in the Supplementary Materials for detailed information on the ASPEN Plus simulation.
Additional assumptions: official GHG and PM emission factors were used, see Tables S7 and S8 of the Supplementary Material and Table S9 for JOBS indicator details. Regarding the NPV indicator, we assumed no investment costs were incurred, but there were costs for operation and maintenance, for the purchase of fuel oil, and electricity. See Table S10 in the Supplementary Material and Table 4.
Additional assumptions: official GHG and PM emission factors were used, see Tables S7 and S8 of the Supplementary Material and Table S9 for JOBS indicator details. Regarding the NPV indicator, we assumed no investment costs were incurred, but there were costs for operation and maintenance, the purchase of fuel oil, and electricity. See Table S10 in the Supplementary Material and Table 2.

4.2.2. Efficient Bagasse System (EBS)

In the EBS, as in the CBS, the same amount of sugarcane bagasse is burned to generate heat and electricity. However, higher efficiency is reached when most important equipment is substituted in this energy system. Steam production now takes place in a new high-pressure bagasse boiler (50 atm), reached with a new high-pressure water pump, S1 in Figure 4, which shows the EBS energy generation and use stages scheme. After the boiler, the high-pressure steam S2 enters a new high-pressure extracting–condensing steam turbine that drives a power generator. The steam exits the 12 MW steam turbine that drives a power generator, producing surplus electricity after fulfilling all internal demand. Low pressure steam exits the turbine S3 at a pressure of 15 atm, adequate to supply all process heat demand for sugar manufacturing and turbomachinery needs.
We developed the energy performance model of both EBS and CBS systems in ASPEN Plus with most of the technical information obtained first-hand through questionnaires and complementing data from the literature. Table 2 and Table 3 provide the technical input data for the analyzed energy system. See Tables S1–S6 in the Supplementary Materials for detailed information on the ASPEN Plus simulation.
Additional assumptions: official GHG and PM emission factors were used; see Tables S7 and S8 of the Supplementary Materials and Table S9 for JOBS indicator details. Regarding the NPV indicator, we assumed that EBS incurred investment costs due to new equipment purchases. Additionally, the surplus electricity generated is sold to a local buyer with a discount of 7% [91] from the CFE Grid electricity tariff. See Table S10 in the Supplementary Material, Table 4, and the final evaluation results in Table 5.

4.2.3. Fuel Oil Only System (FOS)

The exclusive use of fossil fuel only for power generation is the main difference between CBS and FOS; in this hypothetical energy system, instead of using bagasse, the boiler is fueled with residual fuel oil only. Figure 2 shows the CBS’s energy generation scheme; it consists of a typical Rankine cycle that starts in stage S1, where water is pumped at 15 atm into the boiler that now receives heat from the HOT-GAS2 produced by fuel oil combustion to generate steam. As in the CBS, FOS use the same boiler where the generated steam S2 is split into two lines, both pressurized at 15 atm, line S4 to the sugar making process and line S3 to the same low-pressure 5 MW steam turbine for power generation. Table 2 and Table 3 provide the technical input data for the analyzed energy system.
Additional assumptions: as in CBS system, official GHG and PM emission factors were used, see Tables S7 and S8 of the Supplementary Material and Table S9 for JOBS indicator details. Regarding the NPV indicator, we assumed no investment costs were incurred, but there were costs for operation and maintenance and electricity purchase, and most of the incurred cost were for purchasing fuel oil. See Table S10 (in the Supplementary Materials), Table 4 and the final evaluation results in Table 5.

4.2.4. Grid Electricity Only System (GES)

In this energy system, we assume that all electricity demand is purchased from the grid at the same rate as the Veracruz sugar mill purchased a small amount in 2018, 132 USD/MWh. We also assume that the official grid GHG emission factor, 527 g/kWh, as the value used for the GHG indicator [97]. We adopted the PM indicator value from [98]. Due to the impossibility of knowing the number of private utilities employees, we made the following assumptions to calculate the JOBS indicator: the number of employees that the government power company Federal Electricity Commission (CFE acronym in Spanish) had in 2018 was 91,319 workers [99], which was divided by CFE total net generation, 250,976 GWh. As this 2018 power generation represented 81% of the total in Mexico [100], we assume 0.31 value of employments per unit power as the one for the whole National Electric System. To apply our entropic weight factor calculation (see Equation (5)), we had to avoid the current GES negative NPV indicator value of −23.75 million USD. Therefore, we summed up the absolute value of this original quantity to the NPV’s of each energy system to maintain the previous NPV differences between energy systems, resulting in an adjusted NPV equal to zero in this GES system. See the input data in Table S10 in the Supplementary Material, Table 4, and the final evaluation results in Table 5.

5. Results

This section presents the evaluation resulting from the comparison and rankings of the four energy systems studied using the MCDA integrated tool described in Section 3.

5.1. Evaluation Matrix

Table 5 shows the evaluation matrix that resumes the assessments made for each energy system evaluated through each indicator. Each sustainability indicator is assumed to be a criteria in this table, and the energy systems are the alternatives. Additionally, this table shows the preference whether the indicator should be minimized or maximized depending on each indicator’s change trend in their environmental, economic, or social status. The values obtained indicate that the EBS is the energy system with less GHG emissions and higher NPV. The CBS has the highest number of employees per energy unit but has the higher PM emissions per energy unit, and GES is the energy system with fewer PM emissions but presents the least employees per energy unit and the lowest NPV. The FOS system is the more significant GHG emitter.

5.2. Indicators Weight Factors (wj)

Table 6 shows the resulting weight factors calculated using the entropy method, following the fifth step of the methodology (see Section 3), i.e., applying Equations (4) and (5) to the evaluation matrix shown in Table 5. This table show that the weight factors are positive and normalized, and the highest valued weight factor is PM with 33.6%, followed by NPV 30.6%, JOBS 22.3%, and GHG 13.6%. The highest weight corresponds to the particulate matter emissions underlining the importance of reducing this harmful emission to human health and global warming, remembering that nearly 30% of all PM is black carbon, a greenhouse compound. In contrast, the JOBS is the sustainable indicator that showed less sensitivity to the variations in the efficiency and had a lower weighting influence in the sustainability evaluation of the RS and AS systems.

5.3. Sustainability Assessment of Energy Systems

Introducing the evaluation matrix data (see Table 5) and the entropic weight factors (Table 6), to the Visual PROMETHEE (VP) software [101], we obtain Table 7, where the estimated leaving, entering, and net flow of SBF–AIR energy systems are given. The first rank indicates that EBS is the most sustainable energy system, and GES is the least sustainable energy system.
In Figure 5, the PROMETHEE II complete ranking of the considered energy systems is provided graphically, based on the net outranking flow values. The top half of the scale (in green) corresponds to positive net outranking scores, and the bottom half (in red) corresponds to negative scores. The EBS system is at the top of the ranking list, followed by the CBS system, FOS, and the GES is the least sustainable system.

5.4. GAIA Interpretation

To further analyze the results, the GAIA plane obtained from the software is given in Figure 6, which exhibits the positions of the indicator as arrows, the energy systems as points and the decision axis. The direction of the decision axis (red arrow) points to EBS as the closest energy system indicating its superiority over the other energy systems, confirming that this is the energy system with higher sustainability due mainly to the evaluations of the alternatives with GHG and VPN sustainability indicators, confirming the best valued indicators, which heavily characterize this energy system as their arrows point the same direction as the decision axis. The other energy systems clearly show that they do not compete because they are in different quadrants. The quality level of the GAIA plane is related to the amount of visible information; in this case, it was 96.5%, indicating that the analysis is very reliable [46,74].

6. Conclusions

After applying a tool that integrates the entropic indicator weighting method to the outranking multicriteria decision analysis method called PROMETHEE, provided that the relevant sustainability indicators are carefully selected, the need for a sustainability assessment of energy systems based on the SBF–AIR as input fuels was met.
This tool was used to assess the sustainability of four electric energy supply systems of a Mexican sugar mill (as a case study) that use sugarcane bagasse as agro-industrial residue: current bagasse (CBS), efficient bagasse (EBS), a power generation system fueled only with fuel oil (FOS), and grid electricity only (GES) systems. We evaluated these energy systems with four sustainability indicators: GHG emissions, PM emissions, number of workers per energy unit, and the NPV of each alternative, calculating weight factors for each indicator by using the entropic method on the mentioned energy system’s evaluation introducing these weight factors to PROMETHEE for a final energy systems alternatives ranking. This integrated tool delivers a unique number, between −1 and 1, to rank each energy system from the lesser to the higher sustainability. In the case of the sugar mill, EBS resulted in the energy system with higher sustainability due to a significant increase in environmental and economic advantages. Given the same amount of bagasse in both energy systems, more energy is obtained in the EBS due to repowering equipment changes that generate lower GHG emissions per power unit. Additionally, it is the more profitable investment energy system for cogeneration, mainly since the generated surplus electricity is sold to local buyers.
The novelty of this article is to show that the application of this tool can provide an adequate solution to the evaluation of sustainability of energy systems considering the conditions of the Mexican agro-industrial sector. Alternatively, in other similar cases in which there are several options, the available information is limited to construct indicators, and there is not enough expert opinion, or it is difficult to retrieve. As the study case of bagasse in a sugar mill shows, Mexico has a vast harnessing potential for reusing agro-industrial residues transformed in solid biofuels for fossil fuels substitution, helping to the transition towards a high sustainability low carbon energy scenario.

Supplementary Materials

The following supporting information can be downloaded at: https://www.mdpi.com/article/10.3390/su14031711/s1, Figure S1: Schematic diagram of the heat and power generation from biomass; Figure S2: General scheme of the simulation of biomass combustion; Figure S3: Scheme of the hierarchy BR1, the combustion stage; Figure S4: Scheme of the hierarchy BR2, the energy generation stage, under the reference scenario; Figure S5: Scheme of the hierarchy BR2, the energy generation stage, under the alternative scenario; Table S1: Chemical composition of the air; Table S2: Chemical composition of the biomass; Table S3: Results of the main streams of the simulation; Table S4: Input data and results of the blocks in the hierarchy BR1; Table S5: Results of the main streams of the hierarchy BR1; Table S6: Input data and results of the blocks in the hierarchy BR2; Table S7: Greenhouse Gas Emissions (GHG). Inventory data and Emission factors; Table S8: Emission of particulate matter. Inventory data and Emission factors; Table S9: Direct jobs. Inventory data; Table S10: Net Present Value (NPV).

Author Contributions

Conceptualization, F.L.M.P. and J.M.I.-S.; data curation, F.L.M.P., C.A.G.B., G.K.G.-A., R.M.L. and F.N.P.; investigation, F.L.M.P., J.M.I.-S. and C.A.G.B.; methodology, F.L.M.P., J.M.I.-S., C.A.G.B., J.C.S.R. and G.K.G.-A.; resources, C.A.G.B., J.C.S.R., G.K.G.-A., R.M.L. and F.N.P.; software, R.M.G.-Á. and C.A.E.; supervision, F.L.M.P.; writing—original draft, F.L.M.P.; writing—review and editing, J.M.I.-S. All authors have read and agreed to the published version of the manuscript.

Funding

This research was funded by SENER-CONACYT Energy Sustainability Fund project 117808 and 246911. Also, DGAPA UNAM PSPA fellowship for a Jorge M. Islas S. 2021 sabbatical stay at CIEMAT-Spain.

Institutional Review Board Statement

Not applicable.

Informed Consent Statement

Not applicable.

Data Availability Statement

Not applicable.

Acknowledgments

The authors thank María de Jesús Pérez Orozco for the technical support in manuscript and Supplementary Materials preparation. Additionally, we thank Claudia Carretta Beltrán for her support in English language revisions. Also, we thank Mintzirani Equihua, for his assistance in economic indicator calculations. Also, we thank Jorge Ramírez Guerrero for his assistance throughout this research project.

Conflicts of Interest

The authors, Fabio Manzini, Jorge Islas, Carlos García, Julio Sacramento, Genice Grande, Rosa M. Gallardo-Álvarez, Ricardo Musule Lagunes, Freddy Navarro Pineda, and Christian Alvarez Escobedo declare no conflict of interest; also, we declare that the funders had no role in the design of the study; in the collection, analyses, or interpretation of data; in the writing of the manuscript; or in the decision to publish the results.

References

  1. British Standards Institution (BSI). BS-EN 14588:2010; Solid Biofuels. Terminology, Definitions and Descriptions. British Standards Institution (BSI): London, UK, 2010.
  2. Bonassa, G.; Schneider, L.T.; Canever, V.B.; Cremonez, P.A.; Frigo, E.P.; Dieter, J.; Teleken, J.G. Scenarios and Prospects of Solid Biofuel Use in Brazil. Renew. Sustain. Energy Rev. 2018, 82, 2365–2378. [Google Scholar] [CrossRef]
  3. REN21. Renewables 2018 Global Status Report. Available online: https://www.ren21.net/wp-content/uploads/2019/05/GSR2018_Full-Report_English.pdf (accessed on 13 September 2020).
  4. International Energy Agency (IEA). World Energy Outlook 2018; OECD/IEA: Paris, France, 2018; p. 661. [Google Scholar]
  5. World Bioenergy Association (WBA). Global Bioenergy Statistics 2019. Available online: https://worldbioenergy.org/uploads/191129WBAGBS2019_HQ.pdf (accessed on 13 September 2020).
  6. United Nations. 2018 Revision of World Urbanization Prospects. Available online: https://population.un.org/wup/ (accessed on 13 September 2020).
  7. Dang, H. Fuel Substitution in Sub-Saharan Africa. Environ. Manag. 1993, 17, 283–288. [Google Scholar] [CrossRef]
  8. Bailis, R.; Drigo, R.; Ghilardi, A.; Masera, O. The Carbon Footprint of Traditional Woodfuels. Nat. Clim. Change 2015, 5, 266–272. [Google Scholar] [CrossRef]
  9. Specht, M.J.; Pinto, S.R.R.; Albuqueque, U.P.; Tabarelli, M.; Melo, F.P.L. Burning Biodiversity: Fuelwood Harvesting Causes Forest Degradation in Human-Dominated Tropical Landscapes. Glob. Ecol. Conserv. 2015, 3, 200–209. [Google Scholar] [CrossRef]
  10. Secretería de Energía (SENER). Balance Nacional de Energía 2017. Available online: https://www.gob.mx/cms/uploads/attachment/file/414843/Balance_Nacional_de_Energ_a_2017.pdf (accessed on 13 September 2020).
  11. Serrano-Medrano, M.; Arias-Chalico, T.; Ghilardi, A.; Masera, O. Spatial and Temporal Projection of Fuelwood and Charcoal Consumption in Mexico. Energy Sustain. Dev. 2014, 19, 39–46. [Google Scholar] [CrossRef]
  12. Njakou Djomo, S.; Witters, N.; Van Dael, M.; Gabrielle, B.; Ceulemans, R. Impact of Feedstock, Land Use Change, and Soil Organic Carbon on Energy and Greenhouse Gas Performance of Biomass Cogeneration Technologies. Appl. Energy 2015, 154, 122–130. [Google Scholar] [CrossRef]
  13. Gasparatos, A.; Doll, C.N.H.; Esteban, M.; Ahmed, A.; Olang, T.A. Renewable Energy and Biodiversity: Implications for Transitioning to a Green Economy. Renew. Sustain. Energy Rev. 2017, 70, 161–184. [Google Scholar] [CrossRef]
  14. Galdos, M.; Cavalett, O.; Seabra, J.E.A.; Nogueira, L.A.H.; Bonomi, A. Trends in Global Warming and Human Health Impacts Related to Brazilian Sugarcane Ethanol Production Considering Black Carbon Emissions. Appl. Energy 2013, 104, 576–582. [Google Scholar] [CrossRef]
  15. Ricciardi, P.; Cillari, G.; Carnevale Miino, M.; Collivignarelli, M.C. Valorization of Agro-Industry Residues in the Building and Environmental Sector: A Review. Waste Manag. Res. 2020, 38, 487–513. [Google Scholar] [CrossRef] [PubMed]
  16. Honorato-Salazar, J.A.; Sadhukhan, J. Annual Biomass Variation of Agriculture Crops and Forestry Residues, and Seasonality of Crop Residues for Energy Production in Mexico. Food Bioprod. Process. 2020, 119, 1–19. [Google Scholar] [CrossRef]
  17. Centro Nacional de Prevención de Desastres (CENAPRED). Serie de Fascículos. Incendios Forestales. Available online: https://www.gob.mx/cms/uploads/attachment/file/112858/159-FASCCULOINCENDIOSFORESTALES.PDF (accessed on 13 September 2020).
  18. Diario Oficial de la Federación (DOF). Proyecto de Norma Oficial Mexicana PROY-NOM-170-SEMARNAT-2017. Contaminación Atmosférica. Límites Máximos Permisibles de Emisión Provenientes de Generadores de Vapor Que Utilizan Bagazo de Caña de Azúcar Como Combustible. Available online: https://dof.gob.mx/nota_detalle.php?codigo=5505078&fecha=17/11/2017 (accessed on 24 June 2020).
  19. Vera Toledo, P.; González Herrera, R. Manejo Inadecuado de Residuos Sólidos Urbanos Como Una Causa de La Pérdida de Biodiversidad En Chiapas. Lacandonia 2010, 4, 65–73. [Google Scholar]
  20. Parmar, A.; Nema, P.K.; Agarwal, T. Biochar Production from Agro-Food Industry Residues: A Sustainable Approach for Soil and Environmental Management. Curr. Sci. 2014, 107, 1673–1682. [Google Scholar]
  21. Killi, D.; Anlauf, R.; Kavdir, Y.; Haworth, M. Assessing the Impact of Agro-Industrial Olive Wastes in Soil Water Retention: Implications for Remediation of Degraded Soils and Water Availability for Plant Growth. Int. Biodeterior. Biodegrad. 2014, 94, 48–56. [Google Scholar] [CrossRef]
  22. Secretaría de Agricultura, Ganadería, Desarrollo Rural, Pesca y Alimentación (SAGARPA). Plan de Manejo de Residuos Generados en Actividades Agrícolas. Primera Etapa: Diagnóstico Nacional. Available online: https://www.gob.mx/cms/uploads/attachment/file/346962/Manejo_de_residuos_Detallado.pdf (accessed on 13 September 2020).
  23. Jayasuriya, H.P.W.; Soni, P. Energy from Agriculture & Agro-Industrial Residues. Available online: http://www.fao.org/tempref/GI/Reserved/FTP_FaoRne/morelinks/Publications/English/Energy-agro.pdf (accessed on 13 September 2020).
  24. Iacovidou, E.; Voulvoulis, N. A Multi-Criteria Sustainability Assessment Framework: Development and Application in Comparing Two Food Waste Management Options Using a UK Region as a Case Study. Environ. Sci. Pollut. Res. 2018, 25, 35821–35834. [Google Scholar] [CrossRef] [PubMed]
  25. Cury, R.K.; Aguas, M.Y.; Martinez, M.A.; Olivero, V.R.; Chams, C.L. Residuos Agroindustriales Su Impacto, Manejo y Aprovechamiento. Rev. Colomb. Cienc. Anim. RECIA 2017, 9, 132. [Google Scholar] [CrossRef]
  26. Ingrao, C.; Bacenetti, J.; Bezama, A.; Blok, V.; Goglio, P.; Koukios, E.G.; Linder, M.; Nermecek, T.; Siracusa, V.; Zabaniotou, A.; et al. The Potential Roles of Bio-Economy in the Transition to Equitable, Sustainable, Post Fossil-Carbon Societies: Findings from This Virtual Special Issue. J. Clean. Prod. 2018, 204, 471–488. [Google Scholar] [CrossRef]
  27. Mejías-Brizuela, N.; Orozco-Guillen, E.; Galáan-Hernández, N. Aprovechamiento de Los Residuos Agroindustriales y Su Contribución al Desarrollo Sostenible de México. Rev. Cienc. Ambient. Recur. Nat. 2016, 2, 27–41. [Google Scholar]
  28. Hedegaard, K.; Thyo, K.A.; Wenzel, H. Life Cycle Assessment of an Advanced Bioethanol Technology in the Perspective of Constrained Biomass Availability. Environ. Sci. Technol. 2008, 42, 7992–7999. [Google Scholar] [CrossRef] [PubMed]
  29. Spatari, S.; Bagley, D.M.; MacLean, H.L. Life Cycle Evaluation of Emerging Lignocellulosic Ethanol Conversion Technologies. Bioresour. Technol. 2010, 101, 654–667. [Google Scholar] [CrossRef]
  30. Boldrin, A.; Balzan, A.; Astrup, T. Energy and Environmental Analysis of a Rapeseed Biorefinery Conversion Process. Biomass Convers. Biorefinery 2013, 3, 127–141. [Google Scholar] [CrossRef]
  31. Börjesson, P.; Tufvesson, L.M. Agricultural Crop-Based Biofuels—Resource Efficiency and Environmental Performance Including Direct Land Use Changes. J. Clean. Prod. 2011, 19, 108–120. [Google Scholar] [CrossRef]
  32. Falano, T.; Jeswani, H.K.; Azapagic, A. Assessing the Environmental Sustainability of Ethanol from Integrated Biorefineries. Biotechnol. J. 2014, 9, 753–765. [Google Scholar] [CrossRef] [PubMed]
  33. Comisión Reguladora de Energía (CRE). Factor de Emisión Del Sistema Eléctrico Nacional. 2019. Available online: https://www.gob.mx/cms/uploads/attachment/file/538473/Factor_emision_electrico_2019.pdf (accessed on 19 August 2020).
  34. Navarro-Pineda, F.S.; Equihua-Sánchez, M.; Grande-Acosta, G.K.; Sacramento Rivero, J.C.; Islas-Samperio, J.M.; Bonales Revuelta, J.; Musule, R.; García, C.A.; Manzini, F. Assessment of the Environmental and Economic Performance of Heat Generation from Orange Peels and Sugarcane Straw. Bioenerg. Res. 2021. [Google Scholar] [CrossRef]
  35. Manara, P.; Zabaniotou, A. Indicator-Based Economic, Environmental, and Social Sustainability Assessment of a Small Gasification Bioenergy System Fuelled with Food Processing Residues from the Mediterranean Agro-Industrial Sector. Sustain. Energy Technol. Assess. 2014, 8, 159–171. [Google Scholar] [CrossRef]
  36. Huth, A.; Drechsler, M.; Köhler, P. Using Multicriteria Decision Analysis and a Forest Growth Model to Assess Impacts of Tree Harvesting in Dipterocarp Lowland Rain Forests. For. Ecol. Manag. 2005, 207, 215–232. [Google Scholar] [CrossRef]
  37. Sacramento Rivero, J.C.; Mwampamba, T.H.; Navarro-Pineda, F.S.; Musule, R.; García, C.A.; Martínez-Bravo, R.D.; Morales-García, A.L.; Equihua-Sánchez, M.; Fuentes-Gutiérrez, A.F.; Gallardo-Álvarez, R.M.; et al. A Methodological Framework for Assessing the Sustainability of Solid Biofuels Systems. Bioenerg. Res. 2021. accepted. [Google Scholar]
  38. Myllyviita, T.; Leskinen, P.; Lähtinen, K.; Pasanen, K.; Sironen, S.; Kähkönen, T.; Sikanen, L. Sustainability Assessment of Wood-Based Bioenergy—A Methodological Framework and a Case-Study. Biomass Bioenergy 2013, 59, 293–299. [Google Scholar] [CrossRef]
  39. Wang, J.J.; Jing, Y.Y.; Zhang, C.F.; Zhao, J.H. Review on Multi-Criteria Decision Analysis Aid in Sustainable Energy Decision-Making. Renew. Sustain. Energy Rev. 2009, 13, 2263–2278. [Google Scholar] [CrossRef]
  40. Buchholz, T.; Rametsteiner, E.; Volk, T.A.; Luzadis, V.A. Multi Criteria Analysis for Bioenergy Systems Assessments. Energy Policy 2009, 37, 484–495. [Google Scholar] [CrossRef]
  41. Scott, J.A.; Ho, W.; Dey, P.K. A Review of Multi-Criteria Decision-Making Methods for Bioenergy Systems. Energy 2012, 42, 146–156. [Google Scholar] [CrossRef]
  42. Kleeberg, K.; Schneider, K.; Nippa, M. Methods for Measuring and Evaluating Sustainability: State-of-the Art, Challenges, and Future Developments. In Handbook of Clean Energy Systems; John Wiley & Sons, Ltd.: Chichester, UK, 2015; pp. 1–26. [Google Scholar]
  43. Mendoza, G.A.; Martins, H. Multi-Criteria Decision Analysis in Natural Resource Management: A Critical Review of Methods and New Modelling Paradigms. For. Ecol. Manag. 2006, 230, 1–22. [Google Scholar] [CrossRef]
  44. Saaty, T.L. A Scaling Method for Priorities in Hierarchical Structures. J. Math. Psychol. 1977, 15, 234–281. [Google Scholar] [CrossRef]
  45. Brans, J.P.; Vincke, P.; Mareschal, B. How to Select and How to Rank Projects: The PROMETHEE Method. Eur. J. Oper. Res. 1986, 24, 228–238. [Google Scholar] [CrossRef]
  46. Brans, J.P.; De Smet, Y. PROMETHEE Methods. In Multiple Criteria Decision Analysis; Springer: New York, NY, USA, 2016. [Google Scholar]
  47. Rogers, M.; Bruen, M. Choosing Realistic Values of Indifference, Preference and Veto Thresholds for Use with Environmental Criteria within ELECTRE. Eur. J. Oper. Res. 1998, 107, 542–551. [Google Scholar] [CrossRef]
  48. Kangas, A.; Kangas, J.; Pykäläinen, J. Outranking Methods as Tools in Strategic Natural Resources Planning. Silva Fenn. 2001, 35, 215–227. [Google Scholar] [CrossRef]
  49. Haralambopoulos, D.A.; Polatidis, H. Renewable Energy Projects: Structuring a Multi-Criteria Group Decision-Making Framework. Renew. Energy 2003, 28, 961–973. [Google Scholar] [CrossRef]
  50. Cavallaro, F. Multi-Criteria Decision Aid to Assess Concentrated Solar Thermal Technologies. Renew. Energy 2009, 34, 1678–1685. [Google Scholar] [CrossRef]
  51. Troldborg, M.; Heslop, S.; Hough, R.L. Assessing the Sustainability of Renewable Energy Technologies Using Multi-Criteria Analysis: Suitability of Approach for National-Scale Assessments and Associated Uncertainties. Renew. Sustain. Energy Rev. 2014, 39, 1173–1184. [Google Scholar] [CrossRef]
  52. Wang, J.J.; Jing, Y.Y.; Zhang, C.F.; Shi, G.H.; Zhang, X.T. A Fuzzy Multi-Criteria Decision-Making Model for Trigeneration System. Energy Policy 2008, 36, 3823–3832. [Google Scholar] [CrossRef]
  53. Wang, J.J.; Jing, Y.Y.; Zhang, C.F. Weighting Methodologies in Multi-criteria Evaluations of Combined Heat and Power Systems. Int. J. Energy Res. 2009, 33, 1023–1039. [Google Scholar] [CrossRef]
  54. Odu, G.O. Weighting Methods for Multi-Criteria Decision Making Technique. J. Appl. Sci. Environ. Manag. 2019, 23, 1449–1457. [Google Scholar] [CrossRef]
  55. Jing, Y.Y.; Bai, H.; Wang, J.J. A Fuzzy Multi-Criteria Decision-Making Model for CCHP Systems Driven by Different Energy Sources. Energy Policy 2012, 42, 286–296. [Google Scholar] [CrossRef]
  56. Martinet, V. A Characterization of Sustainability with Indicators. J. Environ. Econ. Manag. 2011, 61, 183–197. [Google Scholar] [CrossRef]
  57. Liverman, D.M.; Hanson, M.E.; Brown, B.J.; Merideth, R.W. Global Sustainability: Toward Measurement. Environ. Manag. 1988, 12, 133–143. [Google Scholar] [CrossRef]
  58. Hayashi, T.; Van Ierland, E.C.; Zhu, X. A Holistic Sustainability Assessment Tool for Bioenergy Using the Global Bioenergy Partnership (GBEP) Sustainability Indicators. Biomass Bioenergy 2014, 66, 70–80. [Google Scholar] [CrossRef]
  59. Gallopín, G.C. Environmental and Sustainability Indicators and the Concept of Situational Indicators. A Systems Approach. Environ. Model. Assess. 1996, 1, 101–117. [Google Scholar] [CrossRef]
  60. Domac, J.; Richards, K.; Risovic, S. Socio-Economic Drivers in Implementing Bioenergy Projects. Biomass Bioenergy 2005, 28, 97–106. [Google Scholar] [CrossRef]
  61. Ilbahar, E.; Cebi, S.; Kahraman, C. A Multi-Criteria Assessment of Biomass Conversion Technologies with Pythagorean Fuzzy Axiomatic Design Approach. J. Mult.-Valued Log. Soft Comput. 2021, 37, 317–334. [Google Scholar]
  62. Zhang, W.; Wang, C.; Zhang, L.; Xu, Y.; Cui, Y.; Lu, Z.; Streets, D.G. Evaluation of the Performance of Distributed and Centralized Biomass Technologies in Rural China. Renew. Energy 2018, 125, 445–455. [Google Scholar] [CrossRef]
  63. Schröder, T.; Lauven, L.P.; Beyer, B.; Lerche, N.; Geldermann, J. Using PROMETHEE to Assess Bioenergy Pathways. Cent. Eur. J. Oper. Res. 2019, 27, 287–309. [Google Scholar] [CrossRef]
  64. Rehman, A.U.; Abidi, M.H.; Umer, U.; Usmani, Y.S. Multi-Criteria Decision-Making Approach for Selecting Wind Energy Power Plant Locations. Sustainability 2019, 11, 6112. [Google Scholar] [CrossRef]
  65. Thakkar, J.J. Preference Ranking Organization Method for Enrichment Evaluations (PROMETHEE). In Multi-Criteria Decision Making. Studies in Systems, Decision and Control; Springer: Singapore, 2021; Volume 336, pp. 119–127. [Google Scholar]
  66. Global Bioenergy Partnership (GBEP). The Global Bioenergy Partnership Sustainability Indicators for Bioenergy, 1st ed.; Global Bioenergy Partnership (GBEP): Rome, Italy, 2011; p. 11. [Google Scholar]
  67. GBEP/IINAS/IFEU/GBEP. The GBEP Sustainability Indicators for Bioenergy. A Tool for Policy Makers. Available online: http://www.globalbioenergy.org/fileadmin/user_upload/gbep/docs/Implementation_Guide/200511_final_WEB_The-GBEP-Sustainability-Indicators-for-Bioenergy-2020.pdf (accessed on 23 December 2020).
  68. Shannon, C.E. The Bell System Technical Journal. J. Frankl. Inst. 1923, 196, 519–520. [Google Scholar] [CrossRef]
  69. Shemshadi, A.; Shirazi, H.; Toreihi, M.; Tarokh, M.J. A Fuzzy VIKOR Method for Supplier Selection Based on Entropy Measure for Objective Weighting. Expert Syst. Appl. 2011, 38, 12160–12167. [Google Scholar] [CrossRef]
  70. Gao, R.; Nam, H.O.; Ko, W.I.; Jang, H. National Options for a Sustainable Nuclear Energy System: MCDM Evaluation Using an Improved Integrated Weighting Approach. Energies 2017, 10, 24. [Google Scholar] [CrossRef]
  71. Radulescu, M.; Fedajev, A.; Nikolic, D. Ranking of EU National Banking Systems Using Multi-Criteria Analysis in the Light of Brexit. Acta Oeconomica 2017, 67, 473–509. [Google Scholar] [CrossRef]
  72. Brans, J.P.; Mareschal, B. The PROMCALC & GAIA Decision Support System for Multicriteria Decision Aid. Decis. Support Syst. 1994, 12, 297–310. [Google Scholar] [CrossRef]
  73. Mareschal, B.; Tsaples, G. The History and Future of PROMETHEE. In EURO Working Group on DSS; Integrated Series in Information Systems; Springer: Cham, Switzerland, 2021; pp. 259–272. [Google Scholar]
  74. Mareshal, B. Visual PROMETHEE 1.4 Manual. Available online: http://en.promethee-gaia.net/assets/vpmanual.pdf (accessed on 10 November 2021).
  75. Kocmanová, A.; Dočekalová, M.; Luňáček, J. PROMETHEE-GAIA Method as a Support of the Decision-Making Process in Evaluating Technical Facilities. In Environmental Software Systems. Fostering Information Sharing; Springer: Cham, Switzerland; Berlin, Germany, 2013; Volume 413, pp. 44–53. [Google Scholar]
  76. Secretaría de Energía (SENER). Prospectiva de Energías Renovables 2017–2031. Available online: https://www.gob.mx/cms/uploads/attachment/file/284342/Prospectiva_de_Energ_as_Renovables_2017.pdf (accessed on 26 August 2020).
  77. Instituto Nacional de Ecología y Cambio Climático (INECC). Inventario Nacional de Emisiones de Gases y Compuestos de Efecto Invernadero 1990-2015. Available online: http://cambioclimatico.gob.mx:8080/xmlui/handle/publicaciones/226 (accessed on 12 February 2020).
  78. Secretaría de Energía (SENER). Prospectiva de Energías Renovables 2016–2030. Available online: https://www.gob.mx/cms/uploads/attachment/file/177622/Prospectiva_de_Energ_as_Renovables_2016-2030.pdf (accessed on 25 November 2018).
  79. Rincón, L.E.; Becerra, L.A.; Moncada, J.; Cardona, C.A. Techno-Economic Analysis of the Use of Fired Cogeneration Systems Based on Sugar Cane Bagasse in South Eastern and Mid-Western Regions of Mexico. Waste Biomass Valorization 2014, 5, 189–198. [Google Scholar] [CrossRef]
  80. SEMARNAT/INECC. Programa Especial de Cambio Climático 2014–2018. Available online: http://www.sectur.gob.mx/wp-content/uploads/2014/09/PECC-2014-2018.pdf (accessed on 13 December 2020).
  81. Instituto Nacional de Ecología y Cambio Climático (INECC). Rutas de Instrumentación de Las Contribuciones Nacionalmente Determinadas En Materia de Mitigación de Gases y Compuestos de Efecto Invernadero (GyCEI) Del Sector Industria (Cemento, Acero, Calero y Azucarero) En México, Como Insumo Para La Sexta Comunicación Nacional de Cambio Climático. Available online: https://www.gob.mx/cms/uploads/attachment/file/462290/5_Industria_Intensiva_V2.pdf (accessed on 13 December 2020).
  82. Diario Oficial de la Federación (DOF). Available online: https://www.dof.gob.mx/2021/SEECO/ECONOMIA_250221.pdf (accessed on 10 November 2021).
  83. Comité Nacional para el Desarrollo Sustentable de la Caña de Azúcar (CONADESUCA). Reducción Del Consumo de Petróleo y Generación de Energía Eléctrica En Los Ingenios. Available online: https://www.gob.mx/cms/uploads/attachment/file/515516/Boletin_Tecnico_Informativo_Enero_2016.pdf (accessed on 22 April 2021).
  84. International Organization for Standarization. ISO 14044:2006. Environmental Management—Life Cycle Assessment—Requirements and Guidelines. Available online: https://www.iso.org/standard/38498.html (accessed on 23 February 2014).
  85. International Organization for Standarization. ISO 14040:2006. Environmental Management—Life Cycle Assessment—Principles and Framework. Available online: https://www.iso.org/standard/37456.html.
  86. Utrecht University. BioGrace-II Report of the Second Policy Maker Workshop. Available online: https://biograce.net/biograce2/img/files/BioGrace-II_Policy_Workshop_2015-03-06_Report.pdf (accessed on 22 August 2018).
  87. Comité Nacional para el Desarrollo Sustentable de la Caña de Azúcar (CONADESUCA). SIIBA—Sistema de Información Para La Integración Del Balance Azucarero. Available online: https://www.siiba.conadesuca.gob.mx/frmLogin.aspx (accessed on 20 September 2020).
  88. Wei, M.; Patadia, S.; Kammen, D.M. Putting Renewables and Energy Efficiency to Work: How Many Jobs Can the Clean Energy Industry Generate in the US? Energy Policy 2010, 38, 919–931. [Google Scholar] [CrossRef]
  89. Dale, V.H.; Efroymson, R.A.; Kline, K.L.; Langholtz, M.H.; Leiby, P.N.; Oladosu, G.A.; Davis, M.R.; Downing, M.E.; Hilliard, M.R. Indicators for Assessing Socioeconomic Sustainability of Bioenergy Systems: A Short List of Practical Measures. Ecol. Indic. 2013, 26, 87–102. [Google Scholar] [CrossRef]
  90. United Nations Framework Convention on Climate Change (UNFCCC). Clean Development Mechanism. Project 0728: Eurus Wind Farm. PDD Appendices. Appendix 2—Eurus Modelo Economico. Available online: https://cdm.unfccc.int/Projects/DB/AENOR1161788118.81/view (accessed on 22 April 2021).
  91. Available online: http://sie.energia.gob.mx (accessed on 8 November 2020).
  92. International Renewable Energy Agency (IRENA). Renewable Energy Technologies: Cost Analysis Series. Available online: https://www.irena.org/-/media/Files/IRENA/Agency/Publication/2012/RE_Technologies_Cost_Analysis-BIOMASS.pdf (accessed on 22 April 2021).
  93. Comisión Federal de Electricidad (CFE). Costos y Parámetros de Referencia Para La Formulación de Proyectos de Inversión Del Sector Eléctrico 2015; Comisión Federal de Electricidad (CFE): Mexico City, Mexico, 2015; p. 186. [Google Scholar]
  94. Comisión Económica para América Latina y el Caribe (CEPAL). Informe Nacional de Monitoreo de La Eficiencia Energética de Mexico. 2018. Available online: https://repositorio.cepal.org/handle/11362/43612 (accessed on 23 July 2019).
  95. Unión Nacional de Cañeros A.C. Estadísticas de La Agroindustria de La Caña de Azúcar 2010–2019. Available online: http://caneros.org.mx/download/central-motzorongo/ (accessed on 13 September 2020).
  96. Barrera, I.; Amezcua-Allieri, M.A.; Estupiñan, L.; Martínez, T.; Aburto, J. Technical and Economical Evaluation of Bioethanol Production from Lignocellulosic Residues in Mexico: Case of Sugarcane and Blue Agave Bagasses. Chem. Eng. Res. Des. 2016, 107, 91–101. [Google Scholar] [CrossRef]
  97. Comisión Reguladora de Energía (CRE). Factor de Emisión Del Sistema Eléctrico Nacional. 2018. Available online: https://www.gob.mx/cms/uploads/attachment/file/442910/Aviso_Factor_de_Emisiones_2018.pdf (accessed on 22 April 2021).
  98. Santoyo-Castelazo, E.; Azapagic, A. Sustainability Assessment of Energy Systems: Integrating Environmental, Economic and Social Aspects. J. Clean. Prod. 2014, 80, 119–138. [Google Scholar] [CrossRef]
  99. Comisión Federal de Electricidad (CFE). Informe Anual 2019. Available online: https://www.cfe.mx/finanzas/reportes-financieros/Informe%20Anual%20Documentos/Informe%20Anual%202019%20V12%20a%20portal.pdf (accessed on 10 November 2021).
  100. Secretaría de Energía (SENER). Programa Para El Desarrollo Del Sistema Eléctrico Nacional (PRODESEN) 2021–2035. Available online: https://www.gob.mx/sener/articulos/programa-para-el-desarrollo-del-sistema-electrico-nacional (accessed on 10 November 2021).
  101. PROMETHEE-GAIA.net. Software. Available online: http://www.promethee-gaia.net/software.html (accessed on 10 January 2021).
Figure 1. Block diagram showing the performed numerical analysis in the integrated tool for sustainability assessments of energy systems using SBF from agro-industrial residues. This example shows nine indicators and three energy system alternatives. Source: Own elaboration.
Sustainability 14 01711 g001
Figure 2. Current bagasse scenario, CBS, boundaries definitions are sketched with grey lines. All power generation is used for self-consumption in the CBS, and it is drawn with solid green arrows. EBS shares the same boundaries; nevertheless, it generates surplus electricity sold to the grid besides satisfying the self-consumption electricity demand. This electricity flow is sketched with dotted orange lines. Source: Own elaboration.
Sustainability 14 01711 g002
Figure 3. Scheme of the energy generation stage in the current bagasse scenario (CBS). Source: Own elaboration.
Sustainability 14 01711 g003
Figure 4. Scheme of the energy generation stage in the efficient bagasse scenario (EBS). Source: Own elaboration.
Sustainability 14 01711 g004
Figure 5. PROMETHEE II complete ranking output data graphics showing energy system ranks using indicators weighting factors calculated with the entropic method. Source: Own calculations using Visual PROMETHÉE [101].
Sustainability 14 01711 g005
Figure 6. GAIA output data graphics showing in a plane with 96.5% quality; the energy systems are shown as blue squares and sustainability indicators as vectors. Source: Own calculations using Visual PROMETHÉE [101].
Sustainability 14 01711 g006
Table 1. Selected sustainability indicators to assess, according to our methodology, the sustainability of bagasse use as SBF in the reference and alternative energy systems.
IndicatorsUnits
GHG emissions* gCO2e/kWh
Particulate matter emissions (PM) ** gPM/kWh
Direct employment (JOBS) Employments/GWh
Net present value (NPV)Million USD
* gCO2e = grams of carbon dioxide equivalent; ** gPM = grams of particulate matter. Source: Own elaboration.
Table 2. Input data for NPV calculations.
Technical DataUnitCBSEBSFOSGESSources
Electricity consumed in the sugar mill operationkWh/year21,132,962.021,132,962.021,132,962.021,132,962.0Questionaries
Electricity purchased from the gridkWh/year101,940.0-101,940.021,132,962.0Questionaries
Total cost of electricity purchased from the gridUSD201713,456.1-13,456.12,789,551.0Questionaries
Surplus electricity to exportMWh/year-29,256.8--Calculated
Grid CFE electricity rateUSD/MWh132.0132.0132.0132.0Questionaries
Discount to local buyer -7%--[90]
Electricity sales price to local buyerUSD/MWh-122.8--Calculated
Electricity sales per yearUSD2017/year-3,591,566.3--Calculated
Fuel oil used for electricity generationL/year450,902.3-5,770,744-Questionaries
Unit cost of fuel oilUSD2017/L0.21-0.21-[91]
Fuel costUSD201795,297.5-1,219,638-Calculated
Discount rate-10.0%10.0%10.0%10.0%-
Analysis periodyears20.020.020.020.0[92,93]
Net present value (NPV)USD2017$5,739,683$9,562,875$13,473,624$23,749,020Calculated
Adjusted net present value (aNPV)USD2017$18,009,337$33,311,895$10,275,3960.0Used in entropic weights calculation
Source: Own elaboration, based on data from references when cited.
Table 3. Input data for the simulation setup of the current bagasse (CBS) and efficient bagasse systems (EBS).
Simulation setupStageUnitCBS and EBSSources of CBS
Dry basis bagasse flowSimulation setupkg/h45,021Own calculations, from field data provided by sugar mill
Operational yearSimulation setuph/year4237[96]
Annual bagasse flow (dry basis)Simulation setupkg/year190,756,055Own calculations, field data provided by sugar mill
Bagasse calorific valueLow heating valueMJ/kg15.05 Field data provided by sugar mill
Bagasse—moisture in %49.25%Field data provided by sugar mill
Sugarcane surface ha18,608[95]
Yield ton/ha75[95]
Milled sugarcane ton/year1,391,674Own calculations, field data provided by sugar mill
Source: Own elaboration, based on data from references when cited.
Table 4. Additional input data for electric energy generation in all energy systems and ASPEN simulation results. Data obtained for stages S2–S4.
Energy GenerationStages (2–4)UnitCBSEBSFOSGESSources
Turbine steam flux—electricityCBS (S3)kg/h24,527139,42624,527-Own calculations
Steam turbine—temperature-inCBS (S3, S4), EBS (S2)°C312526312-[96]
Steam turbine—pressure-inCBS (S3, S4), EBS (S2)Atm155015-[96]
Boiler steam flux—thermal processesCBS (S4)kg/h114,899-114,899-Own calculations
Steam boiler—temperature-outCBS (S4)°C312-312-[96]
Steam boiler-pressure-outCBS (S4)Atm15-15-[96]
Turbine steam flux—thermal processesEBS (S3)kg/h-139,426--Own calculations
Steam turbine—temperature-outEBS (S3)°C-362--Own calculations
Steam turbine—pressure-outEBS (S3)Atm-15--Own calculations
Boiler—thermal output MWth107123107-Own calculations
Turbine—electricity installed capacity MWe5125-Own calculations
Generator—electricity generation kWh/year21,031,02250,389,77421,031,022-[95]
Specific electric energy generation kWh/ton cane15.1136.21--[95]
Electric energy from grid kWh/year101,940-101,940-[95]
Total electricity for sugar manufacturing kWh/year21,132,96221,132,96221,132,96221,132,962[95]
Specific electricity for sugar manufacturing kWh/ton cane15.1915.19--Own calculations
Total surplus electricity to export kWh/year-29,256,812--Own calculations
Specific surplus electricity to export kWh/ton cane-21.02--Own calculations
Fuel oil consumption L/year450,902 *-5,770,744-Own calculations
* Using [95] data considering SBF allocation of 54% for process heat. Source: Own elaboration, based on data from references when cited.
Table 5. Evaluation matrix of four cogeneration systems in a Mexican sugar mill evaluated with four sustainability indicators. Preferred values are underlined.
IndicatorsGHGPMNPVJOBS
UnitsgCO2e/kWhgPM/kWhMillion USDEmployments/GWh
Preferenceminminmaxmax
Systems
Current bagasse (CBS)326.2612.24−5.749.43
Efficient bagasse (EBS)147.35.119.567.20
Fuel oil only (FOS)901.11.52−13.473.77
Grid electricity only (GES)527.00.62−23.750.31
Source: Own elaboration.
Table 6. Weight factor calculation.
GHGPMNPVJOBS
Weight Factor wj0.13610.33580.30550.2226
Source: Own elaboration.
Table 7. Final ranking of SBF–AIR energy systems and their leaving and entering and net flows.
RankEnergy SystemsΦΦ+Φ
1Efficient bagasse (EBS)0.40390.70190.2981
2Current bagasse (CBS)0.03400.51700.483
3Fuel oil only (FOS)−0.20020.39990.6001
4Grid electricity only (GES)−0.23770.38120.6188
Source: Own elaboration.
Publisher’s Note: MDPI stays neutral with regard to jurisdictional claims in published maps and institutional affiliations.

