Abstract
Controlling plastic pollution is an important issue in the field of sustainable development and is of great concern for numerous countries’ governments. After investigating the implementation of relevant policies, this paper analyzes the tripartite mainstay under the background of China’s Plastic Ban by constructing an evolutionary game model involving governments, enterprises and the public. Through simulation modeling, the paper then investigates the possible regulatory effects of different policies at the micro level. According to the results, the government should pay more attention to how it reacts to enterprises’ compliance strategies, both for the sake of the public and itself. It is vital to increase enterprises’ compliance rewards and decrease their compliance costs through various means such as policy changes and technological innovation. The policy’s effect can be improved if supervision and regulations are both enforced.
1. Introduction
Plastic products have engendered great convenience to people’s lives, but improper production, recycling, and processing practices have wasted resources and caused a high degree of white pollution. They cause harm to air, land, and water bodies, threatening biodiversity. At the same time, fire hazards and public health issues caused by plastic pollution endanger human health and cause hidden hazards for future generations. Though the Plastic Restriction policy was issued in China in 2007, it did not have a significant effect on the overall consumption of plastic bags. The lack of binding force on manufacturers caused a large number of non-compliant plastic bags to continue to circulate in the market. In 2020, the Fifth Plenary Session of the 19th Central Committee of the Communist Party of China proposed that, during the 14th Five-Year Plan period, the key areas of the “upgraded version of pollution prevention and control” should be closely followed. The government also issued the Opinions on Further Strengthening the Plastic Pollution Control (hereinafter referred to as the Plastic Ban). This Plastic Ban has refined, deepened, and improved the requirements of the 2008 Plastic Restriction. The production, use, and recycling of plastic products are closely related to government supervision, public acceptance, and enterprise implementation. Therefore, investigating the implementation of policies and exploring the prevention and control mechanism of white pollution from the root cause are of great theoretical and practical significance for improving environmental protection.
After preliminary investigation, it was found that more than half of the public had noticed the implementation of this policy, but only about one-tenth had been greatly affected by it. At the same time, different enterprises differ in policy enforcement, and some of them have not strictly implemented the relevant requirements. The active implementation of Plastic Ban is crucial to the control of white pollution, which requires the joint efforts of the government, the public, and enterprises. To this end, this paper aims to construct a tripartite dynamic evolutionary game model to analyze the benefits and losses of the three parties in choosing different strategies and the required conditions for choosing them. In order to provide a new perspective for the implementation and promotion of relevant policies in the future, we carried out a simulation analysis. After reviewing the relevant literature, it was found that previous studies tended to stay in the analysis perspective of macro facts. This paper attempts to analyze how the system can be involved in realizing plastic pollution control through the perspective of an evolutionary game, filling the gap in the micro-system analysis of the Plastic Ban.
2. Related Research
Although plastics have always played an important role in our society, mass production, inappropriate usage, and management have led to great environment concerns [1,2,3]. Single-use plastics (SUPs) threaten plant growth, terrestrial animals, birds, and marine ecosystems [4], thus threatening agriculture, fisheries, and tourism [5]. Plastic produces greenhouse gases in every lifecycle phase, especially incineration [6]. COVID-19 and other pandemics have left a potential plastic waste footprint (PWF) throughout the life cycle of plastic products [7].
2.1. Actions Taken Aganist Plastic Pollution
Due to the environmental, social, and economic threat posed by plastics, numerous regions and nations have taken action to address the plastic pollution crisis. The United Kingdom ratified the Waste & Resources Action Programme (WRAP) in 2018 and Japan set their Plastic Resource Recycling Strategy in 2019. The United States has also formulated regulations to reduce the consumption of disposable plastic bags by prohibiting, charging for, taxing, and formulating minimal product designs for shopping bags and forcing retailers to recycle [8]. In addition to this, the UN Environment Programme put forward The New Plastic Economy Global Commitment in 2019, and more than 150 enterprises have agreed to support it. Many similar international agreements have been established [9,10]. Among them, most regional and national actions have been to decrease sources of plastic pollution by changing public behaviors and consumption patterns [11]. By contrast, the Plastic Ban released recently by the Chinese government, along with The New Plastic Economy Global Commitment put forward by the UN, is aimed at tackling plastic pollution at the source, i.e., focusing on enterprises instead of the public. Therefore, it has become important to see how a system with policies of this kind evolves. How governments, enterprises, and the public will interact with each other in this case is also a question that remains to be answered. We answer this question in what follows.
2.2. Research Concerning Policies on Plastic Pollution
Reducing inputs of plastic into the environment must be prioritized through a global multidisciplinary approach, and mismanaged waste is a major land-based source of plastic pollution [12]. Saroj Kumar Pani and Atul Arun Pathak developed an integrative mixed-method case study to analyze plastic packaging waste management in emerging economies by a theory-based stakeholder evaluation model, taking the case of EPR in India as an example, and provided advice on EPR policy formulation and implementation [13]. Chang Li et al. explored the key factors that affect agricultural mulch film pollution prevention and control from the perspective of smallholder farmers, using random sample household survey data from China [14]. Prata et al. provided 10 recommendations for stakeholders on the Control and Mitigation of Plastic and Microplastic Pollution based on qualitative research [12]. Mederake, Linda, and Doris Knoblauch analyzed parliamentary debates on two recently adopted plastic policies in the EU, structuring qualitative content to investigate and assess the relevant debates, and revealed widespread support for plastic regulation among Members of the European Parliament [15]. Caterina De Lucia and Pasquale Pazienza responded to the EU resolution of 13 September 2018 and analyzed farmers’ attitudes towards reducing plastics in agriculture to determine the probability of adopting specific policy tools, using a survey of 1783 farmers in Foggia, Italy, and a multinomial regression model [16]. Marianna Gilli, Francesco Nicolli, and Paola Farinelli utilized an original survey of 618 Italian households to conduct a cluster regression analysis on behavioral attitudes towards waste prevention and recycling [17]. Considering the introduction of life cycle thinking into European waste policies, David Lazarevic et al. studied plastic waste management in the context of a European recycling society by comparing results and uncertainties from a life cycle perspective [18]. It is necessary to mark biodegradable products on the market, and people should be educated on how to make purchase decisions based on these labels [19]. The government has banned disposable shopping bags, but only partially supervises this, so consumption has increased in unsupervised areas. Ignoring the leakage effect of policies will exaggerate their welfare benefits [20,21]. Whether the ban on the use of disposable plastic bags can be successful depends on the type and price of the disposable plastic bags that enterprises choose to sell [22].
Scholars have analyzed policies on plastic pollution all over the word, and most of the current research on the Plastic Ban and Plastic Restriction covers the experiences and shortcomings in the implementation of government policy formulation and supervision. However, interest-based and multiple-agent-based analysis of the reasons for the plight of plastic pollution control is still lacking.
2.3. The Use of Game Theory to Study Environmental Protection Issues
Game theory, seen as a form of interactive decision theory, is a suitable approach to analyzing the interaction between “players” (or “agents”) who are involved in a specific area [23]. Therefore, it has been widely used in various research fields, such as management, economics, and marketing. In terms of analysis on environmental policies, it is also considered an effective mathematical approach [24].
In the context of green supply chain management, Zhao et al. developed a game-theoretical model to analyze the strategies adopted by manufacturers in order to lower the environmental life cycle risk of materials and carbon emissions [24]. Ashkan Hafezalkotob utilized game theory to study the competition of two green and regular SCs under environmental protection and revenue seeking policies imposed by the government [25]. Ciardiello et al. introduced a cooperative game theory approach to solve the problem of pollution responsibility allocation across partners collaborating in supply networks [26]. Wang, Madani, Yang, and Du used the idea of the Stackelberg game to study supply chain management considering carbon emission reductions [27,28,29,30]. Bertinelli, Huang, Yeung, and Jamali applied a differential game to the research on the Nash equilibrium strategies of governments, industrial firms, and consumers, aiming to minimize pollution [31,32,33,34].
Most of the studies above are based on two-party games, ignoring governments or consumers who also play important roles in environmental management systems. Moreover, it is hard to know how a system evolves in the long term and which factors account for most of the drivers of the evolution process in the models mentioned above.
The evolutionary game theory uses the idea of learning from, competing with, and adapting to each other in a system based on the process of biological evolution [35] and provides an effective tool for presenting how systematic interactions affect a system in terms of environmental problems and social norms [36].
Thus, scholars increasingly tend to use evolutionary game theory, especially tripartite evolutionary game theory, in environmental policies [37].
Environmental protection issues are the results of multiple conflicts of interest and complex social conditions [38], and diversified participation in governance is an inevitable trend in the development of environmental pollution control systems [39]. With a completely static mechanism, the participants’ game process cannot have a stable equilibrium state [40]. Through the analysis of evolutionary game strategies, some scholars have found that, in the interaction between governments and enterprises, government supervision and its cooperation with enterprises are essential to implement environmental policies [41,42,43,44]. In the interaction between governments and the public, different environmental regulations will cause different attitudes and expectations about environmental protection among the public. The benign interaction between the central government and the public, as well as the public’s cooperation, is conducive to improving overall supervision efficiency [45,46]. In the interaction between enterprises and the public, consumers’ environmental awareness can promote environmentally friendly strategies and influence enterprises’ behavior [47]. In the interaction between the government, enterprises, and the public, the Pareto optimal is determined by the game model, and the results show that cooperation of the tripartite mainstay affects environmental management and that the public’s participation in ecological construction projects should be increased [48,49].
In terms of game theory, ecological construction, resource allocation, credit supervision, and other environmental protection fields have applied an evolutionary game model for analysis, but there is no research with such an application to plastic pollution control. Thus, this paper establishes an evolutionary game model under the implementation of the Plastic Ban involving three kinds of participants: governments, enterprises, and the public. Moreover, a multi-agent simulation model is used to explore the relationship between supervision policies and the participation of collaborative management. Based on the results, the strategic choices of various participants are discussed and analyzed to provide theoretical support for environmental governance.
3. Model Building
3.1. Basic Assumptions
Assumption 1: During the process of plastic pollution control, there are three main types of participants: governments, enterprises, and the public. Each of them has two strategic choices, and there is information asymmetry between these three types of bounded rational players. Under the premise of maximizing interests, they choose an optimal coordination strategy and adjust their strategies after repeated behavioral games. In the case that higher-level authorities have issued certain rules and regulations on plastic governance, a government can have one of two strategies: supervision and non-supervision. A government will pay a supervision cost if it selects the supervision strategy, but it can obtain a supervision benefit at the same time. When an enterprise does not choose a compliance strategy, the government also charges the enterprise with a penalty (included in ). Selecting a non-supervision strategy can provide an additional government benefit (such as leisure), but it risks receiving punishment from higher-level authorities if an enterprise is found not complying with the policy. An enterprise can use one of two strategies: compliance or non-compliance with policies. It pays an enterprise compliance cost if it chooses a compliance strategy, but this choice can lead to an enterprise compliance reward and all environmental rewards at the same time. Choosing non-compliance with policies saves a compliance cost , but it may lead to a non-compliance penalty . There are also two strategies for the public: cooperation and non-cooperation. Choosing a cooperation strategy requires a cooperation cost , and the public receives compensation from the enterprise while receiving a loss when an enterprise does not comply with the policy and the government is supervising. If the public chooses not to cooperate, it will suffer loss and gain reward when the enterprise does not comply with the policy. It is assumed that , .
Assumption 2: Governments choose a non-supervision strategy in proportion to x and a supervision strategy in proportion to (1-x). Enterprises choose a non-compliance strategy in proportion to y and choose a compliance strategy in proportion to (1-y). The public chooses a non-cooperation strategy in proportion to z and a cooperation strategy in proportion to (1-z). x, y, and z are all functions of time t.
Assumption 3: The expected payoff functions of governments, enterprises, and the public are , , , , , , , , , and , , , , , respectively. refers to the political rewards obtained by a government, including reputation, when they achieve supervision success. Supervision success occurs when enterprises choose a compliance strategy or when enterprises fail to comply with policies and are charged a penalty by governments. refers to the punishment imposed on governments by higher authorities for not fully supervising enterprises when enterprises do not comply with the policies. θ is the probability that the governments will be penalized. is the penalty a government obtains from an enterprise when it chooses a non-compliance strategy and the government chooses a supervision strategy, which is included in . is the benefit obtained by a government and mainly includes increased leisure time and reduced work difficulty when it selects a non-supervision strategy. is the reward for an enterprise in terms of economic benefits and reputation when it chooses a compliance strategy. is the benefit enjoyed by the public when an enterprise chooses a non-compliance strategy, the public chooses a non-coopoeration strategy, and the public thus avoids the trouble of changing habits and enjoys the convenience of using plastic bags. is the environmental reward that the public can enjoy when an enterprise chooses a compliance strategy. is the compulsory compensation obtained by the public from an enterprise when the enterprise does not choose a compliance strategy, the public chooses a cooperation strategy, and the government chooses a supervision strategy. is the loss of the public due to deterioration of the environment caused by the enterprise choosing a non-compliance strategy. It is assumed that , and . Explanations of the assumed parameters of the three entities are given in Table 1.

Table 1.
Explanations of the assumed parameters of the three entities.
3.2. Construction of Evolutionary Game Model
Based on the assumptions above, an evolutionary game model of enterprises, governments, and the public was constructed. Different strategy combinations of the three groups lead to the payoffs shown in Table 2.
Table 2.
The payoff matrix of enterprises, governments, and the public.
According to the payoff matrix in Table 2, it can be concluded that the expected payoffs of an enterprise choosing a compliance strategy (E(0)) and of an enterprise choosing a non-compliance strategy (E(1)), and the average payoff of the enterprises, are, respectively:
The replicator Equation of enterprises choosing a non-compliance strategy is:
The expected payoffs of a government choosing a supervision strategy (G(0)) and of a government choosing a non-supervision strategy (G(1)), and the average payoff of the governments, are, respectively
The replicator equation of governments choosing a non-supervision strategy is:
The expected payoffs of the public choosing a cooperation strategy (H(0)) and of the public choosing a non-cooperation strategy (H(0)), and the average payoff of the public, are, respectively:
The replicator Equation of the public choosing a non-cooperation strategy is:
From the nature of the evolutionary stability strategy (ESS), it is clear that the necessary condition for enterprises to reach the point of evolutionary stability is . Given the replicator Equation (4), when , and all y are in a stable state. When , only satisfies the condition , which renders the points on evolutionarily stable. When , only satisfies the condition , which renders the points on evolutionarily stable. The surface M can be drawn by , as shown in Figure 1. The points on the surface M are stable in the y-axis direction. The points on the right side of the surface M tend to evolve toward y = 1, and the points on the left side of the surface M tend to evolve toward y = 0.
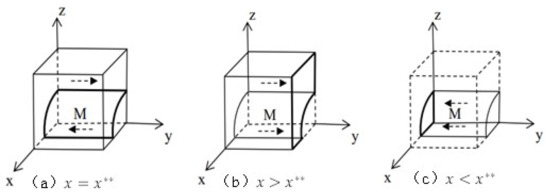
Figure 1.
Phase diagram of enterprises’ strategy evolution.
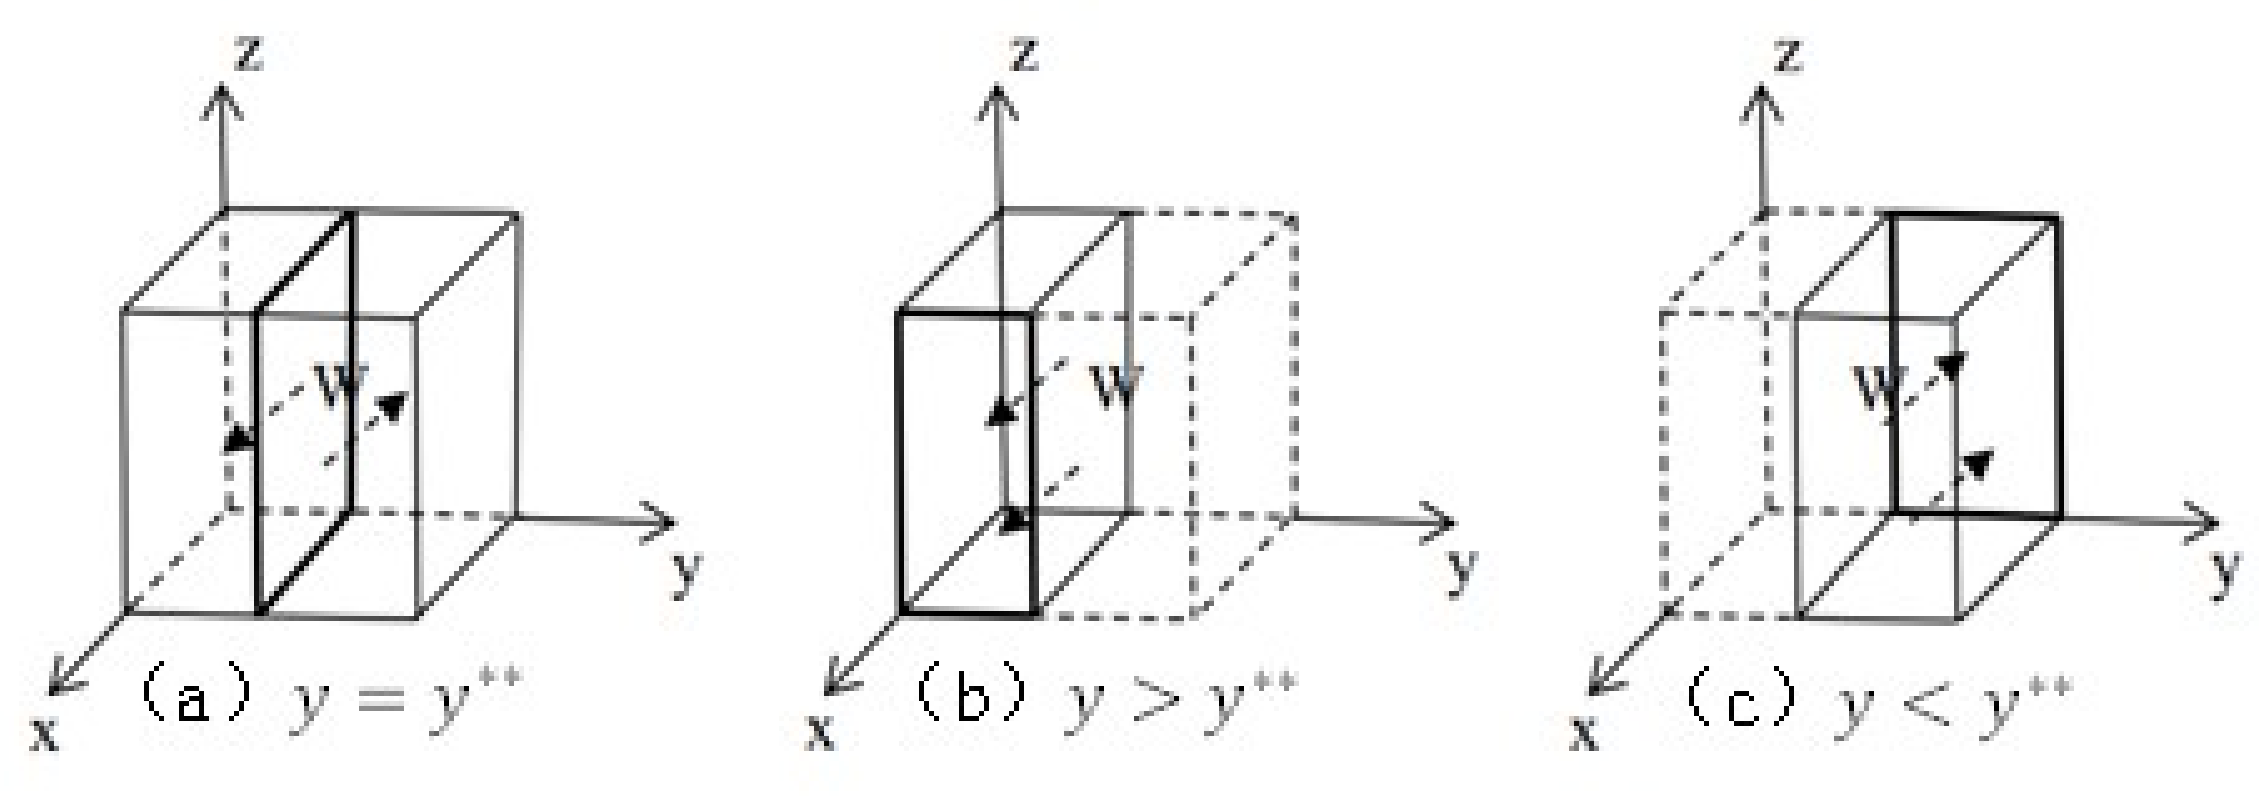
Governments must also satisfy to achieve the ESS. From the replicator Equation (8), when , and all x values are in stable states. Because satisfies the condition when , the points on the line are evolutionarily stable points. satisfies the condition when , and the points on are evolutionarily stable. The surface W can be drawn from . As shown in Figure 2, the points on the surface W are stable in the x-axis direction. The points in front of the surface W tend to evolve toward x = 0, while the points behind the surface W will evolve toward x = 1.
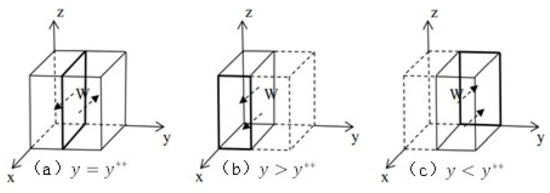
Figure 2.
Phase diagram of governments’ strategy evolution.
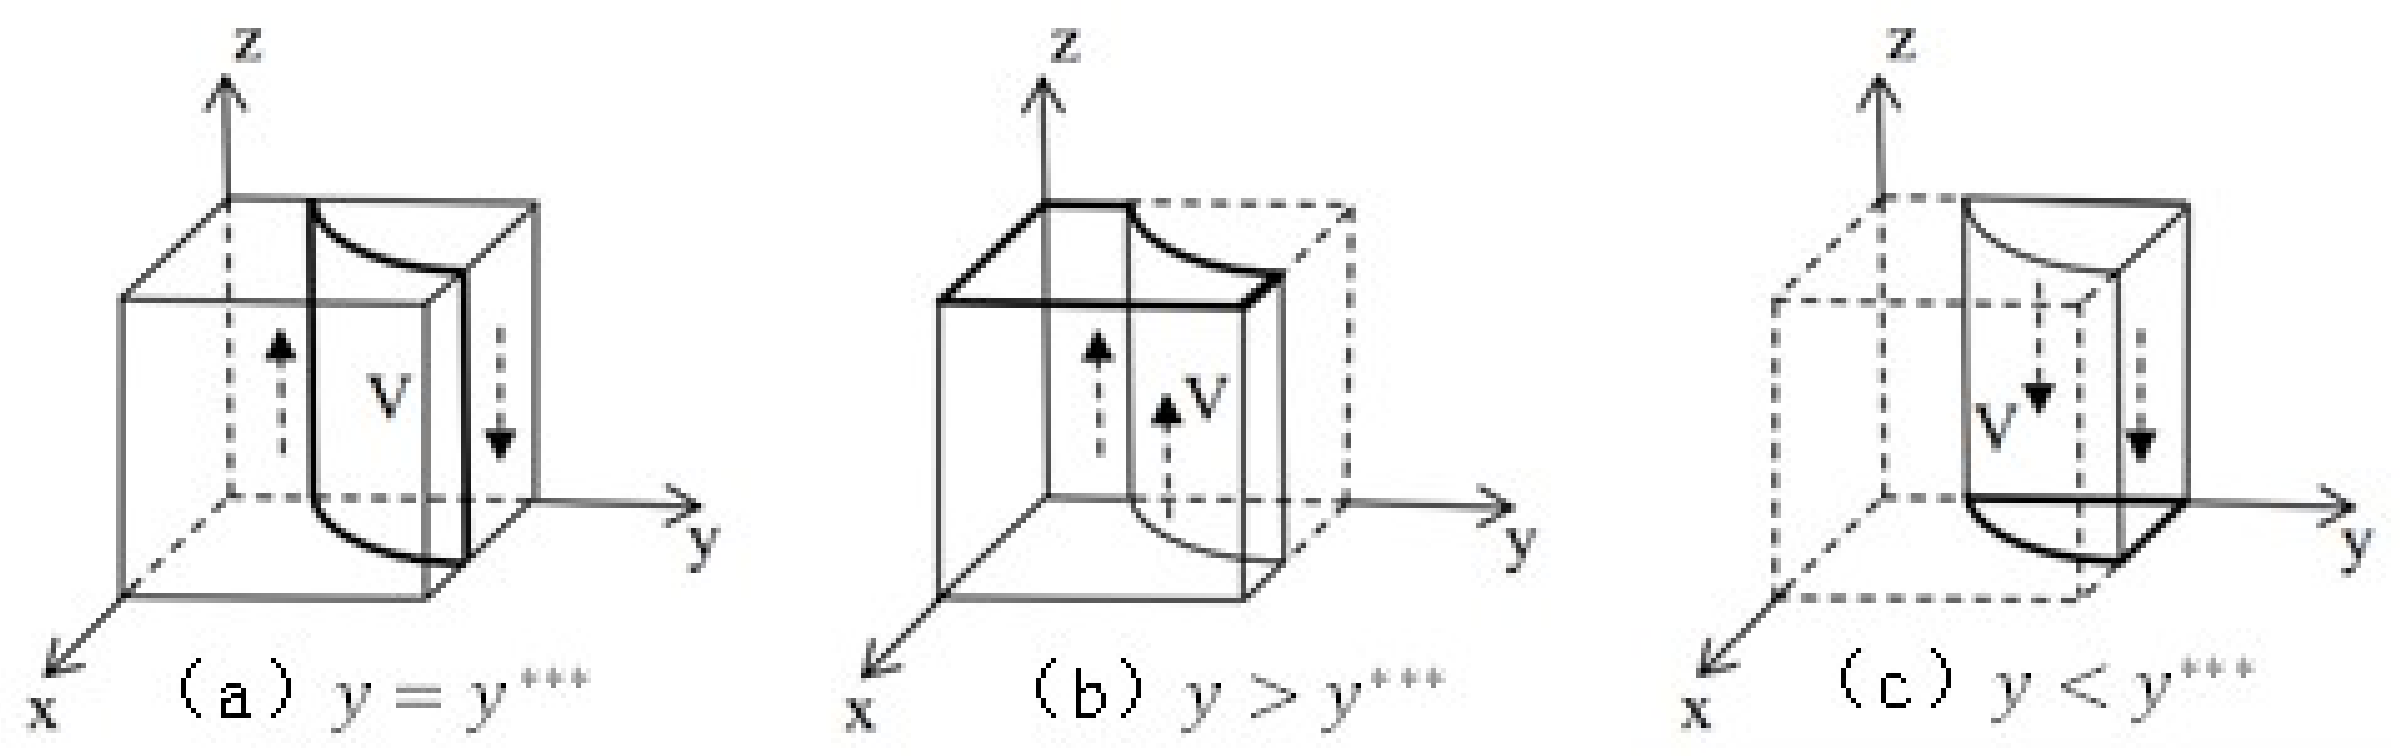
The public needs to satisfy to achieve the ESS. Given the replicator Equation (12), F(z) = 0 when , in which all x values are in stable states. satisfies the condition when , and the points on the line are evolutionarily stable. When , the points on are also evolutionarily stable. The surface V can be drawn by the relation , as shown in Figure 3. The points on the surface V are stable in the z-axis direction. The points in front of the surface V tend to evolve toward , and the points behind the surface V tend to evolve toward .

Figure 3.
Phase diagram of the public’s strategy evolution.
3.3. Model Analysis
By solving the replicator Equations (4), (8) and (12) further, it can be concluded that there are nine equilibrium points in the process of the tripartite evolutionary game between governments, enterprises, and the public, namely, , , , , , , , , and , where , , , , and . The equilibrium point is stable when the eigenvalues are all less than 0. Consequently, whether these equilibrium points are evolutionarily stable is determined by the eigenvalues of their corresponding Jacobian matrixes.
The general Jacobian matrix of the system is too complicated to present in the main text. Please refer to Appendix A for details. The Jacobian matrix of a specific point can thus be obtained based on the general Jacobian matrix by plugging the point. Taking the equilibrium point as an example, the Jacobian matrix of can be written as:
According to J1, the eigenvalues of the Jacobian matrix are , , and , respectively.
The eigenvalues of the Jacobian matrix corresponding to the other eight equilibrium points are shown in Table 3. In it, the eigenvalues of : , , are the solutions to the equation , where , , , , , , and .
Table 3.
The eigenvalues of the Jacobian matrix corresponding to each equilibrium point.
Under the assumptions of and , the evolution can be divided into eight cases. (The improvement of the environment requires long-term efforts. Thus, the public cannot enjoy instant convenience for the time being, not to mention the psychological discount of future value. All these lead to ). The stability of each balance point is discussed and judged according to the eigenvalues of the corresponding Jacobian matrix (only the case where the eigenvalue is not 0 is considered for brevity). The results of the discussion can be seen in Appendix B.
The specific decision conditions and corresponding discussion results of these eight cases are shown in Table 4.
Table 4.
Decision conditions and discussion results corresponding to 8 cases.
In Table 4, represents the reward of a non-supervision government subject, and represents the reward to a government subject that takes supervisory actions. In Cases 1-1 and 1-2, represents the reward obtained by an enterprise subject from complying with policies, and represents the reward when the enterprise did not comply with the policy, was supervised by the government, and was punished. In Cases 2-1 and 2-2, means that the enterprise will only be punished if it does not comply with the policy. In Cases 3-1 and 3-2, represents the compliance cost of the enterprise’s compliance policy. The meanings of the parameters involved in Cases 4-1 and 4-2 have been explained in the previous cases and will not be repeated here.
In summary, the system’s evolution stability points of Case 1-1, Case 1-2, Case 2-1, and Case 3-1 are respectively, according to the model established by the research and the discussion of the equilibrium point’s stability. Their corresponding Jacobian matrixes satisfy the condition that their eigenvalues are all less than 0. and correspond to a non-supervision, non-compliance, and cooperation combination strategy and a supervision, non-compliance, and cooperation combination strategy, respectively, which are the final development trends. In these strategy combinations, regardless of what strategies the public and the governments choose, the enterprises choose not to comply with the policies. In this case, the effect of plastic pollution control is not satisfactory. Therefore, in the process of controlling plastic pollution, every effort should be made to avoid this situation. In Case 4-1 and Case 4-2, the stability points are both . At this time, enterprises all choose to comply with the policies after the system becomes stable, and this occurs when the government does not supervise and the public does not cooperate. Thus, the enterprises will all choose a strategy that is extremely beneficial to plastic pollution governance after the system is stable, and governments and the public do not have to supervise and cooperate. In Case 2-2 and Case 3-2, there is no equilibrium point whose corresponding Jacobian matrix eigenvalues are not all less than 0. Therefore, there is no evolutionarily stable point in these two systems.
The evolution of plastic pollution control can be divided into three stages: the noneffective stage, the effective stage, and the autonomic stage [50].
The noneffective stage corresponds to Case 1-1, Case 1-2, Case 2-1, and Case 3-1. At this stage, regardless of which strategy a government chooses, non-compliance with policies is always the best strategy with the highest return for an enterprise. Therefore, enterprises will all eventually tend to violate policies and produce non-degradable plastics or use plastics illegally. It is a stage where the situation of plastic pollution control is extremely deteriorating. Only by greatly changing the enterprise’s strategic payoffs through in-depth institutional reforms and education on social values can the situation be improved.
The effective stage corresponds to Case 2-2 and Case 3-2. At this stage, the system does not have an evolutionarily stable point. The strategies of the enterprises are constantly adjusted according to the different strategic choices of the public and governments. The system will stay in an eternal dynamic adjustment process of a tripartite game if there is no external intervention.
The autonomic stage corresponds to Case 4-1 and Case 4-2. In these cases, enterprises will evolve into a spontaneous compliance behavior while governments’ participation and the public’s participation are deemed unnecessary. This stage corresponds to a situation where plastic pollution control is highly complete.
The transition from the noneffective stage to other stages is the basis of reaching an optimal situation, as well as the critical juncture in achieving plastic pollution control. The noneffective stage is a rite of passage and the key stage to reaching the autonomic stage, and it is the stage that China is currently in. Promoting plastic pollution control from the noneffective stage to the autonomic stage through systematic reforms and the effective adjustments of relevant parameters is an important direction that needs to be studied in this field.
According to the analysis of the model and the comparison of each case’s conditions above, it can be concluded that, in order to avoid or leave the noneffective stage as soon as possible, it is necessary to increase the benefits of the enterprises complying with policies . This can be achieved by increasing the benefits of complying with policies and reducing the cost of complying with policies, such as providing enterprises with more reputation promotion, economic benefits, brand value promotion, plastic pollution control subsidies, and technical assistance. All of these will ensure that all enterprises’ optimal decisions are complying with policies.
To achieve improved results in plastic pollution control and accelerate the process of reaching the autonomic stage, governments’ non-supervision rewards need to be less than the supervision reward . That is, because that the government is generally in a dominant position in the plastic pollution control system; its supervision strategy has important guiding significance. Therefore, a higher-level government can stiffen the oversight of local governments so as to boost and increase the possibility of punishment that local governments receive when an enterprise does not comply with the policies and local governments do not supervise. Through publicity, education, and incentives, a higher-level government can improve the local governments’ political benefits, including the reputation and rewards obtained when a local government successfully supervises enterprises. Moreover, the difficulty and time of supervision can be reduced through technology and system optimization, and the fines and penalties collected can be properly increased through taxation and fines, thereby reducing the supervision cost of local governments.
In addition, the participation of the public guarantees the improved promotion of plastic pollution treatment and accelerates the arrival of the autonomic stage. In order to achieve the condition of , education and propaganda need to be strengthened to educate the public on the severity of the loss of environmental quality caused by the non-compliance strategy of enterprises. Related platforms need to be built through the introduction of new technology and thus the invention of cheap substitutes for plastics, thus reducing the public’s costs of cooperation and the losses caused by restrictions on the use of specified plastic products. Appropriate recognition of the environment and the effectiveness of long-term adherence to environmental governance need to be improved so as to increase the public’s reward for cooperation.
4. Numeric Simulation
In order to verify the effectiveness of the above tripartite evolutionary game analysis, the changes in each case, from Cases 1-1 to 4-2, are presented in an intuitive way, and the impact of its key variables is further discussed to deepen the conclusions obtained. Therefore, based on actual situations and previous research experience, we assigned and calibrated the variables as appropriate as possible using MATLAB to carry out a numeric simulation of the tripartite participants and to simulate the plastic pollution control under the corresponding policies based on the evolutionary game model.
In order to show the evolution process under various evolutionary stability strategies, the specific values of the array parameters were carefully set for simulation [50,51,52,53].
4.1. Evolution Path Graphs of Three Participants on the Noneffective Stage of Plastic Pollution Control and the Influence with Respect to Parameter Changes
The noneffective stage is characterized by enterprises’ firm choice of noncompliance, regardless of what governments and the public choose.
The parameter setting of the case S(s = 1-1, 1-2, 2-1, 2-2, 3-1, 3-2, 4-1, 4-2) is . The arrays to are set in sequence according to the conditions in Table 4 corresponding to the eight cases. As per the noneffective stage, the values of parameters are set as follows:
Case 1-1: ; they satisfy the condition of , .
Case 1-2: ; they satisfy the condition of , .
Case 2-1: ; they satisfy the condition of , .
Case 3-1: ; they satisfy the condition of , .
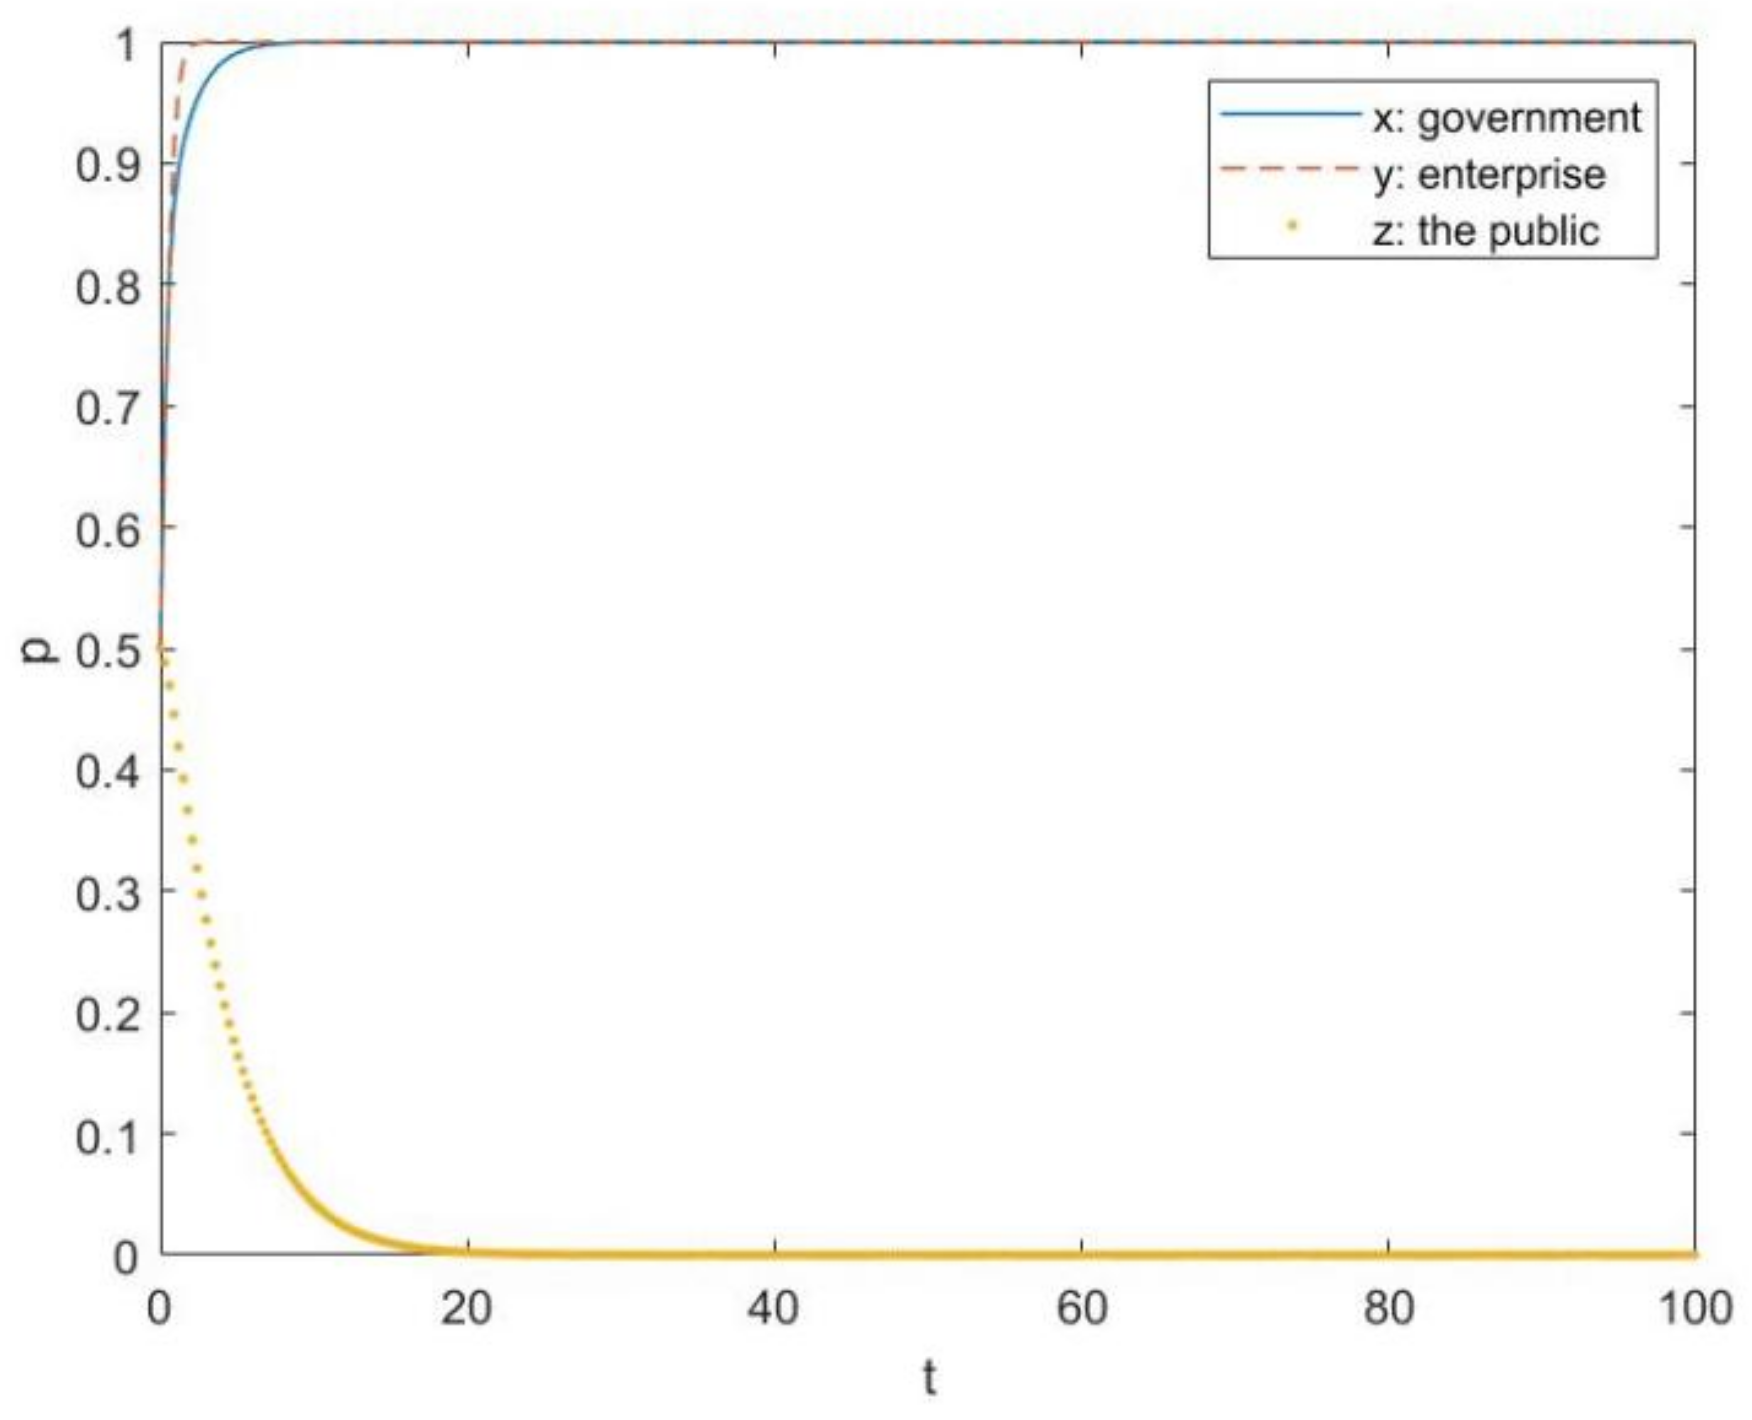
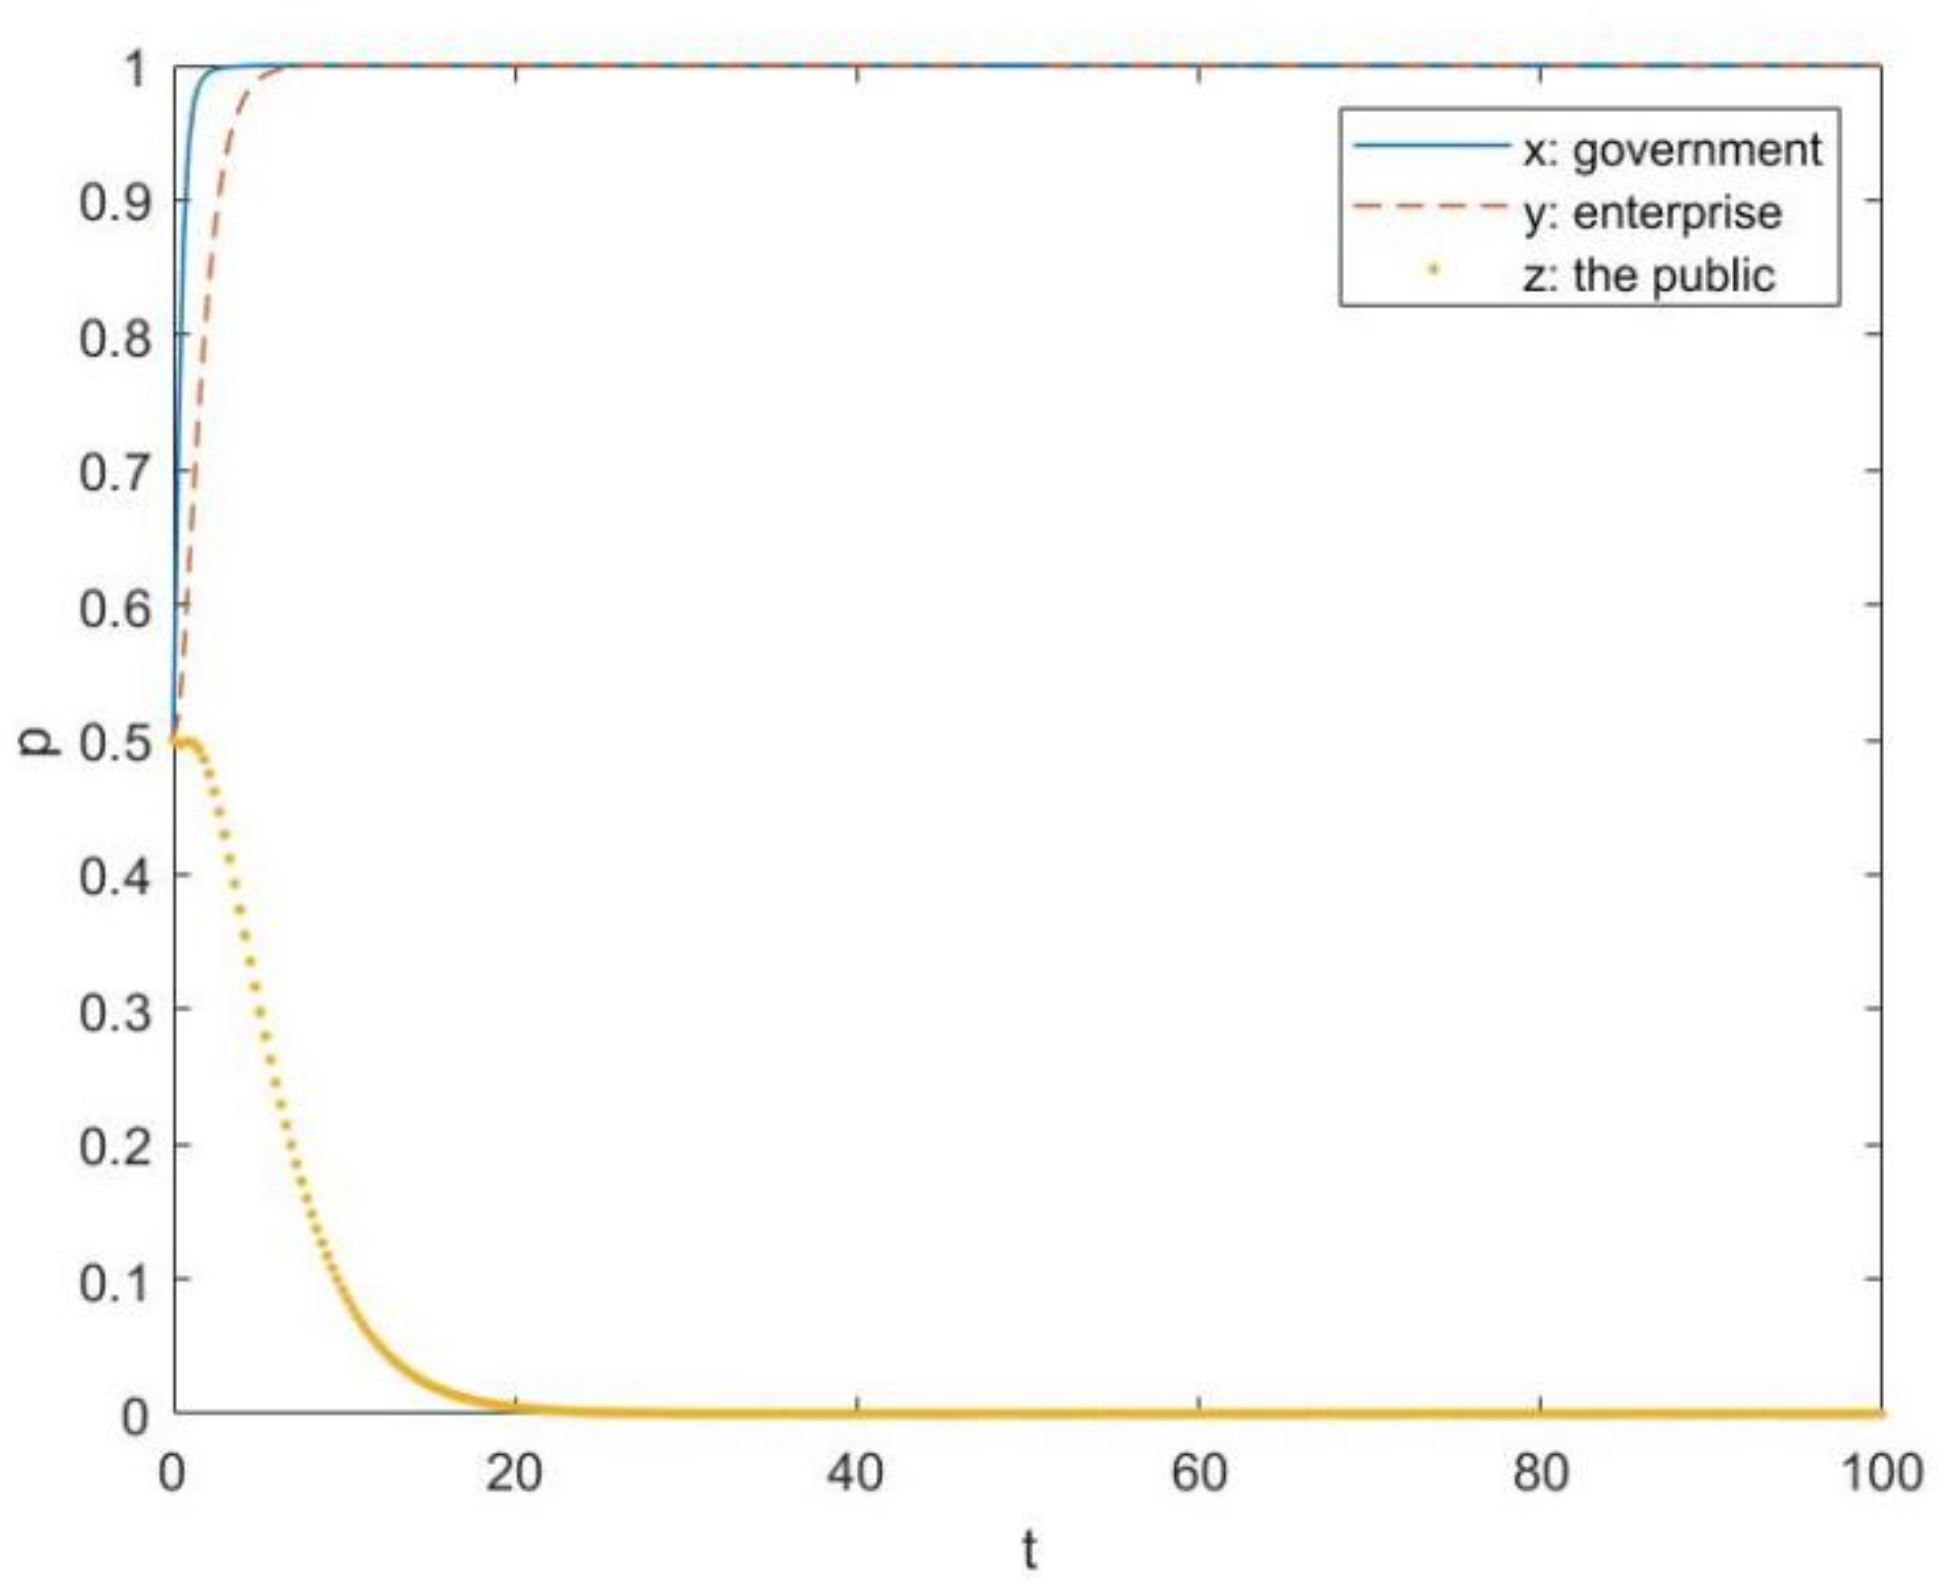
The evolutionary path of Case 1-1 is shown in Figure 4. As can be seen, enterprises are the first to reach equilibrium and end up choosing non-compliance. Governments use relatively more time to reach equilibrium, and they all ultimately choose non-supervision. The public takes the longest time to reach equilibrium, and they choose cooperation with the passage of time. All of the final results are consistent with the analysis in Table A1, which shows that non-supervision, non-compliance, and cooperation is the strategic combination of the three evolutionarily stable strategies (ESSs) in Case 1-1.
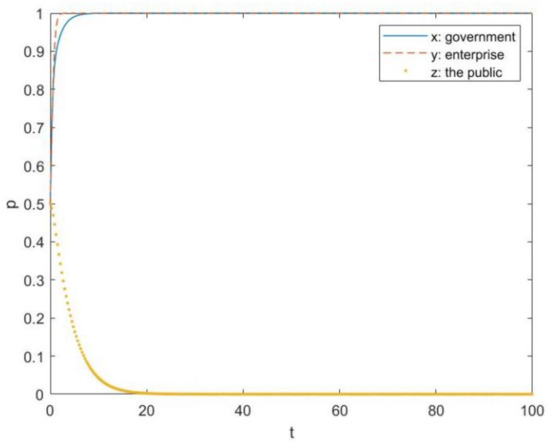
Figure 4.
The evolutionary path of Case 1-1.
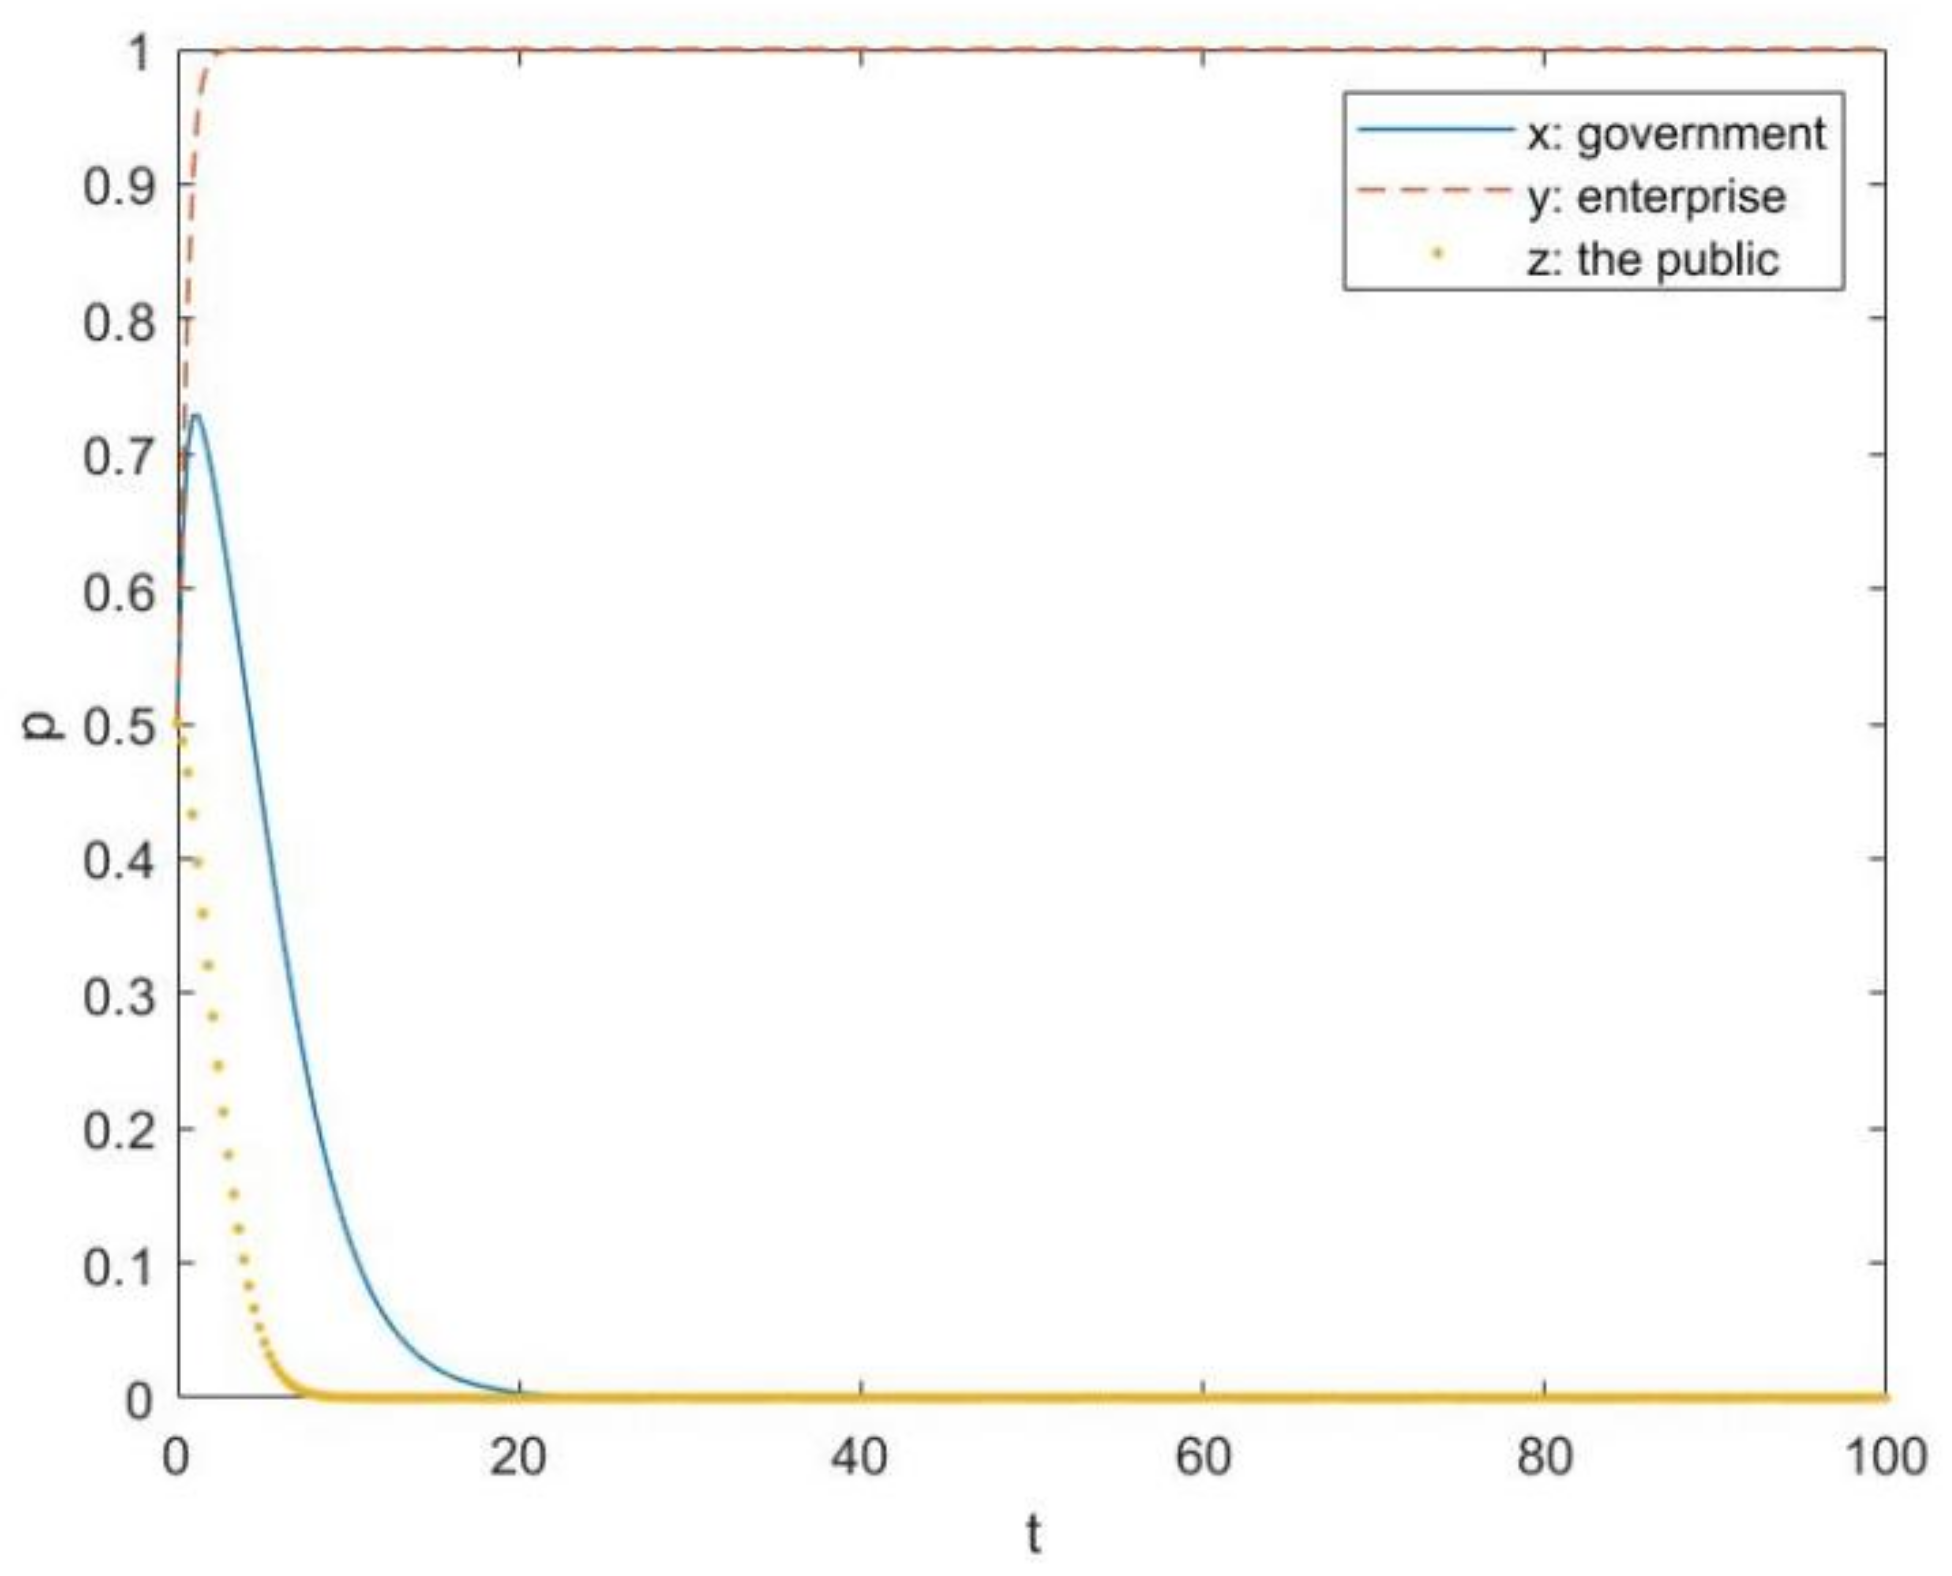
The evolutionary path of Case 1-2 is shown in Figure 5. As can be seen, enterprises are also the first to reach equilibrium and end up choosing non-compliance. However, this time, the public reaches equilibrium faster than governments, and the public ends up choosing cooperation, while governments end up choosing supervision. It is worth mentioning that there is a short period of time where the strategy probability of the governments’ non-supervision is on the rise, before it declines to 0.
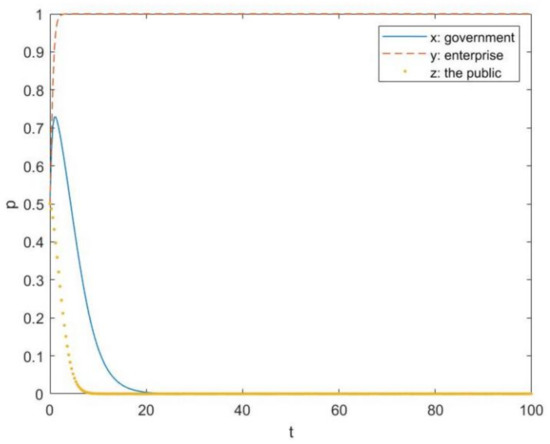
Figure 5.
The evolutionary path of Case 1-2.
The evolutionary path of Case 2-1 is shown in Figure 6. It is quite similar to Case 1-1. Enterprises are the first to reach equilibrium and end up choosing non-compliance. Governments require more time to reach equilibrium, and they all ultimately choose non-supervision. The public takes the longest time to reach an equilibrium, and they choose cooperation with the passage of time. However, a little different from Case 1-1, there is a time when governments have a faster evolving speed than enterprises, which reach an equilibrium early.
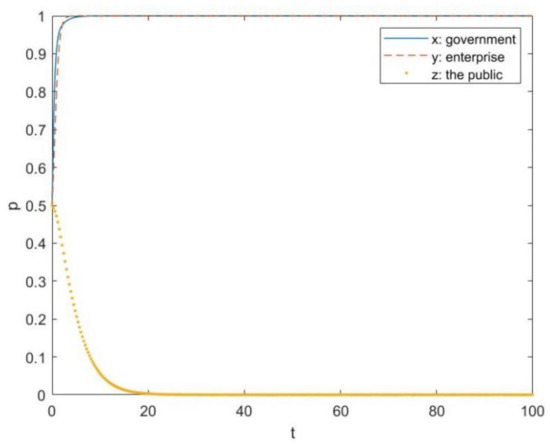
Figure 6.
The evolutionary path of Case 2-1.
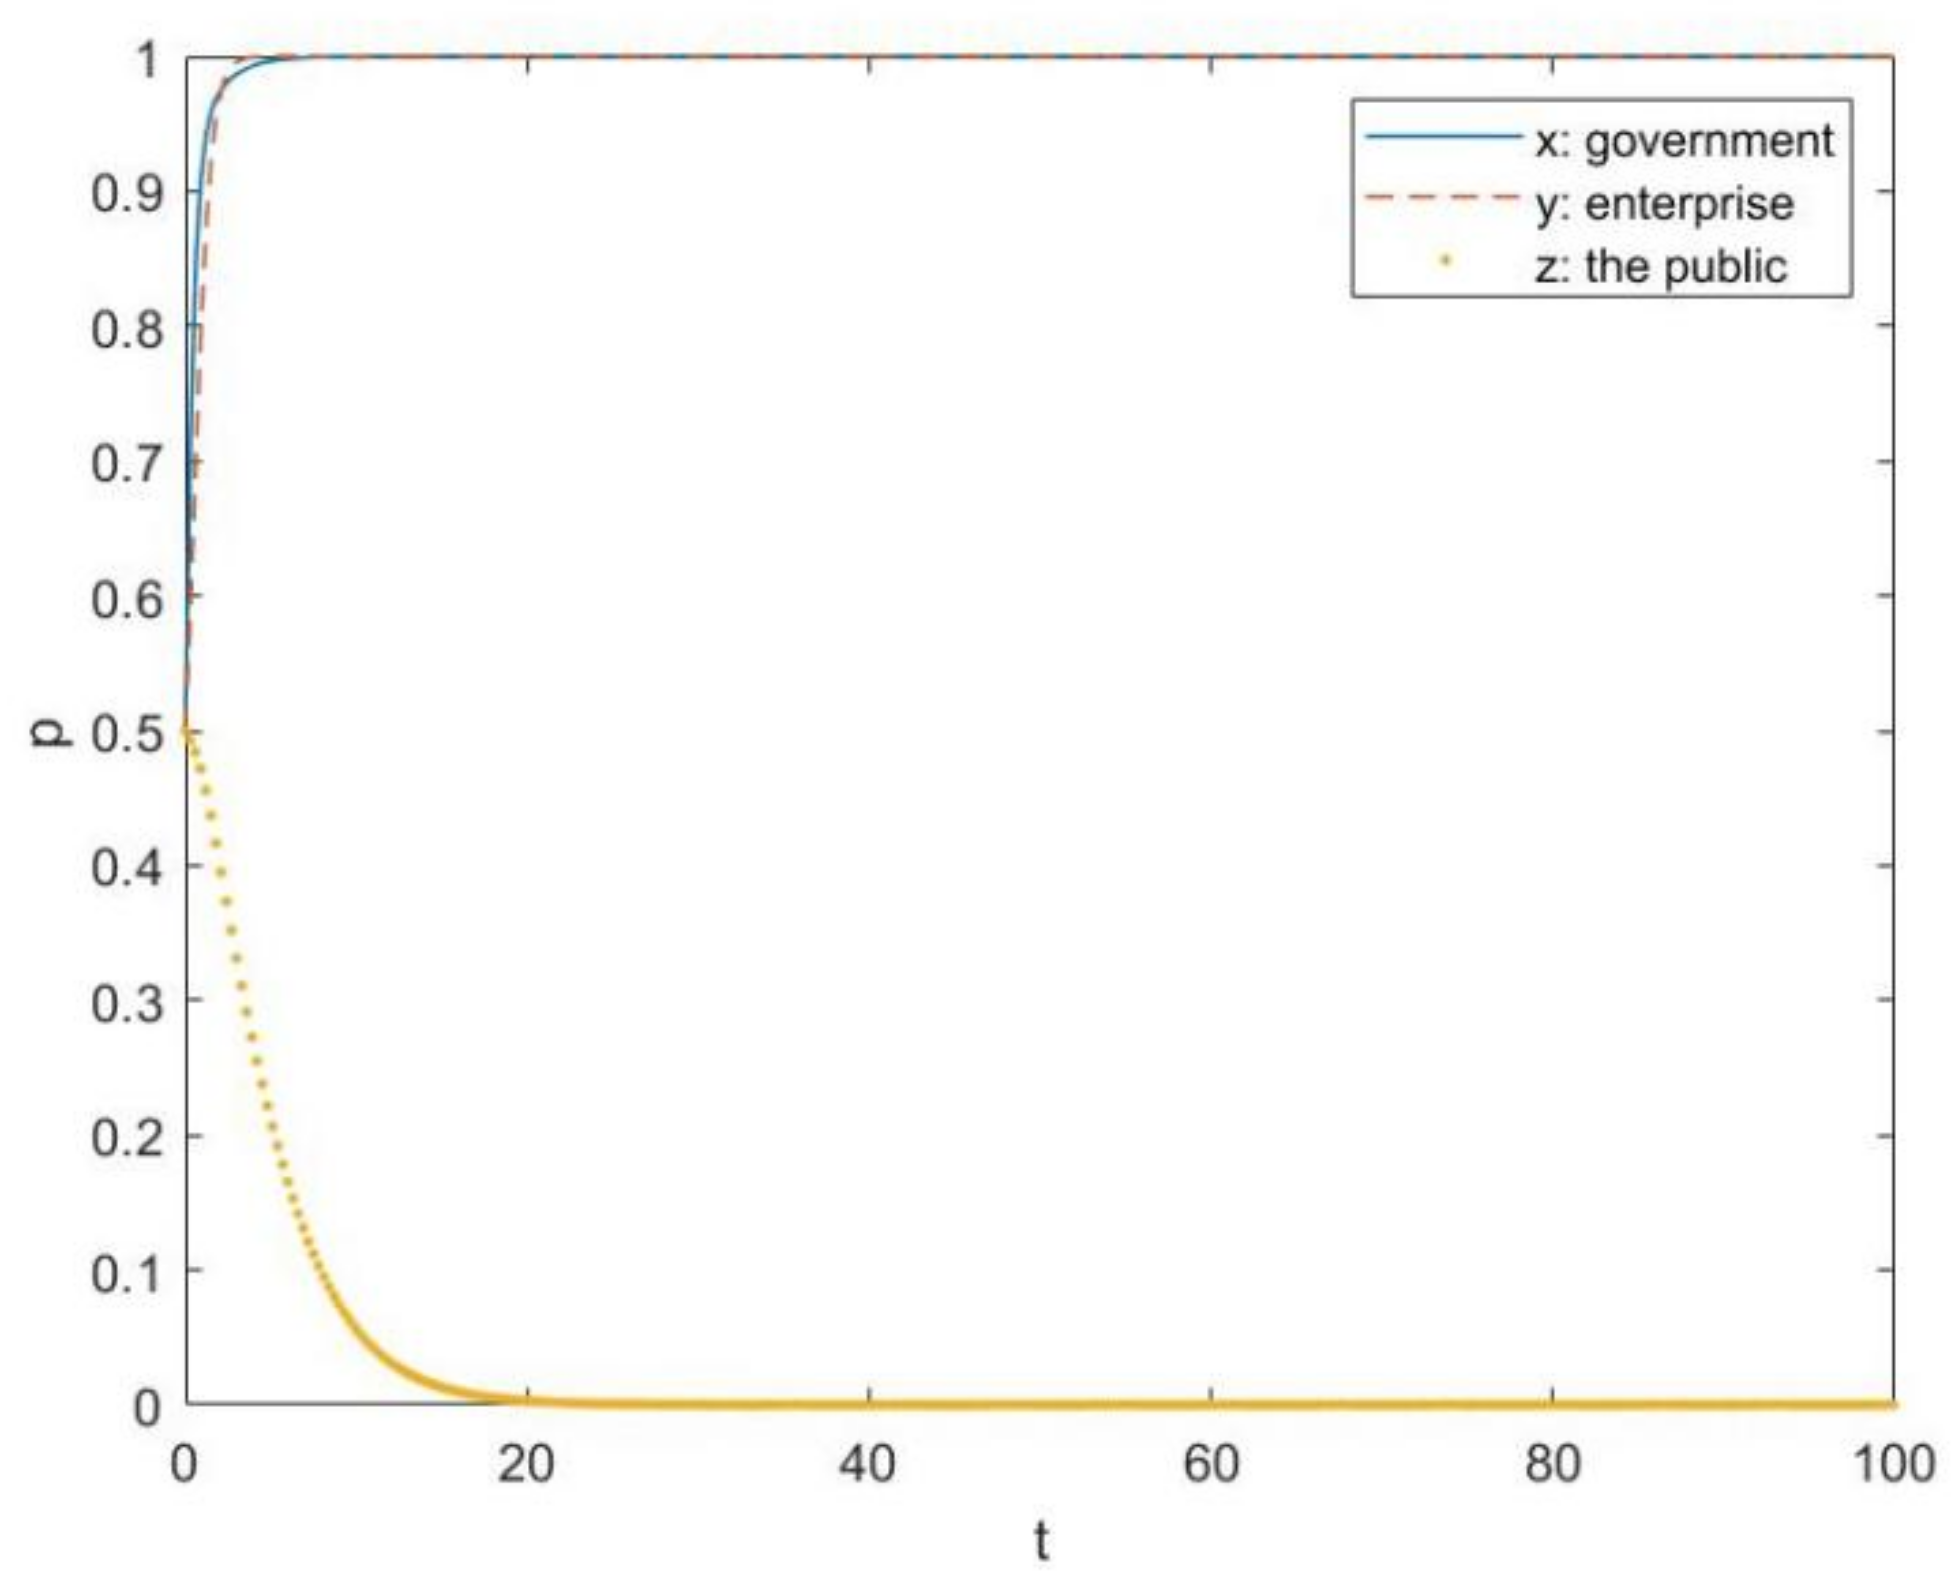
The evolutionary path of Case 3-1 is shown in Figure 7. Although the final results of this case are the same as Case 1-1—where governments choose non-supervision, enterprises choose non-compliance and the public chooses cooperation—the evolving process is different. It is obvious that governments evolve faster than enterprises and the public and are the first to reach equilibrium.

Figure 7.
The evolutionary path of Case 3-1.
This part is to be extended by an analysis of how changes in the critical parameters influence the evolution process of the non-effective stage and whether the final results, namely the ESS, will change with regard to the changes in those parameters.
Given that enterprises are the most crucial part of the success of plastic pollution control, the parameters , which mainly affect enterprises’ payoffs, play significant roles in the outcomes of the evolution.
There is no doubt that these parameters may also have an influence on governments and the public, but all of them are relatively insignificant. Since the enterprises determine whether plastic pollution control is successful, as shown above, this paper will not discuss at length about how influence participants and enterprises. Only the evolution paths of enterprises remain in Figure 8, Figure 9, Figure 10 and Figure 11 to ensure the clarity of the comparisons. Considering that there is little difference among enterprises among the four cases, Case 1-1 is taken as a representative example.
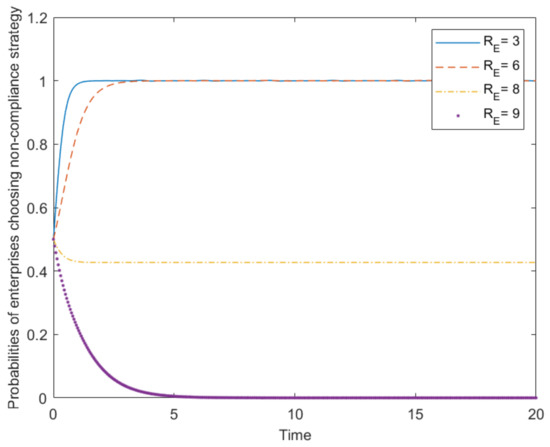
Figure 8.
The evolution results concerning .
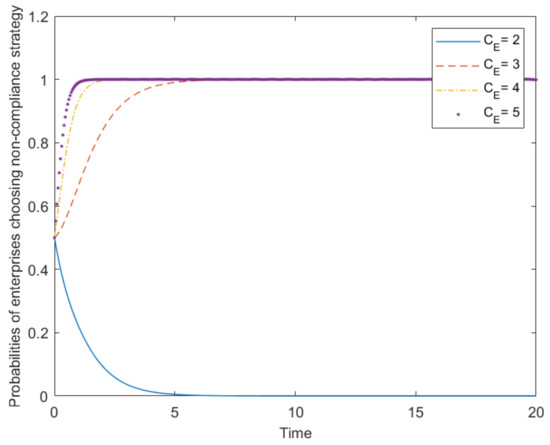
Figure 9.
The evolution results concerning .
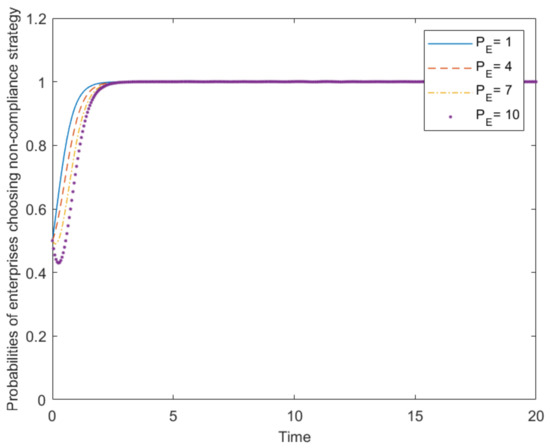
Figure 10.
The evolution results concerning .
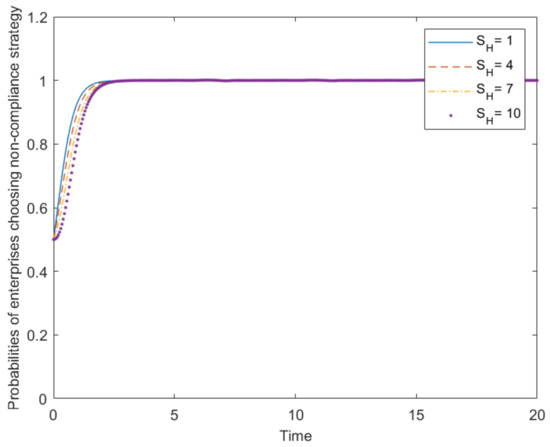
Figure 11.
The evolution results concerning .
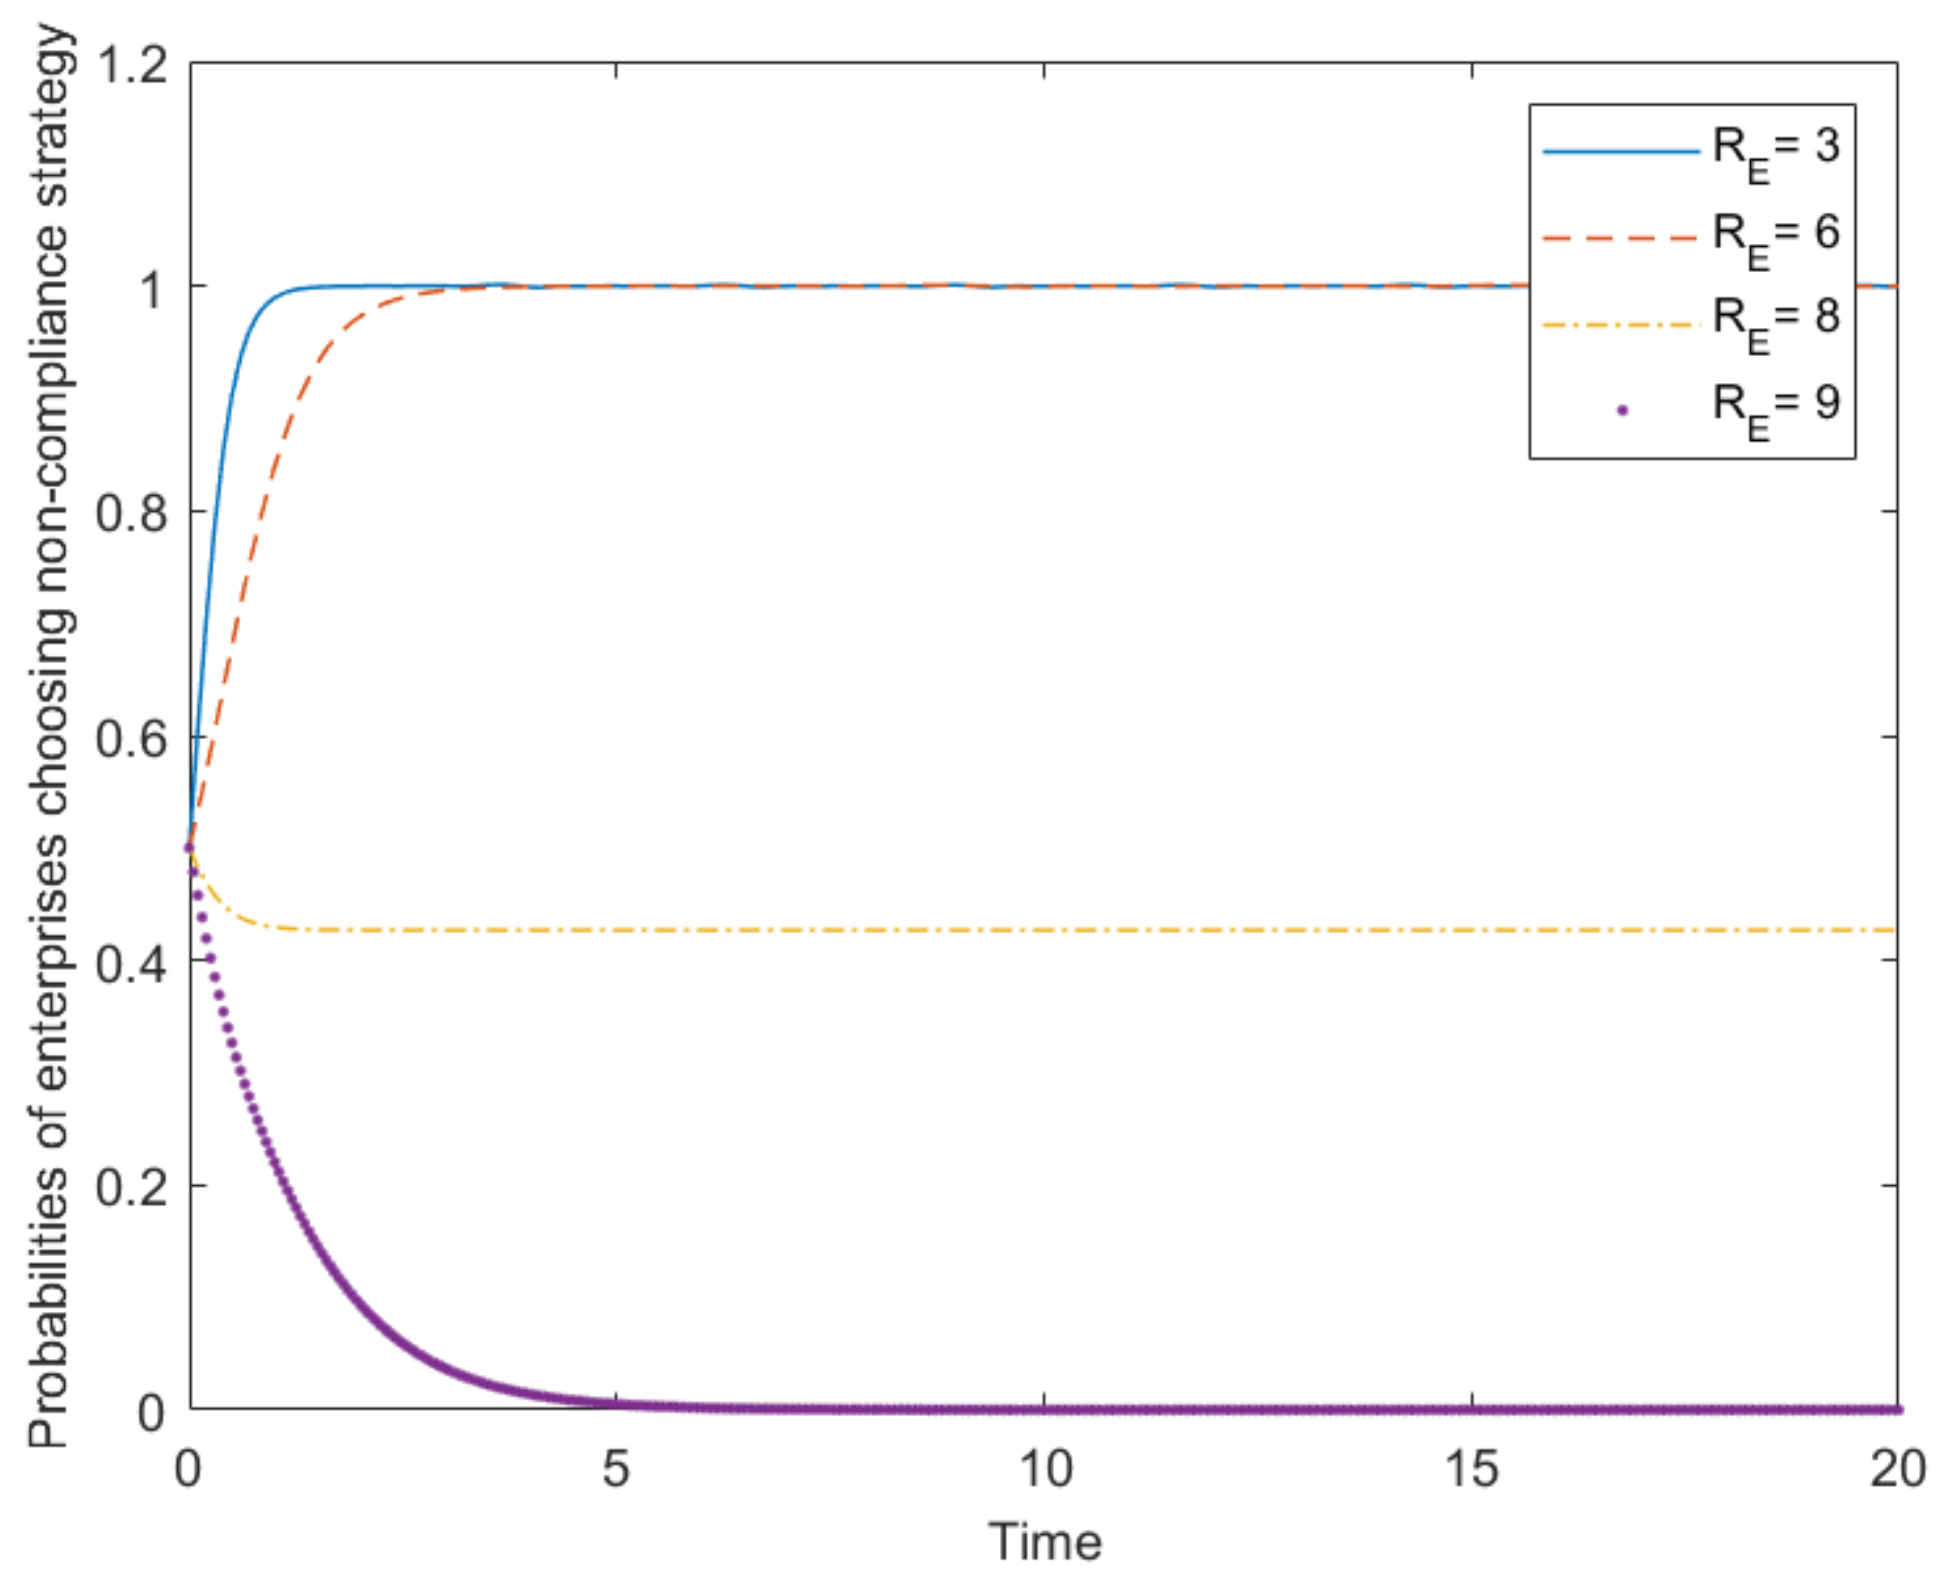
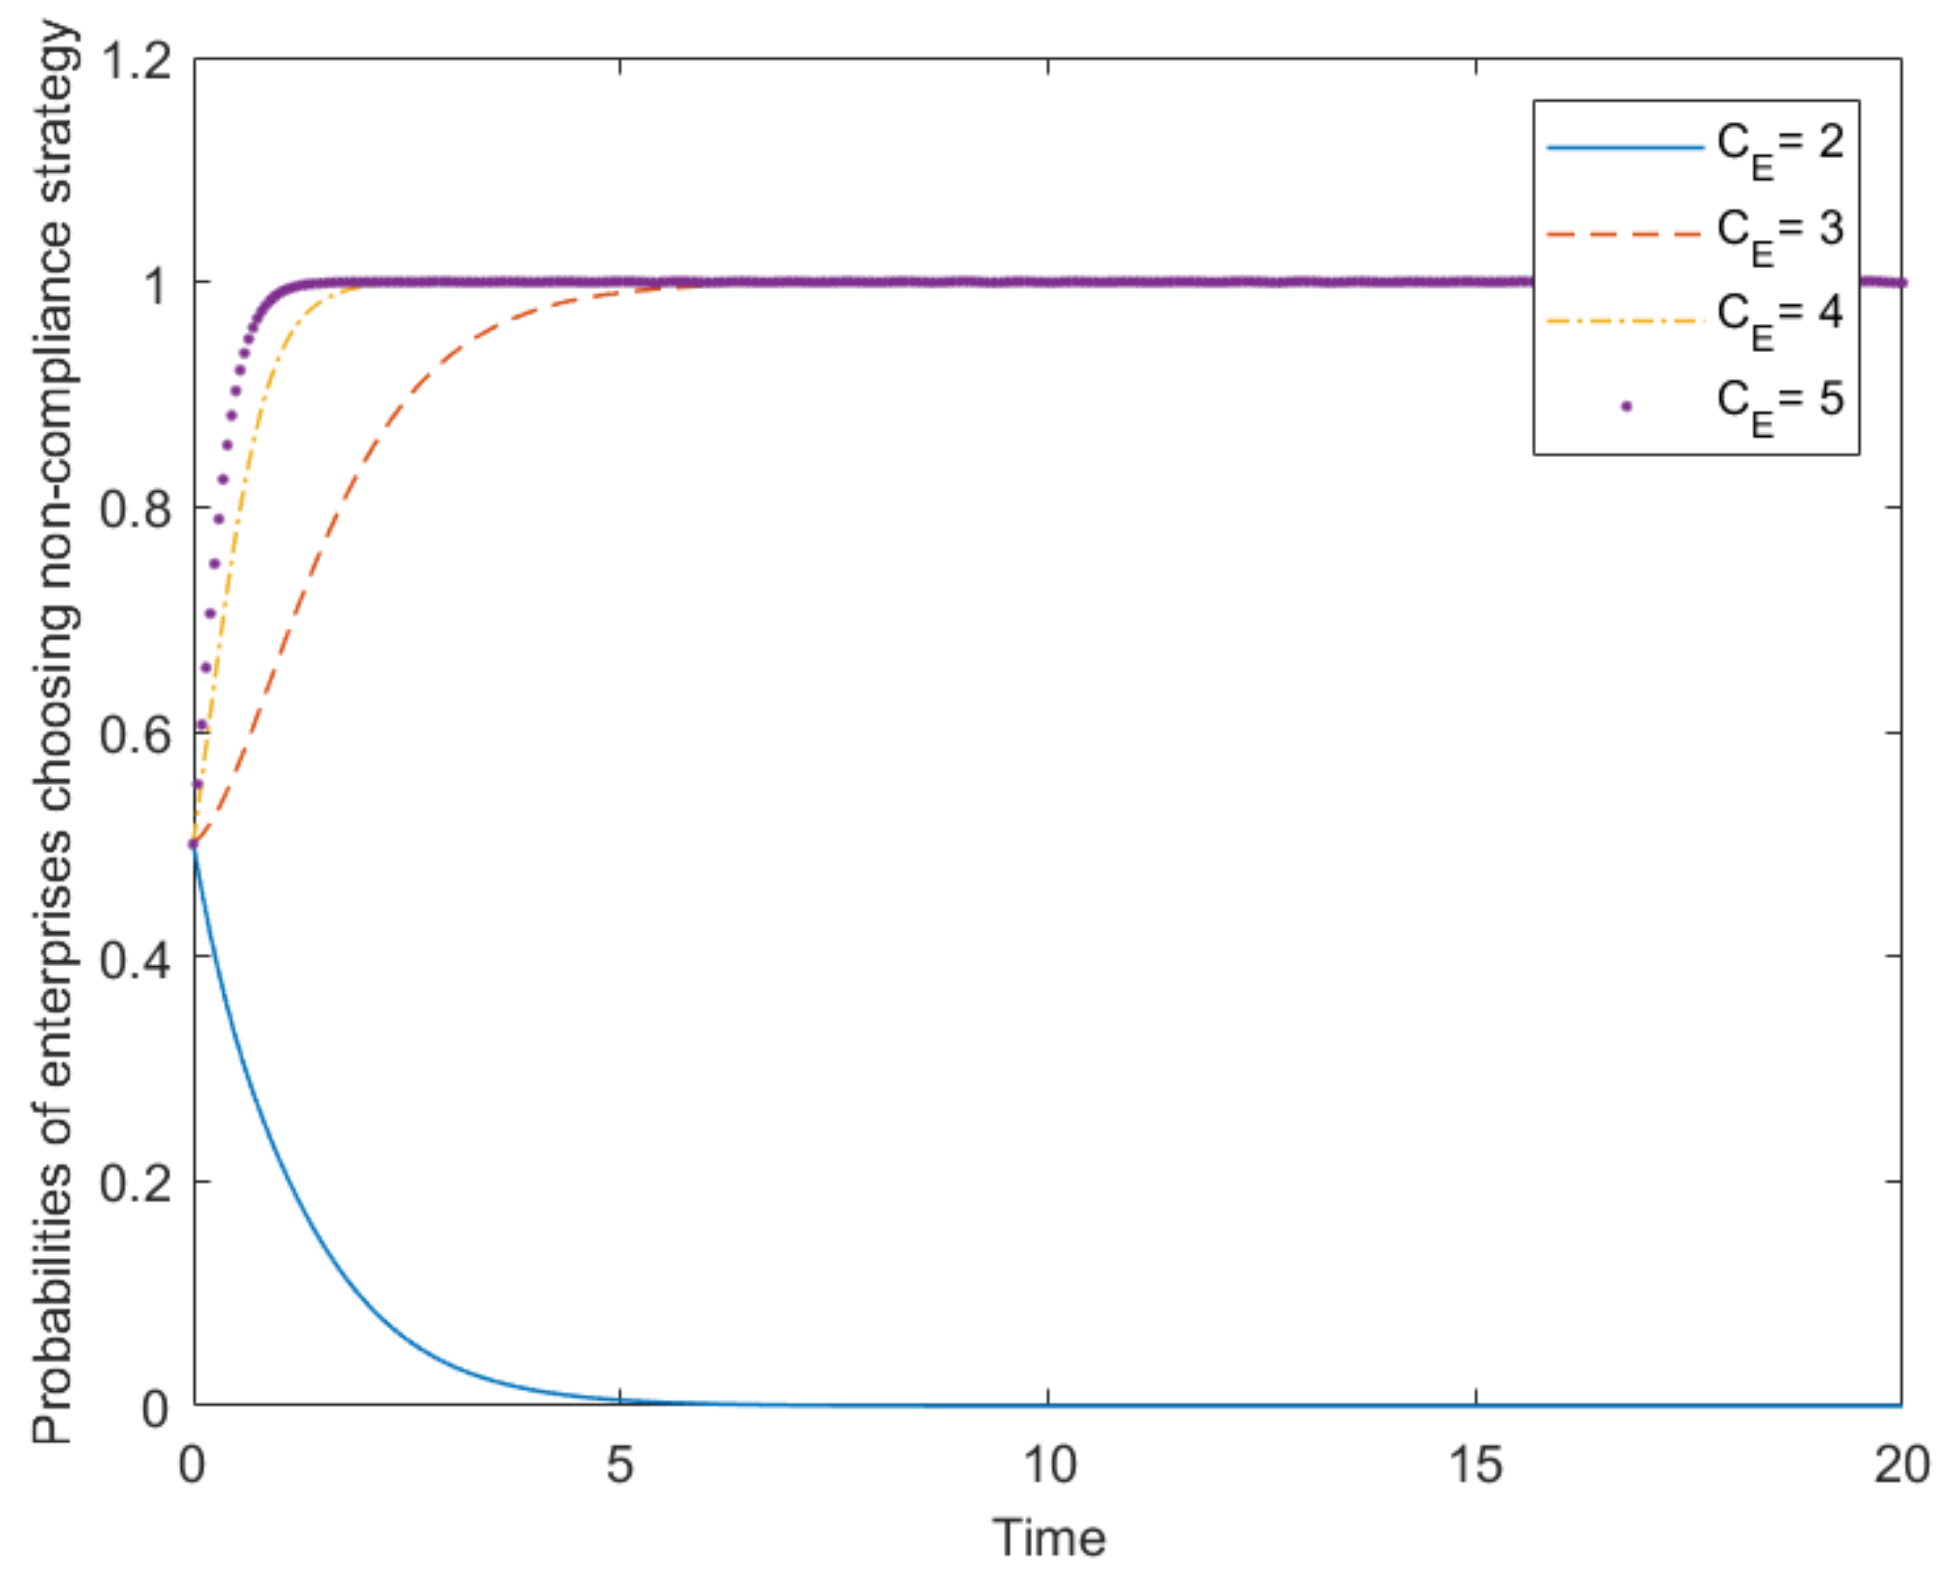
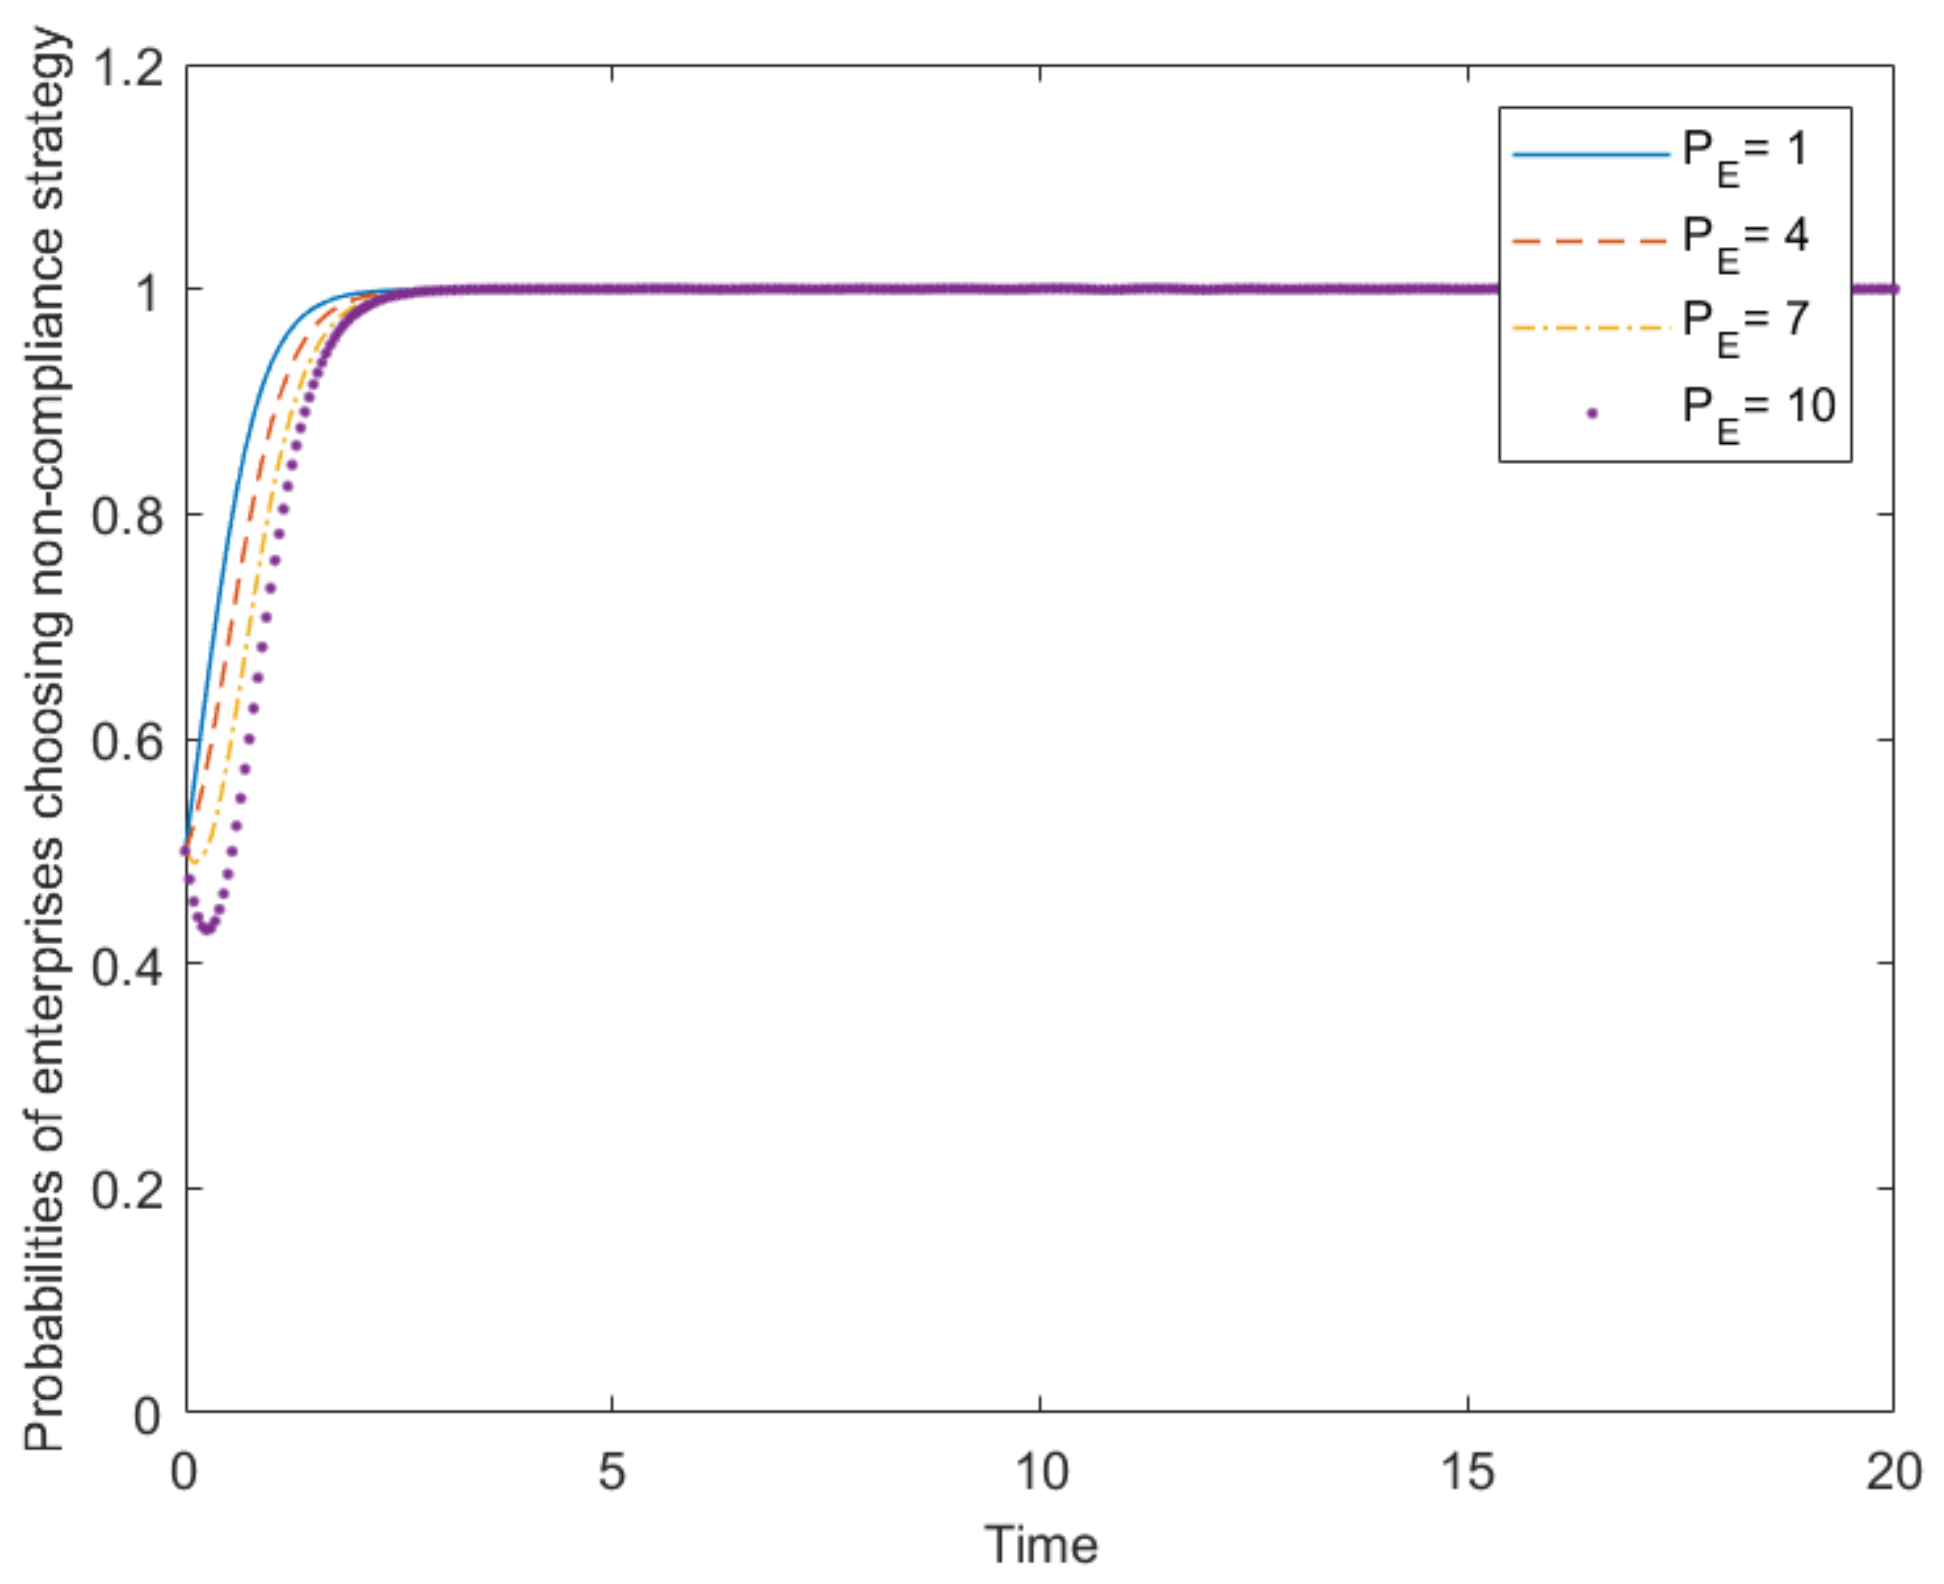
As shown above, is the compliance reward in economic benefits and reputation to an enterprise for choosing a compliance strategy; is the compliance cost an enterprise pays when choosing a compliance strategy; is the non-compliance penalty of an enterprise led by choosing a non-compliance strategy; is the compulsory compensation obtained by the public from an enterprise when this enterprise does not choose a compliance strategy, the public chooses a cooperation strategy, and the governments choose a supervision strategy.
With regard to the compliance reward, the values of are set as 3, 6, 8, and 9, respectively. The results are shown based on the replicator dynamic equation in Figure 8. As can be clearly seen, it will be increasingly difficult for enterprises to achieve a unanimous choice of non-compliance with an increase in . When = 3 or = 6, the probability that enterprises choose a non-compliance strategy continually increases, but the speed at which enterprises choose a non-compliance strategy reduces with the increase in . In other words, it takes enterprises more time to agree to not comply with the Plastic Ban when the compliance reward increases, but by a small amount. When = 8 or = 9, the probability that enterprises choose a non-compliance strategy decreases, which means that a high compliance reward can drive the selection to comply with policies. This makes it possible to ensure the success of plastic pollution control.
With regard to the compliance cost, the values of are set as 2, 3, 4, and 5, respectively. The results are shown based on the replicator dynamic equation in Figure 9. As can be seen, it will be increasingly difficult for enterprises to achieve a unanimous choice of non-compliance with the decrease in , which is contrary to the situation of . When = 3, = 4, and = 5, the probability that enterprises choose a non-compliance strategy continually increases. The larger is, the faster enterprises choose a non-compliance strategy and reach an equilibrium. That is to say, a high compliance cost discourages enterprises from complying with the Plastic Ban [50]. When = 2, the probability that enterprises choose a non-compliance strategy decreases, which means that a low compliance cost can also lead to enterprises being enthusiastic about promoting plastic pollution control.
With regard to the non-compliance penalty, the values of are set as 1, 4, 7, and 10, respectively. The results are shown based on the replicator dynamic equation in Figure 10. As is shown, the probabilities that enterprises choose a non-compliance strategy all increase. The growth in values of can reduce the speed at which enterprises reach an equilibrium of choosing a non-compliance strategy. However, the change is relatively small and can hardly reduce the probabilities that enterprises choose a non-compliance strategy, even when there is a quite huge increase in to the entire system.
With regard to the compulsory compensation, the values of are set as 1, 4, 7 and 10, respectively. The results are shown based on the replicator dynamic equation in Figure 11. As shown in the figure, the probabilities that enterprises choose a non-compliance strategy all increase. The growth in values of can reduce the speed at which enterprises reach an equilibrium of choosing a non-compliance strategy. However, the change is relatively small and can only slightly reduce the probability that enterprises choose a non-compliance strategy, even when there is a substantial huge increase in in the entire system. This is similar to the situation of , but the influence that can have on the whole system is even smaller.
If the values of , which reflect the reaction of governments and the public to enterprises’ compliance strategy, increase to a certain level, the trend in which the probability that enterprises choose a non-compliance strategy converges to 1 can be reversed. However, for governments and the public, this will increase the rate at which the probability of choosing a non-supervision strategy or non-cooperation strategy converges to 1. The increase in the values of can reduce the speed at which the probability that enterprises choose a non-compliance strategy converges to 1. However, the effect is too small relative to other parameters. Even if the original value is 100 times the original value, it is difficult to reverse this trend. Thus, can play an auxiliary role in promoting plastic pollution control, but they can never play a key role.
In conclusion, the government should take action to increase the compliance reward, the non-compliance penalty, and the compulsory compensation and decrease the compliance cost to promote the success of plastic pollution control. Providing incentives, granting financial support, increasing punitive fines, introducing new technology, and implementing tax deductions or exemptions are actions worth considering. However, the suggested focus is, rather than the subsidiary non-compliance penalty or compulsory compensation, the increase in the compliance reward and the decrease in the compliance cost, which can truly lead to plastic pollution control and increased efficiency.
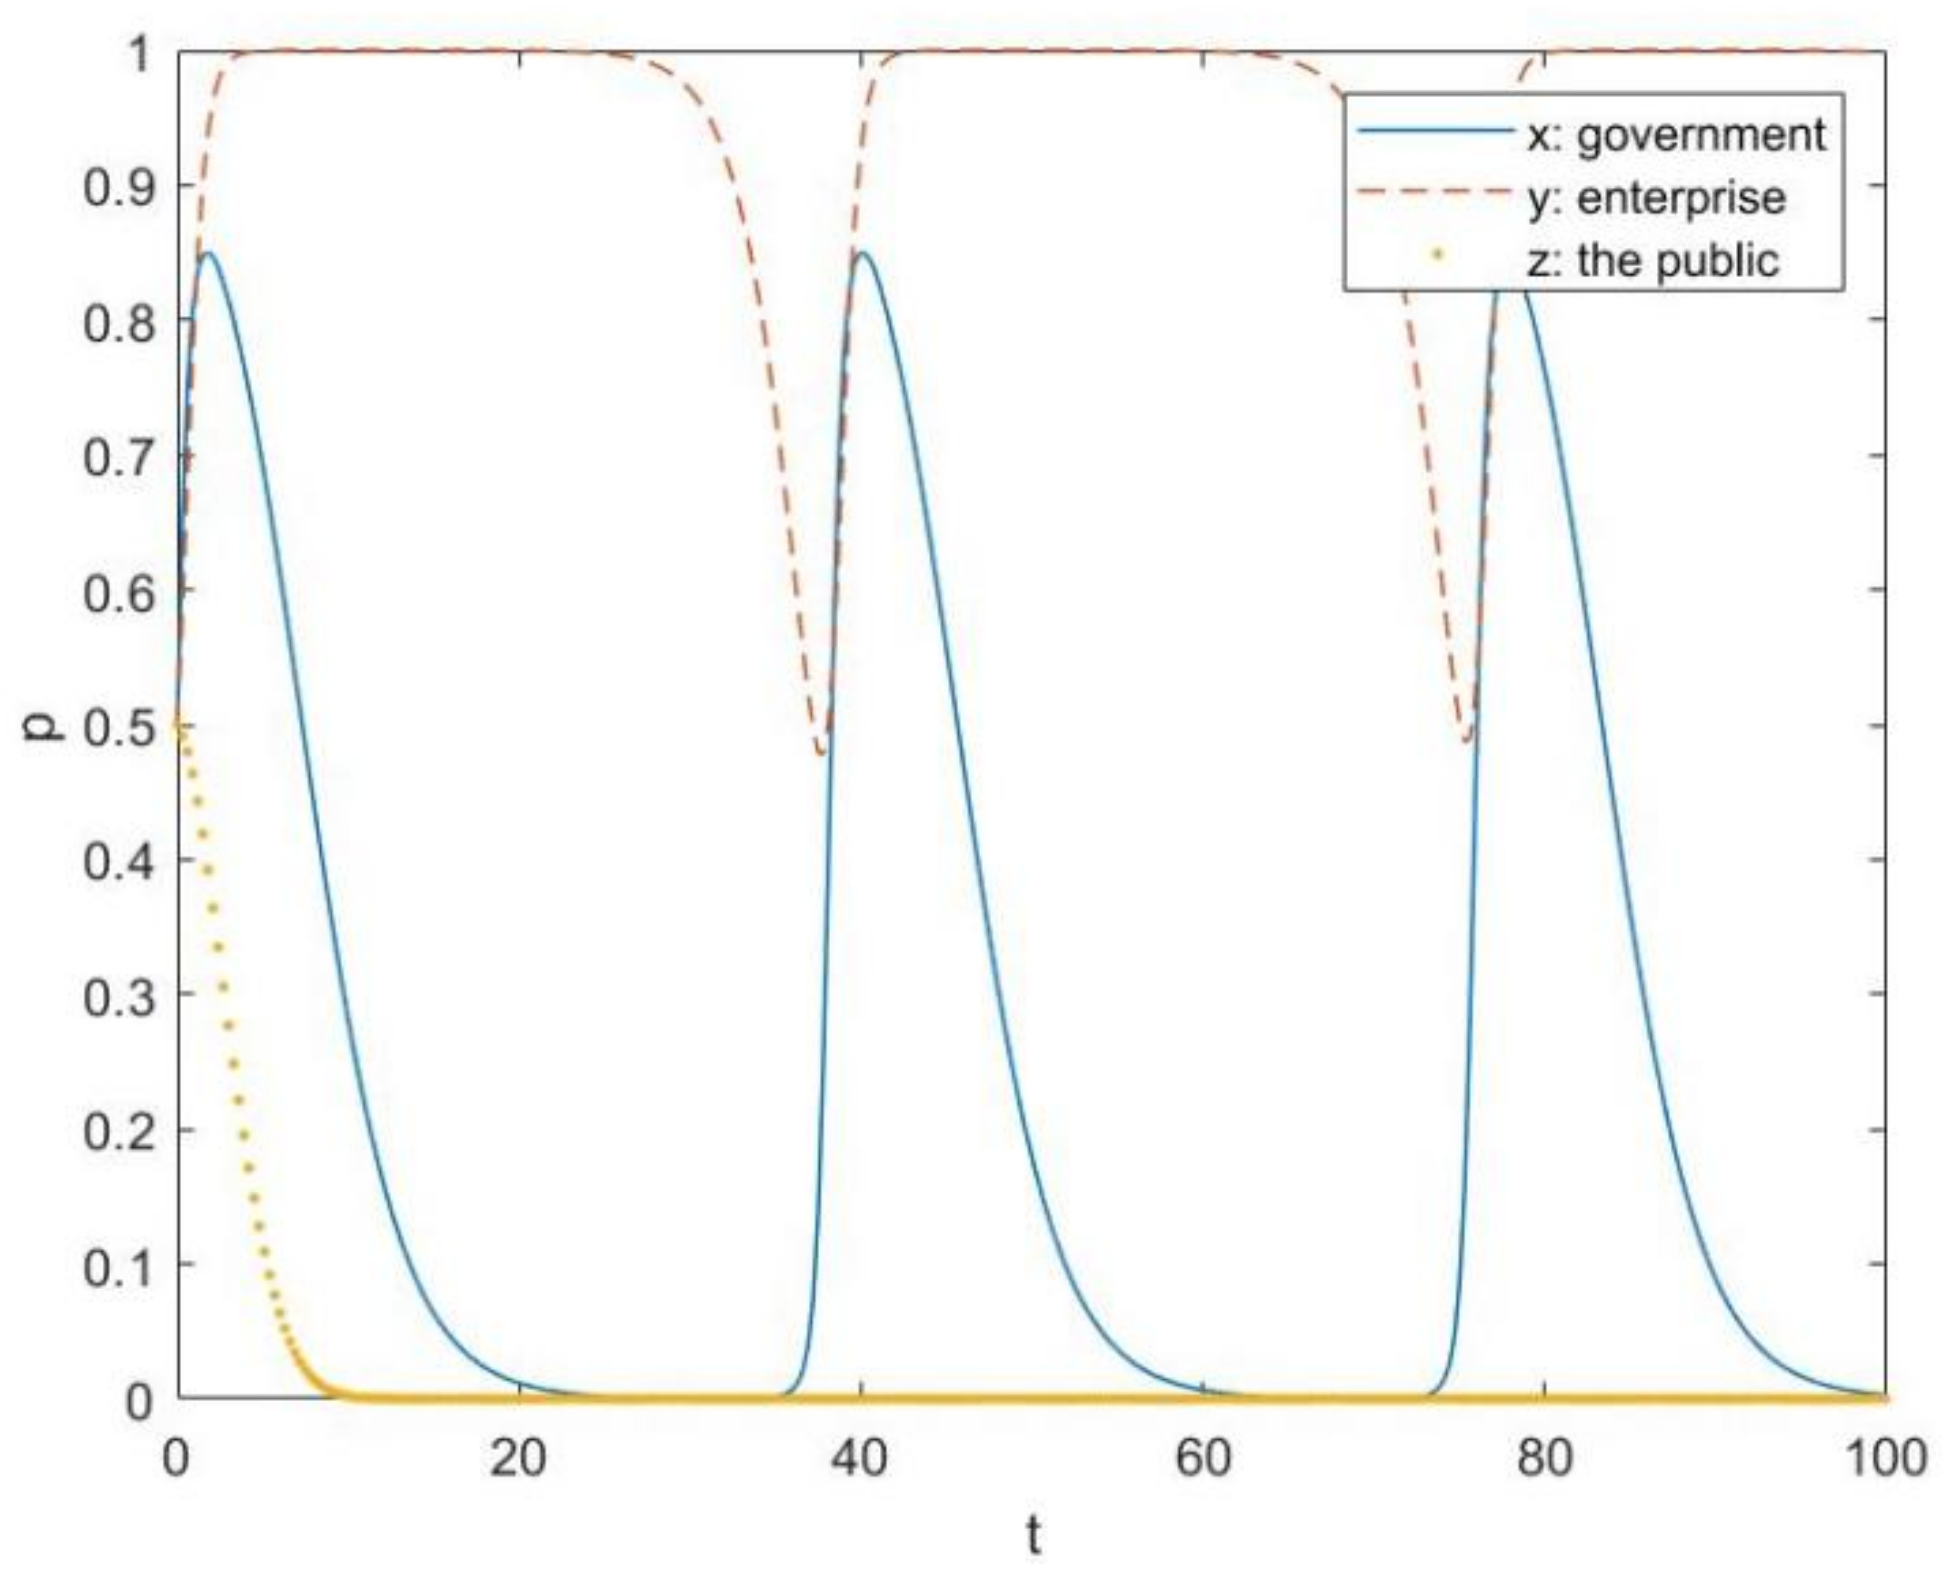
4.2. Evolution Path Graphs of Three Participants on the Effective Stage of Plastic Pollution Control
The effective stage is characterized by having no evolutionarily stable point in the system.
The parameter setting of the case S(s = 1-1, 1-2, 2-1, 2-2, 3-1, 3-2, 4-1, 4-2) is . As per the effective stage, the values of parameters are set as follows, according to Table 4:
Case 2-2: ; they satisfy the condition of , .
Case 3-2: ; they satisfy the condition of , .
The evolutionary path of Case 2-2 is shown in Figure 12. As can be seen, only the public achieves an ESS, while governments and enterprises continue changing their strategies to adapt to each other’s strategies. After a period of time when most governments choose to regulate enterprises, most enterprises choose not to comply with policies, and the public chooses to cooperate. The probability that enterprises choose a non-compliance strategy declines, and the probability that governments choose a non-supervision strategy increases. The situation then reverses sooner, and a cycle begins where governments and enterprises repeat this process. The probability that enterprises choose a non-compliance strategy fluctuates regularly, approximately between 0.5 and 1. The probability that governments choose a non-supervision strategy also fluctuates regularly, approximately between 0 and 0.85. It is not difficult to conclude that enterprises prefer not to comply with the governments’ policies.
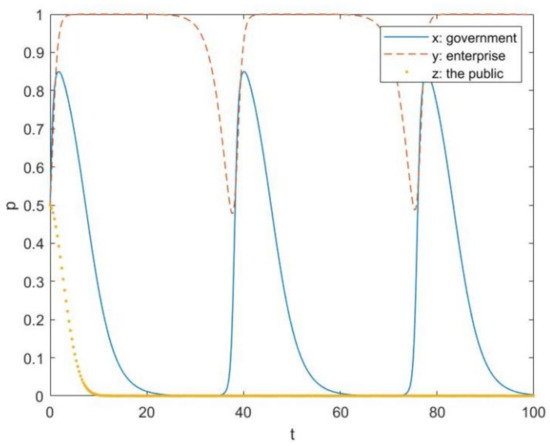
Figure 12.
The evolutionary path of Case 2-2.
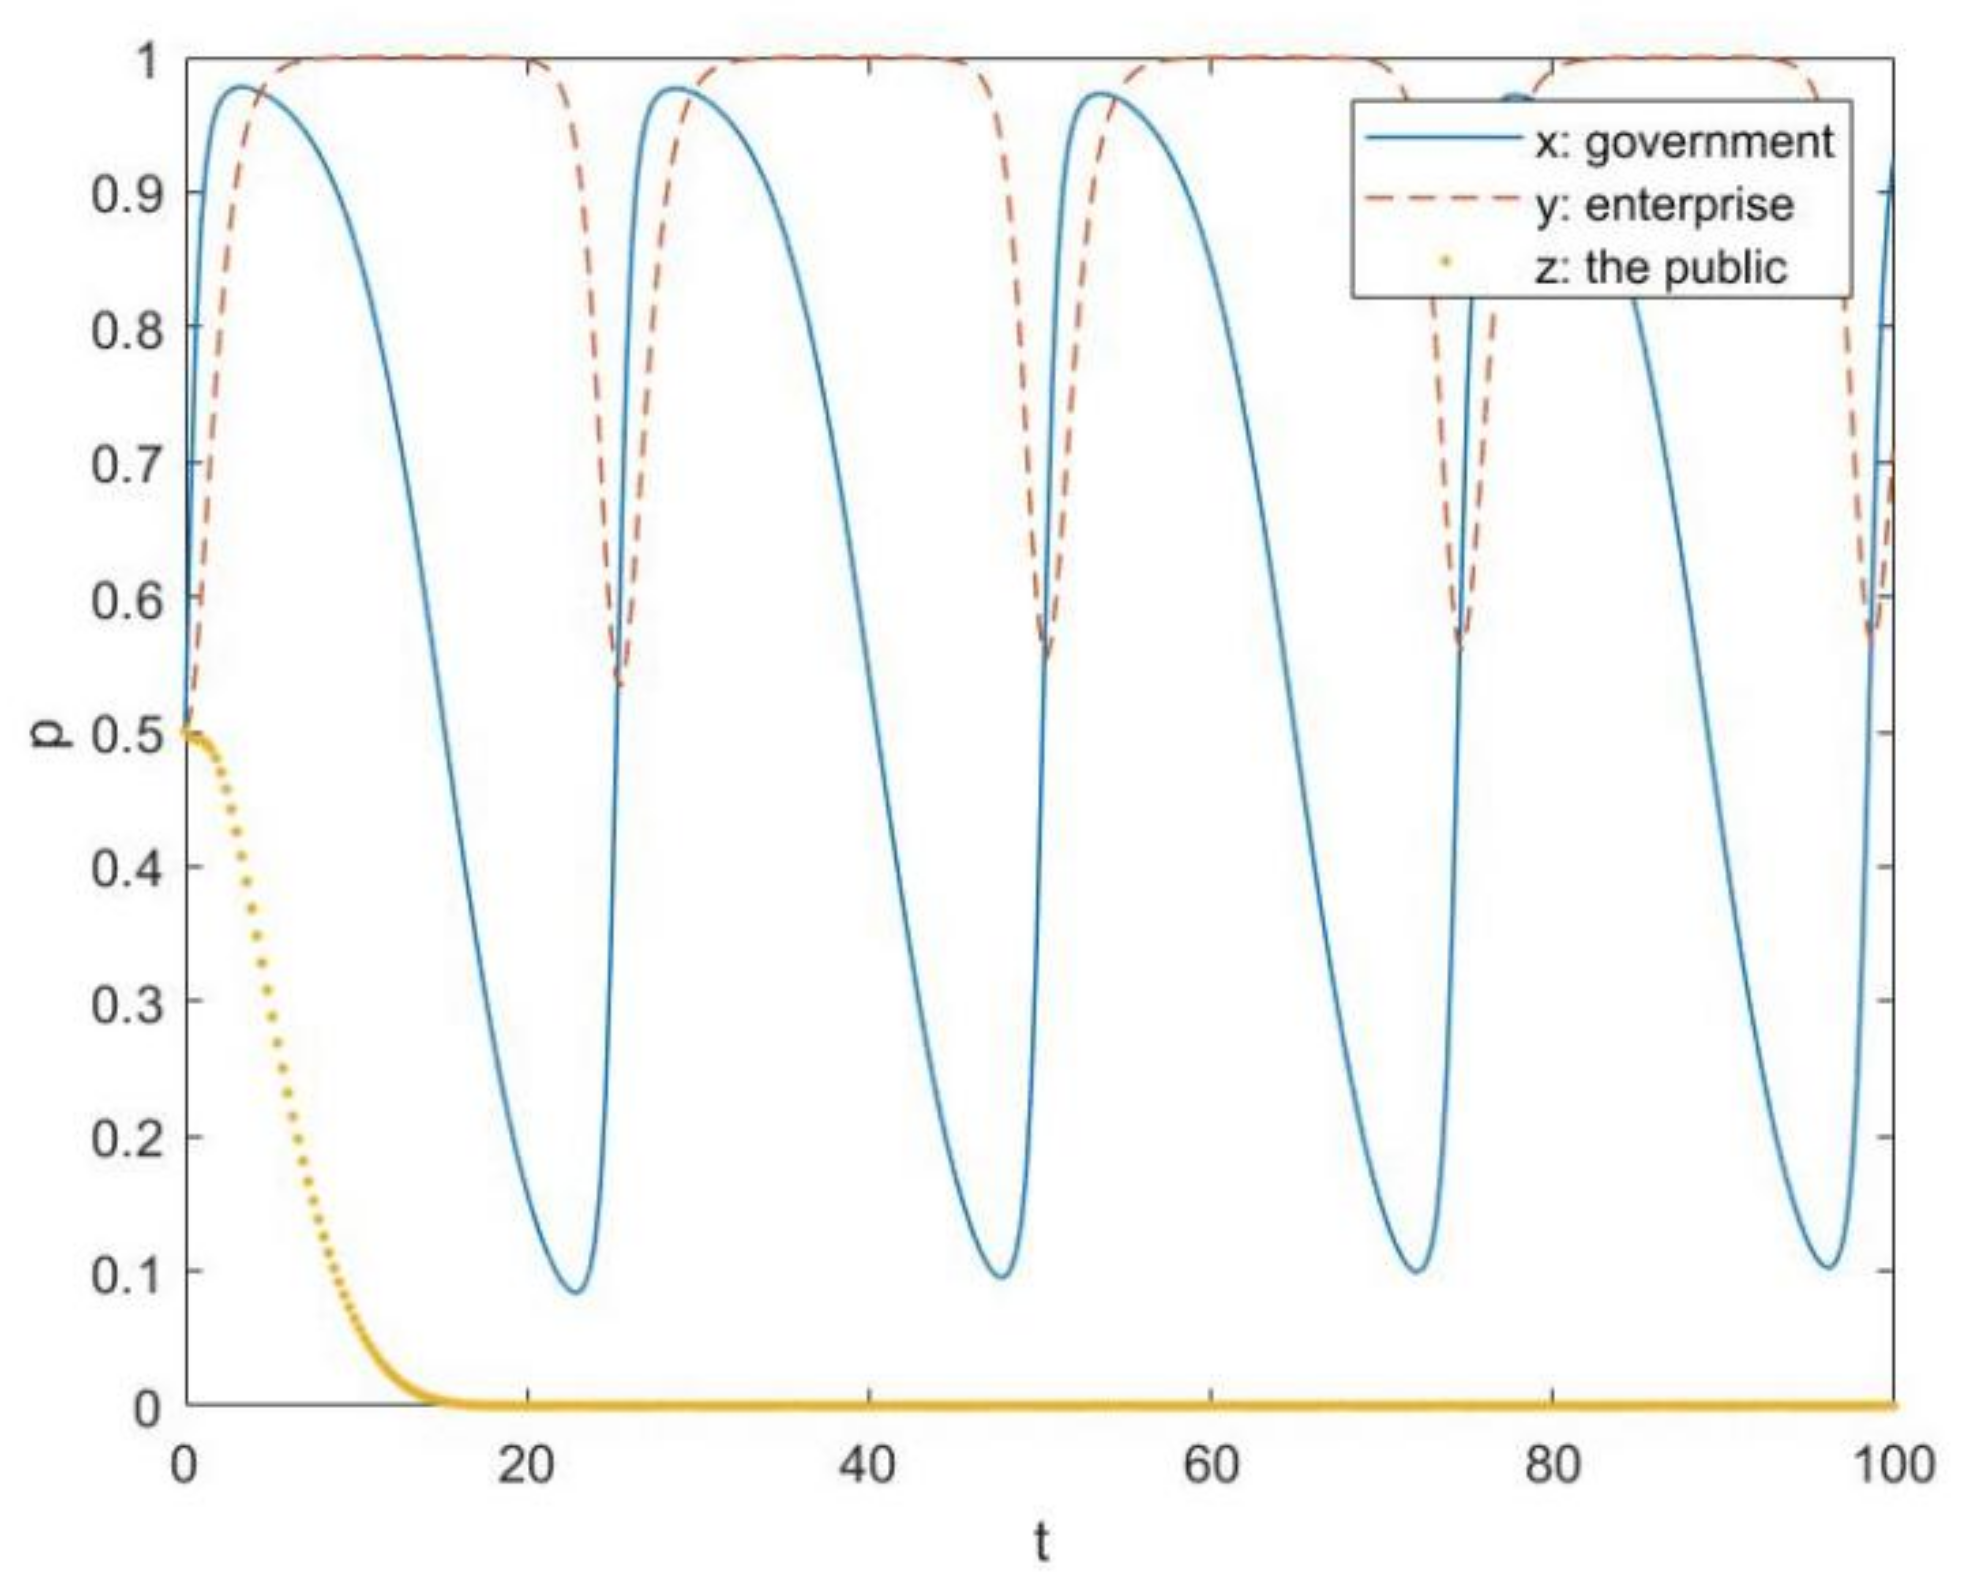
The evolutionary path of Case 3-2 is shown in Figure 13. The public becomes the only group to achieve an ESS, while governments and enterprises continue changing their strategies to adapt to each other’s decisions. The probability that enterprises choose a non-compliance strategy fluctuates regularly, approximately between 0.5 and 1. The probability that governments choose a non-supervision strategy also fluctuates regularly, approximately between 0 and 0.85. Compared to Case 2-2, both the probability that enterprises choose a non-compliance strategy and the probability that governments choose a non-supervision strategy change at a higher speed and a higher frequency, especially the latter. Governments also prefer a non-supervision strategy more, but in a situation where, with the help of outside force, stability is difficult to reach compared with Case 2-2.

Figure 13.
The evolutionary path of Case 3-2.
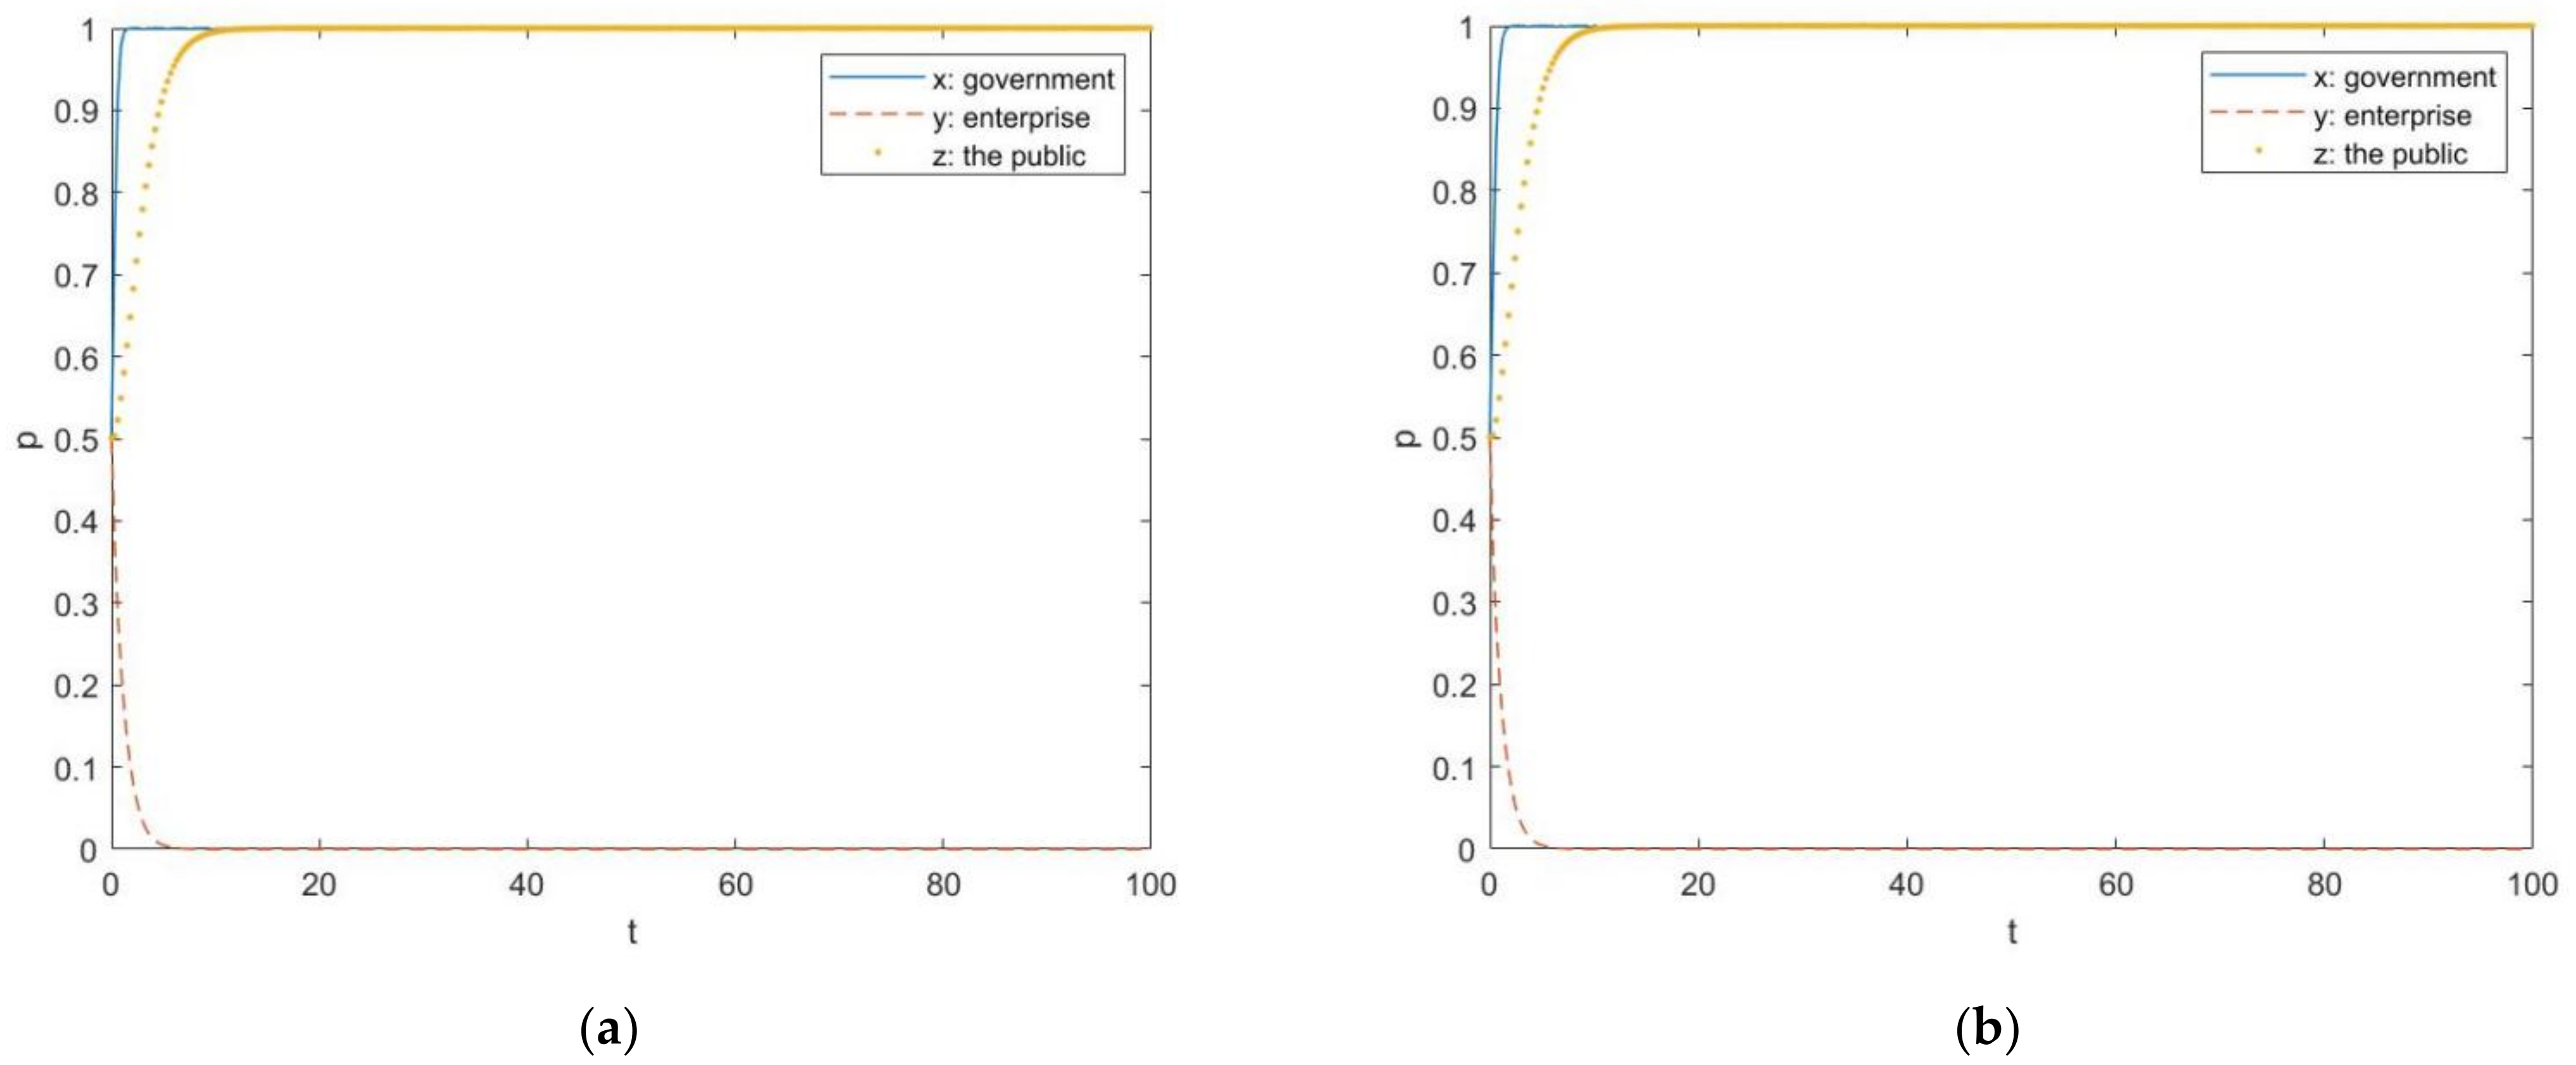
4.3. Evolution Path Graphs of the Three Participants on the Autonomic Stage of Plastic Pollution Control
The autonomic stage is characterized by enterprises’ spontaneous choice of a compliance strategy without the push from governments and the public.
The parameter setting of the case S(s = 1-1, 1-2, 2-1, 2-2, 3-1, 3-2, 4-1, 4-2) is . As per the autonomic stage, the values of parameters are set as follows, according to Table 4:
Case 4-1: ; they satisfy the condition of , .
Case 4-2: ; they satisfy the condition of , .
The evolutionary paths of Case 4-1 and Case 4-2 are shown in Figure 14a,b, respectively. They are similar enough to be analyzed together. As can be seen, governments are the first to reach an equilibrium and end up choosing non-compliance. Enterprises require more time to reach an equilibrium, and they all ultimately choose compliance. The public requires the longest time to reach an equilibrium, and they choose cooperation with the passage of time. All of the final results are consistent with the analysis in Table A1, which shows that non-supervision, compliance, and non-cooperation is the strategic combination of the three evolutionarily stable strategies (ESSs) in Case 1-1.
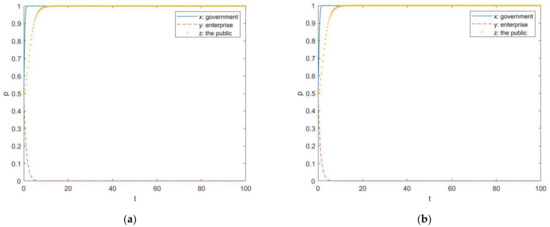
Figure 14.
The evolutionary paths of autonomic stage: (a) The evolutionary paths of Case 4-1; (b) The evolutionary paths of Case 4-2.
5. Discussion
The process of plastic pollution prevention and control is divided into the noneffective stage, the effective stage, and the autonomic stage in this paper. From the analysis of the ESS in the tripartite system, it is necessary to increase the reward for an enterprise’s compliance with a policy to exit the noneffective stage, and the governments’ non-supervision reward needs to be lower than the supervision reward to promote the success of plastic pollution control. The basis of reaching the autonomic stage is achieving the condition of , which guarantees the public’s participation. The results of the research show that, when the government adopts an effective supervision mode and implements corresponding measures, it can increase the reward obtained by participants who adopt a positive strategy and reduce their loss indirectly, thus ensuring the compliance of both enterprises and the public. However, what matters most is the cooperation of the tripartite mainstay, through which the systematic approach to promoting the progress of plastic pollution control can truly work.
The following numerical simulation illustrates the evolution process and the characteristics of each stage and shows that a compliance reward and a decrease in the compliance cost are the key to success in solving plastic pollution.
The current research focuses mostly on government behavior and covers most aspects of policy setting and supervision, as well as solutions to existing deficiencies. Regarding a root cause analysis of the tripartite mainstay, interactions among related agents have not been considered. Many the suggestions offered lack a solid theoretical foundation. Consequently, the main contribution of this paper is that it not only applies a tripartite evolutionary model under the background of the Plastic Ban, expanding the evolutionary game theory to plastic pollution control in China, but also extracts the main point of the new policies and focuses on the role that enterprises play in the system. Moreover, this paper provides reasonable directions to be examined using empirical evidence in the future.
However, a model of this kind cannot perfectly depict a complex system. It is undeniable that, although great effort has been made to avoid subjectivity, the process of abstracting is one-sided, so there is room for improvement. However, the tripartite evolutionary model can help abstract main factors, the relationships between which are difficult to determine. The crux of the problem of plastic pollution control is easy to determine when excluding insignificant factors.
Developing countries such as China have shifted their policies’ focus from the public to enterprises, so this paper largely examines the value of enterprises in plastic pollution prevention and control. The differences between focusing on the public and focusing on enterprises will be an interesting and meaningful future direction. Moreover, combining empirical studies and experiments with theoretical model research will also be worth pursuing. The synergy and indirect influences among governments, enterprises, and the public also remain to be further studied.
6. Conclusions
Based on the promulgation of the Plastic Ban, this paper introduces a tripartite evolutionary game model and analyzes each situation and potential strategies of governments, enterprises, and the public. Based on this game model, it explores the strategic choices and the evolution and stability of the governance system. The key elements of plastic pollution control and the validity of analysis conclusions are verified through simulation analysis, and suggestions are put forward accordingly, which is an innovation in the research of plastic pollution control.
For an efficient and effective plastic management process, we have four recommendations for governments:
The first is to provide economic assistance, policy assistance, and encouragement to enterprises. The improvement in compliance benefits and the reduction in compliance costs for enterprises will promote the prevention of plastic pollution and an expeditious evolution from the noneffective stage. Governments should provide enterprises with reputation promotion, economic benefits, brand value, plastic subsidies, and technical assistance.
The second is to adopt an effective government supervision model. By penalizing governments for non-supervision, by increasing supervision benefits, and by reducing supervision cost, the benefits of governments’ non-supervision can be lower than the benefits of supervision, so effective plastic pollution control can be achieved. Therefore, with increased supervision and inspection efforts, higher-level authorities can increase the probability that a government is punished and can strengthen punishments for governments failing to supervise when an enterprise does not comply with the policy. Moreover, increasing their reputation and rewards when higher-level authorities succeed in supervision through publicity, education, and incentives may well prompt governments to be more active. Finally, the government expenditures on supervision can be reduced through the introduction of technology and system optimization, thereby reducing the supervision cost of governments.
The third is to increase the degree of cooperation among the public. Reducing its coordination cost and losses for the public and increasing its coordination benefits will increase its coordination with policies, better promote the treatment of plastic pollution, and accelerate the arrival of the final, ideal stage. It is necessary to build relevant platforms, to strengthen the invention of cheap alternatives to plastics, to improve education on the production environment, and to appropriately commend the effects brought about by the long-term adherence to environmental governance.
The fourth is to ensure the systematic and synergistic nature of plastic pollution control. Improving the benefits of governments for complying with policies is the basis for the treatment of plastic pollution, along with promoting the formation of a situation where the benefits of non-supervision by governments are lower than the benefits of supervision. In order to increase the benefits of enterprises’ compliance with policies, it is necessary to use policy tools to increase the benefits of enterprises’ compliance with policies and the decrease of their compliance costs. In order to promote the formation of a situation where the benefits of non-supervision by governments are lower than the benefits of supervision, it is necessary to consider factors such as non-supervision penalties and supervision benefits at the same time. Moreover, it is important to strengthen the collaborative governance of enterprises, governments, and the public. As the research results reveal, mobilizing the public, enterprises, and other non-governmental organizations to actively participate and establishing benign cooperation with government departments constitute a long-term solution to plastics [54].
This paper focuses on the dynamic system of the long-term evolution of the rewards of a tripartite mainstay with plastic-related restrictive policies, while random interference based on bounded rationality remains to be considered. We now think that this may be realized by combining evolutionary game theory with Agent-Based Modeling (ABM) [55]. Thus, setting error terms that obey U (−0.15, 0.15) for governments, enterprises, and the public will allow for the existence of a percentage of error in microcosmic bodies’ strategy imitation and learning processes, relaxing the restrictions on rationality. This might reveal the micro-mechanism of plastic pollution control by means of policy experiments. This could constitute future work.
In addition, only enterprises involved in the production and use of plastics were included in the consideration of enterprises, and the participation of the entire industry chain was not considered. Therefore, introducing the conditions of bounded rationality, constructing a more realistic dynamic game model that deals with the participation of enterprises and the public, and putting forward more meaningful opinions and suggestions for promoting plastic governance will be our next research directions.
Author Contributions
Conceptualization, C.O., H.J., Q.S. and G.L.; formal analysis, C.O., H.J., Q.S. and G.L.; investigation, C.O.; project administration, Q.S.; supervision, M.J.; visualization, C.O. and H.J.; writing—original draft, C.O., H.J., Q.S. and G.L. All authors have read and agreed to the published version of the manuscript.
Funding
This research received no external funding.
Informed Consent Statement
Not applicable.
Data Availability Statement
Data sharing not applicable.
Acknowledgments
The authors extend their appreciation to Huimin Lin for her assistance in editing the English grammar and phrasing in this paper.
Conflicts of Interest
The authors declare no conflict of interest.
Appendix A
The Jacobian matrix in the establishment of the tripartite evolutionary game model of the main text is as follows:
It can be simplified as:
Appendix B
Under the assumption of , , the stability of each equilibrium point discussed is judged in the eight cases according to the eigenvalues of the corresponding Jacobian matrix. The results are shown in the following table.
Table A1.
The symbol judgment to the eigenvalues of the Jacobian matrix corresponding to each balance point.
Table A1.
The symbol judgment to the eigenvalues of the Jacobian matrix corresponding to each balance point.
| Equilibrium Points | Case 1-1 | Case 1-2 | Case 2-1 | Case 2-2 | Case 3-1 | Case 3-2 | Case 4-1 | Case 4-2 |
|---|---|---|---|---|---|---|---|---|
| There are eigenvalues with different signs. | ||||||||
In the table above, “+” indicates that the eigenvalue is positive, while “−” means that the eigenvalue is negative.
References
- Hahladakis, J.N.; Velis, C.A.; Weber, R.; Iacovidou, E.; Purnell, P. An overview of chemical additives present in plastics: Migration, release, fate and environmental impact during their use, disposal and recycling. J. Hazard. Mater. 2018, 344, 179–199. [Google Scholar] [CrossRef] [PubMed]
- Organization for Economic Co-Operation and Development (OCDE). OCDE Statistics. Available online: https://stats.oecd.org/Index.aspx? (accessed on 6 December 2021).
- Plastics Europe. Plastics—The Facts 2019: An Analysis of European Plastics Production, Demand and Waste Data; Plastics Europe: Brussels, Belgium, 2019. [Google Scholar]
- Chen, Y.; Awasthi, A.K.; Wei, F.; Tan, Q.; Li, J. Single-use plastics: Production, usage, disposal, and adverse impacts. Sci. Total Environ. 2020, 752, 141772. [Google Scholar] [CrossRef] [PubMed]
- Jambeck, J.R.; Geyer, R.; Wilcox, C.; Siegler, T.R.; Perryman, M.; Andrady, A.; Narayan, R.; Law, K.L. Plastic waste inputs from land into the ocean. Science 2015, 347, 768–771. [Google Scholar] [CrossRef] [PubMed]
- Shen, M.; Huang, W.; Chen, M.; Song, B.; Zhang, Y. (Micro)plastic crisis: Un-ignorable contribution to global greenhouse gas emissions and climate change. J. Clean. Prod. 2020, 254, 120138. [Google Scholar] [CrossRef]
- Jjk, A.; Yvf, A.; Rrt, B.; Tan, R. Minimising the present and future plastic waste, energy and environmental footprints related to COVID-19. Renew. Sustain. Energy Rev. 2020, 127, 109883. [Google Scholar]
- Wagner, T.P. Reducing single-use plastic shopping bags in the USA. Waste Manag. 2017, 70, 3–12. [Google Scholar] [CrossRef]
- CIEL. Plastic & Health: The Hidden Costs of a Plastic Planet; Center for International Environmental Law Technical Report. 2019. Available online: https://www.ciel.org/wp-content/uploads/2019/05/Plastic-and-Climate-FINAL-2019.pdf (accessed on 6 December 2021).
- Schnurr, R.E.J.; Alboiu, V.; Chaudhary, M.; Corbett, R.A.; Quanz, M.E.; Sankar, K.; Srain, H.S.; Thavarajah, V.; Xanthos, D.; Walker, T.R. Reducing marine pollution from single-use plastics (SUPs): A review. Mar. Pollut. Bull. 2018, 137, 157–171. [Google Scholar] [CrossRef]
- Xanthos, D.; Walker, T.R. International policies to reduce plastic marine pollution from single-use plastics (plastic bags and microbeads): A review. Mar. Pollut. Bull. 2017, 118, 17–26. [Google Scholar] [CrossRef]
- Prata, C.J.; Silva, A.L.P.; da Costa, J.P.; Mouneyrac, C.; Walker, T.R.; Duarte, A.C.; Rocha-Santos, T. Solutions and Integrated Strategies for the Control and Mitigation of Plastic and Microplastic Pollution. Int. J. Environ. Res. Public Health 2019, 16, 2411. [Google Scholar] [CrossRef] [Green Version]
- Pani, S.K.; Pathak, A.A. Managing plastic packaging waste in emerging economies: The case of EPR in India. J. Environ. Manag. 2021, 288, 112405. [Google Scholar] [CrossRef]
- Li, C.; Sun, M.; Xu, X.; Zhang, L. Characteristics and influencing factors of mulch film use for pollution control in China: Microcosmic evidence from smallholder farmers. Res. Conserv. Recycl. 2021, 164, 105222. [Google Scholar] [CrossRef]
- Mederake, L.; Knoblauch, D. Shaping EU Plastic Policies: The Role of Public Health vs. Environmental Arguments. Int. J. Environ. Res. Public Health 2019, 16, 3928. [Google Scholar] [CrossRef] [Green Version]
- De Lucia, C.; Pazienza, P. Market-based tools for a plastic waste reduction policy in agriculture: A case study in the south of Italy. J. Environ. Manag. 2019, 250, 109468. [Google Scholar] [CrossRef]
- Gilli, M.; Nicolli, F.; Farinelli, P. Behavioural attitudes towards waste prevention and recycling. Ecol. Econ. 2018, 154, 294–305. [Google Scholar] [CrossRef]
- Lazarevic, D.; Aoustin, E.; Buclet, N.; Brandt, N. Plastic waste management in the context of a European recycling society: Comparing results and uncertainties in a life cycle perspective. Resour. Conserv. Recycl. 2010, 55, 246–259. [Google Scholar] [CrossRef]
- Viera, J.; Marques, M.; Nazareth, C.; Jimenez, P.C.; Castro, I.B. On replacing single-use plastic with so-called biodegradable ones: The case with straws. Environ. Sci. Policy 2020, 106, 177. [Google Scholar] [CrossRef]
- Taylor, R. Bag leakage: The effect of disposable carryout bag regulations on unregulated bags. J. Environ. Econ. Manag. 2019, 93, 254–271. [Google Scholar] [CrossRef]
- Macintosh, A.; Simpson, A.; Neeman, T.; Dickson, K. Plastic bag bans: Lessons from the Australian Capital Territory. Resour. Conserv. Recycl. 2020, 154, 104638. [Google Scholar] [CrossRef]
- Taylor, R.; Villas-Boas, S.B. Bans vs. Fees: Disposable Carryout Bag Policies and Bag Usage. In Proceedings of the AAEA & WAEA Joint Meeting, San Francisco, CA, USA, 26–28 July 2015. [Google Scholar]
- Aumann, R.J. Presidential address. Games Econ. Behav. 2003, 45, 2–14. [Google Scholar] [CrossRef]
- Zhao, R.; Neighbour, G.; Han, J.; McGuire, M.; Deutz, P. Using game theory to describe strategy selection for environmental risk and carbon emissions reduction in the green supply chain. J. Loss Prev. Process Ind. 2012, 25, 927–936. [Google Scholar] [CrossRef]
- Hafezalkotob, A. Competition of two green and regular supply chains under environmental protection and revenue seeking policies of government. Comput. Ind. Eng. 2015, 82, 103–114. [Google Scholar] [CrossRef]
- Ciardiello, F.; Genovese, A.; Simpson, A. Pollution responsibility allocation in supply networks: A game-theoretic approach and a case study. Int. J. Prod. Econ. 2018, 217, 211–217. [Google Scholar] [CrossRef] [Green Version]
- Wang, C.; Wang, W.; Huang, R. Supply chain enterprise operations and government carbon tax decisions considering carbon emissions. J. Clean. Prod. 2017, 152, 271–280. [Google Scholar] [CrossRef]
- Madani, S.R.; Rasti-Barzoki, M. Sustainable supply chain management with pricing, greening and governmental tariffs determining strategies: A game-theoretic approach. Comput. Ind. Eng. 2017, 105, 287–298. [Google Scholar] [CrossRef]
- Yang, L.; Zhang, Q.; Ji, J. Pricing and carbon emission reduction decisions in supply chains with vertical and horizontal cooperation. Int. J. Prod. Econ. 2017, 191, 286–297. [Google Scholar] [CrossRef]
- Du, S.; Zhu, J.; Jiao, H.; Ye, W. Game-theoretical analysis for supply chain with consumer preference to low carbon. Int. J. Prod. Res. 2014, 53, 3753–3768. [Google Scholar] [CrossRef]
- Bertinelli, L.; Camacho, C.; Zou, B. Carbon capture and storage and transboundary pollution: A differential game approach. Eur. J. Oper. Res. 2014, 237, 721–728. [Google Scholar] [CrossRef]
- Huang, X.; He, P.; Zhang, W. A cooperative differential game of transboundary industrial pollution between two regions. J. Clean. Prod. 2016, 120, 43–52. [Google Scholar] [CrossRef]
- Yeung DW, K.; Petrosyan, L.A. A cooperative stochastic differential game of transboundary industrial pollution. Automatica 2008, 44, 1532–1544. [Google Scholar] [CrossRef]
- Jamali, M.-B.; Rasti-Barzoki, M. A game theoretic approach for green and non-green product pricing in chain-to-chain competitive sustainable and regular dual-channel supply chains. J. Clean. Prod. 2018, 170, 1029–1043. [Google Scholar] [CrossRef]
- Taylor, P.D.; Jonker, L.B. Evolutionary stable strategies and game dynamics. Math. Biosci. 1978, 40, 145–156. [Google Scholar] [CrossRef]
- Babu, S.; Mohan, U. An integrated approach to evaluating sustainability in supply chains using evolutionary game theory. Comput. Oper. Res. 2018, 89, 269–283. [Google Scholar] [CrossRef]
- Wang, Z.; Wang, Q.; Chen, B.; Wang, Y. Evolutionary game analysis on behavioral strategies of multiple stakeholders in E-waste recycling industry. Resour. Conserv. Recycl. 2020, 155, 104618. [Google Scholar] [CrossRef]
- Friedman, R.S.; Guerrero, A.M.; McAllister, R.R.J.; Rhodes, J.R.; Santika, T.; Budiharta, S.; Wilson, K.A. Beyond the community in participatory forest management: A governance network perspective. Land Use Policy 2020, 97, 104738. [Google Scholar] [CrossRef]
- Xu, R.; Wang, Y.; Wang, W.; Ding, Y. Evolutionary game analysis for third-party governance of environmental pollution. J. Ambient Intell. Humaniz. Comput. 2018, 12, 474. [Google Scholar] [CrossRef]
- Wang, C.; Shi, F. An Evolutionary Game Model for Industrial Pollution Management under Two Punishment Mechanisms. Int. J. Environ. Res. Public Health 2019, 16, 2775. [Google Scholar] [CrossRef] [Green Version]
- Js, A.; Wz, B.; Bz, B. The coordination of stakeholder interests in environmental regulation: Lessons from China’s environmental regulation policies from the perspective of the evolutionary game theory. J. Clean. Prod. 2020, 249, 119385. [Google Scholar]
- Chen, W.; Hu, Z.-H. Using evolutionary game theory to study governments and manufacturers’ behavioral strategies under various carbon taxes and subsidies. J. Clean. Prod. 2018, 201, 123–141. [Google Scholar] [CrossRef]
- Tu, Y.; Peng, B.; Wei, G.; Wu, W. EPR System Participants’ Behavior: Evolutionary Game and Strategy Simulation. J. Clean. Prod. 2020, 271, 122659. [Google Scholar] [CrossRef]
- Wang, Z.; Huo, J.; Duan, Y. The impact of government incentives and penalties on willingness to recycle plastic waste: An evolutionary game theory perspective. Front. Environ. Sci. Eng. 2020, 14, 173–184. [Google Scholar] [CrossRef]
- Gao, S.; Ling, S.; Liu, X.; Dou, X.; Wu, R. Understanding local government’s information disclosure in China’s environmental project construction from the dual-pressure perspective. J. Clean. Prod. 2020, 263, 121311. [Google Scholar] [CrossRef]
- Jiang, K.; You, D.; Merrill, R.; Li, Z. Implementation of a multi-agent environmental regulation strategy under Chinese fiscal decentralization: An evolutionary game theoretical approach. J. Clean. Prod. 2019, 214, 902–915. [Google Scholar] [CrossRef]
- Tian, Y.; Govindan, K.; Zhu, Q. A system dynamics model based on evolutionary game theory for green supply chain management diffusion among Chinese manufacturers. J. Clean. Prod. 2014, 80, 96–105. [Google Scholar] [CrossRef]
- Yin, S.; Zhang, N.; Li, B.; Dong, H. Enhancing the effectiveness of multi-agent cooperation for green manufacturing: Dynamic co-evolution mechanism of a green technology innovation system based on the innovation value chain. Environ. Impact Assess. Rev. 2021, 86, 106475. [Google Scholar] [CrossRef]
- Cui, M. A Tripartite Evolutionary Game Analysis of Environmental Credit Supervision under the Background of Cooperative Governance. Syst. Eng. Theory Pract. 2021, 3, 1–21. [Google Scholar]
- Liang, Y.R.; Liu, Y.Q. The evolutionary game and stability analysis of medical protective equipment market supervision under the COVID-19 epidemic. China Manag. Sci. 2021, 5, 1–11. [Google Scholar]
- Feng, L.P.; Qian, C.L.; Pang, Q.H.; Cheng, T.J. Analysis on the timing of government intervention in network public opinion in emergencies based on the tripartite game model. Inform. Theory Pract. 2021, 5, 1–14. [Google Scholar]
- Xu, X.Y.; Yang, Y. Research on the Tripartite Evolutionary Game of the Road-rail Combined Transport System under the Domination of the Government. Transp. Syst. Eng. Inf. 2021, 21, 7–15. [Google Scholar]
- Wu, J.M.; Tang, X.; Sheng, Y.X.; Wei, X.Z.; Mao, X.Y. Research on the Government-Industry-University Collaborative Innovation Mechanism of New Energy Vehicles in the Post-Subsidy Era Based on the Tripartite Evolutionary Game. Oper. Res. Manag. 2021, 30, 96–102. [Google Scholar]
- Hu, R.; Tong, H.J. Jurisprudence Thinking of “Plastic Restriction”. Ecol. Econ. 2011, 3, 180–183. [Google Scholar]
- Fonoberova, M.; Fonoberov, V.A.; Mezić, I. Global sensitivity/uncertainty analysis for agent-based models. Reliab. Eng. Syst. Saf. 2013, 118, 8–17. [Google Scholar] [CrossRef]


Publisher’s Note: MDPI stays neutral with regard to jurisdictional claims in published maps and institutional affiliations. |
© 2022 by the authors. Licensee MDPI, Basel, Switzerland. This article is an open access article distributed under the terms and conditions of the Creative Commons Attribution (CC BY) license (https://creativecommons.org/licenses/by/4.0/).