Article

Carbon Emission Efficiency Network: Evolutionary Game and Sensitivity Analysis between Differentiated Efficiency Groups and Local Governments

1
China Aerospace Academy of Systems Science and Engineering, Beijing 100089, China
2
School of Civil and Architectural Engineering, Shandong University of Technology, Zibo 255000, China
3
Department of Environmental and Cultural Resources, National Tsing Hua University, Hsinchu 300044, Taiwan
4
School of Management, Shandong University of Technology, Zibo 255000, China
5
School of Academy of Fine Arts, Shandong University of Technology, Zibo 255000, China
*
Author to whom correspondence should be addressed.
Sustainability 2022, 14(4), 2191; https://doi.org/10.3390/su14042191
Submission received: 18 January 2022 / Revised: 7 February 2022 / Accepted: 9 February 2022 / Published: 15 February 2022
(This article belongs to the Special Issue Construction Project and Management in Smart Cities)

Abstract

:
With its proposal of the “double carbon” (peak carbon dioxide emissions and carbon neutralization) goal, China has entered a new stage in creating an ecological civilization and achieving sustainable development. Based on the formation and evolution mechanism of the carbon emission efficiency network, in this study, a trilateral evolutionary game model—including efficiency groups (high- and low-efficiency groups) and local governments—was constructed, in an attempt to discuss the conditions needed for different players and trilateral interconnected systems to implement balanced and stable strategies. Furthermore, the sensitivity of the participants’ evolutionary trajectories toward factors such as the initial strategy ratio, transition cost, and network capital were tested via a system simulation. The main conclusions were as follows: (1) Efficiency groups form a virtuous circle when the initial proportion of the participants’ strategies reaches a certain threshold, and converge into a stable “win–win” state. Under these circumstances, high-efficiency groups tend to give full play to their efficiency advantages in terms of carbon emission reduction and green development, while low-efficiency groups tend to choose green transformation and accept the spillover effect from high-efficiency groups. (2) When efficiency groups achieve a “win–win” state or form good self-management, local governments move from active supervision to a passive supervision strategy in order to reduce supervision costs. (3) While different initial strategy proportions do not affect the stable convergence point of the evolutionary system, they have a differentiated impact on the convergence speed of the players. Under the condition of a low initial strategy ratio, transformation costs can reduce the green transformation enthusiasm of inefficient groups, while network capital can enhance the green transformation willingness of inefficient groups.

1. Introduction

Climate warming is an unavoidable, realistic problem faced by all countries [1]. At the 75th UN General Assembly in 2020, China solemnly promised that its carbon emissions would reach their peak by 2030, and that it would subsequently achieve carbon neutrality (the “double carbon” goal) by 2060 [2,3]. The proposal of this “double carbon” goal indicates that China will fully enter a new stage of green, low-carbon, and sustainable development. China’s high carbon emissions can be attributed mainly to its manufacturing-oriented economic structure. According to China’s statistics, its carbon emissions reached 9621.119 Mt in 2020, which is a 78.13% increase compared with 2005. Non-metal mineral products, the smelting and pressing of ferrous metals, the production and supply of electric power, and steam and hot water production account for more than 70% of the total carbon emissions [4,5]. However, carbon emission control is no longer a simple environmental problem, but has become a comprehensive problem that involves several factors, such as the economy, ecology, society, and various systems [6]. From a system science perspective, it is necessary to coordinate the superior resources of all parties, and to explore the convergence of multi-party carbon emission control, which is necessary for the realization of the optimal global goal of low-carbon economies, a green environment, and social sustainability.
Improving carbon emission efficiency and accelerating green and low-carbon technological innovations have become the key paths to achieving carbon emission control [7]. As an effective measure of the potential for regional carbon emission reduction, carbon emission efficiency represents the intensity of carbon emissions at certain levels of economic development and economic efficiency under the constraint of carbon emission reduction [8]. With the increasing complexity of regional trade, the concepts of carbon footprints, carbon transfer, and carbon leakage add new attributes to the carbon emission efficiency measure, i.e., the regional relevance of carbon emission efficiency, leading to the conceptualization of the carbon emission efficiency network [9,10]. The carbon emission efficiency network describes the intrinsic correlation characteristics of carbon emissions among different nodes, and reveals the hierarchical structure and self-organization of various network groups [11]. The evolutionary game among network groups has become a main driver of the sustainable development of carbon emission networks [12,13,14]. Therefore, identifying the evolutionary game relationship between different network groups is of great significance to the expansion and development of the carbon emission efficiency network; however, research regarding this issue has been limited.
The main contribution of this study is the investigation of the evolutionary game choices of different efficiency groups and local governments under different strategy combinations in the carbon emission efficiency network. This study is unique in that it includes local governments in the category of evolutionary game participants. Additionally, it examines the evolutionary game selection and stability of different efficiency groups under local governments’ active and passive regulatory strategies. Furthermore, this study elaborates upon the formation mechanism of the carbon emission efficiency network, introducing the concept of network capital in the construction of the tripartite players’ payment matrix, and incorporates the carbon emission efficiency network into the evolutionary game model as a quantifiable “benefit”, thus revealing the two-way influence of evolutionary game selection and the network evolution of different efficiency groups at the relational level.

2. Literature Review

Carbon emission control is an important aspect of accelerating economic green transformation and realizing sustainable development in China, and it has attracted the attention of scholars in various fields. This study primarily examines existing research in the areas of carbon emissions and carbon emission efficiency, carbon emission reduction, the marketization of energy-use rights, and carbon emission rights.

2.1. Carbon Emission and Carbon Emission Efficiency

After Kaya proposed the concept of carbon production efficiency in 1993, other concepts, such as the carbonization index and carbon emission intensity, were developed [15]. However, this single-factor representation based on the ratio of total carbon emissions to other economic indicators ignored the key premise that carbon emissions are generated by multiple sources, such as the economy, society, and ecology [16,17]. Carbon emission efficiency reveals the optimal degree of the resource allocation of inputs and outputs from the perspective of the total factors [15], with good comprehensiveness and integration. China’s carbon emission efficiency indicates the presence of strong regional heterogeneity. Regions with a high level of economic development often utilize better emission reduction strategies or more advanced low-carbon technologies to achieve higher carbon emission efficiency [18,19,20]. However, areas dominated by traditional manufacturing industries fall under the “Matthew Effect” due to their heavy coal-energy consumption and insufficient levels of low-carbon technology. In other words, it is difficult for these regions to improve their carbon emission efficiency through their own development, because they are usually at the end of the industrial value chain, exhibiting the characteristics of the “low-end locking” of manufactured goods and a high-carbon economy [21].

2.2. Carbon Emission Reduction

The sustained growth of carbon emissions can be attributed mainly to energy intensity; however, the energy consumption structure, dominated by coal and oil, is not likely to change in the near future [6,22,23]. Additionally, continual urbanization has led to an increase in the “high carbonization” characteristics of population agglomeration and transportation, as well as the diversified development of various high-carbon-emission sources [24]. For example, large data centers and 5G base stations, which primarily consume electricity, have also become potential high-carbon sources. Thus, high emissions and multiple carbon sources have become the new factors affecting carbon emission reduction. The natural carbon sequestration capability of forests, grasslands, and other green vegetation has made increasing the green cover of areas one of the most important propositions for carbon emission control. However, the low-efficiency and long-term nature of natural carbon sequestration means that the negative growth of carbon emissions cannot be achieved solely by relying on green vegetation. Moreover, the high cost and technical bottlenecks involved in artificial carbon sequestration make it impossible to implement on a large scale [25]. Therefore, transforming energy utilization modes, improving energy utilization efficiency, and increasing the use of clean energy through low-carbon technological innovations have become new governance methods for achieving carbon emission reduction [26]. However, the low-carbon technological innovation process has the characteristics of long cycles with high investment and high risk [27]. Thus, perfecting and standardizing the technology trading market for low-carbon living and accelerating its connection with the carbon trading market will become the focus of carbon emission reduction measures in the future [28]. Based on the above analysis, we believe that carbon emission control should follow the governance idea of realizing peak emissions first, and then realizing carbon neutralization [29]. The logical explanation is that carbon emissions gradually decrease due to industrial green transformation, forcing the total carbon emissions to gradually reach their predetermined peak; Subsequently, carbon emissions and absorption can be offset by carbon sink technology breakthroughs and the natural carbon sinks of green vegetation [30]. At present, the focus of carbon emission control is on the reduction of emissions from the source; However, not enough attention has been paid to carbon collection at the end, which also means that carbon emission reduction control will be a long transition process.

2.3. The Marketization of Energy Use Rights and Carbon Emission Rights

Carbon emission trading is a beneficial attempt by China to establish a market-oriented governance system for carbon emission reduction. To this end, seven carbon emission trading pilots—represented by Beijing, Shanghai, and Tianjin—have been formed. The stable operation of China’s carbon-emission-trading pilots provides countries around the world with the experience and reference material required for carbon emission governance [31]. Although the carbon emission rights trading pilots have achieved remarkable results, these programs are still in their early stages in terms of market maturity, price mechanisms, trading system improvement, and legal protections [32]. One of the key problems faced in emission reduction governance modes dominated by carbon emission rights trading is the way in which to establish a complete set of initial carbon emission reduction quota allocation schemes on the premise of fairness, effectiveness, and rationality [33]. However, it is still controversial whether the allocation standard is the total amount of carbon emissions or the total amount of carbon emission reduction [34]. The initial quota scheme is directly related to the effectiveness of emission reduction governance. Thus, it is necessary to consider various reasons, such as the potential of carbon emission reduction, economic scale, and carbon emission intensity, as well as the main factors that lead to differences in the carbon emissions among regions, especially the reality of uneven regional development in China, which further restricts the formulation of carbon emission reduction schemes [35]. Based on the population and GDP, it is possible to provide basic suggestions for the formulation of carbon emission reduction schemes; however, there are often problems of poor operability and deviation from reality. Another key issue is constructing the carbon emission rights trading institutional system, including price regulation, legal protection, monitoring and early warnings, etc., to encourage and cultivate leading enterprises to play an exemplary role in carbon emissions trading, and to ensure market stability and the effectiveness of the emissions reduction.
Similarly to carbon emission rights, it is also important to consider the market-based transaction of energy use rights [36]. Energy use rights refer to the allocation of a certain amount of the energy usage quota for industries or enterprises whose energy consumption reaches a certain standard, which can then be traded in the market just like carbon emission rights. The concept of energy use rights was first introduced in the 2016 National Development and Reform Commission’s “Pilot Program for Paid Use and Trading System of Energy Use Right”, with Sichuan, Zhejiang, Fujian, and Henan becoming the first batch of pilot provinces for energy use right trading [27]. Carbon emissions and energy use rights are both concerned with the marketization of carbon emissions reduction; however, the difference between the two is that energy constraints focus on the potential carbon emissions from the input perspective, while carbon emissions focus on the output [37,38]. The current study suggests that the goal consistency of energy use and carbon emission use rights indicates that these rights have a high degree of synergy in market-oriented governance. The market-oriented integration of energy use and carbon emission rights will generate new governance methods to solve the dilemma of carbon emission reduction.
In summary, previous research on carbon emissions is predominantly focused on the exploration of carbon emission reduction methods and the discussion of the carbon trading market system, providing theoretical guidance and a reference basis for carbon emission governance and regulation. However, more research on the carbon emission network is needed. Inter-regional trade is a necessary condition for the formation of the carbon emission network. Trade agglomeration and regional similarity promote the emergence of network groups, and the evolutionary game between these groups is closely related to the expansion of the carbon emission efficiency network. Therefore, this study explores the stability conditions of the tripartite evolutionary game of various carbon emission efficiency groups under different regulatory strategies, tests the robustness of the evolutionary game model through system simulation in a multi-situation environment, and proposes targeted measures for carbon emission reduction and the evolution of the carbon emission efficiency network.

3. Methodology

3.1. Research Hypothesis

The carbon emission efficiency network aims to describe the internal impact correlation of carbon emission efficiency in different nodes (cities or provinces). Figure 1 shows the impact of the carbon emission efficiency within nodes, between groups, and among tripartite systems, including local governments [39]. Specifically, the carbon emission efficiency of the network nodes refers to the centralized embodiment of the additional carbon cost of economic growth under the influence of multi-dimensional factors, such as the economy, society, market, transportation, and regional networks [40], with nodes that have identical or similar performances forming a group. Groups reflect the hierarchical and differentiation characteristics of the carbon emission efficiency network. Based on the similarities between them, nodes can be divided into high-efficiency and low-efficiency groups, and the interaction between these groups further increases the complexity of the network’s structure. Under the policy pressure of local governments’ environmental regulations, high-efficiency groups often master more advanced green and low-carbon technologies, and develop efficient management and organization methods, which play a critical role in improving the carbon emission efficiency of low-efficiency groups [22]. The establishment of a low-carbon technology research institute and green industry alliance will not only enrich group cooperation but will also promote the flow of human capital, management experience, capital, and other elements within the carbon emission efficiency network. Additionally, China’s energy regulation strategy (west-to-east gas transmission, west-to-east power transmission, etc.) has played a significant role in alleviating the tension associated with regional energy consumption. However, this has also led to the alteration of regional energy consumption structures and the transfer of carbon emissions, which have laid the foundation for the formation of the carbon emission efficiency network and the emergence of differentiated groups in space. Interest relationships and preference attachment determine that carbon emission efficiency network nodes always have multi-party relationships with other nodes. This “relationship” is the fundamental medium for material, energy, and information exchange between nodes. The more “relationships” the nodes have, the stronger their ability to control resources in the network, resulting in a more significant and positive effect on the increase of carbon emission efficiency. The essence of the development of the carbon emission efficiency network is the establishment of new “relationships” and the competition of old “relationships”. Therefore, relationship ownership in the carbon emission efficiency network is known as “network capital”, which describes the ability of a node to obtain resources in the network. It is the common embodiment of characteristic indicators such as the degree, link symmetry, and node efficiency.
The formation and evolution of the carbon emission efficiency network is the concentrated expression of different game strategy combinations among efficiency groups, and its development law is in line with the basic idea of the evolutionary game model [30]. The evolutionary game model is widely used in ecological governance, decision analysis, and other fields. The advantages of this model are that it reveals the process through which different groups reach a stable state in long-term competition from a dynamic perspective, and that it places more emphasis on the limited rationality of game participants. This study views the local government group as a new game participant in the basic model, and it constructs a trilateral evolutionary game model that includes a high-efficiency group, a low-efficiency group, and a local government group [41]. The rationality of this approach lies in the leading position of local governments in China’s ecological governance [42]. Under China’s administrative system, local governments are regulators and participants in carbon emission control. Through the market-oriented trading of energy use and carbon emission rights, or through mandatory environmental regulations, industrial enterprises are guided to realize carbon emission reduction by minimizing marginal costs. The regulatory means and strategies of local governments are closely related to the strategic choices of industrial enterprises. Therefore, the benefits and convergence results of different strategy combinations of game participants are uncertain. Thus, this study developed the following hypotheses to discuss the evolutionary game process between local government groups and different efficiency groups.
Hypothesis 1.
Each game participant does not fully grasp all of the decision-making information of other players, and has limited rationality. In other words, the player cannot determine the optimal strategy through one choice, but can gradually identify the optimal strategy through repeated trial and error.
Hypothesis 2.
The spillover effect of high-efficiency groups will bring technical and talent support to low-efficiency groups so as to reduce the time and cost of green transformation. Additionally, the benefits of efficiency spillover and green transformation are greater than the costs.
Hypothesis 3.
Network capital is directly related to the player choice. When efficiency degrades or remains unchanged, there is a certain probability of losing network capital.

3.2. Model Derivation

The efficiency groups (the high- and low-efficiency groups) and the local government are all participants in the evolutionary game, and have an independent game space. Because the high-efficiency group has efficiency advantages in the carbon emission efficiency network, its strategy choice can be to give full play to its own advantages in order to drive the development of the low-efficiency group, or to maintain the status quo. The policy space of the high-efficiency group is {efficiency all spill over, efficiency does not overflow} ( E A S , E D S ). We set the proportion of players who chose the E A S strategy as x and the proportion of players who chose the E D S strategy as 1 x . For low-efficiency groups, under the dual effects of local government pressure and their own development needs, their strategic choice can be green transformation or maintaining the status quo. The strategic space is {green transformation, maintaining the status quo} ( G T F , M S Q ). Assuming that the proportion of players who choose the G T F strategy is y and the proportion of players who choose another strategy is 1 y , the strategic choice of local governments is affected by the superior government and the supervision cost. Its strategic space is {active supervision, passive supervision} ( A S , P S ). Assuming that the proportion of local governments that choose the active supervision strategy is z , the proportion of passive supervision strategy is 1 z . Obviously, game participants recieve different benefits under different strategy choices. In order to facilitate the subsequent analysis, Table 1 exhibits the relevant parameters affecting the benefits of each game participant. In the process of parameter setting, we considered the influence of other participants’ behavior choices on their own interests, which is very important for the analysis of the behaviors of different groups in the carbon emission network. When high-efficiency groups choose E A S strategies, they will incur costs such as manpower and infrastructure costs ( N , M , etc.), but at the same time, they will also gain development space among low-efficiency groups and resources in the carbon emission network ( Q ). For low-efficiency groups, the spillover effect of high-efficiency groups reduces the risk and cost of realizing green transformation ( S , C , etc.), and the institutional duplication of local governments will be alleviated, saving financial expenditure ( L , J , etc.).
According to the above assumptions and parameter settings, Table 2 shows the payment matrix of each game participant under different strategy combinations.

4. Results and Discussion

4.1. Stability Strategy Analysis of the Trilateral Evolutionary Game

4.1.1. Stability Condition of the High-efficiency Group Strategy

This study assumes that the expected benefit of a high-efficiency group in choosing strategy E A S is U 11 , the expected benefit under strategy E D S is U 12 , and their average benefit is U a v e . Next, Equations (1)–(3) can be obtained as follows:
U 11 = y z ( C h + Q + M N ) + y ( 1 z ) ( C h + Q + M N ) + ( 1 y ) z ( C h + Q ) + ( 1 y ) ( 1 z ) ( C h + Q )
U 12 = y z ( C h P Q ) + y ( 1 z ) ( C h Q ) + ( 1 y ) z ( C h P Q ) + ( 1 y ) ( 1 z ) ( C h Q )
U a v e = x U 11 + ( 1 x ) U 12
The evolutionary game view holds that when some members of the group choose a strategy and the benefit is higher than the average benefit level, other groups have a greater probability to choose the same strategy. In other words, the proportion of dominant strategies will continue to accumulate in the group evolution, and finally all of the game participants will be inclined toward a certain stability strategy, which is called the evolutionary stability strategy. This process can be described by a replicated dynamic equation, which is a dynamic differential equation regarding time (t). Equation (4) shows the replication dynamic equation of the high-efficiency group.
U ( x ) = d x d t = x ( U 11 U a v e ) = x ( 1 x ) [ 2 Q + y ( M N ) + z P ]
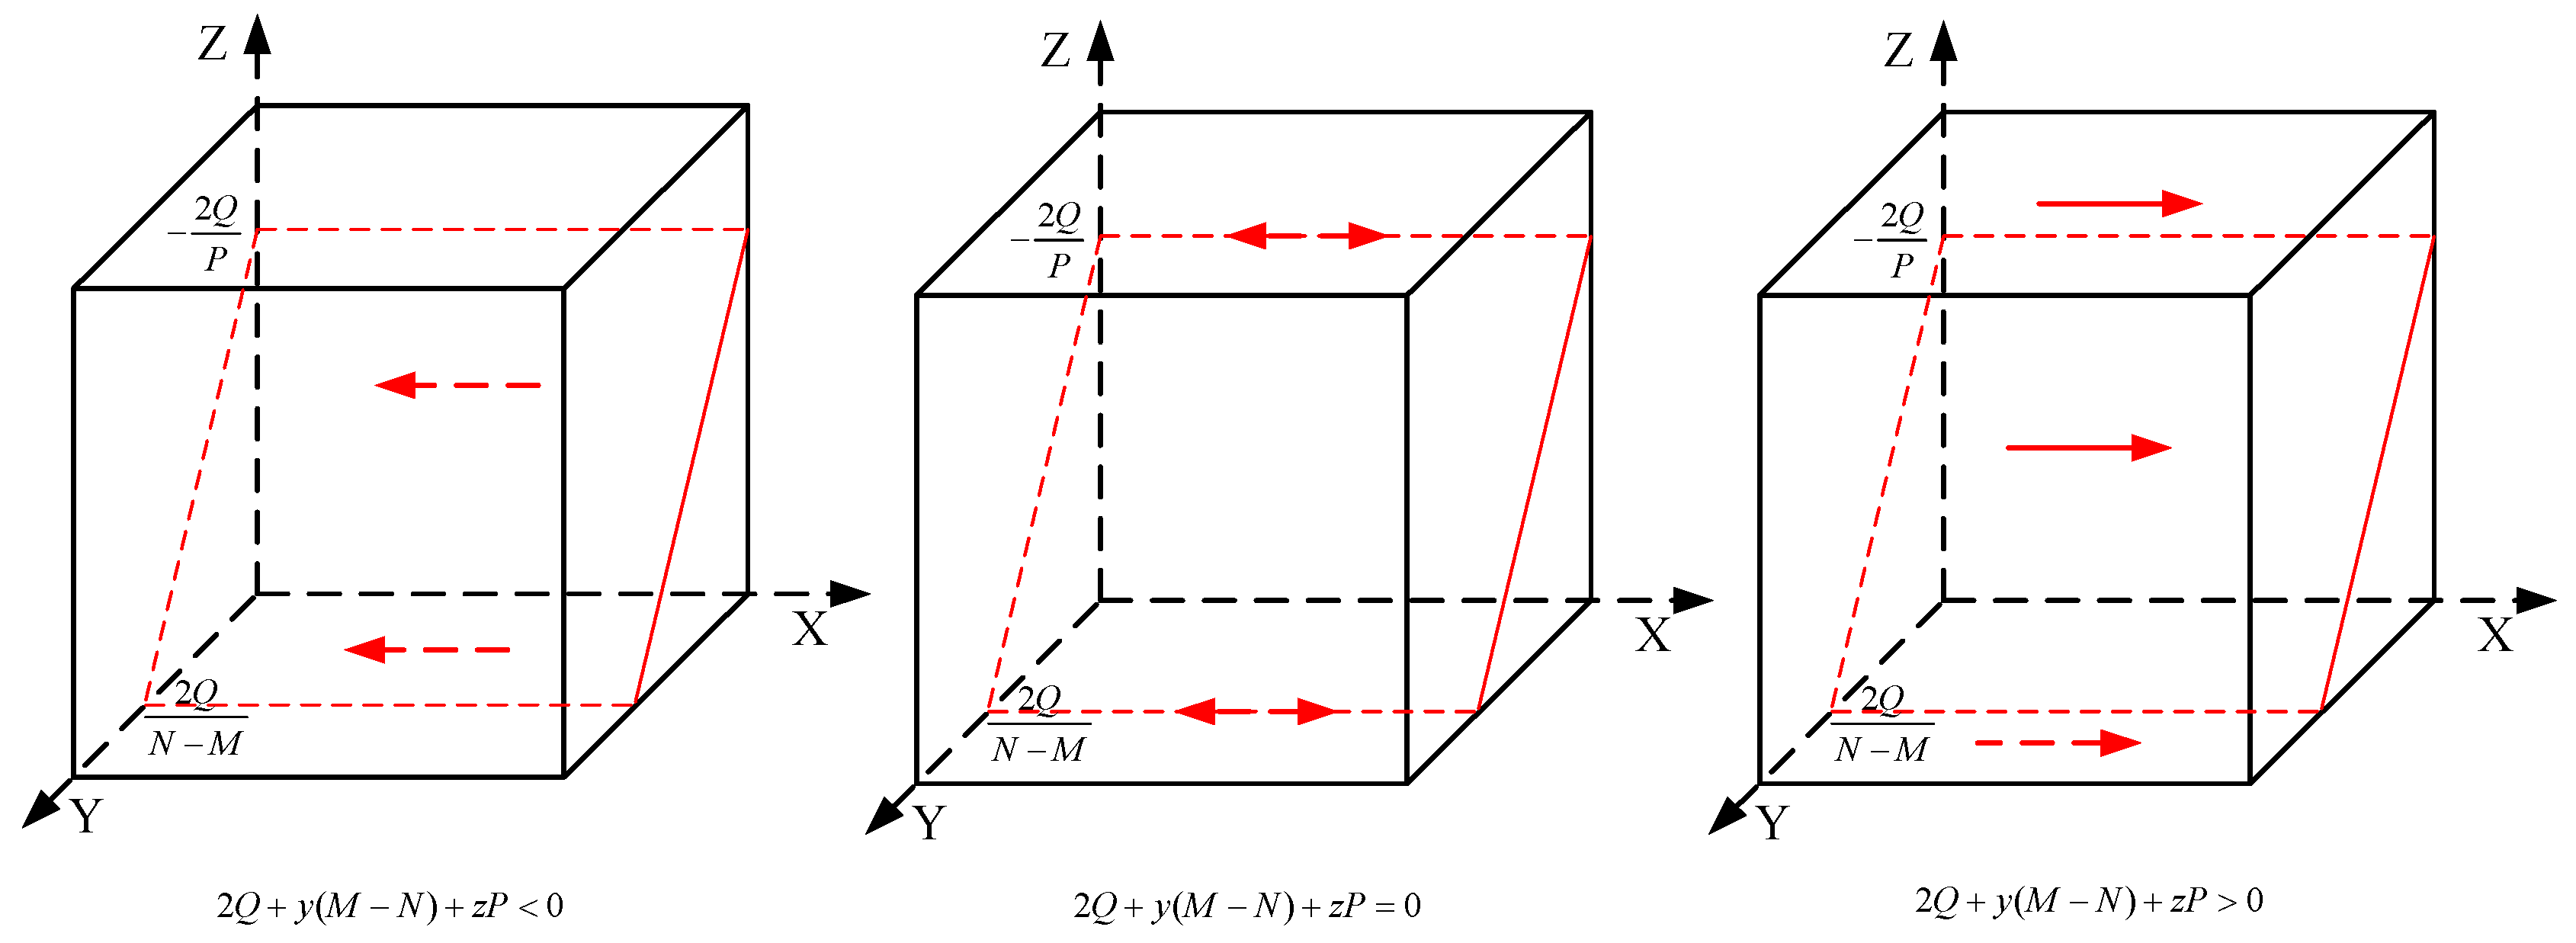
The conditions for the existence of a stable strategy for replicated dynamic differential equations are U ( x ) = 0 and U ( x ) < 0 . For U ( x ) = 0 , there are two possible stabilization strategies, x * = 1 and x * = 0 , which become stabilization strategies depending on whether y and z can satisfy Equation (5). Figure 2 shows the phase diagram of the evolution of high-efficiency groups in different situations.
U ( x ) = ( 1 2 x ) [ 2 Q + ( M N ) y + z P ] < 0
Scenario1: When y = z P + 2 Q N M and z = y ( N M ) 2 Q P , the high-efficiency group’s evolution game space lies on the plane comprising y = P N M z + 2 Q N M . Regardless of what value x takes, U ( x ) is equal to 0, indicating that the evolution of the high-efficiency group is not affected by the other players.
Scenario2: When y < z P + 2 Q N M and z < y ( N M ) 2 Q P , the game space is located below the plane formed by y = P N M z + 2 Q N M , there are U ( 1 ) > 0 , and U ( 0 ) < 0 and x = 0 become stability strategies. The practical significance of this result is that when the proportion of green transformation in low-efficiency groups and the proportion of local governments choosing active supervision are less than a certain threshold, the enthusiasm of high-efficiency groups to use the spillover effect will be reduced.
Scenario3: When y > z P + 2 Q N M and z > y ( N M ) 2 Q P , the game space is above the plane formed by y = P N M z + 2 Q N M , there are U ( 1 ) < 0 , and U ( 0 ) > 0 and x = 1 become the stability strategies through calculation. It can be inferred that the green transformation of low-efficiency groups provides development space for the efficiency spillover of high-efficiency groups, and the strategy choice of active supervision by local governments promotes the formation of a “win–win” development model among groups, such that the efficiency spillover becomes the stability strategy of the high-efficiency groups.

4.1.2. Stability Condition of the Low-Efficiency Group Strategy

Suppose that the expected benefit of the inefficient group under strategy G T F is V 11 , the expected benefit under strategy M S Q is V 12 , and the average benefit is V a v e . The specific function form is as follows:
V 11 = x z ( C l C + S + Q + R ) + x ( 1 z ) ( C l C + S + Q ) + ( 1 x ) z ( C l H + S + R + Q ) + ( 1 x ) ( 1 z ) ( C l H + S + Q )
V 12 = x z ( C l P Q ) + x ( 1 z ) ( C l Q ) + ( 1 x ) z ( C l P Q ) + ( 1 x ) ( 1 z ) ( C l Q )
V a v e = y V 11 + ( 1 y ) V 12
Based on Equations (6)–(8), Equation (9) shows the dynamic replication equation of low-efficiency groups.
V ( y ) = d y d t = y ( 1 y ) [ 2 Q H + S + x ( H C ) + z ( P + R ) ]
There are two possible equilibrium strategies in Equation (8), y * = 0 and y * = 1 , and the condition for them to become stable equilibrium strategies is Equation (10). Figure 3 shows the phase diagram of the low-efficiency groups in different contexts.
V ( y ) = d V ( y ) d t = ( 1 2 y ) [ 2 Q H + S + x ( H C ) + z ( P + R ) ] < 0
Scenario1: When x = H - S - 2 Q - z ( P + R ) H - C and z = H S 2 Q + x ( H C ) P + R , the game space of the low-efficiency group is located in the plane formed by z = H C P + R x + H S 2 Q p + R . The strategic choice of high-efficiency groups and local governments will not affect the evolution direction of low-efficiency groups.
Scenario2: When x < H S 2 Q z ( P + R ) H C and z < H S 2 Q + x ( H C ) P + R , the game strategy space of the low-efficiency group is located below the plane formed by z = H C P + R x + H S 2 Q P + R , and there are V ( 0 ) < 0 and V ( 1 ) > 0 . The results show that the evolutionary selection of the low-efficient group will eventually converge to y = 0 . In other words, all of the members of the low-efficient group give up the green transformation, which is obviously contrary to the expected result.
Scenario3: When x > H S 2 Q z ( P + R ) H C and z > H S 2 Q + x ( H C ) P + R , the game strategy space of the inefficient group is located in the upper region of the plane formed by z = H C P + R x + H S 2 Q P + R , and there are V ( 1 ) < 0 and V ( 0 ) > 0 . y = 1 becomes the strategy stability point of the inefficient group in this situation. When the probability of efficiency spillover in the high-efficiency groups and the probability of local government’s active supervision reach a certain threshold, respectively, it can effectively improve the enthusiasm of low-efficiency group members for green transformation. The realistic explanation is that the demonstration effect of high-efficiency groups and the increasing intensity of local governments’ active supervision force low-efficiency groups to undertake and realize green transformation.

4.1.3. Stability Condition of the Local Government’s Strategy

Assuming that the expected interest of local governments under the A S strategy is W 11 , the expected interest under a P S strategy is W 12 , while their average interest is W a v e ; the specific function form is as follows:
W 11 = x y ( L P J ) + x ( 1 y ) ( P L J ) + ( 1 x ) y ( P R L J ) + ( 1 x ) ( 1 y ) ( L + 2 P J )
W 12 = x y ( J ) + x ( 1 y ) ( J ) + ( 1 x ) y ( j ) + ( 1 x ) ( 1 y ) ( J )
W a v e = z W 11 + ( 1 z ) W 12
Equation (14) shows the replication dynamic equation of local government evolution, and the specific form is as follows:
W ( z ) = z ( z 1 ) [ x ( 2 L + P ) + y ( 2 L + R + P ) + x y ( P 2 L R ) 2 P L ]
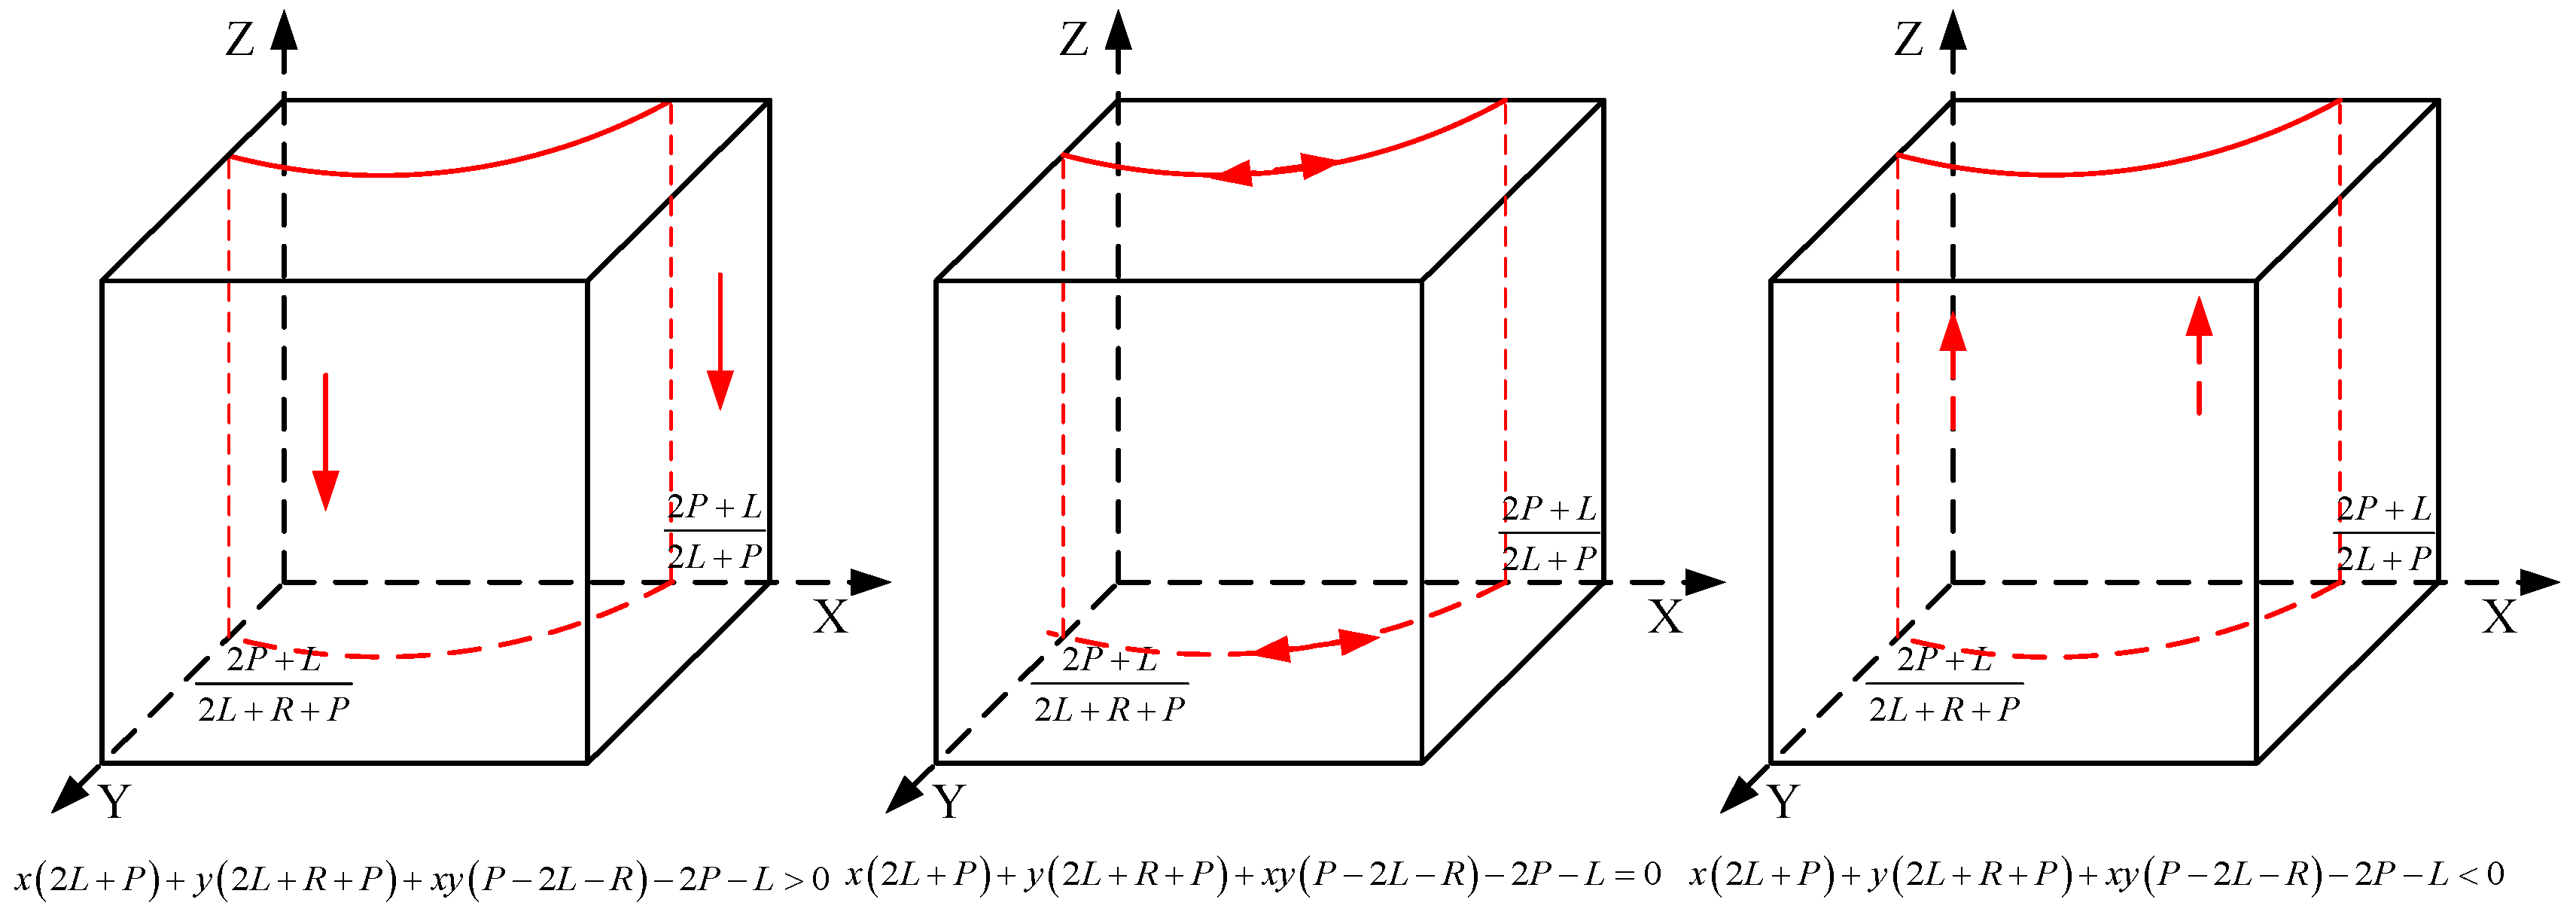
where z * = 0 and z * = 1 are two equilibrium strategies of Equation (14). The condition in which they become stable equilibrium strategies is satisfied in Equation (15). Figure 4 displays the evolution phase diagram of local government in different situations.
W ( z ) = d W ( z ) d t = ( 2 z 1 ) [ x ( 2 L + P ) + y ( 2 L + R + P ) + x y ( P 2 L R ) 2 P L ] < 0
Scenario1: When x = 2 P + L y ( 2 L + R + P ) 2 L + P + y ( P 2 L R ) and y = 2 P + L x ( 2 L + P ) 2 L + R + P + x ( P 2 L R ) , the game space of local government groups is located on the curved surface formed by y = 2 P + L x ( 2 L + P ) 2 L + R + P + x ( P 2 L R ) , which shows that the local government’s strategy choice is not influenced by the strategies of other game participants.
Scenario2: When x < 2 P + L y ( 2 L + R + P ) 2 L + P + y ( P 2 L R ) and y < 2 P + L x ( 2 L + P ) 2 L + R + P + x ( P 2 L R ) , the local government’s game space is located on the side of the curved surface near the z axis, and converges to z = 1 . The result shows that when the probability of the high-efficiency group choosing the efficiency spillover strategy and the probability of the low-efficiency group choosing the green transformation strategy are less than a certain threshold, local governments will tend to choose an active supervision strategy.
Scenario3: When x > 2 P + L y ( 2 L + R + P ) 2 L + P + y ( P 2 L R ) and y > 2 P + L x ( 2 L + P ) 2 L + R + P + x ( P 2 L R ) , the local governments’ game space is located on the side of the curve, away from the z axis, and converges at z = 0 , the probability of the high-efficiency group choosing an efficiency spillover strategy and a low-efficiency group choosing a green transition strategy were higher than a certain threshold. In this situation, local governments will choose a passive strategy. By combining scenario 2’s analysis results, we obtained the following meaningful insights: For local governments, the significance of improving carbon emission efficiency is far greater than the benefits provided by the punishment mechanism. However, due to regulatory and institutional costs, local governments typically provide groups with more space for self-management. When the self-management effect of groups is poor or deteriorating, the local governments’ active regulatory red line will be triggered. This practice can effectively enhance the freedom of group evolution selection and interaction among groups, resulting in the long-term sustainable development of different efficiency groups.

4.1.4. Stability Conditions of the Trilateral Evolutionary Game

After analyzing the conditions for each group to achieve the stability strategy in different situations, we further discussed the conditions for the trilateral association system comprising high-efficiency groups, low-efficiency groups, and local governments to achieve the stability strategy, which is given as follows:
{ U ( x ) = d x d t = x ( 1 x ) [ 2 Q + y ( M N ) + z P ] V ( y ) = d y d t = y ( 1 y ) [ 2 Q H + S + x ( H C ) + z ( P + R ) ] W ( z ) = d z d t = z ( z 1 ) [ x ( 2 L + p ) + y ( 2 L + R + P ) + x y ( P 2 L R ) 2 P L ]
According to Equation (16), 16 equilibrium solutions were obtained, including eight pure strategy solution: x 1 ( 0 , 0 , 0 ) , x 2 ( 1 , 0 , 0 ) , x 3 ( 0 , 1 , 0 ) , x 4 ( 0 , 0 , 1 ) , x 5 ( 1 , 1 , 0 ) , x 6 ( 1 , 0 , 1 ) , x 7 ( 0 , 1 , 1 ) and x 8 ( 1 , 1 , 1 ) . The mixed strategy solution is represented by x 9 ( x * , y * , z * ) . The stable solution of the mixed strategy is located in the game space far from the coordinate axis, but no stable solution of mixed strategy was found through calculation, as such, it is not discussed in the follow-up research.
A Jacobi matrix is a common method used to test the stability of a trilateral interconnected system, and its principle explores the stable strategy combination through different expressions of matrix eigenvalues. If the eigenvalues are all greater than zero, the equilibrium strategy is unstable. If the eigenvalues are not all greater than zero, there is an asymptotic stability strategy. Only when all of the eigenvalues are less than zero does the equilibrium strategy combination indicate that it is stable. Equation (17) presents the Jacobi matrix of the trilateral evolution system comprising the efficiency groups and local governments. Table 3 describes the eigenvalue of the Jacobian matrix under different strategy combinations.
J a c = [ U ( x ) x U ( x ) y U ( x ) z V ( y ) x V ( y ) y V ( z ) z W ( z ) x W ( z ) y W ( z ) z ] = [ - ( 2 x - 1 ) [ 2 Q + y ( M - N ) + z P ] x ( M N ) ( x 1 ) x P ( x 1 ) y ( C H ) ( y 1 ) ( 2 y 1 ) [ 2 Q = H + S + x ( H C ) + z ( P + R ) ] y ( P + R ) ( y 1 ) z ( z 1 ) [ 2 L + P z ( z 1 ) [ 2 L + P + R ( 2 z 1 ) [ x ( 2 L + P ) + y ( 2 L + P + R ) y ( 2 L P + R ) ] x ( 2 L P + R ) ] + x y ( P 2 L R ) 2 P L ] ]

4.2. Evolutionary Simulation of the Tripartite Game

According to Table 3, there is only one stable equilibrium strategy combination under the unchanged original assumption, that is, high-efficiency groups choose efficiency spillover, low-efficiency groups choose green transformation, and local governments choose passive supervision strategies. In order to further discuss the evolution path, the convergence rules, and the sensitivity to the initial values of the tripartite interconnected system under the stable and balanced combination, the simulation initial values are set to M = 15 , N = 10 , Q = 5 , H = 5 , S = 9 , C = 3 , P = 5 , R = 2 , L = 1.5 through many experiments in a MATLAB 2021a environment (Appendix A explains the selection basis of the simulation values). Figure 5, Figure 6, Figure 7 and Figure 8 show the simulation results of the system evolution path of each group in the context of the initial strategy proportion of differentiation, rewards and punishments, transformation cost, and network capital.

4.2.1. System Evolution under Different Initial Strategy Proportion Scenarios

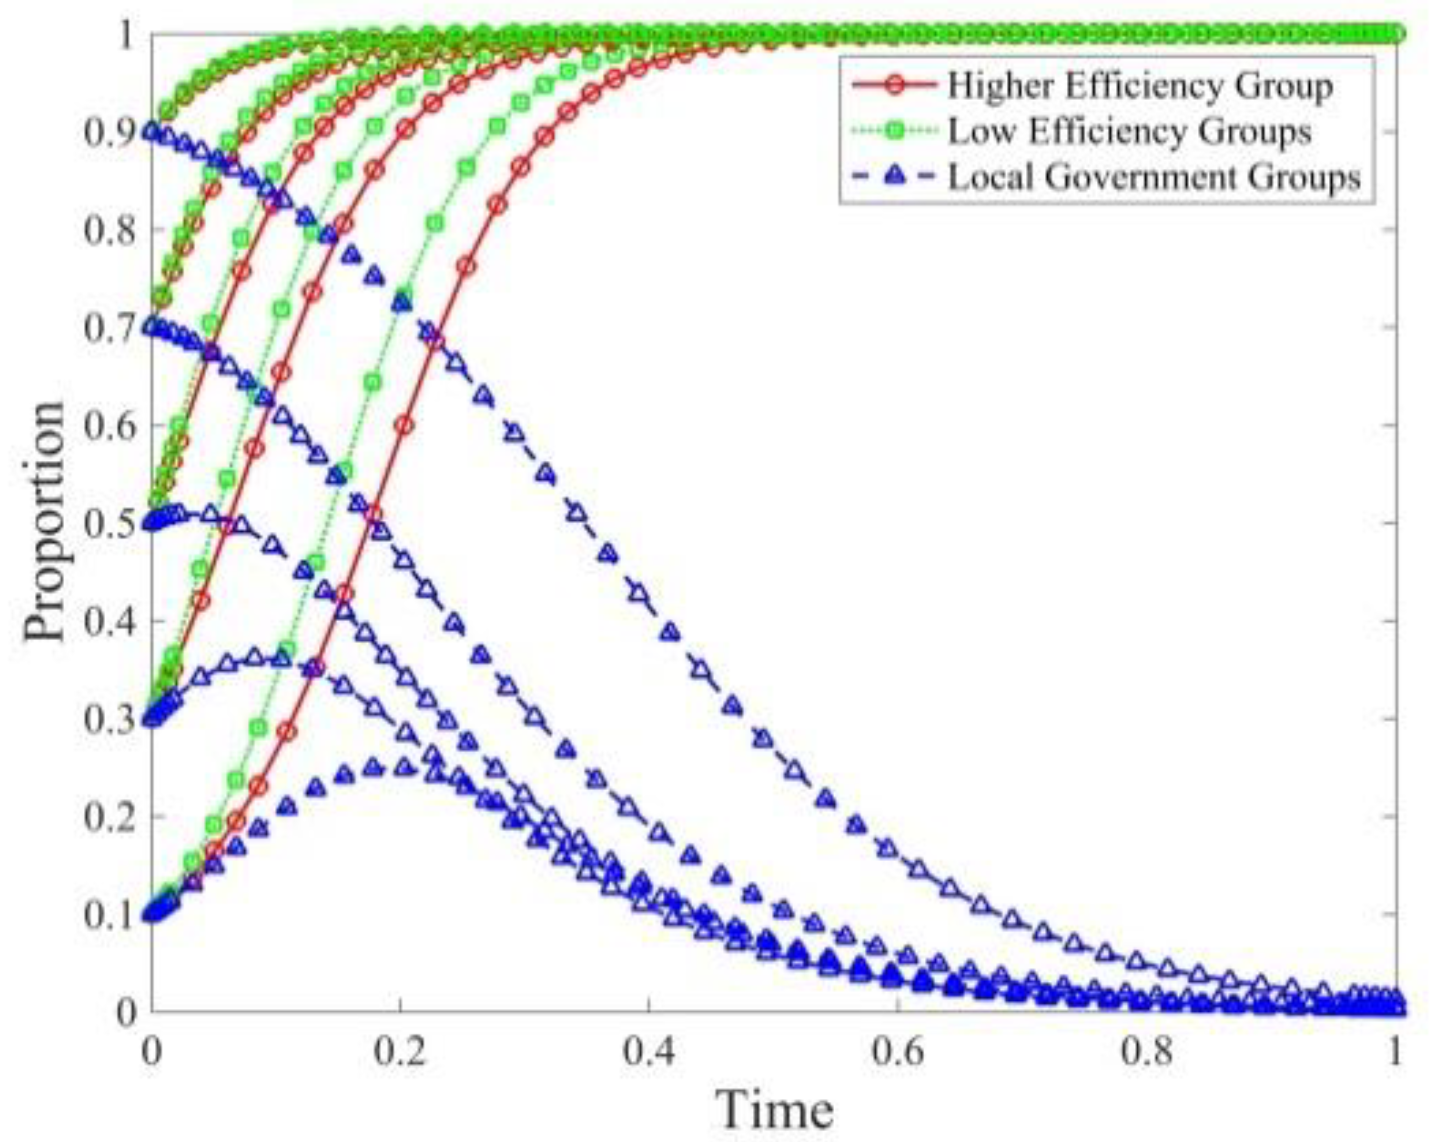
The initial strategy refers to the proportion of high-efficiency groups, low-efficiency groups, and local governments choosing efficiency spillover, green transformation, and active supervision strategies, respectively. Different initial strategy proportions describe the development process of the system from generation to maturity, and also reflect the tendency of strategy selection within groups. According to Figure 5, the evolution path of the trilateral interconnected system under different initial strategies is consistent. When the values of x , y and z are 0.1, 0.3, 0.5, 0.7, and 0.9, respectively, the final strategy choices of the high-efficiency groups and the low-efficiency groups focus on efficiency spillover and green transformation, respectively, while local governments all choose passive supervision. However, it is worth noting that the convergence speed of the evolution path of the trilateral interconnected system is affected by the initial strategy proportion. The higher the initial strategy proportion, the faster the convergence speed of the efficiency group. Conversely, the convergence speed of local governments decreases with the increase in the initial strategy proportion. In particular, when the initial strategy ratio is below 0.5, the proportion of local governments choosing an active supervision strategy increases briefly; when the initial strategy ratio is above 0.5, it shows a continuous downward trend. When the enthusiasm of high-efficiency groups’ willingness to use overflow efficiency is insufficient, and the motivation of low-efficiency groups’ green transformation is insufficient, the active supervision role of local governments is fully released, and the initial strategic willingness of efficiency groups is guided to improve through strict environmental regulations, reward and punishment mechanisms, and so on. The local government plays the dual role of supervisor and participant in the trilateral related evolutionary game system. The payment matrix in Table 2 reveals that the local government’s active supervision strategy costs more than passive supervision. Therefore, when the proportion of initial strategies reaches a certain threshold, local governments are more inclined to choose passive regulatory strategies in order to save on regulatory costs. At this time, efficiency groups possess more positive development will and a more perfect self-governance mode, and they finally achieve stability and equilibrium under the passive supervision of local governments.

4.2.2. System Evolution under Different Transformation Cost Scenarios

Figure 6 displays the evolution path ( c = 1 and c = 20 ) of the trilateral correlation system under the influence of the transition cost. Obviously, the transition cost did not change the stable strategy combination of the trilateral interconnected system, but it did significantly change the evolution path of the inefficient group. Specifically, the lower transition cost can improve the willingness of inefficient groups to choose a green transition, and the demonstration effect can promote the system to achieve a stable strategy combination faster. In addition, the convergence speed of the trilateral interconnected system slows down with the decrease in the initial strategy ratio. The cost of green transformation primarily stems from the development and introduction of low-carbon technologies, organization and management costs, cooperation costs, and so on. The cooperative innovation and development of key low-carbon technologies among efficiency groups can effectively reduce the risk and cost input in the process of green transformation. At the same time, the input of knowledge resources such as management experience, organization, and management modes shorten the time period of the transformation and application of innovation achievements, which is attractive to the promotion of low-efficiency groups’ willingness for green transformation.

4.2.3. System Evolution under Different Reward and Punishment Situations

Figure 7 shows the evolution path change of the trilateral correlation system under different reward and punishment intensities. The results show that, under the differentiated rewards and punishments ( p = 2 , r = 2 and p = 20 , r = 20 ), the stable convergence point of the system did not change, but the convergence speed changed differently, and the sensitivity of the high-efficiency group and the low-efficiency group to the rewards and punishments was different. When the punishment intensity was increased, the time required for all of the groups to converge to the stable strategy combination was significantly shortened, especially when the initial ratio was low. This was because the strict punishment mechanism creates more pressure on the group evolution, and at the same time, due to the demonstration effect of the punishment mechanism, the initiative supervision enthusiasm of local governments was rapidly promoted. However, the evolutionary sensitivity of low-efficiency groups under the incentive mechanism was significantly higher than that of the high-efficiency groups. When the incentive intensity was increased, the convergence speed of the low-efficiency groups improved significantly, which was accompanied by the convergence speed of local governments. Thus, the strategy choice of inefficient groups was identified as the main factor affecting the evolution track of local governments.

4.2.4. System Evolution under Different Network Capitals

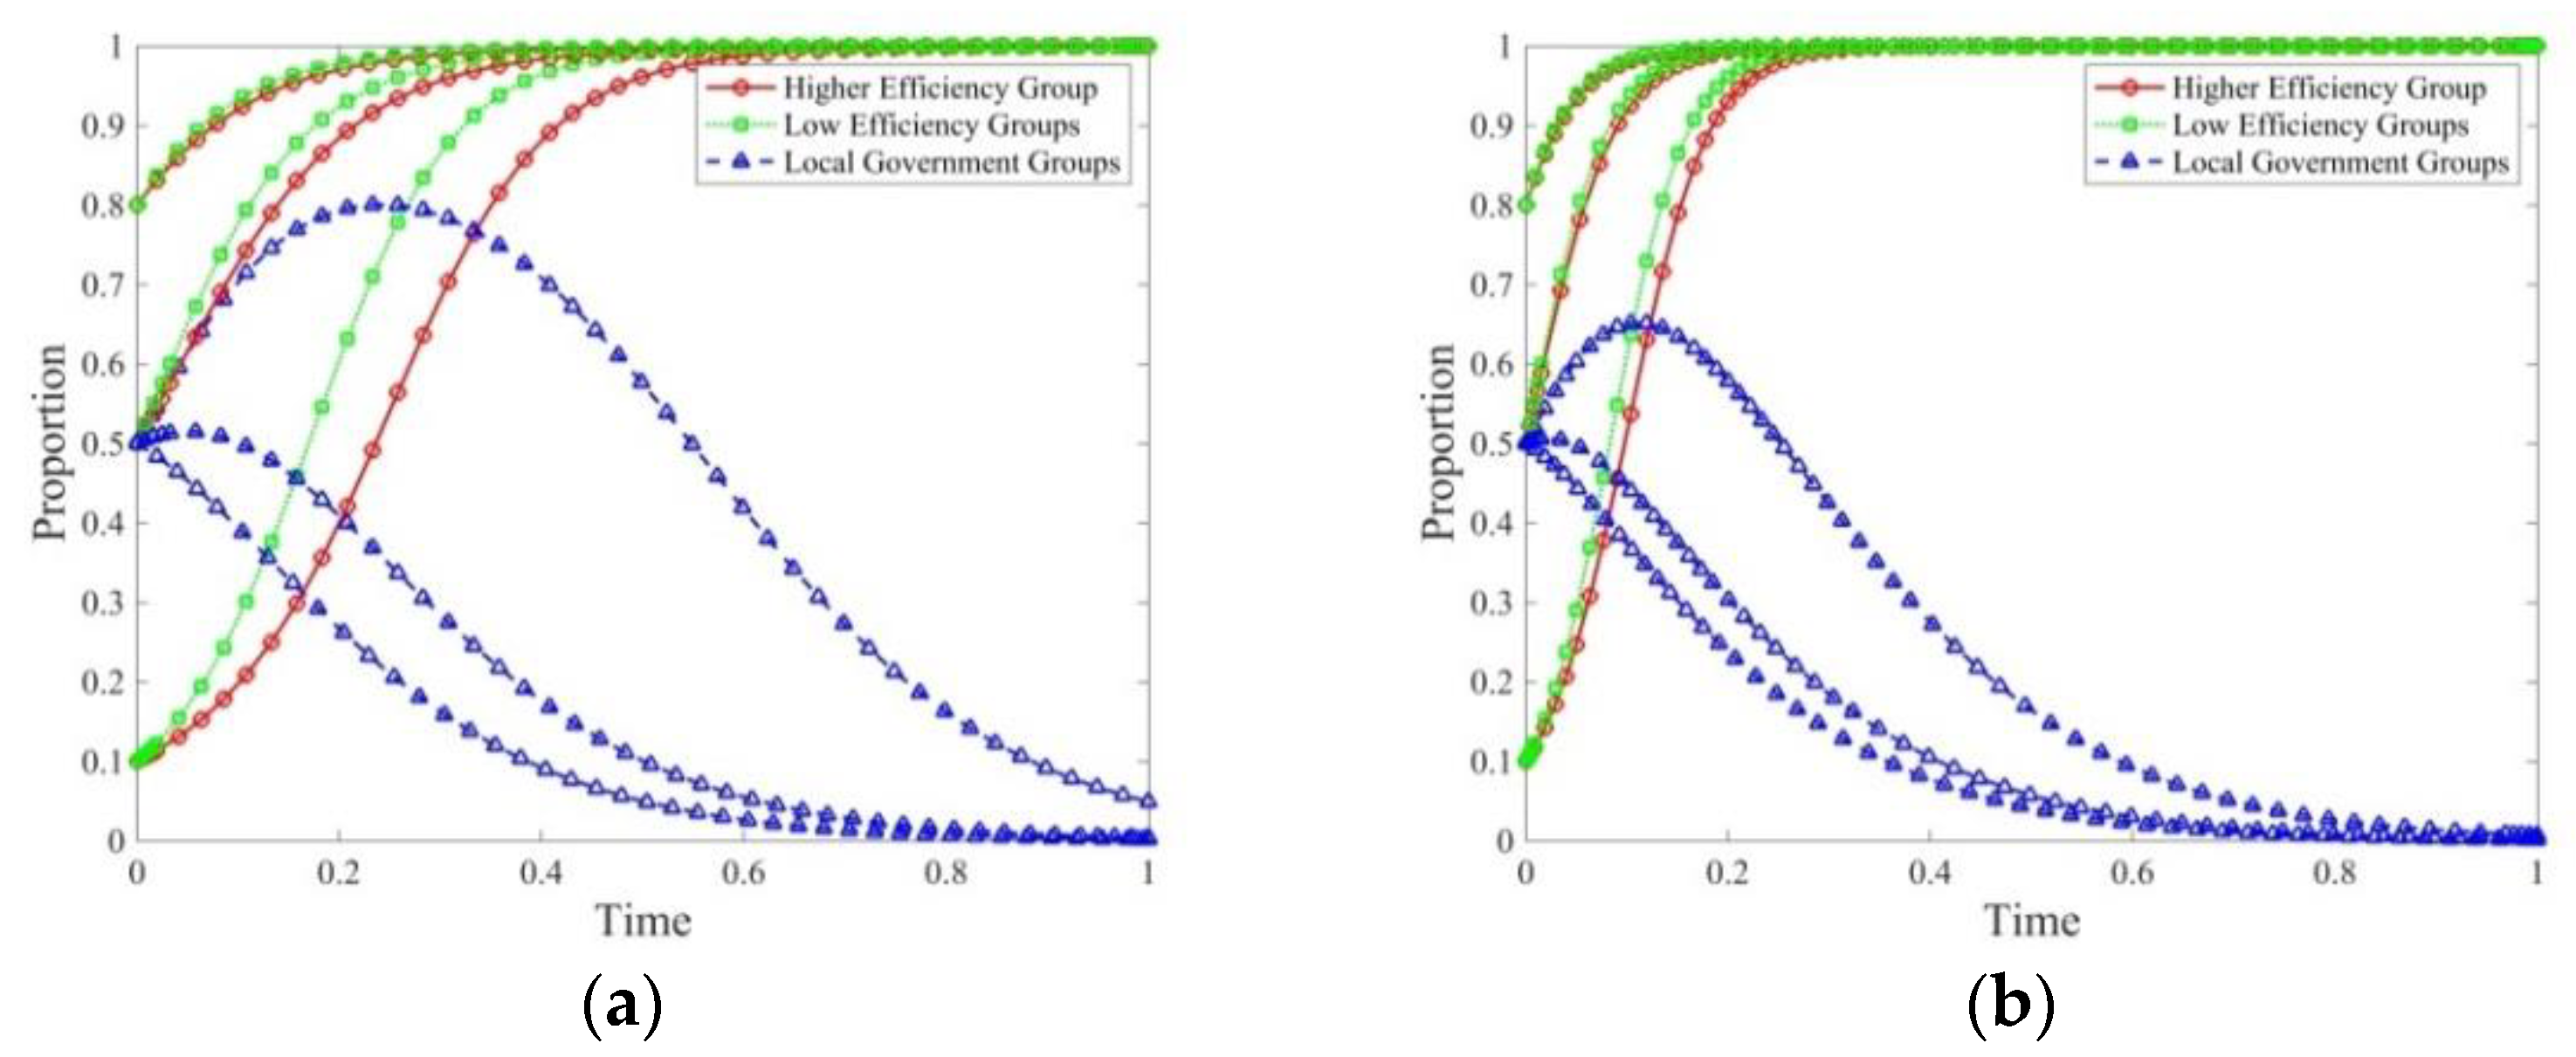
Figure 8 shows the influence of differentiated network capital on the evolutionary game path of the trilateral correlation system of carbon emissions. When the amount of network capital is low, the convergence speed of the low-efficiency group is obviously higher than that of the high-efficiency group when the initial strategy ratio is low. This result reveals that the low-efficiency group can receive more funds and management experience from the network at the initial stage of the carbon emission efficiency network, thus attracting more individuals to join the carbon emission efficiency network. However, with the constant adjustment of the initial strategy ratio, the convergence speed of the low-efficiency group was found to be essentially the same as that of the high-efficiency group. When the amount of network capital is high, all of the groups converge quickly. It can be concluded that the development of the carbon emission efficiency network will produce a cyclic accumulation effect, and will continuously attract inefficient individuals to join, thus increasing the speed at which the system achieves stable convergence.

5. Conclusions and Prospects

This paper examined the formation law and evolution mechanism of the carbon emission efficiency network, and constructed a trilateral game evolution model including high-efficiency groups, low-efficiency groups, and local governments. The basic conditions for each game participant and the tripartite evolutionary game system to achieve a stable and balanced strategy were discussed. Through system simulation, the sensitivity of the tripartite evolutionary game system of the initial strategy ratio, transition cost, rewards and punishments, and network capital was tested; Appendix B compares the evolution track characteristics in different simulation situations, and the main conclusions were as follows:
(1) Low-efficiency groups choose a green transition strategy, which provides expansion space for the efficiency spillover of high-efficiency groups. Their interest demands and complementary resources promote the formation of a virtuous circle between the groups, thus forcing both sides of the game toward a stable “win–win” state. However, the stable strategy choice of efficiency groups can only be triggered when the proportion of strategy choices of other players is higher than a certain threshold.
(2) The strategy choice of the efficiency groups determines the supervision strategy of local governments. When the efficiency groups achieve a “win–win” outcome or develop a good self-management mode, local governments will change their strategy choice from active supervision to passive supervision in order to reduce their supervision costs. Finally, the evolution outcomes of the trilateral evolutionary game system are the efficiency spillover of high-efficiency group selection, the green transformation of low-efficiency group selection, and the passive supervision of local government selection.
(3) The initial strategy proportion of the game participants does not affect the final stable strategy combination, but it does significantly change the speed at which the players converge into the stable strategy combination. Under the condition of a high initial strategy ratio, the group is more likely to form a positive self-development mode due to the preference and attachment characteristics of the carbon emission efficiency network, thus converging into a stable state faster. In contrast, under this condition, local governments do not play the role of active supervisors, and they extend the time to convergence to the stable strategy.
(4) The transformation cost is the key to restraining the willingness of inefficient groups for green transformation, especially under the condition of a low initial strategy ratio, and local governments need to adopt more active supervision strategies in order to achieve stable convergence. The demonstration effect brought on by the punishment mechanism can drive the initiative to choose the active supervision strategy, but the incentive effect of the reward mechanism on the high-efficiency group is not as obvious. Therefore, network capital can release the cyclic cumulative effect of the carbon emission efficiency network, and can enhance the green transformation willingness of inefficient groups.
According to the above conclusions, we put forward the following suggestions for future carbon emission control: First, local governments should continue to strengthen the role of servers in carbon emission control, attach importance to the relevance of different efficiency groups, and provide them with the necessary policy support and services. For example, establishing a low-carbon technology service platform and providing energy-saving and emission-reduction consultation for enterprises are aimed at improving the enthusiasm of enterprises for carbon emission reduction and laying the foundation for achieving a stable “win–win” state. Second, we should strengthen the regulatory role of financial capital in carbon emission control, and actively explore diversified carbon financial schemes. By rewarding enterprises with an obvious emission reduction effect, we can guide capital to flow into the fields of energy conservation, low-carbon technology development and sustainable development; provide financial guarantee for enterprises’ green transformation; and reduce the risk of green technology innovation. Third, we should improve the construction and integration of the carbon emission trading market. Carbon emission trading has been fully launched in China, and will also become an important form of carbon emission control in the future. We should encourage and support enterprises that have not reached the red line of carbon emissions to join the carbon emission trading market; at the same time, we should link it with the energy market and the green technology trading market, which not only enriches the means of carbon emission control but also provides a more flexible way for enterprises to implement carbon emission reduction.
The main contribution of this study lies in discussing the internal mechanism of the formation and evolution of the carbon emission efficiency network, constructing a trilateral game model including efficiency groups and local governments, and exploring the strategic choices and sensitivities of different efficiency groups and local governments in different situations. This analytical framework can also be applied to other regions or countries; however, there is room for further improvement. First, it is reasonable to classify groups according to carbon emission efficiency; however, this limits the research scale to macro perspectives such as cities or regions, and it is difficult to explain the influence of the behavior of producers and consumers on carbon emission efficiency. Second, the research primarily establishes the payment function matrix from the perspective of the costs and benefits of the game participants, without considering the influence of the carbon emission rights market, economic environment, and production benefit. In a subsequent study, we will focus on the level of production enterprises, and will discuss the evolutionary game process of enterprise decision-making behavior with the background of carbon emission trading.

Author Contributions

Writing—original draft preparation, R.Z.; Writing—review and editing, H.T. and H.D.; Funding acquisition, K.C.; Visualization, W.L.; Software, R.Z.; Writing—review and editing, J.H. All authors have read and agreed to the published version of the manuscript.

Funding

This research was funded by Hsingwei Tai and Kuotai Cheng [grant number ZR2020MG015]. And the APC was funded by Hsingwei Tai and Kuotai Cheng.

Institutional Review Board Statement

This study does not involve animals and humans, so we give up the ethical review.

Informed Consent Statement

This study does not involve animals and humans.

Data Availability Statement

This study did not report any data sets.

Acknowledgments

This work was partly supported by the Shandong Science Foundation [grant number ZR2020MG015]. Any opinions, findings, conclusions, and recommendations expressed in this paper are those of the authors.

Conflicts of Interest

The authors declare no conflict of interest.

Appendix A

Generally, numerical simulation is very important to the simulation results. When we choose the initial variable value, we mainly consider the following two factors. First, the simulation value must meet the actual development situation; that is, the variable value is not allowed to be negative. The second is to enlarge the sensitivity of the trilateral evolutionary game system to different influencing factors in so far as is possible, in order to enhance the contrast and visibility of the results.
The analysis results in Table 3 show that there is only one stable equilibrium point ( 1 , 1 , 0 ) in the trilateral evolutionary game system with the original assumption unchanged. However, in many simulation experiments, we found that as long as the variable values can meet the eigenvalue conditions in Table 3, we can make the evolution track consistent with the expected results, although the variable values at this time are not in line with the actual situation (the variable values are negative). Therefore, we think that the simulation results are consistent as long as the simulation values can meet the characteristic values in Table 3. With the support of this result, we set the initial variable values, and compared the sensitivity of the evolution trajectory to different initial values. Finally, we provided the code and files of the simulation experiment so that readers can reproduce the results or go deeper.

Appendix B

Appendix B provides the sensitivity comparison of the trilateral evolutionary game system to different influencing factors, including the selection of simulation values, whether the evolution path changes, and the characteristics of the simulation curves. Readers can further discuss the results in this paper according to the codes and documents provided by us, or put forward improvement methods.
Table A1. Comparison of the sensitivity of the trilateral evolutionary game system to different influencing factors.
VariableSimulation DataEvolutionary PathCurve Feature
initial strategy proportion
( x , y , z )
0.1unchangedThe higher the efficiency ratio of the group, the faster it converges to the stable strategy, but the opposite is true for local governments.
0.3
0.5
0.7
0.9
transformation cost ( c )1.0unchangedThe transition cost will prolong the time for the inefficient group to reach the stable equilibrium strategy, while it has a weak influence on other game participants.
20.0
reward ( r )2.0unchangedThe convergence speed of low-efficient groups is more sensitive to incentive policies, and local governments need to spend more time to achieve stable and balanced strategies when the initial proportion of other players is low.
20.0
punishment
( p )
2.0unchangedPunishment policy has a stronger influence on low-efficient groups, and can reduce the time for local governments to reach the stable equilibrium strategy.
20.0
network capital ( q )2.0unchangedNetwork capital can shorten the time for all game participants to reach the stable equilibrium strategy.
9.0

References

  1. Huang, Y.; Matsumoto, K. Drivers of the change in carbon dioxide emissions under the progress of urbanization in 30 provinces in China: A decomposition analysis. J. Clean. Prod. 2021, 322, 129000. [Google Scholar] [CrossRef]
  2. Wen, W.; Feng, C.; Zhou, H.; Zhang, L.; Wu, X.; Qi, J.; Yang, X.; Liang, Y. Critical provincial transmission sectors for carbon dioxide emissions in China. Renew. Sustain. Energy Rev. 2021, 149, 111415. [Google Scholar] [CrossRef]
  3. Qin, H.; Huang, Q.; Zhang, Z.; Lu, Y.; Li, M.; Xu, L.; Chen, Z. Carbon dioxide emission driving factors analysis and policy implications of Chinese cities: Combining geographically weighted regression with two-step cluster. Sci. Total Environ. 2019, 684, 413–424. [Google Scholar] [CrossRef]
  4. Lin, B.; Benjamin, N.I. Determinants of industrial carbon dioxide emissions growth in Shanghai: A quantile analysis. J. Clean. Prod. 2019, 217, 776–786. [Google Scholar] [CrossRef]
  5. Zhang, X.; Li, Z.; Wang, J. Impact of COVID-19 pandemic on energy consumption and carbon dioxide emissions in China’s transportation sector. Case Stud. Therm. Eng. 2021, 26, 101091. [Google Scholar] [CrossRef]
  6. Rehman, A.; Ma, H.; Ahmad, M.; Irfan, M.; Traore, O.; Chandio, A.A. Towards environmental Sustainability: Devolving the influence of carbon dioxide emission to population growth, climate change, Forestry, livestock and crops production in Pakistan. Ecol. Indic. 2021, 125, 107460. [Google Scholar] [CrossRef]
  7. Leitão, J.; Ferreira, J.; Santibanez-González, E. New insights into decoupling economic growth, technological progress and carbon dioxide emissions: Evidence from 40 countries. Technol. Forecast. Soc. Chang. 2021, 174, 121250. [Google Scholar] [CrossRef]
  8. Wang, Y.; Yang, H.; Sun, R. Effectiveness of China’s provincial industrial carbon emission reduction and optimization of carbon emission reduction paths in “lagging regions”: Efficiency-cost analysis. J. Environ. Manag. 2020, 275, 111221. [Google Scholar] [CrossRef]
  9. Yao, X.; Zhang, X.; Guo, Z. The tug of war between local government and enterprises in reducing China’s carbon dioxide emissions intensity. Sci. Total Environ. 2020, 710, 136140. [Google Scholar] [CrossRef]
  10. Adams, S.; Nsiah, C. Reducing carbon dioxide emissions; Does renewable energy matter? Sci. Total Environ. 2019, 693, 133288. [Google Scholar] [CrossRef]
  11. He, A.; Xue, Q.; Zhao, R.; Wang, D. Renewable energy technological innovation, market forces, and carbon emission efficiency. Sci. Total Environ. 2021, 796, 148908. [Google Scholar] [CrossRef]
  12. Jiang, M.; An, H.; Gao, X.; Liu, S.; Xi, X. Factors driving global carbon emissions: A complex network perspective. Resour. Conserv. Recycl. 2019, 146, 431–440. [Google Scholar] [CrossRef]
  13. Wang, Z.; Wang, X.; Peng, S.; Ming, L.; Cui, C.; Niu, B. Interactions between households and industrial sectors in embodied carbon emission networks. J. Clean. Prod. 2020, 275, 123809. [Google Scholar] [CrossRef]
  14. Jiang, Q.; Ma, X. Spillovers of environmental regulation on carbon emissions network. Technol. Forecast. Soc. Chang. 2021, 169, 120825. [Google Scholar] [CrossRef]
  15. Wang, G.; Deng, X.; Wang, J.; Zhang, F.; Liang, S. Carbon emission efficiency in China: A spatial panel data analysis. China Econ. Rev. 2019, 56, 101313. [Google Scholar] [CrossRef]
  16. Li, S.; Zhou, C.; Wang, S. Does modernization affect carbon dioxide emissions? A panel data analysis. Sci. Total Environ. 2019, 663, 426–435. [Google Scholar] [CrossRef]
  17. Wu, D.; Geng, Y.; Pan, H. Whether natural gas consumption bring double dividends of economic growth and carbon dioxide emissions reduction in China? Renew. Sustain. Energy Rev. 2021, 137, 110635. [Google Scholar] [CrossRef]
  18. He, Y.; Fu, F.; Liao, N. Exploring the path of carbon emissions reduction in China’s industrial sector through energy efficiency enhancement induced by R&D investment. Energy 2021, 225, 120208. [Google Scholar] [CrossRef]
  19. Nam, E.; Jin, T. Mitigating carbon emissions by energy transition, energy efficiency, and electrification: Difference between regulation indicators and empirical data. J. Clean. Prod. 2021, 300, 126962. [Google Scholar] [CrossRef]
  20. Qiao, W.; Lu, H.; Zhou, G.; Azimi, M.; Yang, Q.; Tian, W. A hybrid algorithm for carbon dioxide emissions forecasting based on improved lion swarm optimizer. J. Clean. Prod. 2020, 244, 118612. [Google Scholar] [CrossRef]
  21. Cai, W.; Ye, P. Does Carbon Emission Trading Improve Low-carbon Technical Efficiency? Evidence from China. Sustain. Prod. Consum. 2021, 29, 46–56. [Google Scholar] [CrossRef]
  22. Zhao, D.; Ji, S.-F.; Wang, H.-P.; Jiang, L.-W. How do government subsidies promote new energy vehicle diffusion in the complex network context? A three-stage evolutionary game model. Energy 2021, 230, 120899. [Google Scholar] [CrossRef]
  23. Wen, W.; Wang, Q. Re-examining the realization of provincial carbon dioxide emission intensity reduction targets in China from a consumption-based accounting. J. Clean. Prod. 2020, 244, 118488. [Google Scholar] [CrossRef]
  24. Xie, Z.; Wu, R.; Wang, S. How technological progress affects the carbon emission efficiency? Evidence from national panel quantile regression. J. Clean. Prod. 2021, 307, 127133. [Google Scholar] [CrossRef]
  25. Zhang, X.; Nie, S.; He, M.; Wang, J. Charging system analysis, energy consumption, and carbon dioxide emissions of battery electric buses in Beijing. Case Stud. Therm. Eng. 2021, 26, 101197. [Google Scholar] [CrossRef]
  26. Mahapatra, B.; Irfan, M. Asymmetric impacts of energy efficiency on carbon emissions: A comparative analysis between developed and developing economies. Energy 2021, 227, 120485. [Google Scholar] [CrossRef]
  27. Chen, P.; Lu, Y.; Wan, Y.; Zhang, A. Assessing carbon dioxide emissions of high-speed rail: The case of Beijing-Shanghai corridor. Transp. Res. Part D Transp. Environ. 2021, 97, 102949. [Google Scholar] [CrossRef]
  28. Martins, T.; Barreto, A.C.; Souza, F.M.; Souza, A.M. Fossil fuels consumption and carbon dioxide emissions in G7 countries: Empirical evidence from ARDL bounds testing approach. Environ. Pollut. 2021, 291, 118093. [Google Scholar] [CrossRef]
  29. Yu, D.-J.; Li, J. Evaluating the employment effect of China’s carbon emission trading policy: Based on the perspective of spatial spillover. J. Clean. Prod. 2021, 292, 126052. [Google Scholar] [CrossRef]
  30. Zhang, Y.; Zhang, T.; Pan, L. Operational Strategy and User Price Preference Analysis of China’s Microgrids: Based on An Evolutionary Game Model. Chem. Eng. Res. Des. 2021. [Google Scholar] [CrossRef]
  31. Guo, L.-Y.; Feng, C. Are there spillovers among China’s pilots for carbon emission allowances trading? Energy Econ. 2021, 103, 105574. [Google Scholar] [CrossRef]
  32. Zang, H.; Xu, Y.; Zhai, M.; Li, W.; Su, S. Development of carbon emission interactive network model: A case study of Northeast Industrial District. J. Environ. Manag. 2021, 300, 113618. [Google Scholar] [CrossRef] [PubMed]
  33. Jiang, M.; An, H.; Gao, X.; Jia, N.; Liu, S.; Zheng, H. Structural decomposition analysis of global carbon emissions: The contributions of domestic and international input changes. J. Environ. Manag. 2021, 294, 112942. [Google Scholar] [CrossRef] [PubMed]
  34. Al Sadawi, A.; Madani, B.; Saboor, S.; Ndiaye, M.; Abu-Lebdeh, G. A comprehensive hierarchical blockchain system for carbon emission trading utilizing blockchain of things and smart contract. Technol. Forecast. Soc. Chang. 2021, 173, 121124. [Google Scholar] [CrossRef]
  35. Ying, Z.; Xin-Gang, Z. The impact of Renewable Portfolio Standards on carbon emission trading under the background of China’s electricity marketization reform. Energy 2021, 226, 120322. [Google Scholar] [CrossRef]
  36. Chen, X.; Lin, B. Towards carbon neutrality by implementing carbon emissions trading scheme: Policy evaluation in China. Energy Policy 2021, 157, 112510. [Google Scholar] [CrossRef]
  37. Yu, Y.; Zhang, N. Low-carbon city pilot and carbon emission efficiency: Quasi-experimental evidence from China. Energy Econ. 2021, 96, 105125. [Google Scholar] [CrossRef]
  38. Zhanga, Y. Research on International Carbon Emissions Trading and Optimal Exports Scale of China Carbon Emissions. Procedia Environ. Sci. 2011, 10, 101–107. [Google Scholar] [CrossRef] [Green Version]
  39. Jiang, M.; Gao, X.; Guan, Q.; Hao, X.; An, F. The structural roles of sectors and their contributions to global carbon emissions: A complex network perspective. J. Clean. Prod. 2019, 208, 426–435. [Google Scholar] [CrossRef]
  40. Melgar-Dominguez, O.D.; Pourakbari-Kasmaei, M.; Lehtonen, M.; Mantovani, J.R.S. An economic-environmental asset planning in electric distribution networks considering carbon emission trading and demand response. Electr. Power Syst. Res. 2020, 181, 106202. [Google Scholar] [CrossRef]
  41. Shi, Y.; Wei, Z.; Shahbaz, M.; Zeng, Y. Exploring the dynamics of low-carbon technology diffusion among enterprises: An evolutionary game model on a two-level heterogeneous social network. Energy Econ. 2021, 101, 105399. [Google Scholar] [CrossRef]
  42. Liu, W.; Long, S.; Xie, D.; Liang, Y.; Wang, J. How to govern the big data discriminatory pricing behavior in the platform service supply chain? An examination with a three-party evolutionary game model. Int. J. Prod. Econ. 2021, 231, 107910. [Google Scholar] [CrossRef]
Figure 1. Formation mechanism of the carbon emission efficiency network.
Sustainability 14 02191 g001
Figure 2. High-efficiency group evolution phase diagram.
Sustainability 14 02191 g002
Figure 3. Low-efficiency group evolution phase diagram.
Sustainability 14 02191 g003
Figure 4. Local government evolution phase diagram.
Sustainability 14 02191 g004
Figure 5. Simulation of the influence of different initial proportions on the evolution path of the system.
Sustainability 14 02191 g005
Figure 6. Simulation of the influence of transition costs on the system evolution path. (a) is the evolution path under the condition of c = 1 . (b) is the evolution path under the condition of c = 20 .
Sustainability 14 02191 g006
Figure 7. Simulation of the influence of differentiated rewards and punishments on the system evolution path. (a) is the evolution path under the condition of p = 2 . (b) is the evolution path under the condition of p = 20 . (c) is the evolution path under the condition of r = 2 . (d) is the evolution path under the condition of r = 20 .
Sustainability 14 02191 g007
Figure 8. Simulation of the influence of different network capitals on the system evolution path. (a) is the evolution path under the condition of q = 1 . (b) is the evolution path under the condition of q = 9 .
Sustainability 14 02191 g008
Table 1. Model parameter setting.
ParameterParameter Interpretation
C h basic benefits of high-efficiency group
C l basic benefits of low-efficiency group
Q changes in network capital of efficiency groups; it reflects the degree of interaction between different efficiency groups.
M high-efficiency groups choose the benefits of efficiency spillovers
N the cost and opportunity cost of efficient group selection efficiency spillover, including technology transfer, capital investment, etc.
P government punishment for maintaining the status quo
R government incentives for carbon emission efficiency improvement or green transformation
H the cost of low-efficiency group choosing independent green transformation, including low-carbon technology development, project planning, etc.
S benefits from green transformation of inefficient groups
C low-efficiency groups are affected by the transformation cost of spillover efficiency spillover
L supervision cost of local government
J system construction cost of local government
Note: M > N , S > H > C can be obtained from the above assumptions.
Table 2. Payment matrix of the tripartite evolutionary game.
Strategy SpaceHigh-Efficiency GroupLow-Efficiency GroupLocal Government
{ E A S , G T F , A S } C h + Q + M N C l C + S + Q + R L R
{ E A S , G T F , P S } C h + Q + M N C l C + S + Q J
{ E A S , M S Q , A S } C h + Q C l P Q P L J
{ E A S , M S Q , P S } C h + Q C l Q J
{ E D S , G T F , A S } C h P Q C l H + S + R + Q P R L J
{ E D S , G T F , P S } C h Q C l H + S + Q J
{ E D S , M S Q , A S } C h P Q C l P Q L + 2 P J
{ E D S , M S Q , P S } C h Q C l Q J
Table 3. Eigenvalues under different combinations of equilibrium strategies.
Equilibrium StrategyEigenvalue1Eigenvalue2Eigenvalue3Symbol
x 1 ( 0 , 0 , 0 ) L + 2 P 2 Q 2 Q H + S + + +
x 2 ( 1 , 0 , 0 ) P L 2 Q 2 Q C + S * − +
x 3 ( 0 , 1 , 0 ) H 2 Q S M N + 2 Q P L R − + *
x 4 ( 0 , 0 , 1 ) P + 2 Q L 2 Q P H + 2 Q + R + S + − +
x 5 ( 1 , 1 , 0 ) L P C 2 Q S N M 2 Q − − −
x 6 ( 1 , 0 , 1 ) L P P 2 Q P C + 2 Q + R + S * − +
x 7 ( 0 , 1 , 1 ) L P + R M N + P + 2 Q H P 2 Q R S * + −
x 8 ( 1 , 1 , 1 ) L + P N M P 2 Q C P 2 Q R S + − −
Note: * indicates that the symbol is uncertain.
Publisher’s Note: MDPI stays neutral with regard to jurisdictional claims in published maps and institutional affiliations.