Article

Catalytic Ozonation of the Secondary Effluents from the Largest Chinese Petrochemical Wastewater Treatment Plant—A Stability Assessment

1
School of Chemical and Environmental Engineering, China University of Mining and Technology Beijing, Beijing 100083, China
2
Process and Environmental Technology Lab, Department of Chemical Engineering, KU Leuven, J. De Nayerlaan 5, 2860 Sint-Katelijne-Waver, Belgium
3
Research Center of Water Pollution Control Technology, Chinese Research Academy of Environmental Sciences, Beijing 100012, China
4
State Key Laboratory of Environmental Criteria and Risk Assessment, Chinese Research Academy of Environmental Sciences, Beijing 100012, China
5
Center for Environmental and Marine Studies (CESAM), University of Aveiro, 3810-193 Aveiro, Portugal
6
Centre for Environmental and Marine Studies (CESAM), Department of Environment and Planning, and Department of Materials and Ceramics Engineering, Aveiro Institute of Materials CICECO, University of Aveiro, 3810-193 Aveiro, Portugal
*
Author to whom correspondence should be addressed.
These authors contributed equally to this work.
Sustainability 2022, 14(4), 2200; https://doi.org/10.3390/su14042200
Submission received: 26 October 2021 / Revised: 11 January 2022 / Accepted: 13 January 2022 / Published: 15 February 2022
(This article belongs to the Special Issue Sustainability in Water and Wastewater Treatment Technologies)

Abstract

:
Effluents discharged from petrochemical facilities are complex and composed of various types of highly toxic contaminants, which necessitates the development of sustainable treatment technologies. Stability is among the most important sustainability criteria of the wastewater treatment processes. In the present manuscript, the standard-reaching rate (η) index was used to evaluate the stability of the catalytic ozonation process for treating the secondary effluent from the petrochemical industry. A pilot-scale device was designed and implemented for catalytic ozonation. The effluents were taken from the secondary sedimentation tank of a petrochemical wastewater treatment plant in China. A commercially available γ-Al2O3 was used as the catalyst after a pre-treatment heating step. The catalyst was characterized using scanning electron microscopy. Three mathematical statistics indexes, discrete coefficient (Vσ), skewness coefficient (Cso), and range coefficient (VR), were used to analyze the results achieved from the catalytic ozonation process. Continuous operation of the pilot-scale device was monitored for 9 months under an ozone concentration of 36 mg/L and the contact oxidation time of 1 h. The results demonstrated that the stability evaluation grades of chemical oxygen demand (COD) and suspended solids (SS) in the effluent of the catalytic ozonation system were both 3 and A, indicating that the process was relatively stable over a long period of application. The effluent COD compliance grade was also calculated as B, indicating that the effluent COD does not meet the standard and the process parameters need to be further optimized. When the reflux ratio is 150%, the removal rate of COD is the highest (38.2%) and the COD of effluent is 49.34 mg/L. Meanwhile, to enhance the efficiency and stability of the system, the ozone concentration and the two-stage aeration ratio are 40 mg/L and 4:1, respectively. Moreover, the presence of SS in the water of the catalytic ozonation system will result in the waste of ozone and reduce the utilization rate of ozone.

1. Introduction

The effluents from the petrochemical industry are characterized by a complex composition containing high concentrations of various types of pollutants with high concentrations and high toxicity [1]. These types of effluents normally contain a variety of bio-refractory organic compounds. In July 2015, the Ministry of Environmental Protection began to implement the “petrochemical industry pollutant emission standards” (GB 30571-2015) [2]. This standard has set limitations for the chemical oxygen demand (COD) of petrochemical wastewater drainage from 100 mg/L to 60 mg/L. Hence, there is a need for the industries to adopt effective approaches to meet these standards.
Catalytic ozonation is among the advanced oxidation processes (AOPs) developed in recent years to deal with highly polluted effluents containing non-biodegradable and recalcitrant organic compounds. This technique has the potential to degrade various refractory organic micro-pollutants (OMPs) in wastewater [3,4]. Furthermore, it has been used to reduce the chroma of wastewater, and further remove OMPs in secondary effluent. There are some reports in the literature for the efforts on the optimization of this process to be applicable for real applications [5,6]. Fu [7] efficiently used catalytic ozonation to treat petrochemical wastewater. Geng and Cui [8,9] indicated that catalytic ozonation is a feasible method for the treatment of secondary effluent from large-scale chemical wastewater treatment plants (WWTP). They demonstrated that, using this technology, the COD of effluent can reach the direct discharge limit stipulated in the GB31571-2015 standard, and the biodegradability of wastewater can be improved after photocatalytic oxidation by ozone.
However, the effluents from the petrochemical industry are of quite a complex nature, which can be affected by crude oil quality, production process, and production equipment. The quality and quantity of the petrochemical effluents can, hence, fluctuate greatly. It is reported that the average freshwater intake and wastewater discharge per ton of crude oil are about 0.55 t and 0.27 t, respectively [10]. The concentration of COD in petrochemical wastewater varies from 2500 mg/L to 15,000 mg/L [11]. Hence, different qualities for the final treated effluents can be expected [12]. On the other hand, the industries are looking for sustainable wastewater treatment technologies to satisfy the long-term needs for a reliable wastewater treatment method. As discussed in the literature [13,14], stability is among the most important sustainability parameters that define the degree of reliability of the developed wastewater treatment technology for real applications. This is of high importance, especially for industries such as the petrochemical industry, to ensure the quality of the discharged effluents and to prevent the secondary environmental issues resulting from the release of the effluents containing toxic and non-biodegradable organic pollutants [15,16].
According to the very recent literature, stability is among the most important sustainability criteria of industrial wastewater treatment technologies. However, there is currently a lack of such in-depth studies, especially in pilot and real scales, to evaluate the reliability of the already developed wastewater treatment technologies. Although there are several studies in the literature on the efficiency and cost analysis of AOPs, such as catalytic ozonation, to our best knowledge, the reports on the systematic stability analysis of such technologies are rare in the literature. Hence, the present manuscript tends to evaluate the stability of the ozonation process of the secondary effluents from the largest petrochemical wastewater treatment plant in China during a long-term period of operation using a pilot-scale catalytic ozonation system. Moreover, statistical analysis was employed to this end and the required modification in the process was identified and recommended using the obtained results.

2. Materials and Methods

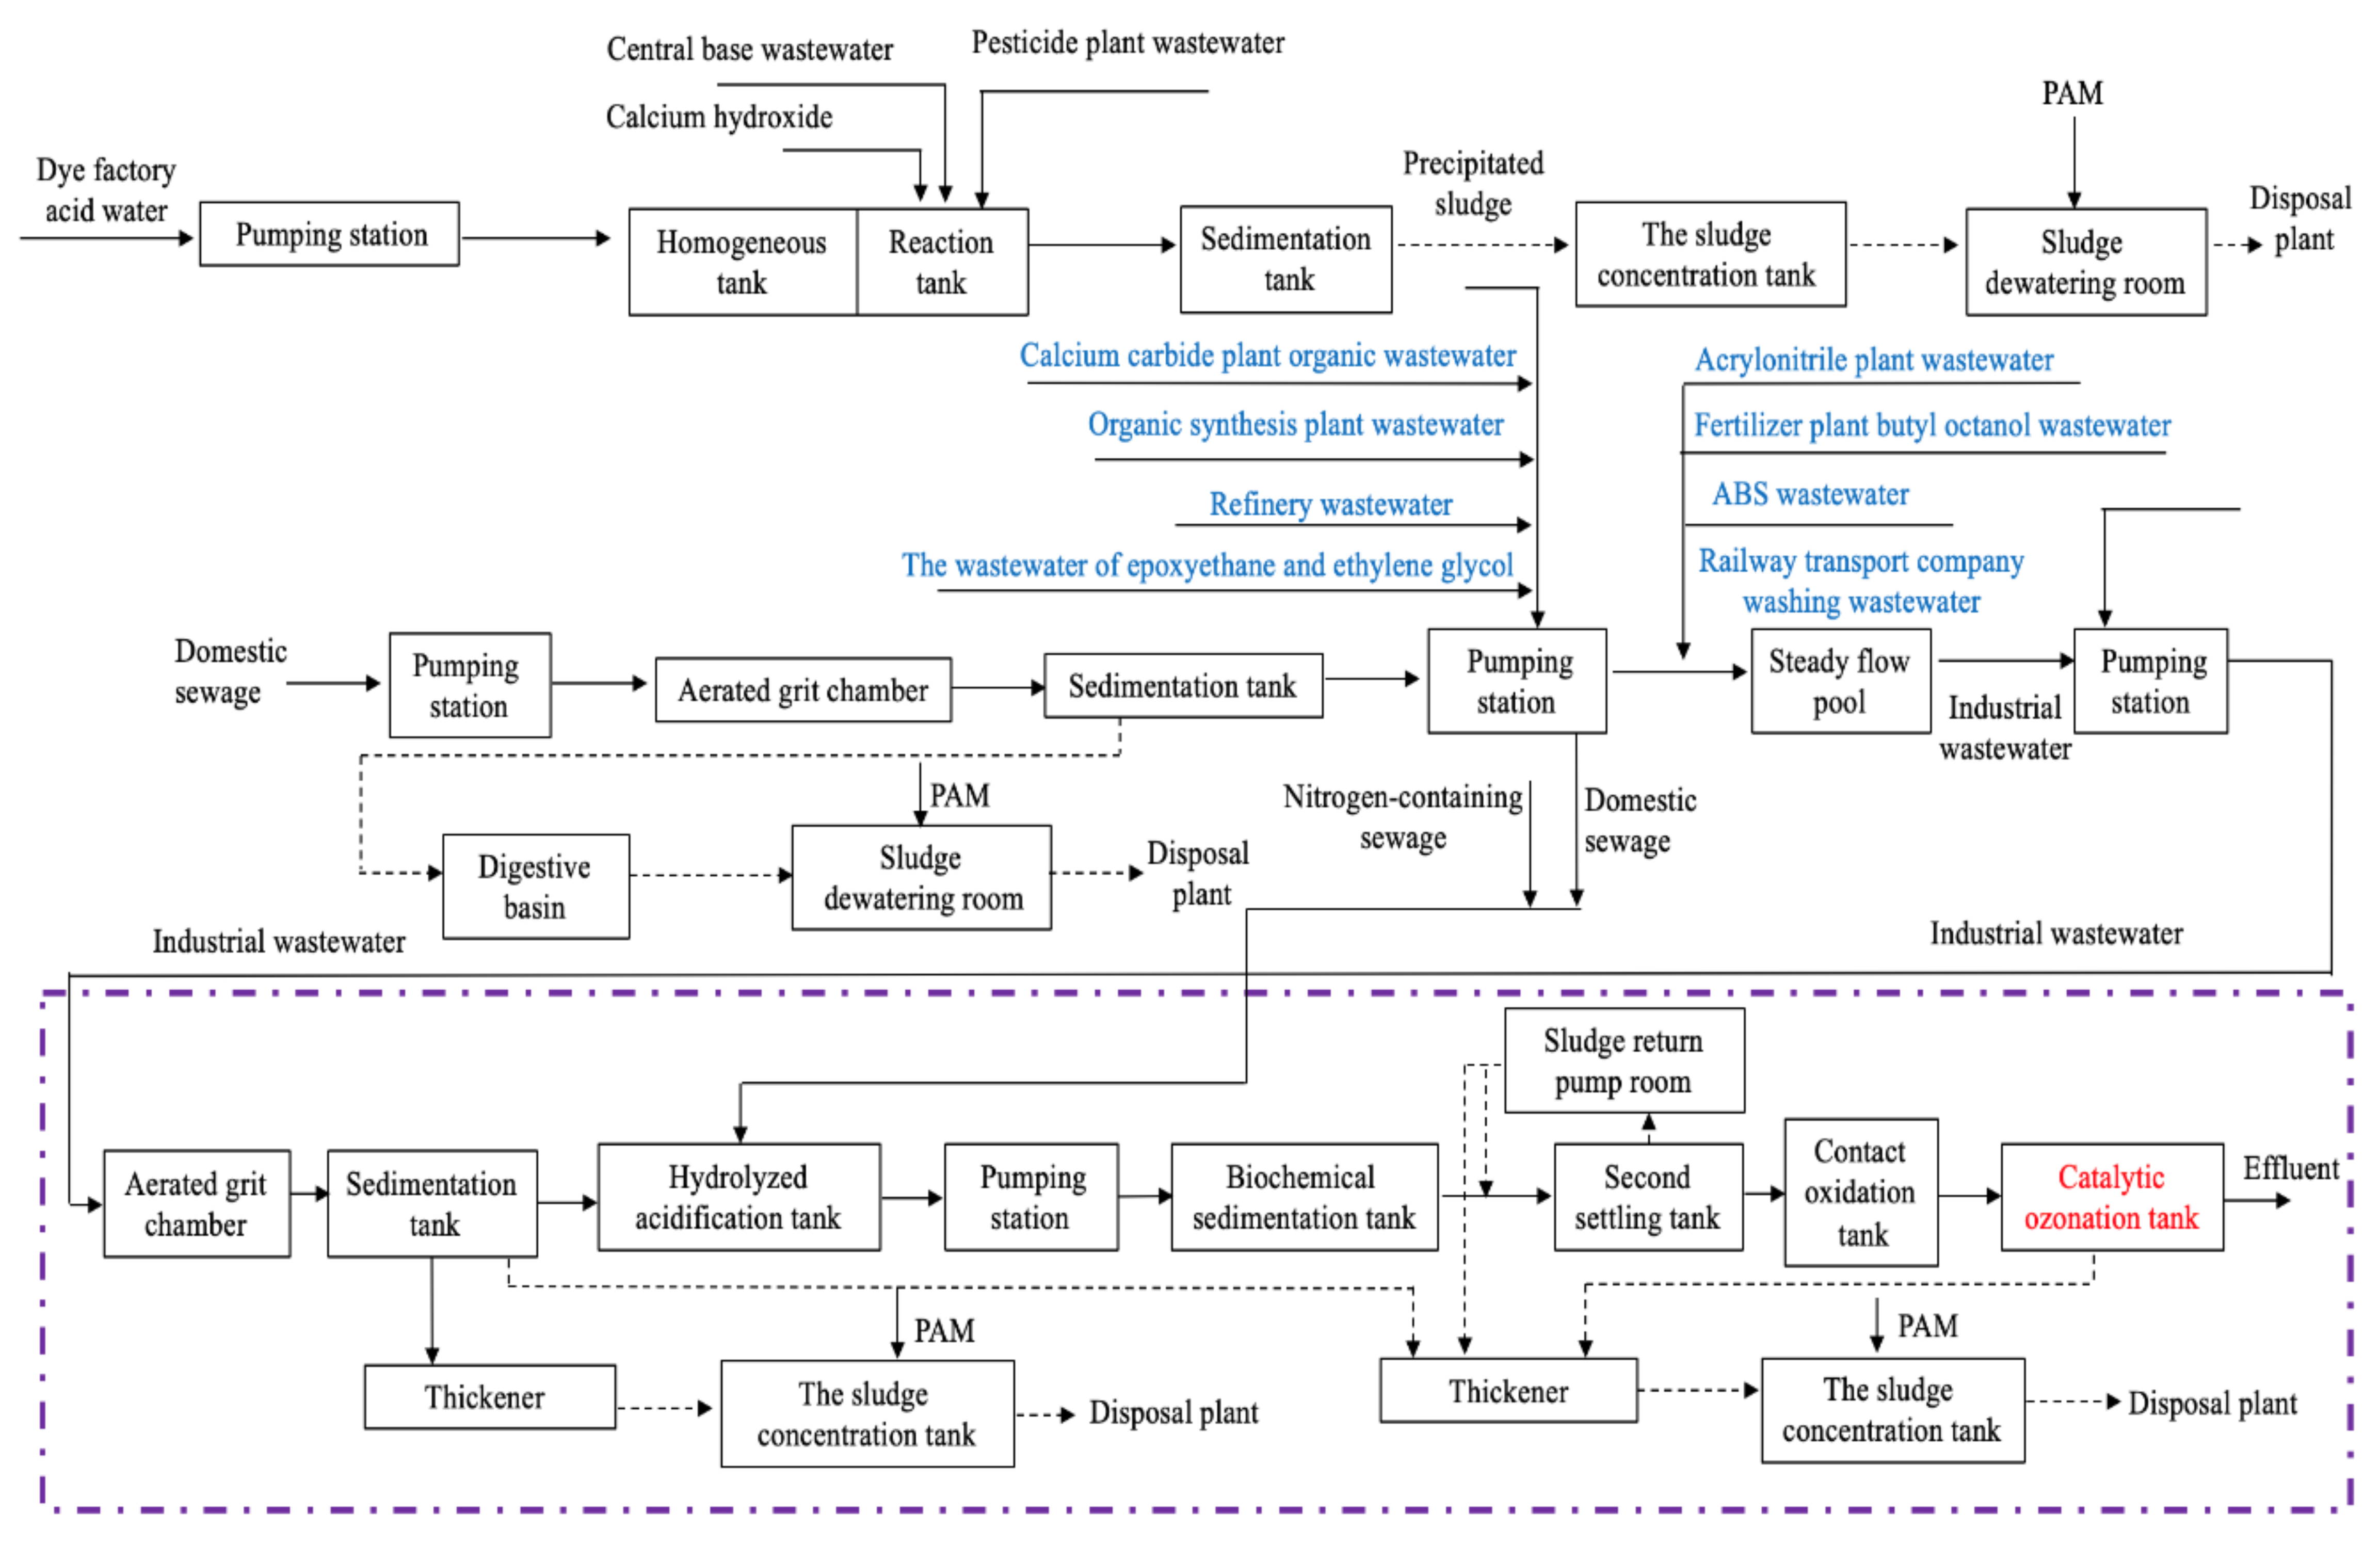
2.1. The Petrochemical WWTP

The selected WWTP is the largest petrochemical WWTP in China (PetroChina), located in the northeast of China. The influent mainly comes from the petrochemical industries from more than 60 sets of production equipment, such as refining, chemical, synthetic materials, and domestic sewage from nearby communities (Table 1).
The influent flowrate is ~6500 m3/h. The WWTP utilizes a biochemical treatment method as the core and adopts anaerobic hydrolysis acidification-anoxic/aerobic (A/O) as the main process (Figure 1).

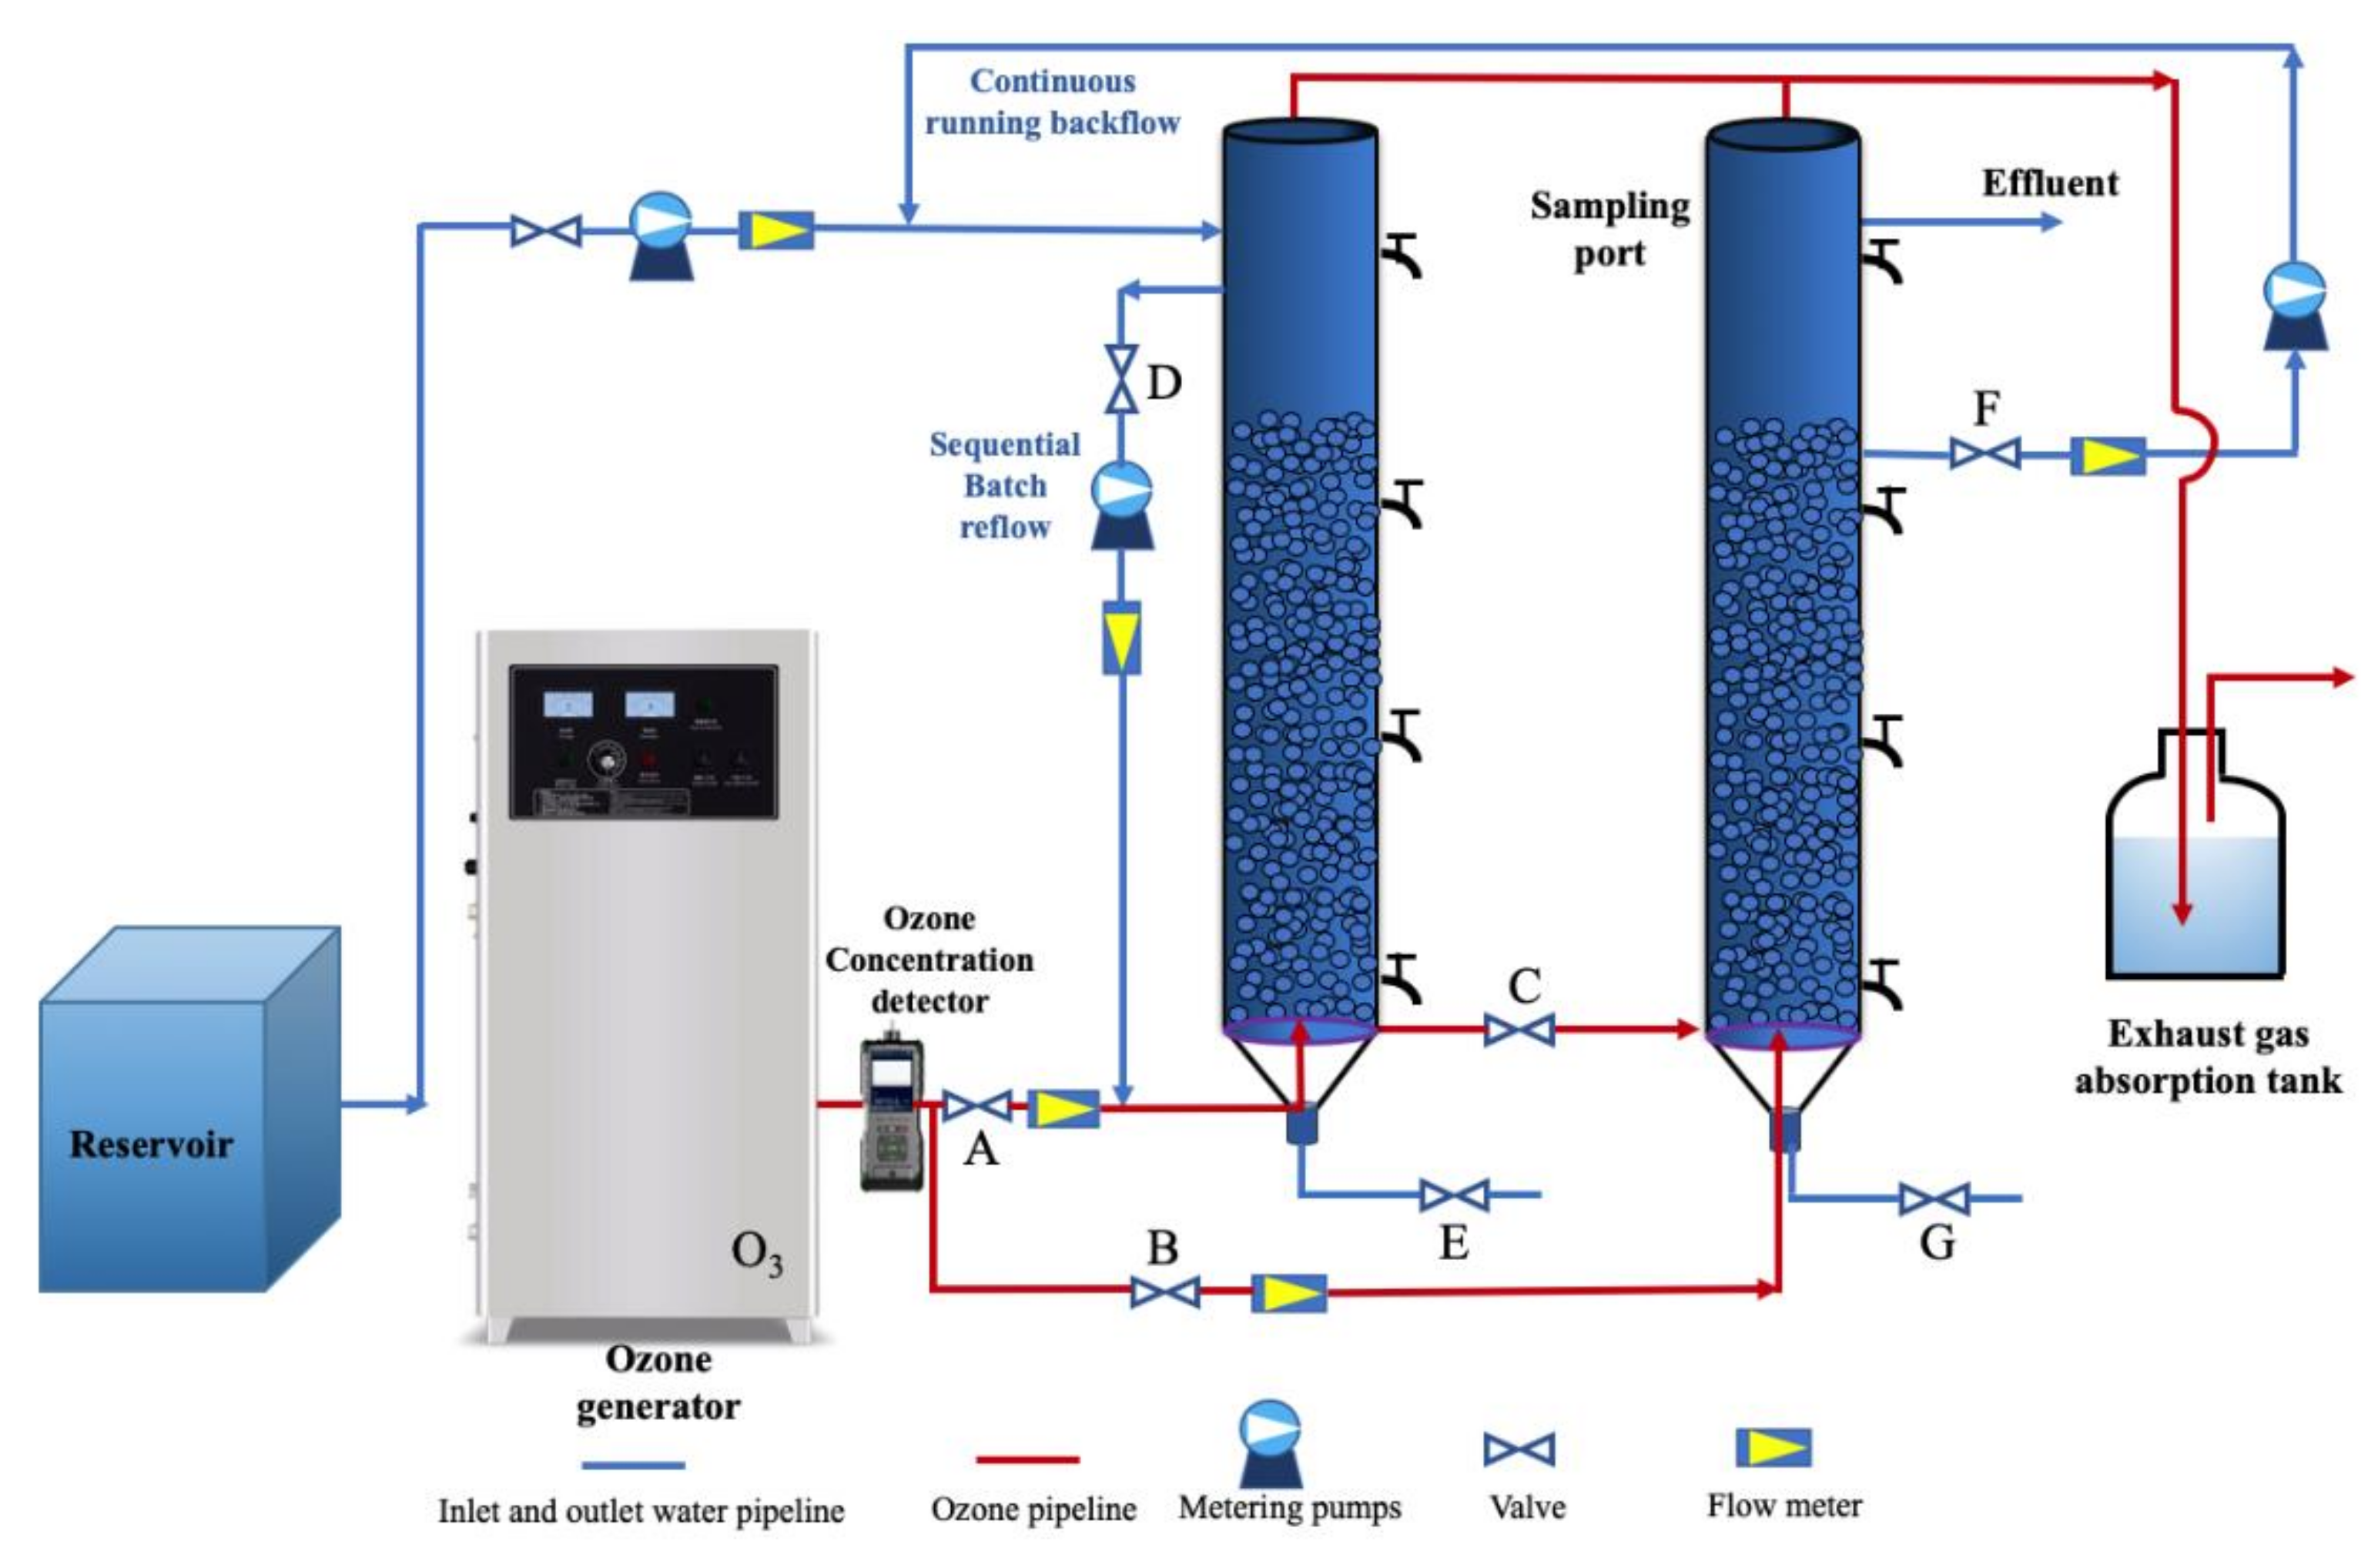
2.2. Experimental Set-Up

The pilot-scale device in this study is shown in Figure 2. Ozone production was calculated by detecting the flow rate of the gas and the concentration of ozone. A quantitative relationship was established between intake air volume of oxidation tower, generation power of ozone generator, and ozone production. The process of the pilot-scale device is shown in Figure 3. The pilot-scale device was continuously operated for 9 months under an ozone concentration of 36 mg/L and the contact oxidation time of 1 h.

2.3. Wastewater Treatment Process

The test water was taken from the secondary sedimentation tank of the petrochemical WWTP. The wastewater samples were taken once a day from the bench-sale and pilot-scale experimental reactors during the operation period. The wastewater characteristics of influent and effluent are given in Table 2.
The catalyst in this pilot-scale study was commercially bought from a Chinese company (Cathay Chemical, Co., Ltd., Dalian, China). This is a catalyst that supports heavy metals (Table 3) with γ-Al2O3 as a carrier (Figure 4). The catalysts were washed several times with milli-Q water (18.2 MΩ·cm, Millipore Corporation, Burlington, MA, USA) before use and then burned in the muffle furnace for 2 h at 600 °C to remove the impurities from the surface.
The basic characteristics of the commercial catalyst are listed in Table 4.
The catalyst was spherical with an average size of 2–4 mm. It possessed a mesoporous surface with a packed lamellar structure. SEM (scanning electron microscope) images of catalyst are presented in Figure 4.

2.4. Analytic Items and Methods

2.4.1. Water Sample Test Methods

All the chemicals (purity > 99%) used in this study were purchased from Sinopharm Chemical Reagent Co. Ltd. (Shanghai, China). The concentration of gas ozone was determined by the iodometric method [17], and the ozone in water was determined by the indigo method [18]. UV absorption at 254 nm is frequently used to monitor water quality for dissolved organic matter (DOM) removal since aromatic structures in DOM absorb UV light at 240–260 nm [19]. UV254 was measured with a UV spectrometer (Shimadzu Co. Ltd., UV-1700, Kyoto, Japan). Chemical oxygen demand (CODand suspended solids (SS) were assayed according to the Chinese State Environmental Protection Administration of China (SEPA) Standard Methods [20]. All experiments were conducted in triplicate, and the presented results are an average of replications.

2.4.2. Stability Assessment Indicators and Evaluation Criteria

In the present study, the fluctuations of the wastewater quality indicators were monitored during a specific period to evaluate the stability of the wastewater treatment system. The characteristics of time series dispersion composed of historical data of monitoring indicators are analyzed. The long-term operation stability of catalytic ozonation technology for treating petrochemical secondary effluent was evaluated [21], as a main sustainability criterion of the applied process. For this, standard-reaching rate (η) was utilized; η is an important index to evaluate the operation stability of the technical processes. In addition, according to the statistical principle, three mathematical statistics indexes, discrete coefficient (Vσ), skewness coefficient (Cso), and range coefficient (VR), are selected to evaluate the operation stability of the technology. To describe the merits and demerits of the monitoring data with time series, the four evaluation indexes are divided into different grades. Achievement rate was strictly controlled, so the other three indicators are divided into three grades: A, B, and C [22]. Among them, A means the best; B means the abnormal situation, but the degree is not high; C means the worst and unacceptable. The critical values of the three grades are determined by the discussion of several water treatment experts and the mathematical and physical characteristics of the three statistics. The classification of COD and SS of secondary effluent from the petrochemical industry by catalytic ozonation is shown in Table 5.
The definition and basic connotation of the four evaluation indicators are as follows: (1) standard-reaching rate (η) refers to the ratio of days (Ns) to total monitoring days (Nt) according to the emission concentration of pollutants specified in GB 31571-2015 for 9 months of continuous monitoring data (Equation (1)). (2) Discrete coefficient (Vσ) indicates the degree of concentration of the values monitored by each indicator in the monitoring time series around its center position (average value) (Equation (2)). (3) Skewness coefficient (Cso) refers to the deviation degree of the monitoring sample data in the monitoring time series (Equation (3)). (4) The range coefficient (VR) refers to the relative range of the maximum fluctuation value of each monitoring index in the monitoring time series (Equation (4)).
η = N s N t × 100 %
In Equation (2), Xi is the monitoring value in the effluent water quality data sample, which is the average value of the monitoring value of the index, and N is the total monitoring data sample number.
V σ = X i X ¯ 2 / N X ¯
β 3 = X i X ¯ 3 N / X i X ¯ 2 N 3
V R = X m a x X m i n X ¯
Stability is mainly determined by the size of discrete coefficients; skewness coefficients and range coefficients are complementary to describing the stability of data over time series. When the value of discrete coefficients is large, it can be found that skewness coefficients and range coefficients will increase correspondingly according to the statistical relationship among them. Therefore, the grade evaluation results of skewness coefficient and range coefficient will not be better than those of skewness coefficient. Based on this, the possible comparison of evaluation results is shown in Table 6.

3. Results and Discussion

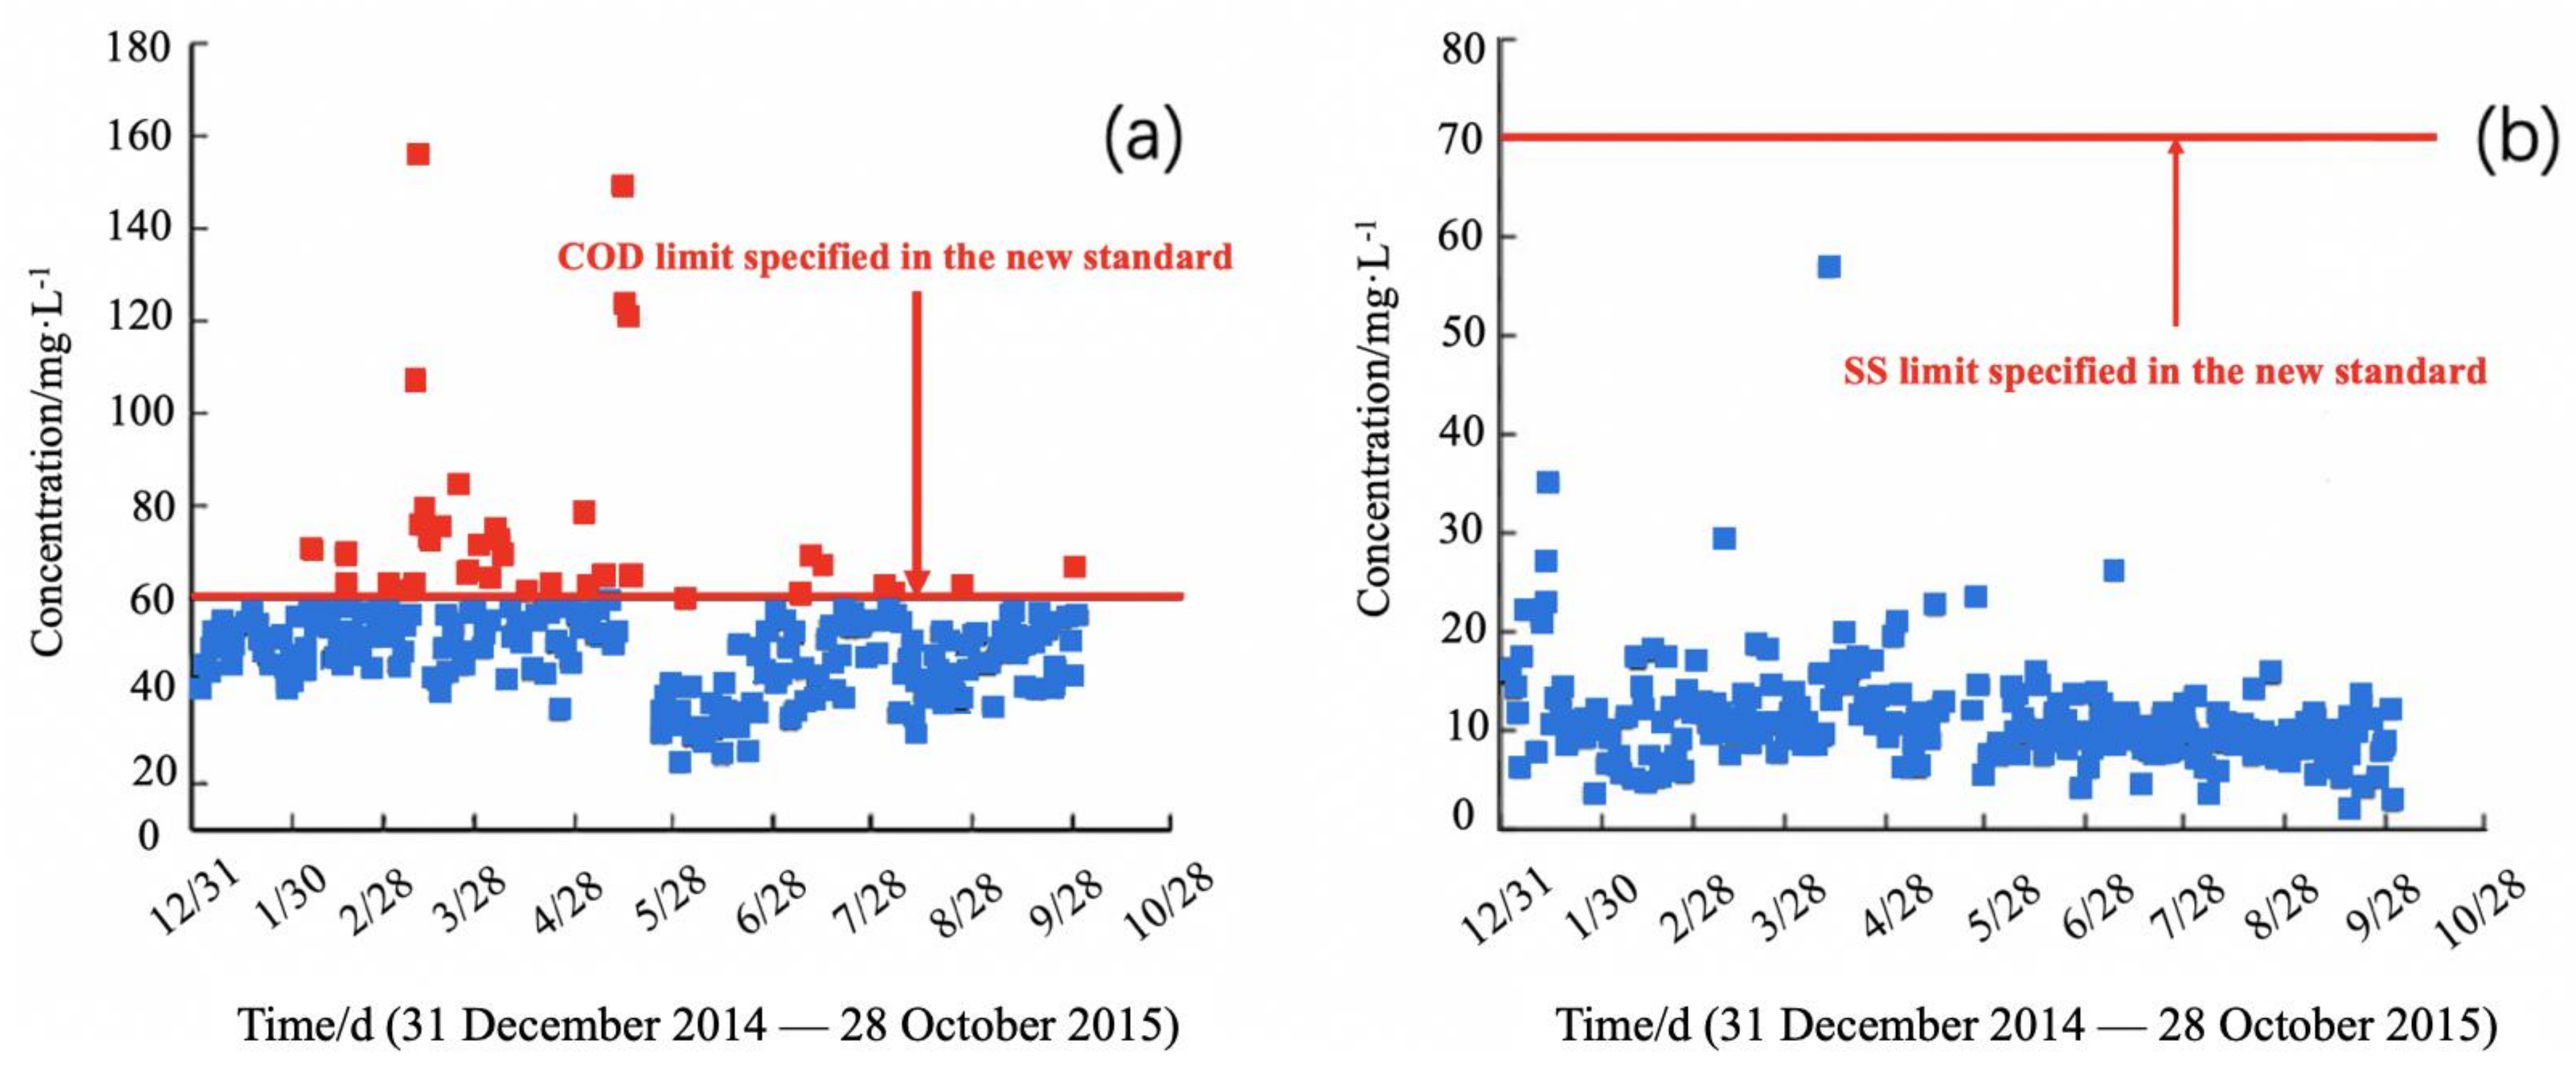
3.1. Stability Assessment

The stability of the 9-month operation of the pilot-scale device was monitored and the parameters, including the COD and SS, were measured daily. The variations in COD and SS are shown in Figure 5.
Most of the final COD values of the effluent after catalytic ozonation reached the COD limit specified in the new standard. Furthermore, the SS of the effluents during the operating period met the straight-line SS limits specified in the new standard. The evaluation results of the stability for the system are shown in Table 7 and Table 8.
In the process of catalytic ozonation treatment on secondary effluent from the petrochemical industry (Table 8), it can be seen that the stability evaluation grades of effluent COD and SS are 3, and there are similarities and differences among the four sub-indicators. The discrete coefficients of these two parameters are A, which indicates that the process is relatively stable. This treatment process can keep the values of COD and SS in a relatively stable range. The skewness coefficient of SS is C, which indicates that the average value of effluent SS is different from most SS monitoring values. Moreover, the skewness coefficient of COD is B, indicating a relatively low degree of abnormality. However, the standard-reaching rate of SS is A, which indicates that SS can meet the standard in the long-term operation process, so this index will not affect the effectiveness of this process. The evaluation grade of the range coefficient for the two parameters is C, which indicates that the maximum and minimum values of effluent differ greatly. It may be due to this fact that there are some moments when the COD and SS values of effluent are too low. The standard-reaching rate of COD is B, which indicates that the effluent COD does not meet the standard all the time and does not meet the standard of A.

3.2. Influencing Parameters

3.2.1. Reflux Ratios

Effect of Different Reflux Ratio on COD Removal by Catalytic Ozonation

The reflux ratios of 0%, 50%, 100%, 150%, 200%, 300%, and 400% were set, respectively. Under different reflux ratios, the change in influent and effluent COD is shown in Figure 6. It can be seen that, when the reflux ratio increased, the COD removal rate increased first and then decreased. When the reflux ratio was 150%, the removal rate of COD was the highest (38.2%) and the effluent COD was 49.34 mg/L. When the reflux ratio was more than 150%, the lowest COD removal per unit of ozone was 1.19 gO3/gCOD, and then it showed a decreasing trend.
The reason may be that increasing the reflux ratio makes the wastewater and catalyst mix evenly, and the ozonation effect is enhanced, thus improving the removal of COD [23]. However, when the reflux ratio continued to increase, the rapid flow rate affected the contact between the organic substances in the water and the catalyst surface, resulting in a decrease in the COD removal rate [24].

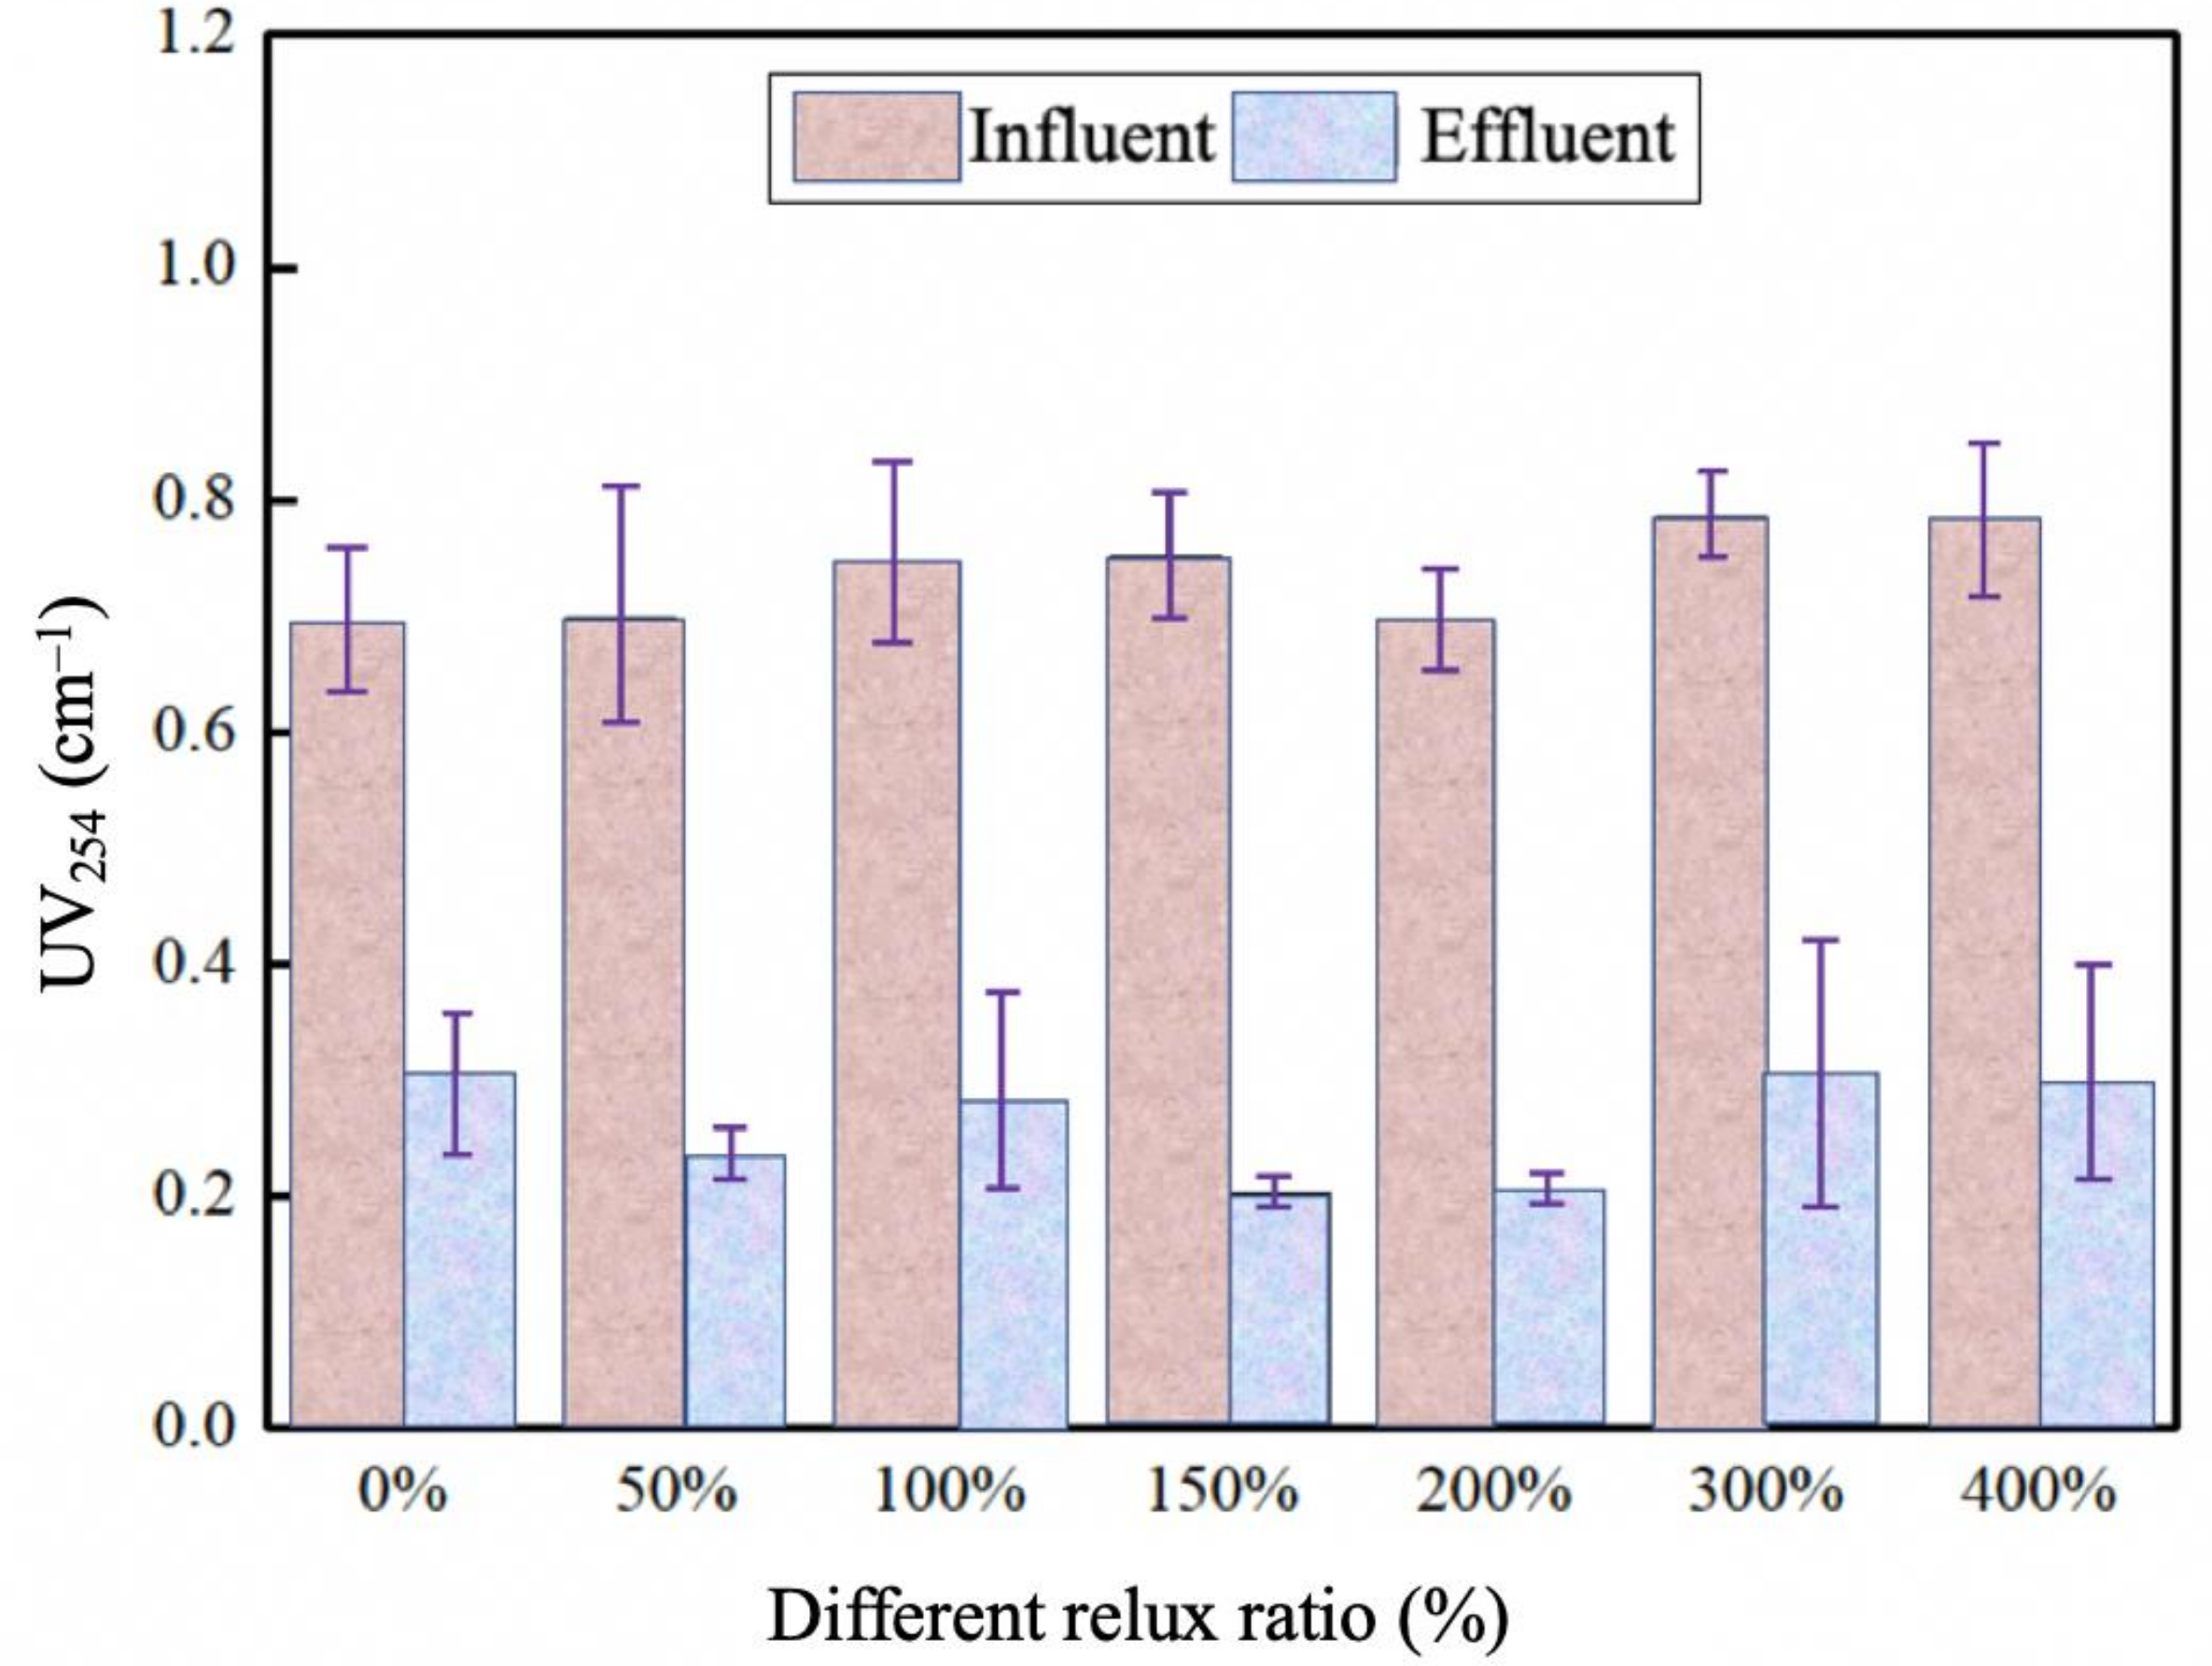
Effect of Different Reflux Ratio on UV254 by Catalytic Ozonation

UV254 is an indicator of the content of aromatic compounds in water and compounds with a conjugated double bond structure [25,26]. The indicator has the advantages of simple operation, low cost, and good reproducibility [27]. The results of UV254 variation in different reflux ratios of the sequencing batch oxidation test were shown in Figure 7. The influent UV254 fluctuation range is 0.567–0.855 cm−1. From the experimental results, ozone has a significant effect on UV254 reduction in wastewater, which is consistent with the results of Zheng et. al. [28]. Ozone and hydroxyl radical (•OH) can act on active sites, such as aromatic rings or double bonds, and oxidize and decompose refractory macromolecular substances into small molecular substances by ring-opening or breaking bonds, thereby reducing UV254.
As shown in Figure 7, increasing the reflux ratio resulted in the reduction in UV254, in which the UV254 removal without reflux was the worst. The removal efficiency of 150% reflux ratio is the best. The average UV254 of the effluent of this reflux ratio was 0.203 cm−1, and 0.547 cm−1 was removed compared with the influent.

3.2.2. Ozone Concentration

The removal of total organic carbon (TOC) under different ozone concentrations was shown in Figure 8. The experiment results showed that the removal rate of TOC shows an increasing trend with the increase in ozone concentration. When the ozone dosage was increased from 10 to 40 mg/L, the average removal rate of TOC was 55.92% and 66.27%, respectively.

3.2.3. Effect of Different SS Concentrations

The changes in influent and effluent SS concentrations are shown in Figure 5. The presence of SS results in the waste of ozone and the reduction in the ozone utilization rate, which may also lead to the COD value of effluent above the limits set in the standards [29,30,31].
The effect of influent SS on ozone depletion for the removal of per unit COD is shown in Figure 9. As the influent concentration increased, the amount of ozone depletion for the removal of per unit COD was gradually increased. When the influent SS concentration ranged from 0 to 10 mg/L, the average ozone depletion for the removal of per unit COD was 1.17 g. When the influent SS concentration became 30 to 35 mg/L, the average ozone depletion rate for the removal of per unit COD was 2.31 g. Hence, the influent SS concentration has a significant effect on catalytic ozonation. On the other hand, SS increases ozone consumption. Therefore, without increasing ozone dosage, the increase in influent SS concentration can enhance the performance of the catalytic ozonation to meet the applicable standards for the final COD.

3.2.4. Effect of Different Aeration Ratios

The ozone transfer rate and utilization rate of the two-stage aeration experiment are shown in Table 9. Among them, when the two-stage aeration ratio is 4:1, the ozone transfer rate and utilization rate are maximized. When the two-stage aeration ratio is 1:1, the primary and secondary oxidation tower have the same amount of ozone, but organic compounds are mainly removed in the primary oxidation tower. This is consistent with the removal of COD, so the ozone dosage of the secondary oxidation tower is too high and is not fully utilized. Further increasing the ozone dosage of the primary oxidation tower is beneficial to remove OMPs in the effluents. It is obvious that, under a high concentration of ozone, the decomposition of the refractory organic matter in the content of effluents is facilitated. In addition, a higher ozone dosage may lead to mineralization of the OMPs, leading to high TOC removal efficiencies.

4. Conclusions

Currently, several industries consume large amounts of raw water and produce highly polluted effluents. In this situation, industries are looking for sustainable treatment technologies to deal with the produced effluents. Stability is among the most important sustainability criteria, which can not only determine the degree of the reliability of the method but can also decrease the costs of the periodical maintenance. In the present study, the long-term operational stability of a pilot-scale catalytic ozonation system was evaluated for the treatment of secondary effluents coming from the petrochemical industry. It was found that the stability evaluation grade of COD and SS of the effluent of the system is 3, and their discrete coefficient grade is A. It was indicated that the catalytic ozonation process is feasible to treat secondary effluent from the petrochemical industry, but the process parameters need to be optimized to improve the COD standard-reaching rate of effluent. The evaluation results of COD and SS stability of the effluent coincide with the actual operation effect, which shows that the selection of evaluation index and evaluation criteria is reasonable. In the catalytic ozonation process, different reflux ratios will affect the removal rate of COD and UV254. With the increase in the reflux ratio, the COD removal rate increased first and then decreased. When the reflux ratio was 150%, the COD removal rate was the highest (38.2%) and the effluent COD was 49.34 mg/L. With the increase in ozone concentration, the removal effect of TOC improves. A low concentration of TOC is beneficial for system stability. SS exists in the water of the catalytic ozonation system, which will cause ozone waste and reduce the ozone utilization rate. The excessive SS concentration in the influent will also result in the system effluent COD not meeting the standard. Moreover, the ozone transfer rate and utilization rate are different when the two-stage aeration ratio changes. The two-stage aeration ratio for the best experimental effect is 4:1. Finally, it is suggested for future studies to use the filtration system before the catalytic ozonation to reduce the influence of SS on the catalytic ozonation system. Moreover, it is recommended for future studies to implement the analytical methods developed in this study to evaluate the stability of the catalytic ozonation process and other AOPs in real and large-scale wastewater treatment plants.

Author Contributions

Conceptualization, S.Z. and H.W.; methodology, S.Z., H.W. and Y.Z.; software, S.Z. and M.K.; validation, H.W., Y.Z., X.H., Y.X., M.K. (Mohammadreza Khalaj) and M.K. (Mohammadreza Kamali); formal analysis, S.Z., X.H., and Y.X.; investigation, S.Z., H.W., M.K. (Mohammadreza Khalaj) and Y.Z.; resources, S.Z., H.W., Y.Z., X.H. and Y.X.; data curation, S.Z., X.H. and Y.X.; writing—original draft preparation, S.Z.; writing—review and editing, M.K. (Mohammadreza Khalaj) and M.K. (Mohammadreza Kamali); visualization, S.Z.; supervision, M.K. (Mohammadreza Kamali). All authors have read and agreed to the published version of the manuscript.

Funding

This research was funded by “The National Water Pollution Control and Treatment Science and Technology Major Project of China (2017ZX07402002-05-02)”. Mohammadreza Kamali holds a postdoctoral research grant awarded by the Research Council of KU Leuven [PDM/19/104]. Thanks alre also due to the Financial Support of CESAM–Centre for Environmental and Marine Studies, POCI-01-0145-FEDER-007638 (FCT Ref. UID/AMB/50017/2020)” and “The Project CICECO-Aveiro Institute of Materials, UIDB/50011/2020 & UIDP/50011/2020, which was funded by National Funds through The Portuguese Foundation for Science and Technology /MCTES and The Co-funding by the FEDER, within the PT2020 Partnership Agreement and Compete 2020”.

Institutional Review Board Statement

Not applicable.

Informed Consent Statement

Not applicable.

Acknowledgments

Siyu Zhang holds a joint-PhD grant awarded by the China Scholarship Council (CSC) [grant number 202006430047]. Thanks are also due to FCT for the doctoral scholarship No. SFRH/BD/140873/2018 for the sixth author (M. Khalaj). Thanks are also due to the financial support from the PDM program, KU Leuven (M. Kamali).

Conflicts of Interest

The authors declare no conflict of interest.

References

  1. Yaqoob, A.A.; Parveen, T.; Umar, K.; Mohamad Ibrahim, M.N. Role of nanomaterials in the treatment of wastewater: A review. Water 2020, 12, 495. [Google Scholar] [CrossRef] [Green Version]
  2. Ministry of Environmental Protection of the People’s Republic of China (MEPPRC). Emission of Pollutants in Petrochemical Industry; Ministry of Environmental Protection of the People’s Republic of China (MEPPRC): Beijing, China, 2015.
  3. Yaqoob, A.A.; Mohd Noor, N.H.B.; Serrà, A.; Ibrahim, M.N.M. Advances and Challenges in Developing Efficient Graphene Oxide-Based ZnO Photocatalysts for Dye Photo-Oxidation. Nanomaterials 2020, 10, 932. [Google Scholar] [CrossRef] [PubMed]
  4. Sui, M.; Sheng, L.; Lu, K.; Tian, F. FeOOH catalytic ozonation of oxalic acid and the effect of phosphate binding on its catalytic activity. Appl. Catal. B Environ. 2010, 96, 94–100. [Google Scholar] [CrossRef]
  5. Yaqoob, A.A.; Ibrahim, M.N.M.; Ahmad, A.; Reddy, A.V.B. Toxicology and Environmental Application of Carbon Nanocomposite. In Environmental Remediation through Carbon Based Nano Composites; Springer: Berlin/Heidelberg, Germany, 2021; pp. 1–18. [Google Scholar]
  6. Umar, K.; Yaqoob, A.A.; Ibrahim, M.N.M.; Parveen, T.; Safian, M.T. Environmental applications of smart polymer composites. In Smart Polymer Nanocomposites: Biomedical and Environmental Applications; Bhawani, S.A., Khan, A., Jawaid, M., Eds.; Elsevier: Amsterdam, The Netherlands, 2021; pp. 295–312. ISBN 978-0-12-819961-9. [Google Scholar]
  7. Zhou, X.; Li, Y.; Zhao, Y.; Yue, X. Pilot-scale anaerobic/anoxic/oxic/oxic biofilm process treating coking wastewater. J. Chem. Technol. Biotechnol. 2012, 88, 305–310. [Google Scholar] [CrossRef]
  8. Fu, L.; Wu, C.; Zhou, Y.; Zuo, J.; Song, G.; Tan, Y. Ozonation reactivity characteristics of dissolved organic matter in secondary petrochemical wastewater by single ozone, ozone/H2O2, and ozone/catalyst. Chemosphere 2019, 233, 34–43. [Google Scholar] [CrossRef]
  9. Geng, C.J.; Pu, W.J.; Gao, W.; Wang, H.W.; Zhong, D.H.; Rao, H.K. Pilot study on treatment of secondary effluent of sewage treatment plant by ozone catalytic oxidation. Sci. Technol. Chem. Ind. 2016, 24, 44–46. [Google Scholar]
  10. Cui, D.; Pang, C.L.; Kong, X.Z.; Chen, X.; Li, A.; Ma, F.; Yang, J.X. Application of ozone/photocatalytic oxidation to advanced treatment of printing and dyeing wastewater. China Water Wastewater 2013, 29, 114–116. [Google Scholar]
  11. Chu, J.Y.; Chen, J.N.; Wang, C.; Fu, P. Wastewater reuse potential analysis: Implications for China’s water resources management. Water Res. 2004, 38, 2746–2756. [Google Scholar] [CrossRef]
  12. Wang, M. Study on the Nitrogen Removal of Anaerobic Ammonia Oxidation in Oil Refinery Wastewater. Master’s Thesis, Beijing University of Technology, Beijing, China, 2016. [Google Scholar]
  13. Andrés-Doménech, I.; Montanari, A.; Marco, J.B. Efficiency of Storm Detention Tanks for Urban Drainage Systems under Climate Variability. J. Water Resour. Plan. Manag. 2012, 138, 36–46. [Google Scholar] [CrossRef]
  14. Kamali, M.; Costa, M.E.; Aminabhavi, T.M.; Capela, I. Sustainability of treatment technologies for industrial biowastes effluents. Chem. Eng. J. 2019, 368, 474–494. [Google Scholar] [CrossRef]
  15. Guerrero, J.; Guisasola, A.; Comas, J.; Rodríguez-Roda, I.; Baeza, J.A. Multi-criteria selection of optimum WWTP control set-points based on microbiology-related failures, effluent quality and operating costs. Chem. Eng. J. 2012, 188, 23–29. [Google Scholar] [CrossRef]
  16. Martínez, S.A.; Rodríguez, M.G.; Morales, M.A. Stability Analysis of an Activated Sludge Bioreactor at a Petrochemical Plant at Different Temperatures. Int. J. Chem. React. Eng. 2006, 3, 1–7. [Google Scholar] [CrossRef]
  17. Ødegaard, H.; Skrøvseth, A.F. An evaluation of performance and process stability of different processes for small wastewater treatment plants. Water Sci. Technol. 1997, 35, 119–127. [Google Scholar] [CrossRef]
  18. Rakness, K.; Gordon, G.; Langlais, B.; Masschelein, W.; Matsumoto, N.; Richard, Y.; Robson, C.M.; Somiya, I. Guideline for Measurement of Ozone Concentration in the Process Gas from an Ozone Generator. Ozone Sci. Eng. 1996, 18, 209–229. [Google Scholar] [CrossRef]
  19. Bader, H.; Hoigné, J. Determination of ozone in water by the indigo method. Water Res. 1981, 15, 449–456. [Google Scholar] [CrossRef]
  20. Zhou, Q.; Cabaniss, S.E.; Maurice, P.A. Considerations in the use of high-pressure size exclusion chromatography (HPSEC) for determining molecular weights of aquatic humic substances. Water Res. 2000, 34, 3505–3514. [Google Scholar] [CrossRef]
  21. State Environmental Protection Administration of China (SEPA). Monitoring and Analysis Methods of Water and Wastewater, 4th ed.; Environmental Science Press: Beijing, China, 2002.
  22. Namguk, H.; Gray, A.; David, F.; Jaeweon, C. Varations of molecular weight estimation by HP-size exclusion chromatography with UVA versus online DOC detection. Environ. Sci. Technol. 2002, 36, 3393–3399. [Google Scholar]
  23. Su, W.; Du, P.F.; Chen, J.N. Preliminary Study on Evaluation Method of Operational Stability of Urban Sewage Treatment Plant. Environ. Pollut. Control Technol. Equip. 2005, 6, 85–87. [Google Scholar]
  24. Shi, X.L.; Hu, X.B.; Wang, Z.; Ding, L.L.; Ren, H.Q. Effect of reflux ratio on COD and nitrogen removals from coke plant wastewaters. Water Sci. Technol. 2010, 61, 3017–3025. [Google Scholar] [CrossRef]
  25. Wu, C.; Zhou, Y.; Sun, X.; Fu, L. The recent development of advanced wastewater treatment by ozone and biological aerated filter. Environ. Sci. Pollut. Res. 2018, 25, 8315–8329. [Google Scholar] [CrossRef]
  26. Altmann, J.; Massa, L.; Sperlich, A.; Gnirss, R.; Jekel, M. UV254 absorbance as real-time monitoring and control parameter for micropollutant removal in advanced wastewater treatment with powdered activated carbon. Water Res. 2016, 94, 240–245. [Google Scholar] [CrossRef] [PubMed]
  27. Wert, E.C.; Rosario-Ortiz, F.L.; Snyder, S.A. Using ultraviolet absorbance and color to assess pharmaceutical oxidation during ozonation of wastewater. Environ. Sci. Technol. 2009, 43, 4858–4863. [Google Scholar] [CrossRef] [PubMed] [Green Version]
  28. Liu, Y.; Sheng, F.; Chen, W.T. Indication of UV254 in the treatment of coal gasification wastewater. J. Environ. Eng. 2015, 9, 1809–1814. [Google Scholar]
  29. Zheng, X.Y.; Wang, X.L.; Li, X.X. Study on advanced treatment of effluent from advanced treatment by ozone oxidation. China Environ. Sci. 2014, 5, 1159–1165. [Google Scholar]
  30. Zhang, S.; Wu, C.; Zhou, Y.; Wang, Y.; He, X. Effect of wastewater particles on catalytic ozonation in the advanced treatment of petrochemical secondary effluent. Chem. Eng. J. 2018, 345, 280–289. [Google Scholar] [CrossRef]
  31. Tian, X.M.; Song, Y.D.; Shen, Z.Q.; Zhou, Y.X.; Wang, K.J.; Jin, X.G.; Zhen, Z.F.; Liu, T. A comprehensive review on toxic pet-rochemical wastewater pretreatment and advanced treatment. J. Clean Prod. 2019, 245, 118692. [Google Scholar] [CrossRef]
Figure 1. A schematic of the wastewater origin and the treatment process of the WWTP.
Sustainability 14 02200 g001
Figure 2. Pilot-scale experimental set-up used for the stability assessments.
Sustainability 14 02200 g002
Figure 3. The schematic of the catalytic ozonation process implemented in the present study.
Sustainability 14 02200 g003
Figure 4. SEM images of the catalyst used in the catalytic ozonation treatment of the effluents (up), and the X-ray energy spectrum analysis of catalyst composition (SEM-EDS) (down).
Sustainability 14 02200 g004
Figure 5. Variation of the COD (a) and the SS (b) of the effluent after treatment with the catalytic ozonation process.
Sustainability 14 02200 g005
Figure 6. The variation in influent and effluent COD values under different reflux ratios.
Sustainability 14 02200 g006
Figure 7. UV254 values of influent and effluent at different reflux ratios.
Sustainability 14 02200 g007
Figure 8. TOC removal using the implemented set-up under different ozone dosages.
Sustainability 14 02200 g008
Figure 9. Ozone consumption per g COD removal under different influent suspended solid concentrations.
Sustainability 14 02200 g009
Table 1. The wastewater type and volume entering the wastewater treatment plant.
No.Effluent SourceWater Volume (m3/h)COD (mg/L)COD
(g/h)
1The wastewater of the dye factory227.14662.46150,471.16
2The wastewater of fertilizer plant90.352179.39196,907.89
3The wastewater of acrylonitrile plant370.79394.03146,102.38
4The wastewater of calcium carbide plant221.891485.1329,528.84
5Organic wastewater of calcium carbide plant201.271223.79246,312.21
6Glycol wastewater of glycol plant70.59612.9543,268.14
7Ethylene oxide wastewater of glycol plant31.09376.5211,706.01
8The wastewater of the organic synthesis plant545.66374.56204,382.41
9The wastewater of refinery plant1089.54412.41449,337.19
10The wastewater of synthetic resin plant176.77409.1172,318.37
11The wastewater of fine chemicals factory11.76566.566662.75
12Lusheng pesticide factory11.061281.7914,176.60
13CITIC Chemical Co., Ltd. wastewater5.442049.6411,150.04
14Yingtai Chemical Co., Ltd.0.732049.641496.24
15Fu Landa Chemical Co., Ltd.0.3526.919.42
16Zongheng Plastic Packaging Co., Ltd.5.27411021,659.70
17Northern cleaning12.09179.62171.36
18Entering industry and trade0.05120.776.04
19Bei Dagou municipal drainage350.0024084,000.00
20Industrial park drainage84.4422518,999.00
21Buried plant permeate10.00130013,000.00
22805, 806 tank drainage100.00505000.00
23Domestic waste heaping plant permeate0.0000.00
24Domestic sewage1412.28224.57317,155.72
25Ash dam drainage100.0012012,000.00
26Fertilizer plant containing nitrogen water100.0015015,000.00
Subtotal5228.56453.842,372,921.47
New wastewater volume (Standardization)767.76318.8244,763.40
Direct drainage water consumption4733014,190
Total displacement6469.32406.832,631,874.87
Table 2. Characteristics of the effluents (1-year average).
ItemsCOD (mg/L)TOD (mg/L)BOD5 (mg/L)NH4+-N (mg/L)TN (mg/L)TP (mg/L)SS (mg/L)
Secondary effluent before catalytic ozonation84.7 ± 20.926.0 ± 8.905.22 ± 0.621.22 ± 2.8513.6 ± 2.110.90 ± 0.2526.6 ± 12.4
GB 8978-1996 *100-3015-0.570
GB 31571-2015 **60 (50)20 (15)20 (10)5300.550
* The Level A limited concentration; ** the values in parentheses are special limited concentration.
Table 3. The energy-dispersive X-ray spectroscopy (EDS) of the catalyst element composition.
ElementAppIntensityWeight %Weight %Atomic %
Conc.Corrn.Sigma
O29.060.844343.460.4859.19
Mg0.150.76290.250.060.23
Al29.550.846644.060.4335.59
S0.760.72361.320.130.90
Cl0.910.67911.700.151.04
K1.020.97491.320.150.73
Ca2.110.94662.820.161.53
Ce3.250.81015.070.480.79
Table 4. The characteristics of the commercial catalyst used in the present study for the catalytic ozonation process.
ItemUnitValue
Particle sizemm2~4
Densityg/mL0.66
Specific surface aream2/g206.9
Void volumecm3/g0.47
Compressive strengthN/particle137
Wear rate%0.31
Water absorption%47
Qualified size%94
Major catalytic component-Activated alumina as a carrier; the ingredients are a trade secret
Years of useyear≥6
Table 5. Criteria for evaluation of the COD and SS stability of catalytic ozonation process.
Degreeη V σ C s o V R
Aη = 100% V σ ≤ 0.5 C s o ≤ 0.5 V R ≤ 1
Bη < 100%0.5 < V σ ≤ 10.5 < C s o ≤ 31 < V R ≤ 1.5
C- V σ > 1 C s o > 3 V R > 1.5
Table 6. The outcome of the stability assessments of the implemented catalytic ozonation process.
No.ηVσCsoVREvaluation Result
1AAAA1
2AAAB1
3AAAC2
4AABA1
5AABB2
6AABC2
7AACA2
8AACB3
9AACC3
10ABBB3
11ABBC4
12ABCB3
13ABCC4
14ACCC4
15BAAA3
16BAAB3
17BAAC3
18BABA3
19BABB3
20BABC3
21BACA3
22BACB4
23BACC4
24BBBB4
25BBBC4
26BBCB4
27BBCC4
28BCCC4
Remarks(1) Evaluation result 1 means the water quality of long-term running effluent meets the standard and has good stability. The time series are concentrated near the average value, and there is no abnormal value.
(2) Evaluation result 2 means the water quality of long-term operation effluent meets the standard and has good stability. Most of the values are relatively concentrated, some values are abnormal, or the values are evenly dispersed
(3) Evaluation result 3 means, in the long-term operation process, the effluent quality may not meet the standard, the operation stability may be general, the time series is scattered, and there are many abnormal values.
(4) Evaluation result 4 means, in the long-term operation process, there must be a situation that the effluent quality cannot meet the standard. The operation stability is poor and the time series dispersion is high.
Table 7. Evaluation results of stability of the catalytic ozonation of the effluents.
Contaminantsη V σ β 3 V R
COD92.6%0.373.003.14
SS100%0.463.754.82
Table 8. Stability evaluation results of catalytic ozonation process used for the treatment of the effluents in the present study.
Contaminantsη V σ β 3 V R Evaluation Result
CODBABC3
SSAACC3
Table 9. Ozone transfer and utilization rates of the implemented two-stage process.
Aeration RatioOzone in Water
(mg/L)
Ozone in the Exhaust Gas
(>mg/L)
Ozone Concentration
(mg/L)
Transfer Rate
(%)
Utilization Rate
(%)
1:10.210.823696.5998.50
2:10.120.603697.4999.37
3:10.190.553697.6999.12
4:10.190.503697.9098.72
5:10.340.603697.4198.52
Publisher’s Note: MDPI stays neutral with regard to jurisdictional claims in published maps and institutional affiliations.

