Article

Development and Experiments on a Batch-Type Solar Roaster—An Innovative Decentralized System for Coffee Roasting

1
Department of Agricultural and Biosystems Engineering, University of Kassel, D-37213 Witzenhausen, Germany
2
Department of Agricultural Engineering, Bahauddin Zakariya University, Multan 60800, Pakistan
3
Department of Farm Machinery and Precision Engineering, Faculty of Agricultural Engineering and Technology, Pir Mehr Ali Shah-Arid Agriculture University, Rawalpindi 46300, Pakistan
4
Department of Energy Systems Engineering, University of Agriculture Faisalabad, Faisalabad 38000, Pakistan
*
Author to whom correspondence should be addressed.
Sustainability 2022, 14(4), 2217; https://doi.org/10.3390/su14042217
Submission received: 24 January 2022 / Revised: 10 February 2022 / Accepted: 12 February 2022 / Published: 15 February 2022
(This article belongs to the Special Issue Sustainable Agricultural Engineering Technologies and Applications)

Abstract

:
About 70% of the harvested coffee is exported to the industrialized nations for value addition due to lack of processing and logistic facilities in developing coffee producer countries, thus leaving behind a marginal economic return for the growers. This research was conducted to investigate the roasting capacity of an innovatively developed batch-type directly solar radiated roasting system for the decentralized processing of coffee using solar energy. Central composite rotatable design (CCRD) was employed to design the experiments to optimize the coffee roasting process. Experimental results revealed that with an average solar direct normal irradiance (DNI) of 800 W/m2, the roaster was capable of roasting a batch of 2 kg coffee beans in 20, 23, and 25 min subjected to light roasts, medium roasts, and dark roasts, respectively at a drum speed of two revolutions per minute (rpm). The batch-type solar roaster has the capacity to roast 28.8–36 kg of coffee beans depending on dark to light roasting conditions on a clear sunny day with DNI ranging from 650 to 850 W/m2. The system thermal efficiency during coffee roasting was determined to be 62.2%, whereas the roasting efficiency at a corresponding light roast, medium roast, and dark roast was found to be 97.5%, 95.2%, and 91.3%, respectively. The payback period of the solar roaster unit was estimated to be 1038 working sunshine hours, making it viable for commercialization.

1. Introduction

Coffee (Coffea spp.) is widely cultivated throughout the tropical regions comprising more than 70 species, all of them originating from Africa. Among them, Arabica (Coffea arabica, 64% of world production) and Robusta (Coffea canephora, var. Robusta, 35%) are economically important varieties that are being grown worldwide on an estimated area of 10.3 million hectares and represent the sole economic income for more than 25 million families of the developing world [1,2]. In 2021, about 11.08 million US tons (MT) of coffee were being produced, but a majority of this produce (7.75 MT) was imported by the industrialized countries in perishable bean form for value additions due to the lack of processing and logistic facilities in developing coffee producer countries who were able to export only 1.45 MT processed coffee (roasted and ground, and soluble) form, offering a very marginal economic benefit to them [3]. The escalating fossil fuel prices further burden up the cost of processing for existing facilities in producer countries, especially in those rural and far-flung farm areas where centralized grid connections are not available and even if available, only the populated areas are connected to the transmission lines for meeting only the domestic needs, while the majority of the agricultural processing operations are carried out at farmlands away from residential areas of the villages [4]. The individual villages are small socioeconomic units but often underappreciated in centralized energy planning models due to the higher cost of infrastructure and transmission lines for scattered populations, which ultimately uplift the overall consumption of carbon-based fuels and lead to environmental degradation. This whole scenario overburdens the deprived farmers and indirectly enforces them to sell their perishable agricultural produce in the local markets without adding any remarkable value, thus returning them a meagre profit [4,5]. Therefore, there is a dire need to devise sustainable solutions for the coffee growers that simultaneously can address their energy-deficient scenario and upsurges decentralized coffee processing facilities in a scientific manner using their local renewable resources, i.e., solar.
With the development of state-of-the-art technologies, immensely available solar power can be utilized for adding value to green coffee beans [6]. In adding value to the coffee, roasting is an energy-intensive unit operation in which green coffee beans are exposed to heat treatment at high temperatures over 200 °C for a specific time to attain color, aroma, and taste [7]. The roasting process is comprised of three main phases viz., drying, roasting, and cooling during which heat and mass transfer occur inside the coffee beans by means of convection and conduction mechanisms. Consequently, with the increase in temperature, various physical and chemical changes take place inside the beans including exothermic reactions and water evaporation that results in the development of color, aroma, and taste characteristics of the coffee [8,9]. The heat energy is used to evaporate the water in the early stages of the roasting process [10]. The rate of evaporation is high in the beginning and then slows down gradually toward the end of the roasting process. Several investigations have been made to determine the heat transfer properties in coffee during roasting. The specific heat of Green Arabica’s was determined and reported as 1.85 Jg−1 °C−1 in beans with 7.5% humidity, which is slightly higher than the specific heat of Robusta’s (1.46 Jg−1 °C−1) containing 4.5% humidity whereas, in the roasted coffee bean, it was also 1.46 Jg−1 °C−1 at 2.5% humidity [11,12]. The degrees of roasting are controlled by roasting time and temperature, which are necessary for the required chemical reactions without burning the beans and compromising the flavor of the beverage [13] and were qualitatively assessed for color and classified as a light, medium, or dark roast [14,15]. Achieving an ideal roast is a goal that is complicated, since coffee beans behave differently and produce distinct results in physical properties, chemical composition, and biological activities when roasted under different conditions [16].
Traditional methods for roasting coffee beans use large iron pans that were exposed to fire by burning coals. The slender spoon was used for the mixing of coffee beans during roasting [17]. These conventional coffee roasting techniques are uncontrolled, energy-wasting, inefficient, and time consuming. Technological efforts have been increasingly made in recent years for developing sophisticated technologies for coffee roasting to produce coffee of the same quality as coffee using the manual roasting method [18]. Considering coffee roasting methods, generally, the batch or continuous roasting systems have employed that transfer the heat to the beans by direct contact with hot metal surfaces (conduction) or through hot air streaming media (convection), or by radiation [19]. Drum-type roasters comprising a rotating cylinder design are widely used roasting systems in which heat is provided through hot air to the coffee beans inside the cylinder through the perforated wall or from the center of the cylinder to ensure homogeneity of the roast. One of the recent developments in coffee roasting technology is fluidized bed roasting [20] in which high-velocity hot gas is directed toward the beans, usually from the bottom of the roasting machine, so that the gases heat and move the floating beans simultaneously. Industrial coffee roasters either use a gas-fired revolving oven, in batch type or continuous roasters for controlling the temperature, feeding rate, and time during the roasting process to achieve uniformly roasted coffee. However, all these large-scale roasters are not economically affordable by small and medium-level coffee farmers, rising costs for fossil fuel further increases roasting costs that turned the mindset to think out of the box for exploring the sustainable ideas of energy production.
Although the potential of solar thermal energy is vast in tropical regions that provide the most favorable conditions to address the high-temperature post-harvest processing facilities, unfortunately, the utilization of this extensive potential is mainly limited to low-temperature processing operations such as the drying of agricultural products [21,22]. Beyond the low-temperature applications, the roasting of different agricultural products is a promising field in the developing countries of tropical regions. The daily average DNI ranging from 5.5 to 7.5 kWh/m2 with yearly sunshine of more than 300 days [23] provides an excellent opportunity for the development of innovative technologies to meet this challenging and need-based assignment. Up to now, there has been very little work on the value addition of post-harvest using solar thermal energy moving toward medium to the high-temperature range for the processing of perishable agricultural products [24] and roasting of nuts and beans [6,25,26]. This massive solar potential can be utilized through decentralized applications of solar thermal energy especially in rural areas through the development of innovative solar technologies for decentralized applications in coffee processing, which can scale up the farm-gate processing facilities for coffee growers of tropics.
In recent years, many innovative solar heat tapping devices such as parabolic trough (line focus), linear Fresnel (line focus), parabolic dish (point focus), and heliostat field (point focus) were introduced, but they are rarely applied for industrial purposes. There are also fixed focus and tracking problems present in them [27]. Among the available solar concentrating technologies, the Scheffler fixed-focus concentrator is the best suitable option for generating heat energy in medium to the high-temperature range with a variety of reflector sizes ranging from 2 to 60 m2 [28,29,30]. The versatility of the Scheffler reflector is the fixed focus at the targeted position by automatically tracking the sun, which provides a uniform temperature distribution on the focus point throughout the day. At the focus point, a temperature up to 700 °C is achievable depending on the size of the Scheffler reflector [21,31]. The development and coupling of innovative solar concentrating devices in the medium to high-temperature range had opened new landmarks for decentralized processing of agricultural products such as roasting coffee.
Acknowledging all the above-cited literature, this research initiative has been taken to develop an on-farm coffee roasting system that is capable of roasting coffee of 1–3 kg batch capacity by using a Scheffler solar concentrator (8 m2) that focuses on direct normal irradiance (DNI) throughout the day by a photovoltaic-driven gear motor-tracking mechanism to achieve maximum available temperature on the roasting drum. The extensively used tool for the optimization of food processes is Response Surface Methodology (RSM), which has been incorporated in research methodology for investigating roaster optimum operational parameters i.e., roasting time, drum rotational speed, and feeding capacity for achieving a light, medium, and dark-roasted coffee in comparison with industrial roasters coffee quality. The developed roaster had probed into the possibility of shifting the roasting process to solar thermal energy, thereby providing a decentralized cost-effective solution by negating the environmental impact. Alternative resources of non-carbon-based energies are the only futuristic, viable, and long-lasting alternatives. Coffee roasting using an unlimited vast source of solar energy would be the most simplistic tool for the efficacious on-farm roasting, which is easily operable by the unschooled coffee farmers for greater socio-economic benefit.

2. Materials and Methods

2.1. Experimental Setup and Data Acquisition

The solar batch-type roasting machine was equipped with a pyranometer and thermocouples (K-types) via a data logger attached to the computer. The data were recorded in 10 s time intervals during roasting experiments. Thermocouples were connected with the roaster drum to measure the focus temperature, drum air temperature, and coffee beans temperature throughout the roasting experiments. The pyranometer was fixed at the Scheffler reflector for continuously facing the sun through a black pipe of length 100 mm fixed on it for only allowing to record the direct normal irradiance (DNI). The Scheffler concentrator was mounted with a daily tracking mechanism working on an automatic photovoltaic (PV) sun tracking system comprised of a PV-powered direct current (DC) gear motor and for the seasonal adjustments due to the sun declination angle throughout a year, the manually adjusted telescopic clamps were installed to precisely focus the DNI onto the roasting drum. Moisture content (MC) was determined at various stages of roasting by evaluating samples (100 g each) collected in an airtight container to prevent moisture and foreign contamination. The process for determining the MC of roasted and green beans was in accordance with the method (925.09) specified in the Official Methods by Analytical Chemists (AOAC) [32]. To determine the color parameters of green, light roast, medium roast, and dark roast coffee beans (Coffea arabica L.), a colorimeter Konica Minolta CR400 (Osaka, Japan) was used. The colorimeter has been calibrated before every single measurement by standard tile (i.e., white). The measured values per coffee beans sample were averaged to describe the color parameters of coffee beans within the CIELab color space. The coordinates of the experimental site for roasting were 51°20′45.76″ N (latitude), 9°51′52.08″ E (longitude) from a mean sea level elevation of 137 m. Figure 1 illustrates a solar coffee roasting system.

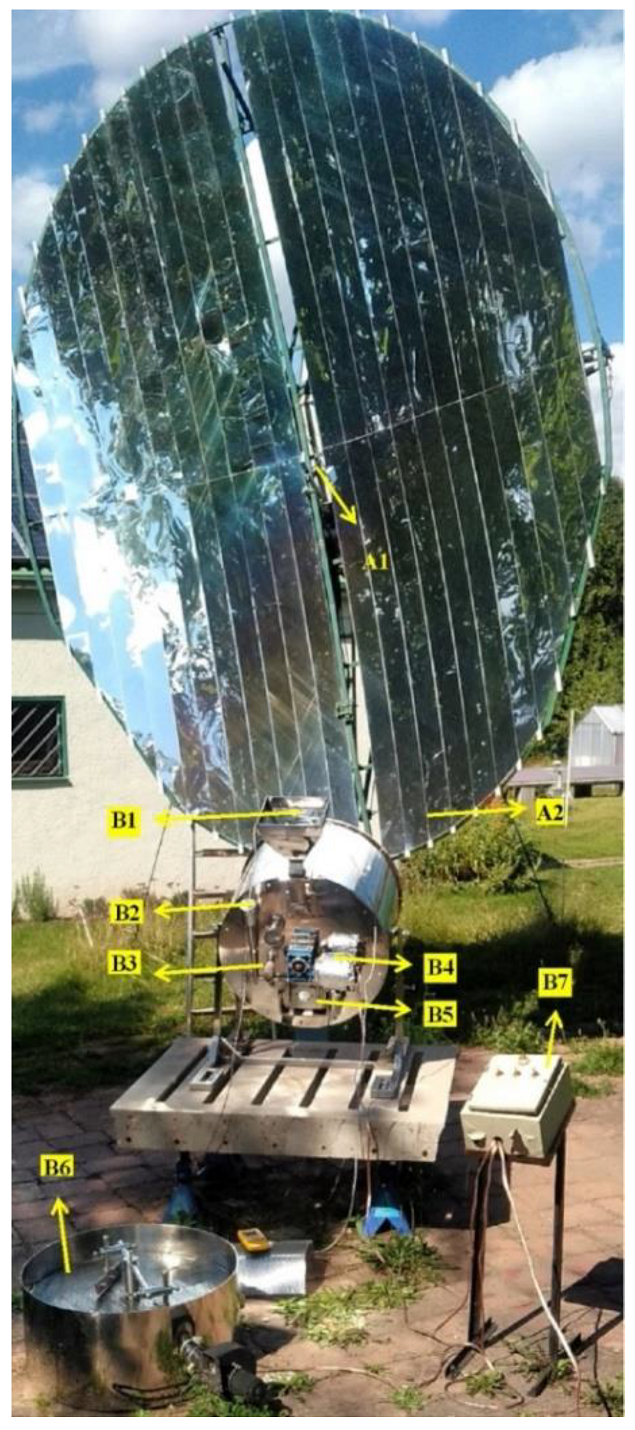
2.2. Description and Working Mechanism of Solar Batch-Type Roaster

The development work of the batch-type solar roasting machine consists of a technical drawing for designing a roaster, development of various roaster components, material selection for various components of the roaster, and experimental test on the newly constructed roaster. The whole roasting unit was fabricated using stainless steel material. The size (diameter × length) of the roasting cylinder was set at 400 mm × 400 mm. A gear motor was installed for rotating the drum during the process. The rotating drum brings the conduction process quite high during roasting. The solar roasting machine uses the most efficient heat transfer conduction process for coffee beans roasting by the drum rotating technique. In this type, the coffee beans are fetched into the cylindrical-shaped chamber called a roasting drum. As the drum rotates, it mechanically fluidizes the coffee beans mass by turning horizontally, and the blades were fixed inside the rotating drum to axially mix the coffee beans during roasting. The drum blades inside drag the coffee beans forward in the drum, and the inclined drum surface brings the coffee beans back. So, in this way, a single coffee bean passed through every point of the drum during rotation absorbs uniform thermal energy from the drum surface by conduction. The solar roaster’s main components are the rotating drum, electric motor, cooling tray with fan blower, and the heat source i.e., solar concentrator.
The basic criterion for the selection of solar concentrators was to perform roasting experiments. From the various studies on different solar reflectors [33], it has been extracted that the Scheffler solar concentrator would be the most appropriate for roasting experiments. In traditional parabolic concentrators design, the challenge was to perform continuous tracking on two axes with a fixed receiver as an integral part of the reflector on its focal point. Moreover, the focus position was in the path of incoming direct normal irradiance. The high temperature could be achieved by these types of concentrators, but for conducting roasting experiments, a concentrator with frequently changing focus was not suitable due to inadequate handling during roasting. However, this issue is resolved by using a fixed focus Scheffler solar concentrator that enables precise automatic tracking and keeps the path of incoming direct normal irradiance away from the focus. Furthermore, its fabrication work could be carried out in a simple workshop with minimum tools, hence providing a cheaper solution that is easily adoptable for small-scale applications in the food and agro-industry. Therefore, the Scheffler concentrator reflector with a surface area of 8 m2 was used as a solar thermal energy source to conduct roasting experiments. The main components of the Scheffler reflector are an elliptical reflector frame, rotating support, tracking channel, reflector stand, and tracking devices for both daily and seasonal variations in the sun angle. The crossbars are designed precisely to form the required paraboloid section in the elliptical frame of the Scheffler reflector. The rotating support is fabricated (steel pipe material) as a reflector integral part to provide an axis of rotation and a tracking channel. The operating principle of the daily tracking system is to counterbalance the earth rotation effect with an angular velocity of one revolution per day by tracking the sun along an axis parallel to the polar axis of the earth. The tracking system is comprised of a photovoltaic panel, a solar sensor, and a geared motor. For the seasonal adjustments, manually operated telescopic clamps were used to acquire the required paraboloid reflector shape for precisely targeted fixed focus throughout the year. The Scheffler solar concentrator reflects the incoming direct normal irradiance from its 8 m2 surface area onto a solar roaster drum having a diameter of 400 mm. The Scheffler reflector design of the paraboloid lateral part that is inclined at an angle of (43.23 ± α/2), so the reflector’s actual area of aperture (Ac) is calculated as Ac × cos(43.23 ± α/2). For measuring the total available energy (Qa), the direct normal irradiance (EDNI) is multiplied by the fraction of the actual aperture area as equated below [34],
Q a = E D N I A c cos 43.23 ± α 2 ,
where α = angle of solar declination that can be equated as under [35]:
α = 180 / π [ 0.006918 0.399912 cos n 2 2 π / 365 + 0.070257 sin n 1 2 π / 365 0.006758 cos 2 n 1 2 π / 365 + 0.000907 sin 2 n 1 2 π / 365 0.002679 cos 3 n 1 2 π / 365 + 0.00148 sin 3 n 1 2 π / 365 ] ,
where n = day of the year.
Furthermore, the available energy is divided in terms of absorbed (Qap) and reflected (Qpr) radiations. The absorbed energy radiant (Qap) is estimated that is depending on the material reflectance (reflective aluminum > 88%). The energy available after the concentrator (Qpr) is given in Equation (3) [34]:
Q p r = R p Q a
where Rp = reflectance of the reflector surface material.
From the total radiations striking at the concentrator surface, some of the radiations were reflected out of focus. This happens due to imperfection in concentrator profiles, dust particles on the surface of the concentrator, and inadequate tracking of daily and seasonal variations. The part of the available quotient reaching targeted focus (Ff) was assumed to be 0.88 in the overall calculation. The energy received at the solar roaster (Qrcv) is calculated as [24]:
Q r c v = Q p r F f .
To measure the energy available at the roaster drum (Qrcv), the roaster cylindrical drum was fabricated with a stainless-steel (S.S) food-grade material and insulated by polyurethane with 60 mm insulation thickness. The roaster drum absorbs thermal energy and desorbs through conduction to beans in contact with the drum surface. After the coffee beans were inserted inside the roasting drum through the feeding hopper, the tilted position of the roasting drum slides the coffee beans toward the discharge chute, allowing heat transfer through conduction from every point of the drum surface to the beans effectively. The energy absorbed by the coffee beans during the roasting process can be measured as [36]:
Q u = m c Δ T t ,
where Qu = energy absorbed by coffee beans, m = mass of beans, c = specific heat capacity of the coffee beans, ∆T = change in temperature of coffee beans, and t = roasting time.

2.3. Efficiency of Solar Roaster

The roaster thermal efficiency (ηth) is calculated by dividing the energy absorbed by the coffee beans with the total energy available, as given in Equation (6) [36]:
η t h = Q u Q a × 100 .
The roasting efficiency is calculated by dividing the mass of undamaged roasted coffee beans by the total mass of roasted coffee beans, as expressed in Equation (7) [36]:
η p r = m r m dr m r × 100 ,
where ηpr = roasting efficiency of the solar roaster, mr = total mass of roasted coffee beans, and mdr = mass of damaged (broken or burnt) coffee beans after roasting.
The roasting performance was also determined at varying rotational speeds (2, 3, and 4 rpm) of the roasting drum.

2.4. Optimal Operating Parameters for Roasting Coffee in Solar Batch-Type Roaster

The operating parameters (roasting time, drum rotation, and beans quantity) were selected for controlling the roasting temperature, feeding rate, and degree of roasting. These parameters have a substantial effect on the coffee roasting process. The central composite rotatable design (CCRD) technique by using Design-Expert software was employed to design the experiments, which was initially established by Box and Hunter [37] and improved by Box and Wilson [38]. The experiments were conducted by setting operating parameters (roasting time, drum rotation, and beans quantity) ranges at 15–25 min, 2–4 rpm, and 1.5–2.5 kg, respectively, to predict their optimal values using Design-Expert software. The operating parameters impact on the moisture content and colorimeter value of lightness factor (L* = 0 represent black and L* = 100 represents diffuse white) were recorded after two replications of the predicted values, and the average value for each response was examined during roasting experiments. The roasting experimental findings were assessed by applying the CCRD technique and second-order quadratic equation fitted for moisture content (MC) and colorimeter value of lightness factor (L*) by incorporating second-order multiple regression analysis. For each predicted response, the generalized model is given as:
Y = β o + i 1 3 β i x i + i 1 3 β i i x i + i < j 1 3 β i j x i x j + e
where Y = response variable, βo, βi, βii and βij = regression coefficients for the model intercept, linear, quadratic, and interaction terms, xi, xj = independent variables, and e = random error [39].
The results from roasting experiments were compared with the model predicted values, and the sufficiency of the designed model was validated for each response by applying the analysis of variance (ANOVA). If the p-value will be less than 0.05 at the level of significance of a 95% confidence interval (C.I), then the model is considered acceptable, and for the coefficients of variation (CV) less than 10%, the lack of fit for the model is non-significant.
From the ANOVA results, a probability to consider the observed Fisher’s F statistic value and a p-value less than 0.05 at 95% C.I verifies a significant impact of the parameters on the responses.

2.5. Optimization of Roasting Parameters Using Desirability Function Technique

The roasting parameters optimization procedure was carried out in the Design-Expert software using a desirability function. In this approach, a multivariable problem through applying mathematical methods is converted to a single response problem [40]. The aim for optimization was to achieve maximum roasting capacity by employing the maximum available solar thermal energy to roast coffee beans. Therefore, the optimal drum rotation was set to examine the optimal roasting time to reach standardized color lightness values of L* 41.5 + 1, 39.2 + 1, and 37.5 + 1 at corresponding light roast, medium roast, and dark roast coffee beans. The optimization process of each operating parameter and for responses with their set goals are given in Table 1.

3. Results and Discussion

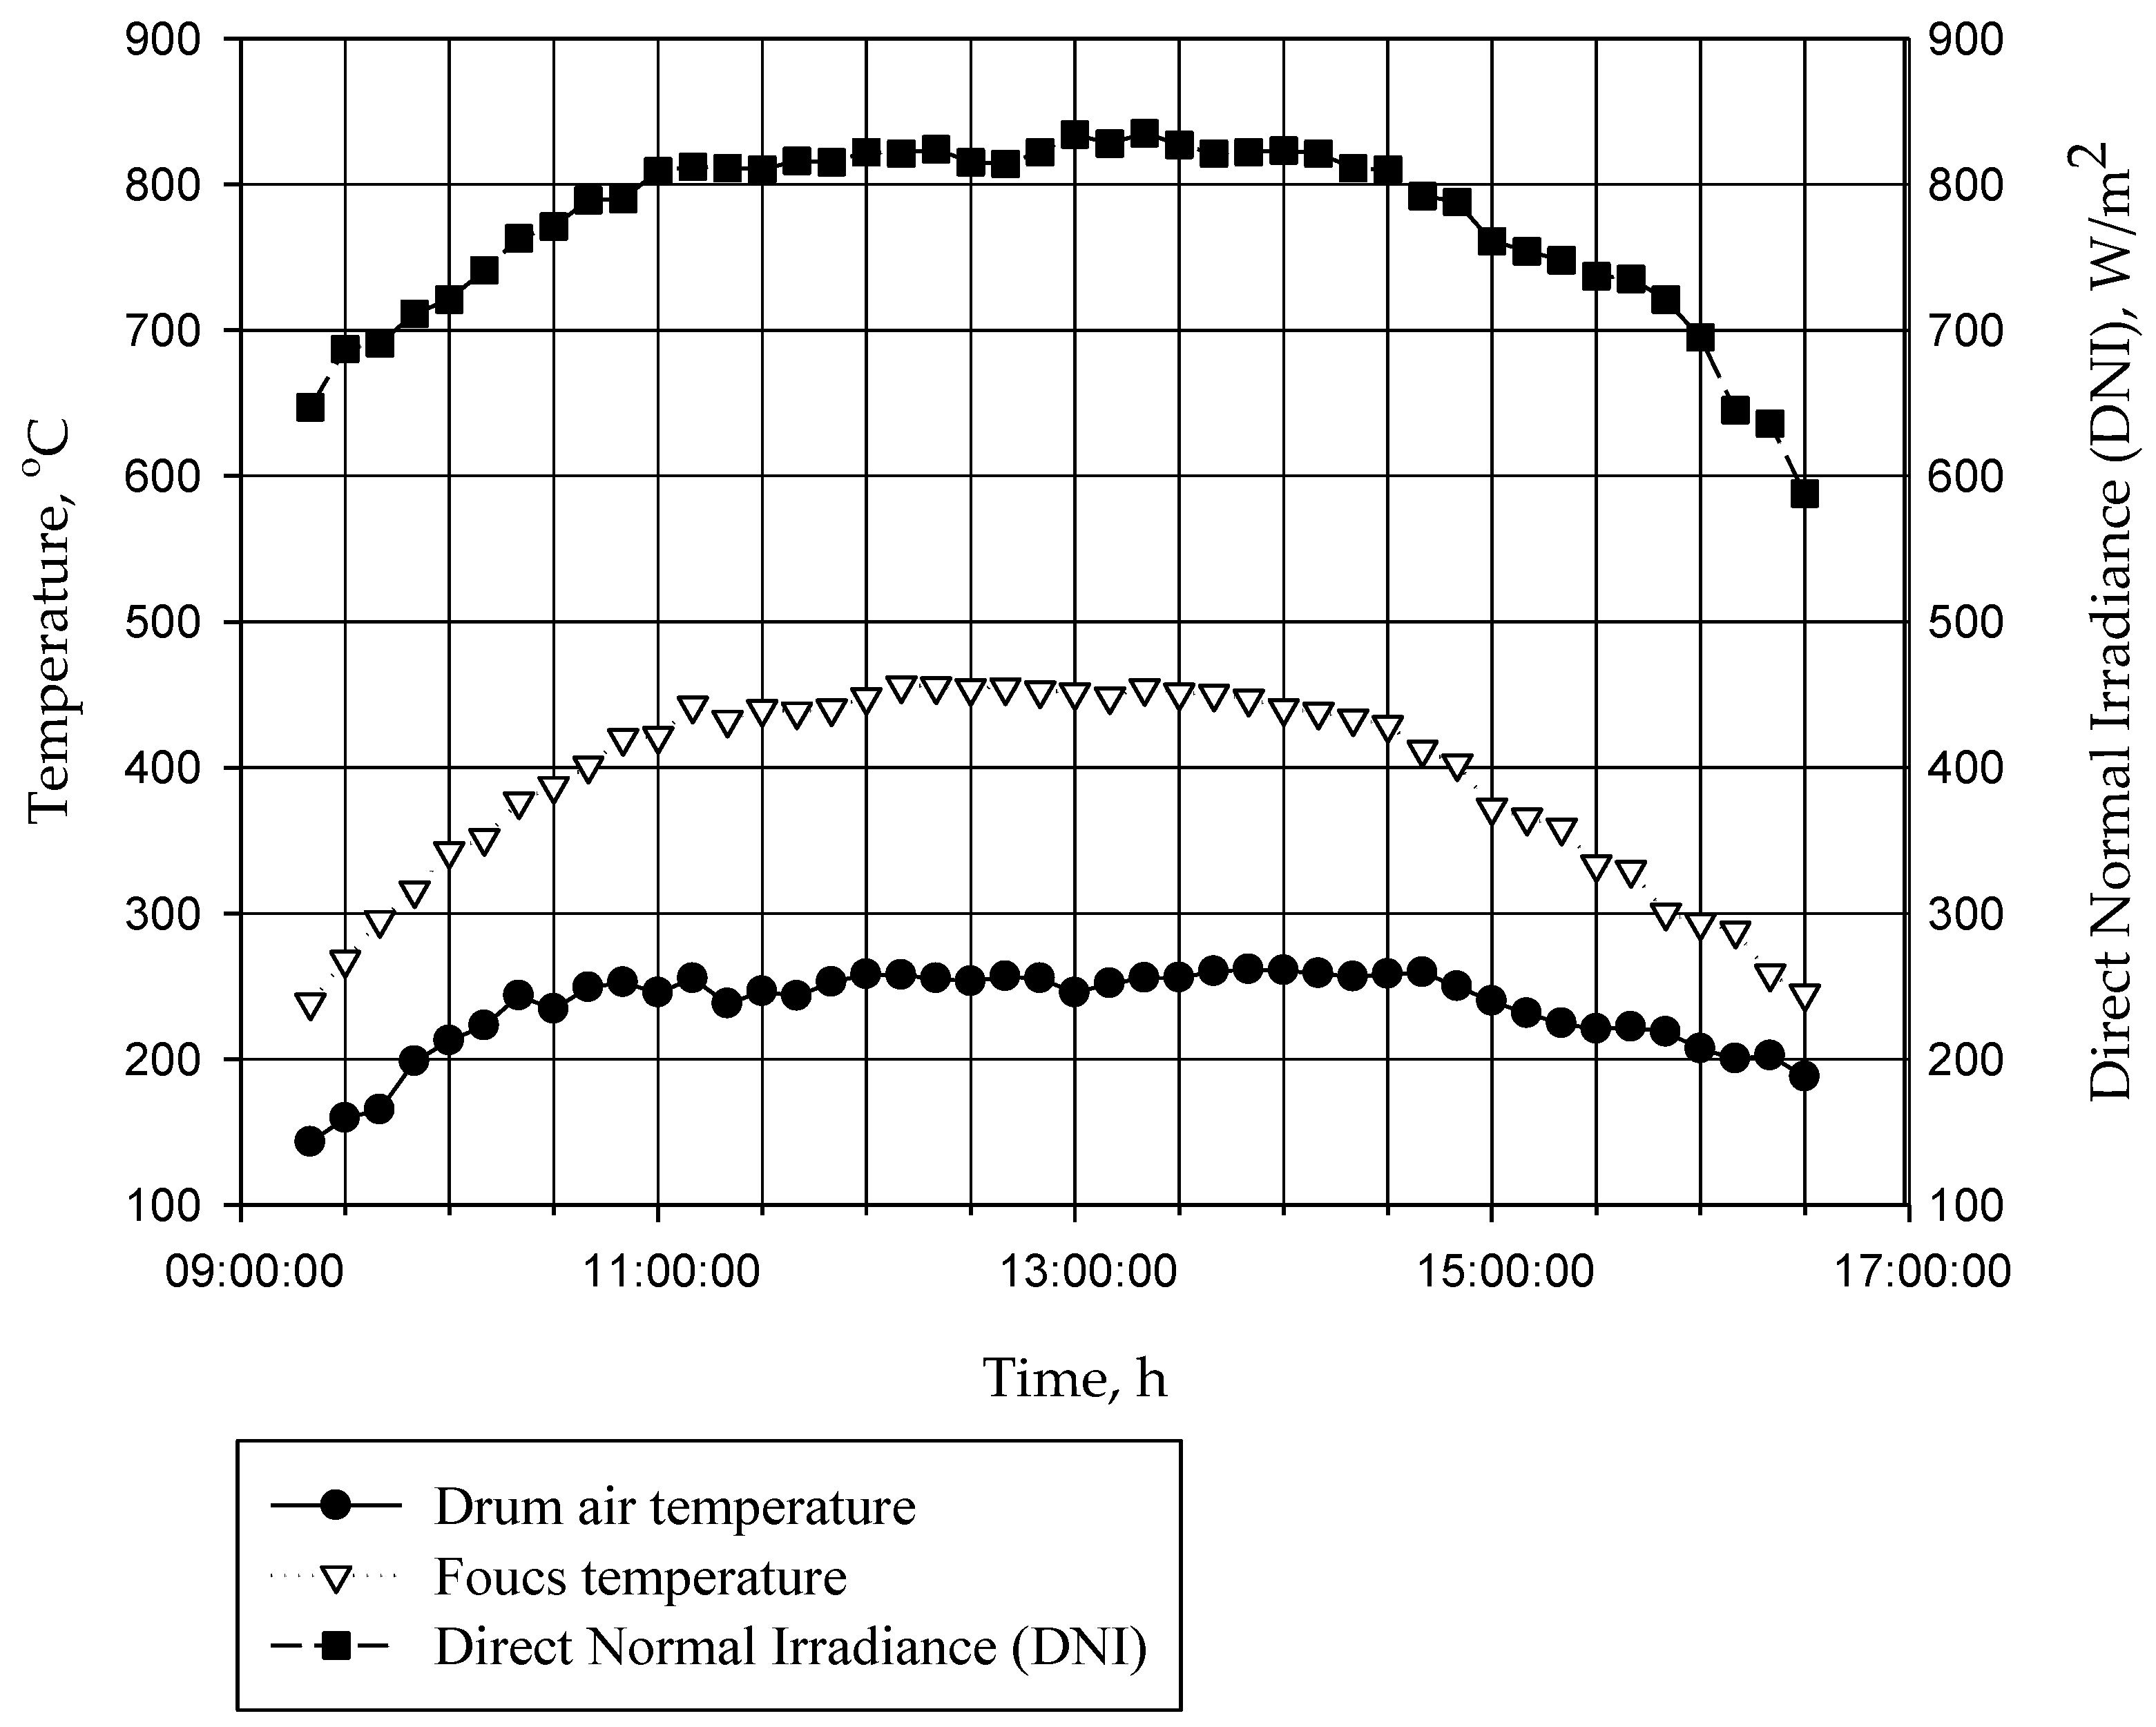
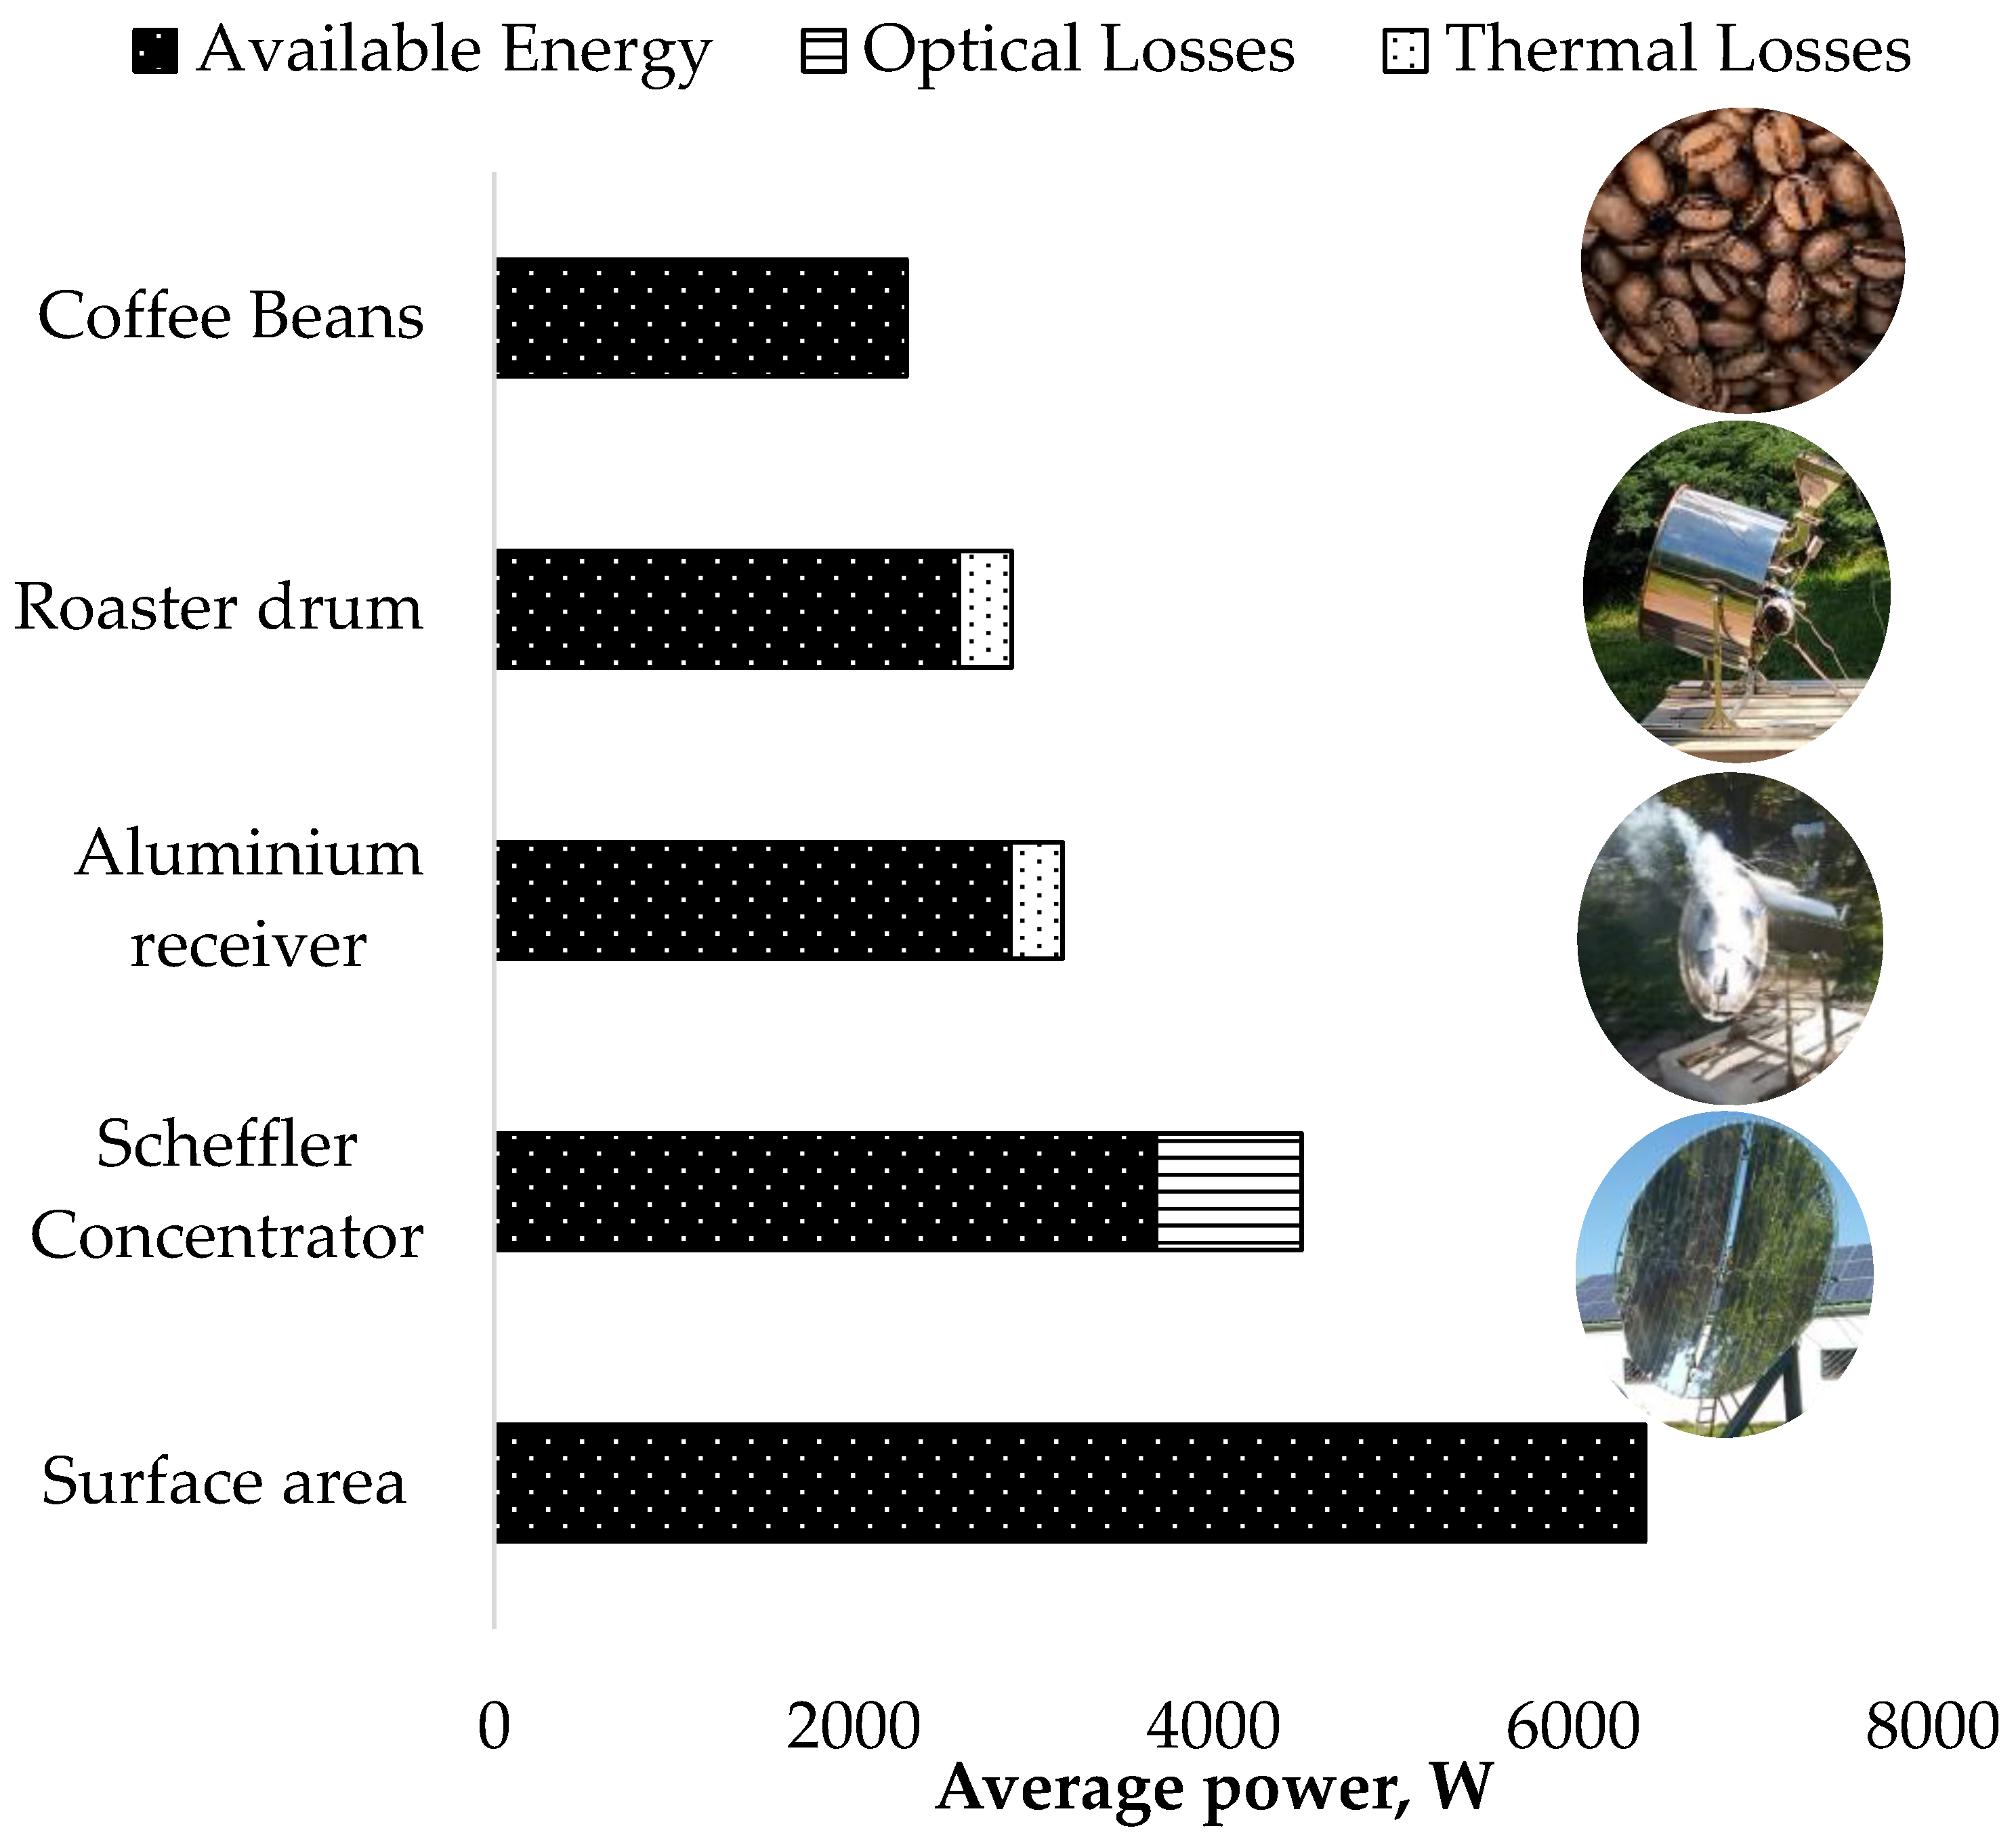
3.1. Roaster Thermal Energy Distribution

The DNI was recorded from 09:00 to 17:00 on 14 June 2021, and the corresponding temperature at the focus and drum air was recorded. The data were recorded every 10 min using a solar pyranometer and k-type thermocouples, respectively. The results of the experiment recorded are graphically illustrated in Figure 2.
It can be noticed from the roaster drum air temperature line in Figure 2 that the roasting cylinder air temperature of 200–250 °C was attained from 10 am to 4 pm, which is the most appropriate time for performing the roasting of coffee beans. This full-day experiment aims to record a suitable time to achieve the required temperature for roasting coffee beans. Based on the data collected, the available temperature (≥200 °C) that was desired for roasting could be achieved for 6 sunshine hours on a clear sunny day at a corresponding DNI value ranging from 650 to 850 W/m2. The maximum and minimum temperature at the focus was recorded 456–173 °C, with DNI at site ranging from 835 to 455 W/m2, respectively. The time required to roast 2 kg batch size coffee beans at the light, medium, and dark roasting conditions was 20 ± 0.1, 23 ± 0.1, and 25 ± 0.1 min, respectively. From the results of the roasting experiment, it can be derived that a solar roaster has a roasting capacity of 36, 31.3, and 28.8 kg of coffee beans per day subjected to light roasts, medium roasts, and dark roasts, respectively with average DNI ranging from 800 to 850 W/m2.

Thermal Efficiency of Solar Roasting System

The roasting experiment was performed on clear sunny weather conditions with an average DNI value of 800 W/m2 recorded at a concentrator surface area of 8 m2, and the total energy available was calculated to be 6400 W. The optical losses of the Scheffler reflector were estimated by considering the actual useable aperture area (4.6 m2) of the reflector; the reflectance (aluminum > 88%) from the reflective surface and out of focus radiations were estimated to be 10%, which could be due to the inadequate geometric accuracy of reflector profiles or imprecise tracking. The thermal losses from the roaster unit were estimated by considering the losses from the aluminum receiver (10%) and the calculations of thermal losses due to convection, conduction, and radiation from the roaster drum were made.
The energy distribution from the reflector surface to the roasting drum containing coffee beans was estimated to optimize the roasting system and to calculate how much energy in terms of power is available for the system under study. The power available at the Scheffler reflector, the power available after the reflector, the power available at the solar receiver, and finally the power available for roasting coffee were calculated using the respective equations as described before. Figure 3 illustrates that the power of 6400 W was available at 8 m2 area; out of this, 3680 W of power was available at the Scheffler actual aperture area of 4.6 m2, out of which 2870 W of power was available at the receiver. This power is further transferred to the drum for the roasting process; the power available inside the roasting drum was 2583 W and the final power available for roasting coffee beans was 2291 W. Furthermore, to achieve a uniform roasted product, roasting drum rotation is the main factor. It is obvious from both simulation and experimental results that temperature is quite uniformly distributed inside the roasting chamber. The power difference between the Scheffler reflector and the receiver is due to energy losses from different components of the roasting units. These losses include the reflectivity of the aluminum surface, due to incomplete absorbance and heat losses from different parts of a solar roaster, i.e., through conduction, convection, and radiations. Therefore, 2291 W power was utilized for coffee beans roasting out of the total 3680 W power available at Scheffler; from Equation (6), the thermal efficacy of the solar roasting system was 62.2%.

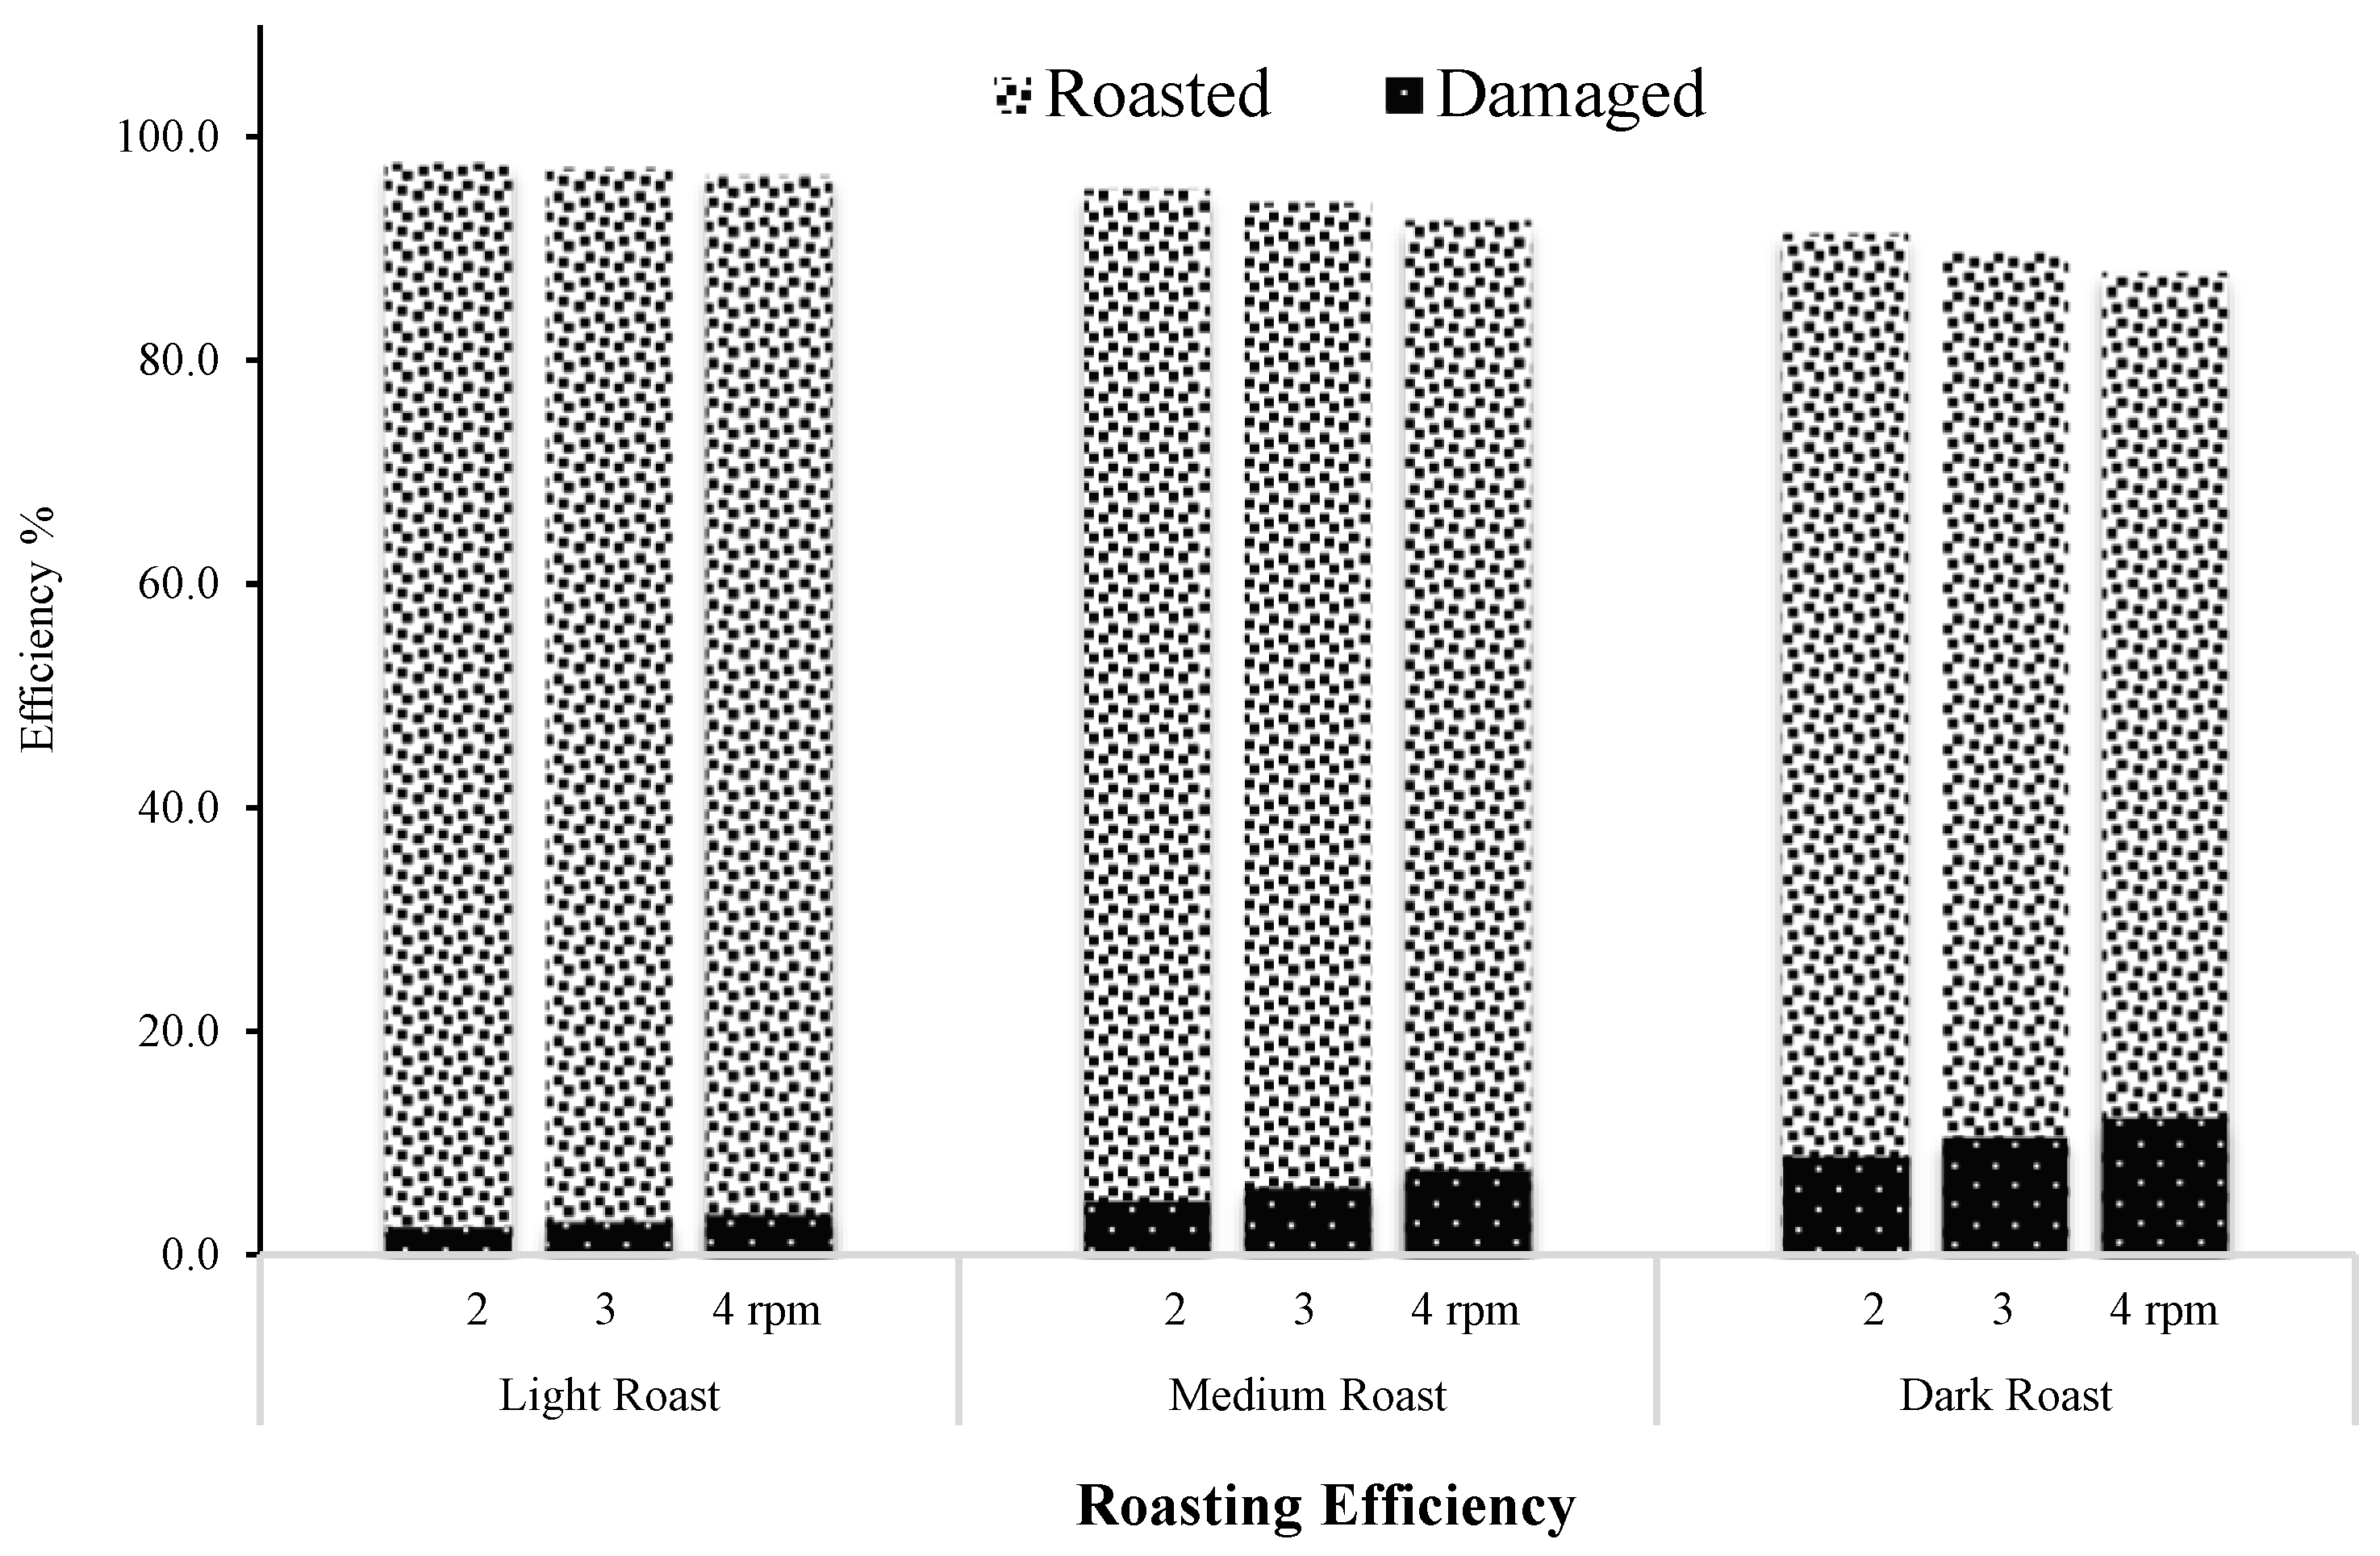
3.2. Roasting Efficiency of a Solar Roaster

The experiments were conducted for roaster performance evaluation by measuring the weight of roasted and damaged (broken or burnt) coffee beans, and the results at different degrees of roasting are illustrated in Figure 4. The results of solar roasting machine performance were 97.5 ± 1.0%, 95.2 ± 1.0%, and 91.3 ± 1.0% at light roasts, medium roasts, and dark roasts at lower rotational speed (2 rpm) of the roasting drum. Moreover, at higher rotational speed (4 rpm), the roasting efficiency of the solar roaster was 96.5 ± 1.0%, 92.5 ± 1.0%, and 87.8 ± 1.0% for light roasts, medium roasts, and dark roasts, respectively. It can be depicted from the findings that the highest roasting efficiency was achieved during light roast as compared to dark roast, which could be explained by the fact that at higher temperature, dark roasted coffee beans are damaged more readily because of their brittle nature as compared to light roasted coffee beans, which were less prone to damages. Moreover, the roasting efficiency was slightly higher at a lower rotational speed of the roasting as compared to a higher drum speed because the beans have the potential to break apart. However, the speed of the drum should not be very much lower, because the beans could scorch. The findings were in good relation to the various studies conducted on roasting efficiencies [41,42,43].

3.3. Operating Parameters Impact on Responses

The results from both predicted design values and the findings of roasting experiments for each response (MC and L*) are presented in Table 2. From experimental findings, the ranges for MC and L* values were observed as 0.76 to 2.95% and 25.68 to 53.90, respectively. Equations for the MC and L* in terms of coded factors are given below:
MC = 2.38 0.2 A + 0.29 B + 0.55 C 0.16 AB + 0.14 AC 0.18 BC 0.11 A 2 0.21 B 2 0.068 C 2 ,
L * = 47.03 2.99 A + 3.86 B + 7.05 C 2.04 AB + 1.62 AC 2.38 BC 1.71 A 2 2.51 B 2 1.53 C 2 ,
where coded values A, B, and C represent the roasting time, drum rotation, and coffee beans quantity, respectively, whereas the statistical significance of the above equations is given in ANOVA in Table 2 and Table 3, respectively.
The model F-value = 95.71, as illustrated in Table 3, indicates that the model was significant. There is only a 0.01% chance that noise can cause these large F-values. The p-value less than 0.05 implies significant model terms. The significant model terms are A, B, C, AB, AC, BC, A2, B2, and C2. The values above 0.1000 imply that the model terms are not significant. The Lack of Fit F-value of 2.44 means that relative to pure error, the Lack of Fit was non-significant. There is a 17.47% chance that this high Lack of Fit F-value could be due to noise. The Predicted R2 agrees reasonably with the adjusted R2 and validates the model.
The model F-value = 414.67, as illustrated in Table 4, indicates that the model was significant. There is only a 0.01% chance that noise can cause these large F-values. The p-value less than 0.05 implies significant model terms. The significant terms of the model are A, B, C, AB, AC, BC, A2, B2, and C2. The values above 0.1000 imply that the model terms are not significant. The Lack of Fit F-value of 2.04 means that relative to pure error, the Lack of Fit was non-significant. There is a 22.58% chance that this high Lack of Fit F-value could be due to noise. The predicted R2 agrees reasonably with the adjusted R2 and validates the model.
Analysis of variance showed that the models related to MC and L* have a minor difference of values in each system (predicted and observed). Hence, it signifies the correlation of both models between operating parameters and their responses. Furthermore, these findings were confirmed by comparative analysis of both the actual results of roasting experiments and the model predicted values, as plotted in Figure 5a,b.

3.3.1. Impact of Operating Parameters on the Responses

The p-value is less than 0.05 for each single coded factor (A, B, and C) on both of the responses (MC and L*), as illustrated in Table 3 and Table 4. It confirmed the significant effect of the roasting time, drum rotational speed, and batch quantity on the responses. From Equations (9) and (10), the negative value of coefficient factor A represents a negative effect, and the positive value of corresponding coefficients B and C define the positive effects on both responses (MC and L*). Hence, it can be derived that increasing the roasting time eventually decreases the moisture from the beans and vice versa. On the other hand, decreasing the roasting drum rotational speed rpm and lowering batch quantities will release more moisture from beans during roasting and vice versa [44].
It can be derived from the results presented in Table 3 that the highest F-value (493.34) of batch capacity has the most significant effect on the moisture content compared to drum rotation and roasting time. From these values, it can be narrated that by varying the values of operating parameters within the given experimental ranges, the most substantial changes in the bean moisture content were observed by varying batch capacity. The quantity of beans inside the drum absorbed the heat through conduction, as they are in direct contact with the drum surface, which further increases with fewer beans, hence giving every bean more opportunity to absorb more heat from the drum, and by increasing the quantity of beans, the moisture removal rate tends to be slower. Therefore, the lowest value of moisture content was noted with minimum batch quantities. Furthermore, the comparatively quiet moderate impact of the drum rotational speed was also observed on the moisture content, which can be explained. Rotating the drum at higher speed rpm reduces the contact time of the bean-roasting drum, resulting in the lower temperature of the beans and hence higher moisture levels as compared to lowering the drum speed, which enhances the contact time of the bean–drum surface to absorb more heat, resulting in a lower value of moisture content. The roasting time has a comparatively lower impact on the bean moisture content. Increasing the time for roasting decreases the moisture value, which was because the more time the beans spend in the roasting cylinder continuously raises the temperature of the beans, resulting in more moisture removal from the coffee beans [44].
For the response L* (see Table 4), it can be depicted that the batch size has the most significant impact with the highest F-value (2035.63) as compared with the impacts of the drum rotational speed and roasting time. Roasting experiments at minimal quantities tend to quickly increase the bean temperature with significantly reducing moisture, which will restructure the beans accompanied by several chemical changes. The browning effect occurs due to the Maillard and caramelization process that tends to raise at higher temperatures of beans. At a lower drum rotational speed, it tends to darken the beans more readily, resulting in a lower L* value by increasing the temperature of beans through increasing the conduction process between the drum surface and bean. The roasting time impacts the L* by giving more time for chemical reactions to occur within the beans at higher temperatures by increasing the time span that beans spend in the high-temperature roasting chamber [45].

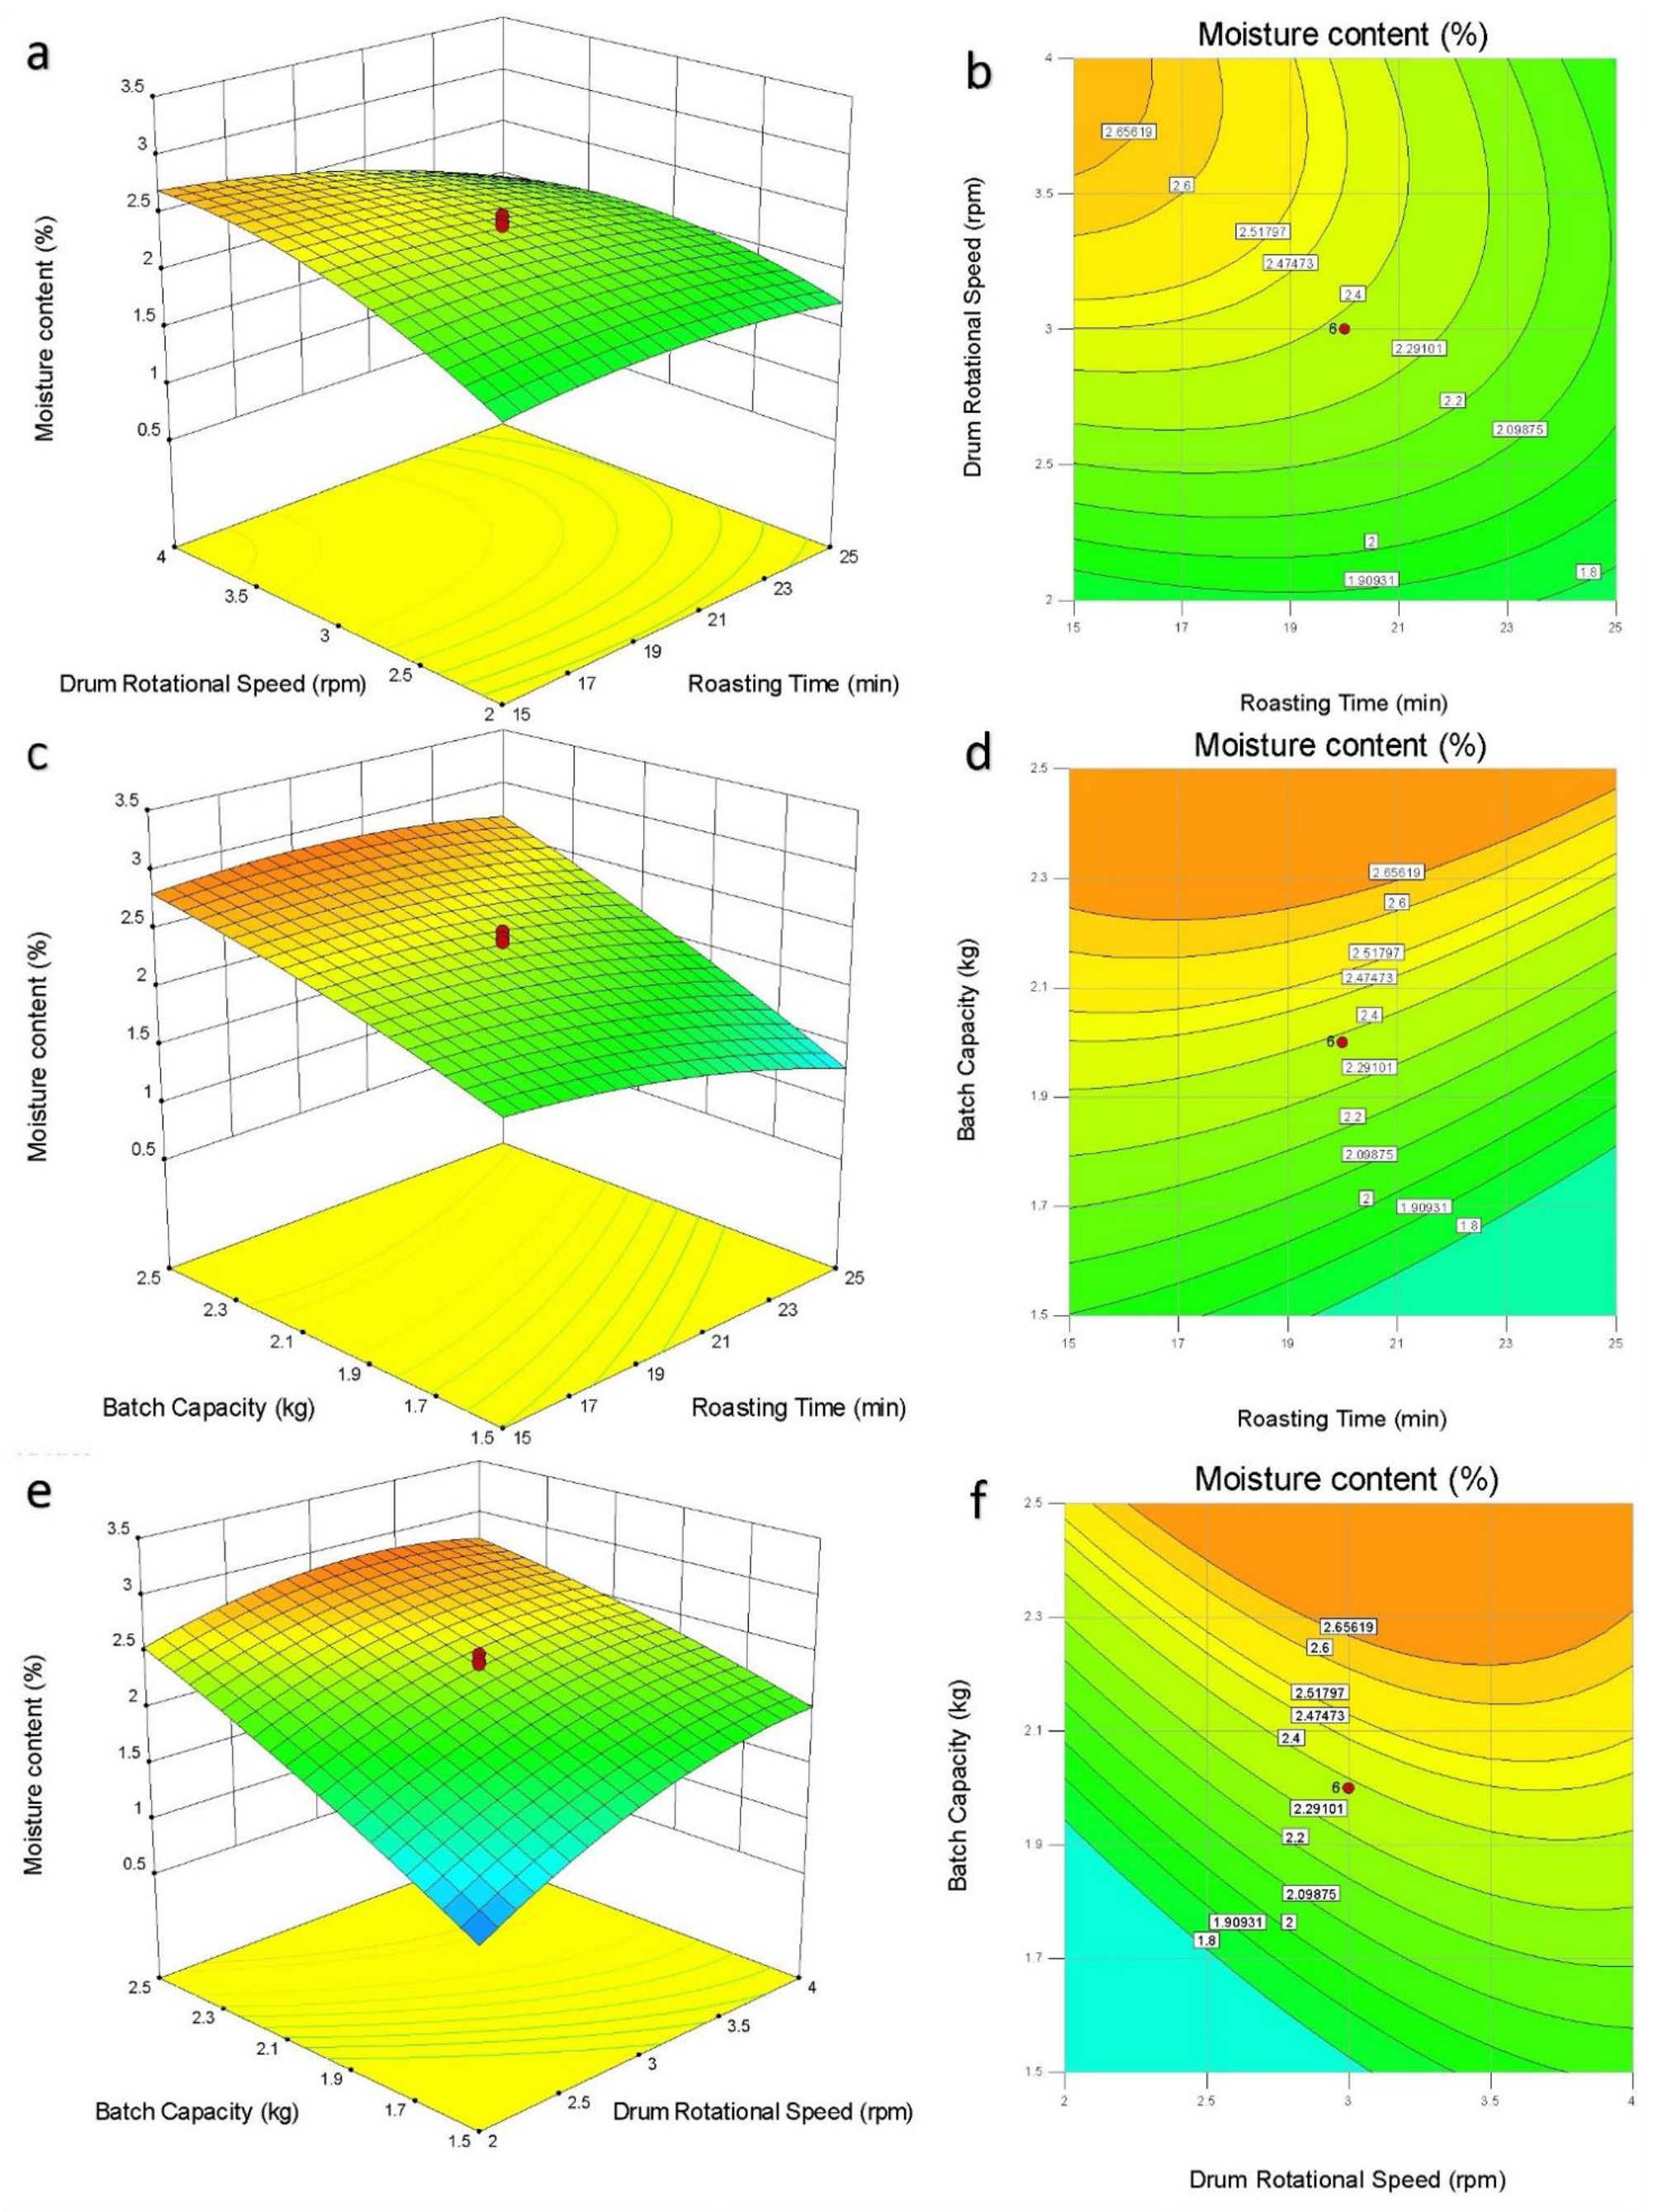
3.3.2. Interactive Impact of Parameters on MC

The roasting time and drum rotational speed have an interactive impact on the moisture content of coffee beans in a 2 kg batch size, which is presented in Figure 6a,b. It can be depicted from the observed impact on MC value from both the drum rotational speed and roasting time that the drum rotational speed has a more significant impact on moisture contact as compared to roasting time because it regulates the contact time between the bean and drum surface, which eventually decide the conductance time between the drum and beans. It can be described from a 3D surface plot that at higher drum speed, the higher the percentage of MC, and the lower drum speed resulted in a lower percentage of moisture content. The reason is at lower drum rotation, the beans’ temperature rises quickly due to more time in contact with the drum surface and vice versa [46].
Figure 6c,d illustrate the 3D surface and contour plots of the interactive impact of bean quantity and roasting time on MC by maintaining the drum rotational speed at 3 rpm. From the graph, it can be seen clearly that batch capacity has the most significant effect on the moisture content of beans during roasting. The lowest batch capacity tends to increase the temperature more rapidly, resulting in a lower percentage of moisture content of beans during roasting. The increase in roasting time removes more moisture from beans as it tends to further increase the temperature of beans and lower the coffee beans’ moisture level during roasting [47].
Figure 6e,f illustrate the 3D surface and contour plots of the interactive impact of bean quantity and roasting drum rotational speed on MC. A positive impact on the moisture content has been recorded by the impact of both batch capacity and drum rotational speed. However, batch capacity has a more significant effect on moisture content, as it tends to raise the temperature of beans more rapidly by allowing beans to have more surface to absorb heat from the drum as compared to higher beans volume that reduces the temperature of beans. At a lower drum rotational speed, it allows a greater rise in temperature that will add more heat energy to beans for moisture removal, resulting in a lower percentage of moisture contents [46].

3.3.3. Interactive Impact of Parameters on Colorimeter Value (L*)

The roasting time and drum rotational speed interactive impact on the color L* of coffee beans having a batch size of 2 kg is illustrated in Figure 7a,b. It can be seen from the observed effect on L* by both drum rotational speed and roasting time that the drum rotational speed has a more significant impact on L* because it regulates the contact time between the bean and drum surface that eventually determine the conductance time between the drum and beans. It can be seen from the 3D surface plot below that at a higher drum rotational speed, the higher value of color L* was observed due to less heat transfer through the drum surface and giving less browning color to the coffee beans and vice versa. The reason for the lower value for L* at lower drum rotation was due to the temperature of the coffee beans, which abruptly rises by allowing more time to contact with the hot drum surface, resulting in higher conduction and vice versa [45].
Figure 7c,d illustrate the 3D surface and contour plots of the interactive impact of beans quantity and roasting time on L* by maintaining the drum rotational speed at 3 rpm. From the graph, it can be seen clearly that batch capacity has the most significant effect on the L* of beans during roasting. The lowest batch capacity tends to increase the temperature more rapidly, resulting in a lower L* of beans during roasting. The increase in roasting time removes more moisture from beans as it tends to raise the temperature of beans and lower the value L* during roasting [45].
Figure 7e,f illustrate the 3D surface and contour plots of the interactive impact of beans quantity and roasting drum rotational speed on L* by maintaining the roasting time at 20 min. A positive impact on the L* has been recorded by the impact of both batch capacity and drum rotational speed. However, batch capacity has a more significant effect on L*, as it tends to raise the temperature of beans more rapidly by allowing beans to have more surface to absorb heat from the drum as compared to higher beans volume, which reduces the temperature of the beans. At a lower rotational speed of a rotating drum, it allows a greater rise in temperature that will add more heat energy to beans, resulting in a lower value of L* [47].

3.4. Optimal Operating Parameters of Solar Roaster

Taking the optimization criteria into account, several solutions for the color response parameters L* at the light, medium, and dark roasting degree were available at their corresponding moisture content values. Among the different available solutions, only the most desirable solutions were considered. The optimal feeding capacity of 2 kg was suggested by the quadratic response surface model at a drum rotational speed of 2 rpm for all three responses, while the optimal roasting times were predicted to be 20, 23, and 25 min for a light roast, medium roast, and dark roast degree, respectively. The optimal moisture contents were predicted to be 1.88, 1.82, and 1.74% at corresponding L* values of 40.66, 39.47, and 37.99 compared to the selected solutions.

Coffee Roasting

The model’s predictability was verified by coffee roasting experiments under optimal conditions. The experiments were repeated three times, and the average value of MC and L* were measured for each experiment. The average MC values are 1.89, 1.83, and 1.75%, resulting in L* values of 40.75, 39.64, and 38.21 for light roasts, medium roasts, and dark roasts, respectively. The values for MC and L* both from experiments and predicted have indicated a very slight difference among them, as given in Table 5. For each response, the relative error of less than 1% is recorded; hence, these slight differences from the prediction results validate the model. The recorded time using a stopwatch during light roasts, medium roasts, and dark roasts was observed to be 20, 23, and 25 min, respectively. From the roasting experiments optimal time, it can be revealed that the roasting capacity of a solar roaster was 6, 5.2, and 4.8 kg of coffee beans per hour at corresponding light roasts, medium roasts, and dark roasts conditions, respectively.

3.5. Economic Analysis

The cost analysis study has been performed on an annual basis on a solar-based roasting machine to finally find out the cost-effectiveness of the system for its commercialization purpose. The useful working hour of the solar coffee roasting machine is subjected to sunshine hours for conducting coffee roasting. The long-term average sunshine hours are peak hours of sunshine. The total investment cost for the material and fabrication of a complete roasting system (Scheffler reflector, Roaster drum, Coolant tray) was 3000 USD. The expenses and revenue of the roasting unit were analyzed to calculate the break-even point as follows:
TR = TC,
P × X = TFC + V × X,
X = TFC P V
X = 384 25 24.63
X = 1037.8 h or 173 days,
where TR = total revenue, TC = total cost of the roasting unit, P = revenue per hour, V = variable cost that includes routine maintenance and labor cost, TFC = total fixed cost that comprises the labor benefits and interest on financing, and X = operating time in hours. In this study, a batch size of 2 kg green coffee beans (Coffea arabica) was roasted in 20 min. On a typical summer day, the system was capable of roasting 36–28.8 kg of light–dark roasted coffee. For cost analysis, an estimated price of 1 kg green coffee beans is taken as $3.32, and the roasted coffee is worth $5.00 [48]. From this estimation, the average revenue of about $25 can be generated per useful working sunshine hour. The number of sunny days in most of the coffee growing countries is more than 200 days per year [23]. From the break-even analysis, it is assessed that the cost of the complete system will be recovered after 173 days; i.e., around 6 months. Assuming a roaster life of 10 years, a great revenue can be generated by coffee farmers using solar roasters. It is worth mentioning that the cost will be even more quickly recovered in the countries receiving more sunshine hours to operate the roaster.
In summary, it can be depicted from the Figure 8 break-even analysis that the payback period in terms of cost is estimated to be half a year, and the revenue obtained will exceed its total cost. Furthermore, a solar roaster state-of-art design requires no gas or electricity connection, hence saving an additional amount as compared to other traditional roasters that require an additional cost of energy supplies transmission for roasting.

4. Conclusions

This study was conducted to investigate a solar roaster capacity as a decentralized coffee roasting approach. A standing 8 m2 Scheffler reflector was used to concentrate the incoming DNI to the roaster drum focus. The system was completely independent of grid connections, and both thermal as well as electrical power was generated using solar energy. Experimental data show that the optimal times for roasting light, medium, and dark coffee at a drum temperature of 250 °C was 20 ± 0.1, 23 ± 0.1, and 25 ± 0.1 min, respectively. On a sunny day with a DNI of 650–850 W/m2, the solar roaster was able to roast 28.8 kg, 31.3 kg, and 36 kg coffee beans with roasting efficiency of 97.5%, 95.2%, and 91.3% at the corresponding light roast, medium roast, and dark roast, respectively. The roasted coffee beans’ final moisture content was 1.89, 1.83, and 1.75% at corresponding L* values for a light roast, medium roast, and dark roast of 40.75, 39.64, and 38.21, respectively. The power distribution shows that out of the 3680 watts of total available energy at the Scheffler reflector, approximately 2291 watts were ultimately consumed by the coffee beans during roasting with a total thermal efficiency of 62.2%. Total investments on solar roasters were expected to return after 1038 useful working sunshine hours. Thus, the enormous potential of solar thermal energy can be used to meet globally faced rising energy demands in processing, particularly at the farm-gate as a decentralized approach for coffee beans roasting.

Author Contributions

Conceptualization, F.M., A.R., A.M. and O.H.; methodology, F.M., and A.R.; software, F.M. and A.R.; validation, F.M. and O.H.; formal analysis, F.M. and A.R.; investigation, F.M. and A.R.; resources, O.H.; data curation, F.M. and A.R.; writing—original draft preparation, F.M.; writing—review and editing, F.M., A.M. and O.H.; visualization, F.M. and A.R.; supervision, A.M. and O.H.; project administration, A.M. and O.H.; funding acquisition, F.M. and O.H. All authors have read and agreed to the published version of the manuscript.

Funding

This research was funded by the German Federal Ministry of Education and Research [grant number 031A247A] within the framework of the GlobE initiative through the Reduction of Post-Harvest Losses and Value Addition in East African Food Value Chains (RELOAD) project. The Article Processing Charges (APC) was funded by the University of Kassel, Germany.

Institutional Review Board Statement

Not applicable.

Informed Consent Statement

Not applicable.

Data Availability Statement

Not applicable.

Acknowledgments

This study is a part of Faizan Majeed’s PhD research work at the Department of Agricultural and Biosystems Engineering, Faculty of Organic Agriculture, University of Kassel, Germany. Special thanks for the contribution of the Department of Post-Harvest Management, Jimma University, Jimma, Ethiopia. The great thanks and acknowledgement of the Higher Education Commission (HEC) Pakistan for financial support through a development project entitled “Strengthening of Bahauddin Zakariya University (BZU) Multan, Pakistan”.

Conflicts of Interest

The authors declare no conflict of interest.

References

  1. International Coffee Organization—Daily Coffee Prices. Available online: https://www.ico.org/coffee_prices.asp?section=Statistics (accessed on 21 June 2021).
  2. Krishnan, S. Sustainable Coffee Production. Oxf. Res. Encycl. Environ. Sci. 2017, 1–33. [Google Scholar] [CrossRef]
  3. United States Department of Agriculture (USDA). Coffee: World Markets and Trade. 2021. Available online: https://apps.fas.usda.gov/psdonline/app/index.html#/app/downloads (accessed on 11 January 2022).
  4. REN21 (Renewable Energy Policy Network for the 21st century). Renewables 2020 Global Status Report; REN21 Secretariat: Paris, France, 2020; ISBN 978-3-948393-00-7. [Google Scholar]
  5. Taghizadeh-Hesary, F.; Rasoulinezhad, E.; Yoshino, N. Energy and Food Security: Linkages through Price Volatility. Energy Policy 2019, 128, 796–806. [Google Scholar] [CrossRef]
  6. Hadzich, M.; Veynandt, F.; Delcol, J.; Hadzich, L.M.; Pérez, J.P.; Vergara, S. Design of a Solar Coffee Roaster for Rural Areas. Energy Procedia 2014, 57, 3215–3224. [Google Scholar] [CrossRef] [Green Version]
  7. Laukaleja, I.; Kruma, Z. Influence of the Roasting Process on Bioactive Compounds and Aroma Profile in Speciality Coffee: A Review. In Proceedings of the Baltic Conference on Food Science and Technology and North and East European Congress on Food, Jelgava, Latvia, 2–3 May 2019; Available online: http://llufb.llu.lv/conference/foodbalt/2019/Laukaleja_Kruma_N080_FoodBalt2019.pdf (accessed on 13 January 2022).
  8. Buffo, R.A.; Cardelli-Freire, C. Coffee flavour: An overview. Flavour Fragr. J. 2004, 19, 99–104. [Google Scholar] [CrossRef]
  9. Franca, A.S.; Oliveira, L.S.; Oliveira, R.C.S.; Agresti, P.C.M.; Augusti, R. A preliminary evaluation of the effect of processing temperature on coffee roasting degree assessment. J. Food Eng. 2009, 92, 345–352. [Google Scholar] [CrossRef]
  10. Palma, F.D.; Iacono, F.; Toffanin, C.; Ziccardi, A.; Magni, L. Scalable model for industrial coffee roasting chamber. Procedia Comput. Sci. 2021, 180, 122–131. [Google Scholar] [CrossRef]
  11. Nagaraju, V.D.; Murthy, C.T.; Ramalakshmi, K.; Srinivasa Rao, P.N. Studies on roasting of coffee beans in a spouted bed. J. Food Eng. 1997, 31, 263–270. [Google Scholar] [CrossRef]
  12. Raemy, A.; Lambelet, P. A calorimetric study of self-heating in coffee and chicory. Int. J. Food Sci. Tech. 1982, 17, 451–460. [Google Scholar] [CrossRef]
  13. Mendes, L.C.; de Menezes, H.C.; Aparecida, M.; da Silva, A.P. Optimization of the roasting of Robusta coffee (C. canephora conillon) using acceptability tests and RSM. Food Qual. Prefer. 2001, 12, 153–162. [Google Scholar] [CrossRef]
  14. de Carvalho, M.A.; de Rezende, J.C.; Rezende, T.T.; Ferreira, A.D.; Rezende, R.M.; Mendes, A.N.G.; Carvalho, G.R. Relationship between the sensory attributes and the quality of coffee in different environments. Afr. J. Agric. Res. 2016, 11, 3607–3614. [Google Scholar] [CrossRef] [Green Version]
  15. Bauer, D.; Abreu, J.; Jordão, N.; Rosa, J.S.; da Freitas-Silva, O.; Teodoro, A. Effect of Roasting Levels and Drying Process of Coffea canephora on the Quality of Bioactive Compounds and Cytotoxicity. Int. J. Mol. Sci. 2018, 19, 3407. [Google Scholar] [CrossRef] [Green Version]
  16. Rosa, J.S.D.; Freitas-Silva, O.; Rouws, J.R.C.; Moreira, I.G.D.S.; Novaes, F.J.M.; Azevedo, D.A.; Schwab, N.; Godoy, R.L.D.O.; Eberlin, M.N.; Rezende, C.M. Mass spectrometry screening of Arabica coffee roasting: A non-target and non-volatile approach by EASI-MS and ESI-MS. Food Res. Int. 2016, 89, 967–975. [Google Scholar] [CrossRef] [Green Version]
  17. Ukers, W.H.; William, H. All about Coffee; The Tea and Coffee Trade Journal Company: New York, NY, USA, 1922; p. 615. Available online: http://archive.org/details/ (accessed on 14 January 2022).
  18. Syafriandi; Fachruddin, F.; Lubis, A.; Maulina, H.; Nazura, P. Testing coffee roasting machine with electric heater as energy source. IOP Conf. Ser. Earth Environ. Sci. 2021, 922, 012073. [Google Scholar] [CrossRef]
  19. Wang, X.; Lim, L.-T. A Kinetics and Modeling Study of Coffee Roasting Under Isothermal Conditions. Food Bioprocess Technol. 2014, 7, 621–632. [Google Scholar] [CrossRef]
  20. Diallo—2019—A Heated Comparison Ikawa vs Probat.pdf. Available online: https://caravela.coffee/wp-content/uploads/2019/04/A-Heated-Comparison-Ikawa-vs-Probat-FINAL.pdf (accessed on 18 January 2022).
  21. Dafle, V.R.; Shinde, N.N. Design, Development & Performance Evaluation of Concentrating Monoaxial Scheffler Technology for Water Heating and Low-Temperature Industrial Steam Application. Int. J. Eng. Res. Appl. 2012, 2, 848–852. [Google Scholar]
  22. Nwakuba, N.R.; Asoegwu, S.N.; Nwaigwe, K.N. Energy requirements for drying of sliced agricultural products: A review. Agric. Eng. Int. CIGR J. 2016, 18, 144–155. [Google Scholar]
  23. Solargis. World map of DNI. 2021. Available online: http://solargis.info/doc/_pics/freemaps/1000px/dni/SolarGIS-Solar-map-DNI-World-map-en.png (accessed on 17 January 2022).
  24. Munir, A.; Hensel, O.; Scheffler, W. Design principle and calculations of a Scheffler fixed focus concentrator for medium temperature applications. Sol. Energy 2010, 84, 1490–1502. [Google Scholar] [CrossRef]
  25. Raza, A.; Munir, A.; Ghafoor, A.; Ali, S. Soybean roasting using continuous solar roaster–A decentralized approach for agricultural processing. J. Food Process Eng. 2019, 42, e13184. [Google Scholar] [CrossRef]
  26. Raza, A.; Majeed, F.; Munir, A.; Hensel, O. Development and Experimental Results of a Thermal Oil Based Roasting System for Decentralized Processing of Groundnuts. Appl. Sci. 2019, 9, 4342. [Google Scholar] [CrossRef] [Green Version]
  27. EESI. Solar Thermal Energy for Industrial Uses; Issue Brief; Environmental and Energy Study Institute (ESSI): Washington, DC, USA, 2011. [Google Scholar]
  28. Scheffler, W.; Bruecke, S.; von Werdenbergstr, G. Development of a solar crematorium. In Proceedings of the 6th International Conference on Solar Cooker, Granada, Spain, 15 July 2006. [Google Scholar]
  29. Patil, R.; Awari, G.; Singh, M. Experimental analysis of Scheffler reflector water heater. Therm. Sci. 2011, 15, 599–604. [Google Scholar] [CrossRef]
  30. Panchal, H.; Patel, J.; Parmar, K.; Patel, M. Different applications of Scheffler reflector for renewable energy: A comprehensive review. Int. J. Ambient. Energy 2020, 41, 716–728. [Google Scholar] [CrossRef]
  31. Munir, A.; Hensel, O.; Scheffler, W.; Hoedt, H.; Amjad, W.; Ghafoor, A. Design, development and experimental results of a solar distillery for the essential oils extraction from medicinal and aromatic plants. Sol. Energy 2014, 108, 548–559. [Google Scholar] [CrossRef]
  32. AOAC. Official Methods of Analysis of AOAC International, 17th ed.; Association of Analytical Communities: Gaithersburg, MD, USA, 2000. [Google Scholar]
  33. Wang, L.; Yuan, Z.; Zhao, Y.; Guo, Z. Review on Development of Small Point-Focusing Solar Concentrators. J. Therm. Sci. 2019, 28, 929–947. [Google Scholar] [CrossRef]
  34. Ayub, I.; Munir, A.; Ghafoor, A.; Amjad, W.; Nasir, M.S. Solar Thermal Application for Decentralized Food Baking Using Scheffler Reflector Technology. J. Sol. Energy Eng. 2018, 140, 061005. [Google Scholar] [CrossRef] [Green Version]
  35. Duffie, J.A.; Beckman, W.A. Solar Engineering of Thermal Processes; John Wiley & Sons, Inc.: Hoboken, NJ, USA, 2006. [Google Scholar]
  36. Olaniyan, A.M.; Karim, O.R.; Eromoselec, E.O. Design and Development of a Small-Scale Peanut Roaster. 2017. Available online: https://www.semanticscholar.org/paper/Design-and-Development-a-Small-scale-Peanut-Roaster-Olaniyan-Karim/a277049d55e266be60eb2c5d60f81887330c957b (accessed on 3 January 2022).
  37. Box, G.E.P.; Hunter, J.S. Multi-Factor Experimental Designs for Exploring Response Surfaces. Ann. Math. Stat. 1957, 28, 195–241. [Google Scholar] [CrossRef]
  38. Box, G.E.P.; Wilson, K.B. On the Experimental Attainment of Optimum Conditions. In Breakthroughs in Statistics: Methodology and Distribution; Kotz, S., Johnson, N.L., Eds.; Springer: Berlin/Heidelberg, Germany, 1992; pp. 270–310. [Google Scholar] [CrossRef]
  39. Montgomery, D.C. Design and Analysis of Experiments, 9th ed.; John Wiley & Sons: Hoboken, NJ, USA, 2017. [Google Scholar]
  40. Derringer, G.; Suich, R. Simultaneous Optimization of Several Response Variables. J. Qual. Technol. 2017, 12, 214–219. [Google Scholar] [CrossRef]
  41. Sutarsi Soekarno, S.; Widyotomo, S. Performance Evaluation of Rotating Cylinder Type Coffee Bean Roaster. J. Keteknikan Pertan. 2010, 24, 106931. [Google Scholar]
  42. Gallagher, J. Understanding Roaster Drum Speed & Its Affect on Your Coffee. Perfect Daily Grind. 2019. Available online: https://perfectdailygrind.com/2019/06/understanding-roaster-drum-speed-its-affect-on-your-coffee/ (accessed on 3 January 2022).
  43. Getaneh, E.; Fanta, S.W.; Satheesh, N. Effect of Broken Coffee Beans Particle Size, Roasting Temperature, and Roasting Time on Quality of Coffee Beverage. J. Food Qual. 2020, 2020, e8871577. [Google Scholar] [CrossRef]
  44. Jokanovic, M.; Dzinic, N.; Cvetkovic, B.; Grujic, S.; Odzakovic, B. Changes of physical properties of coffee beans during roasting. Acta Period. Technol. 2012, 43, 21–31. [Google Scholar] [CrossRef]
  45. Bicho, N.C.; Leitão, A.E.; Ramalho, J.C.; Lidon, F.C. Use of colour parameters for roasted coffee assessment. Food Sci. Technol. 2012, 32, 436–442. [Google Scholar] [CrossRef] [Green Version]
  46. Pittia, P.; Nicoli, M.C.; Sacchetti, G. Effect of moisture and water activity on textural properties of raw and roasted coffee beans. J. Texture Stud. 2007, 38, 116–134. [Google Scholar] [CrossRef]
  47. Edzuan, A.M.F.; Aliah, A.M.N.; Bong, H.L. Physical and Chemical Property Changes of Coffee Beans during Roasting. Am. J. Chem. 2015, 5, 56–60. [Google Scholar]
  48. Coffee: World Markets and Trade. USDA Foreign Agricultural Service. 2021. Available online: https://www.fas.usda.gov/data/coffee-world-markets-and-trade (accessed on 18 September 2021).
Figure 1. Solar roasting system. (Legends: A: 8 m2 Scheffler concentrator; A1: Sun tracking sensor; A2: Scheffler concentrator reflector; B: Roasting unit; B1: Feeding hopper; B2: Discharge chute handle; B3: Wooden handle sampler; B4: Gear motor for rotating drum; B5: Glass window; B6: Roasted product coolant tray; B7: Control panel).
Sustainability 14 02217 g001
Figure 2. DNI, focus temperature, and drum air temperature.
Sustainability 14 02217 g002
Figure 3. Power distribution at solar roasting system.
Sustainability 14 02217 g003
Figure 4. Roasting performance of a solar roaster.
Sustainability 14 02217 g004
Figure 5. Predicted vs. observed values of (a) MC; (b) L*.
Sustainability 14 02217 g005
Figure 6. The 3D response surface and 2D contour plots depict the interactive impact of the roasting drum rotational speed, roasting time, and beans quantity on MC. (a,b) Roasting drum rotational speed interaction with roasting time; (c,d) Beans quantity interaction with roasting time; (e,f) Beans quantity interaction with roasting drum rotational speed.
Sustainability 14 02217 g006
Figure 7. The 3D response surface and 2D contour plots depict the interactive impact of the roasting drum rotational speed, roasting time, and beans quantity on L*. (a,b) Roasting drum rotational speed interaction with roasting time; (c,d) Beans quantity interaction with roasting time; (e,f) Beans quantity interaction with roasting drum rotational speed.
Sustainability 14 02217 g007
Figure 8. Break-even analysis (1 day = 6 h).
Sustainability 14 02217 g008
Table 1. Optimization criteria of operating parameters.
ParameterGoal
Independent variablesRoasting time (min)In range
Drum rotational speed (rpm)Minimum
Coffee beans Quantity (kg)Maximize
ResponsesMC (%)Minimize
L* (light)Target → 41.5
L* (medium)Target → 39.2
L* (dark)Target → 37.5
L*: lightness factor, MC: Moisture content.
Table 2. Central composite response design (CCRD) of an experiment for quadratic response surface analysis on moisture content and colorimetric lightness value (L*).
Actual Level of FactorPredicted ResponsesObserved Responses
Design PointsRoasting Time (min)Drum Rotational Speed
(rpm)
Batch Capacity
(kg)
Moisture Contents
(%)
L*Moisture Contents
(%)
L*
120322.3847.032.3246.78
22541.51.4133.421.4733.76
3204.6822.2646.432.1445.93
411.59322.4147.232.346.69
520322.3847.032.3146.76
620322.3847.032.4947.99
71541.52.4247.112.5147.59
820322.3847.032.4346.99
920322.3847.032.446.94
101542.52.8653.232.9553.52
1128.41321.7437.171.7636.93
1220322.3847.032.3546.85
13201.3221.333.441.3433.16
142542.52.4346.422.4447.00
152032.843.1154.563.153.9
161521.51.1530.571.230.54
172522.52.5447.512.5147.59
182031.161.2630.841.1930.73
192521.50.7925.420.7625.68
201522.52.3446.182.3446.8
Table 3. Analysis of variance for quadratic response surface model on moisture content.
SourceSum of SquaresdfMean SquareF-Valuep-Value
Model7.2190.8095.71<0.0001significant
A0.5410.5465.07<0.0001
B1.1211.12133.34<0.0001
C4.1314.13493.34<0.0001
AB0.2010.2024.450.0006
AC0.1610.1619.390.0013
BC0.2710.2732.690.0002
A20.1710.1720.410.0011
B20.6410.6476.93<0.0001
C20.06710.0678.020.0178
Residual0.084100.0083
Lack of Fit0.05950.0122.440.1747Non-significant
Pure Error0.02450.0049
Cor Total7.3019
R2 = 0.9885, Adjusted R2 = 0.9782, Predicted R2 = 0.9333, C.V. = 4.33%, df: degree of freedom.
Table 4. Analysis of variance for quadratic response surface model on color lightness value L*.
SourceSum of SquaresdfMean SquareF-Valuep-Value
Model1245.129138.35414.67<0.0001Significant
A122.101122.10365.96<0.0001
B203.641203.64610.38<0.0001
C679.151679.152035.63<0.0001
AB33.13133.1399.30<0.0001
AC21.00121.0062.93<0.0001
BC45.13145.13135.25<0.0001
A242.02142.02125.95<0.0001
B290.67190.67271.78<0.0001
C233.69133.69100.99<0.0001
Residual3.34100.33
Lack of Fit2.2450.452.040.2258Non-significant
Pure Error1.1050.22
Cor Total1248.4619
R2 = 0.9973, Adjusted R2 = 0.9949, Predicted R2 = 0.9847, C.V. = 1.34%.
Table 5. Predicted and observed responses.
Roasting DegreeResponsePredicted ValueRoasting ConditionAverage ValueError (%)
Run 1Run 2Run 3
LightMC (%)1.881.891.861.921.890.53
L*40.6640.7240.6340.8940.750.21
MediumMC (%)1.821.831.811.841.830.36
L*39.4739.6539.4139.8639.640.43
DarkMC (%)1.741.771.731.741.750.38
L*37.9938.7737.8638.0138.210.58
Publisher’s Note: MDPI stays neutral with regard to jurisdictional claims in published maps and institutional affiliations.

