1. Introduction
Solid waste management (SWM) affects every individual in the world, whether people are managing their own waste or governments are providing waste management services to their citizens. The World Bank predicts that waste creation will rise from 2.01 billion tons in 2016 to 3.40 billion tons in 2050 as countries and cities urbanize, expand economically, and grow in population. At least 33% of this waste is being mishandled around the world, either through open dumping or burning [
1].
Municipal solid waste management (MSWM) is becoming a complex problem in cities of developing countries. In developed countries, the status of municipal solid waste management is efficient (even if the average generation rate in the various industrialized countries is in the range of 0.8–1.4 kg/person/day [
2]) since solid waste management is often well established. Developing countries are currently facing numerous challenges due to insufficient funding for all waste management-related tasks by their urban management bodies [
3]. Therefore, there is an urgent need to develop an improved solid waste management plan to minimize and overcome the challenges involved in managing the enormous amount of solid waste generated such as insufficient funds, lack of facilities, and the shortage of collection spots for garbage.
SWM is a challenging environmental issue in a city such as Nepal where population growth and economic development have led to increased generation of municipal solid waste [
4]. Over the past decade, Kathmandu Valley has experienced rapid urbanization, high population growth, unsystematic garbage disposal, dumping of garbage near rivers and roads, and poor solid waste management services. According to the Kathmandu Metropolitan City (KMC), approximately 853 tons of waste daily and 70,080 tons annually are generated in the Kathmandu Valley [
5]. The Ministry of Urban Development (MoUD) is mainly responsible for making plans and policies related to sanitation and drainage in Kathmandu. The Kathmandu Metropolitan Municipal Office is the major authority in charge of executing the SWM system for Kathmandu City. The problem of SWM is becoming a major threat to the urban dwellers within the Kathmandu Valley and the locals residing near the valley’s landfill site at the Sisdol, Nuwakot district. KMC is densely populated, with more than a million people in a small area. The door-to-door garbage pickup service is run by KMC (the city outsources the work), but a large proportion of garbage is unmanaged and ends up in rivers or dumped near streets. A landfill site near Kathmandu is said to have already reached its capacity despite a spread of over 37.65 hectares [
6]. Segregation of garbage is also a big problem in Kathmandu. Although the KMC started a solid waste segregation pilot project in 2020, it did not work. Local residents have requested effective solutions to the problem, and there is a great need for collection spots and bags for proper garbage disposal in Kathmandu. In addition, since plans and projects led by a local authority are not necessarily successful, we need to care about various aspects of the assessment of waste management [
7,
8,
9]. However, it is difficult to execute such plans in practice.
KMC Ward No. 10 is the densely populated hub of Kathmandu. It is centered at the prime location along with administrative and business centers. Kathmandu has encountered significant issues in solid waste management, including a lack of public understanding of the solid waste system, unplanned urbanization, the introduction of environmentally unfriendly commodities, and changing consumer consumption habits [
10].
With a rising urban population, Kathmandu (World Population Review, 2021), as with any other large city, has the obligation to protect its residents by providing a clean and safe environment, as well as maintaining quality public health and economic opportunities. KMC has contracted with private agencies for solid waste management in KMC Ward No. 10. As with other local bodies, KMC Ward No. 10 is also experiencing difficulties inefficient solid waste management. Thus, there is a great need for an improved solid waste management policy to ensure proper solid waste management in KMC Ward 10.
The objective of this study is to examine the attributes influencing household choice behavior for improved solid waste management services by developing a hypothetical policy study of nonoperational SWM services. In particular, to improve SWM facilities in Kathmandu we investigated the following research questions: Which attributes have a causal effect on household’s decision to choose improved SWM Facilities in Kathmandu? How does each SWM attribute affect the probability of preferences? This study identifies specific attributes that affect household decisions by accepting a choice-based conjoint experiment. This could be a case study offering a unique research opportunity to investigate household perceptions of the new SWM service and the feasibility of its implementation.
2. Literature Review
Many cities and towns in developing countries face serious environmental degradation and health risks due to residents throwing domestic refuse on the streets and in public areas. KMC has adopted private sector participation (PSP) as a key strategy for SWM and resource mobilization, but [
10] mentioned investment to improve it is not enough due to insufficient funding.
Hoornweg and Bhada-Tata [
11] discussed that there are many adverse effects of poor SWM on public health. Solid waste that is not collected, treated, or appropriately disposed of can be a breeding ground for insects and pests, causing different public health problems. Improved solid waste management with efficiency in different aspects of SWM is needed in KMC Ward No. 10. Since MSW collection is the major expenditure in waste management, it is vital to optimize MSW collection efficiency [
12]. Shrestha [
13] pointed out that the majority (89%) of households in Kathmandu Metropolitan City are willing to segregate the organic and non-organic portions of their waste. Due to the lack of a proper lining, raw solid waste from the city’s dumpsites leaches into river water, causing contamination and degrading the quality of the water. Almazán-Casalia et al. [
14] found that households highly value having waste collected at home and are not much interested in separating waste. Meanwhile, the results highlight the potential for improving Liberia’s solid waste management by ensuring reliable services around the household collection. Setiawan et al. [
15] concluded that the separation of nonorganic waste and recycling as an intermediate processing technology had significant positive effects on the rate of pecuniary information support and increased Willing to Pay (WTP) by 20.5%; however, nonpecuniary information had a negative but statistically insignificant effect on WTP. Fukuda et al. [
16] pointed out that a new improved SWM system is needed in developing cities such as Indonesia. A new waste management policy including waste separation with a frequent organic waste collection is likely to incur popular support in Jakarta as well as Kathmandu in Nepal.
Additionally, Dangi et al. [
17] mentioned a situation generating waste from households in Kathmandu with a three-stage stratified cluster analysis, which pointed out that most wastes were accounted for organic wastes and that it is important to recycle them. Pokhrel and Viraraghavan [
18] evaluated the way of SWM in Kathmandu and said solid wastes which mostly come from organic origin should be composted on the land.
Mansuy et al. [
19] also conducted a choice-based conjoint analysis for Brussels’ consumers in Netherland about their preference to do collection service for electrical and electronic equipment including mobile phones and washing machines. They found that consumers in Brussel interestingly had a strong reluctance for incineration and did not have a significant preference for reusing over recycling. This result is different from the previous similar studies for the waste management field, but it might come from characteristics of target goods such as electrical and electric equipment or environmental factors in Brussel. Either way, their findings will give another information so that deepening household preference study on SWM to compare similar points and different points are significant.
As mentioned above, several problems and points of SWM in Kathmandu have been pointed out in prior studies. Those are mainly reporting the current situation of SWM and the major composition of wastes in Kathmandu. However, it is not necessarily clear how we could improve the current situation and what priority we should take to improve. Should we prioritize costs? Frequency of the collection? Facility for garbage? Service provider quality? There has been not much research concerning which factors should be prioritized to improve the current system. To fill out this kind of research gap, this paper tries to show results from another point of view with a randomized sample-based trial called a choice conjoint experiment. A study of SWM services based on a choice conjoint experiment in KMC is not popular yet. Fukuda et al. [
16] is so far the first work to adapt the conjoint analysis on SWM management, which analyzed an Indonesian SWM case in Jakarta. Their method followed [
20], which has been known as a new type of conjoint analysis becoming popular in social sciences and behavioral sciences recently to find causality in a certain policy. In addition, Setiawan et al. [
15] also analyzed the effect of giving pecuniary and non-pecuniary information to improve a waste collection and disposal program in Surabaya, Indonesia with a randomized conjoint field experiment.
The conjoint analysis itself has been conventionally known as a widely used method to identify characteristics of target goods or services in a marketing field since the 1970s. However, this method had had limitations since it’s based on a more theoretical model-dependent procedure. Hainmueller et al. [
20]’s approach has enabled “researchers to nonparametrically identify and estimate the causal effects of many treatment components simultaneously” to fill up with the prior methodological theory gap. This method has strengthened the advantage by not only randomly selecting respondents but also randomly showing the contents of choice card in the questionnaire when conducting the survey to estimate the causal effects of components given to respondents. So, the choice conjoint experiment has been a very powerful tool to identify rationally how strongly a certain attribute affects respondents’ preferences when they decide.
This study is also following the same method to analyze SWM management in Kathmandu by identifying households’ preferences as an example. To compare with relevant studies such as [
15,
16], we set similar five attributes with two to four levels, which will be mentioned in the next section. We believe that our approach can be applied to other areas’ SWM policymaking.
3. Methods
Conjoint analysis is a standard tool used to study how buyers appreciate the characteristics of products or services and to predict buyer behavior preference. A randomized conjoint experiment was used to obtain the stated preferences of the respondents. In a conjoint experiment, the respondent evaluates the sets of products based on their attributes and levels and then chooses the option that gives them the highest utility or the respondent ranks the options. It is assumed that the respondents treat their utility by adding the utility provided by each attribute level.
Through the conjoint experiment, we can determine the influence of each attribute level on a respondent’s choice [
20]. While carrying out the experiment, we developed a four-part survey questionnaire: (1) information, (2) scenario, (3) choice-set of randomized conjoint experiments, and (4) background information about the respondents, such as age, sex, marital status, education level, occupation, regional location, employment status, and monthly income.
In this study, a randomized conjoint experiment consists of five attributes with levels. Each attribute has two to four levels. In an actual interview, combinations of levels of the attributes for each choice profile were assigned randomly and appeared in a questionnaire. Details of the attributes, levels, and baseline (i.e., Level 1) are given below in
Table 1.
This study intends to elicit a preference for improvement in SWM services in Kathmandu, Nepal. For this, we proposed an improved SWM profile including five attributes and levels. Some of the proposed attributes are designed based on previous studies, such as “monthly service charge”, “intermediate garbage processing facility”, and “garbage pickup frequency” [
15].
“Monthly service charge” is about choice for cost of the waste management service. A negative attitude to the cost is usually expected, but by using this attribute, we can see how sensitive respondents’ reaction to the cost is. “Intermediate garbage processing facility” is items for facility type to dispose of garbage, but in Nepal, it is not obvious which type of facility is demanded at all since such facilities are absolutely insufficient. “Garbage pickup frequency” is about choice for frequency of the waste management service. In general, frequent service should be desirable but the frequency would proportionately increase the cost for service so it’s not so trivial that many services are always acceptable.
Likewise, we proposed two other attributes, “temporary garbage collection spot” and “garbage pickup service provider”, based on the respondents’ responses during the pilot study and evidence that trust in the service provider plays a vital role in choice preferences [
21,
22].
“Temporary garbage collection spot” is about choice for collection spot. Due to that absolute lack of collection spots, whether the personal type of spot or community type of spot is de-manded by residents is not so obvious. “Garbage pickup service provider” is about the type of service provider. Whether public service is really trusted by residents is also an interesting problem to improve waste management.
Levels of attributes are adjusted based on the current SWM of Kathmandu. These levels are set by authors virtually in the table. Of course, these can be flexibly changed according to the purpose of the research or the researcher’s intentions. In this study, we decided these levels as reasonable option examples that we thought.
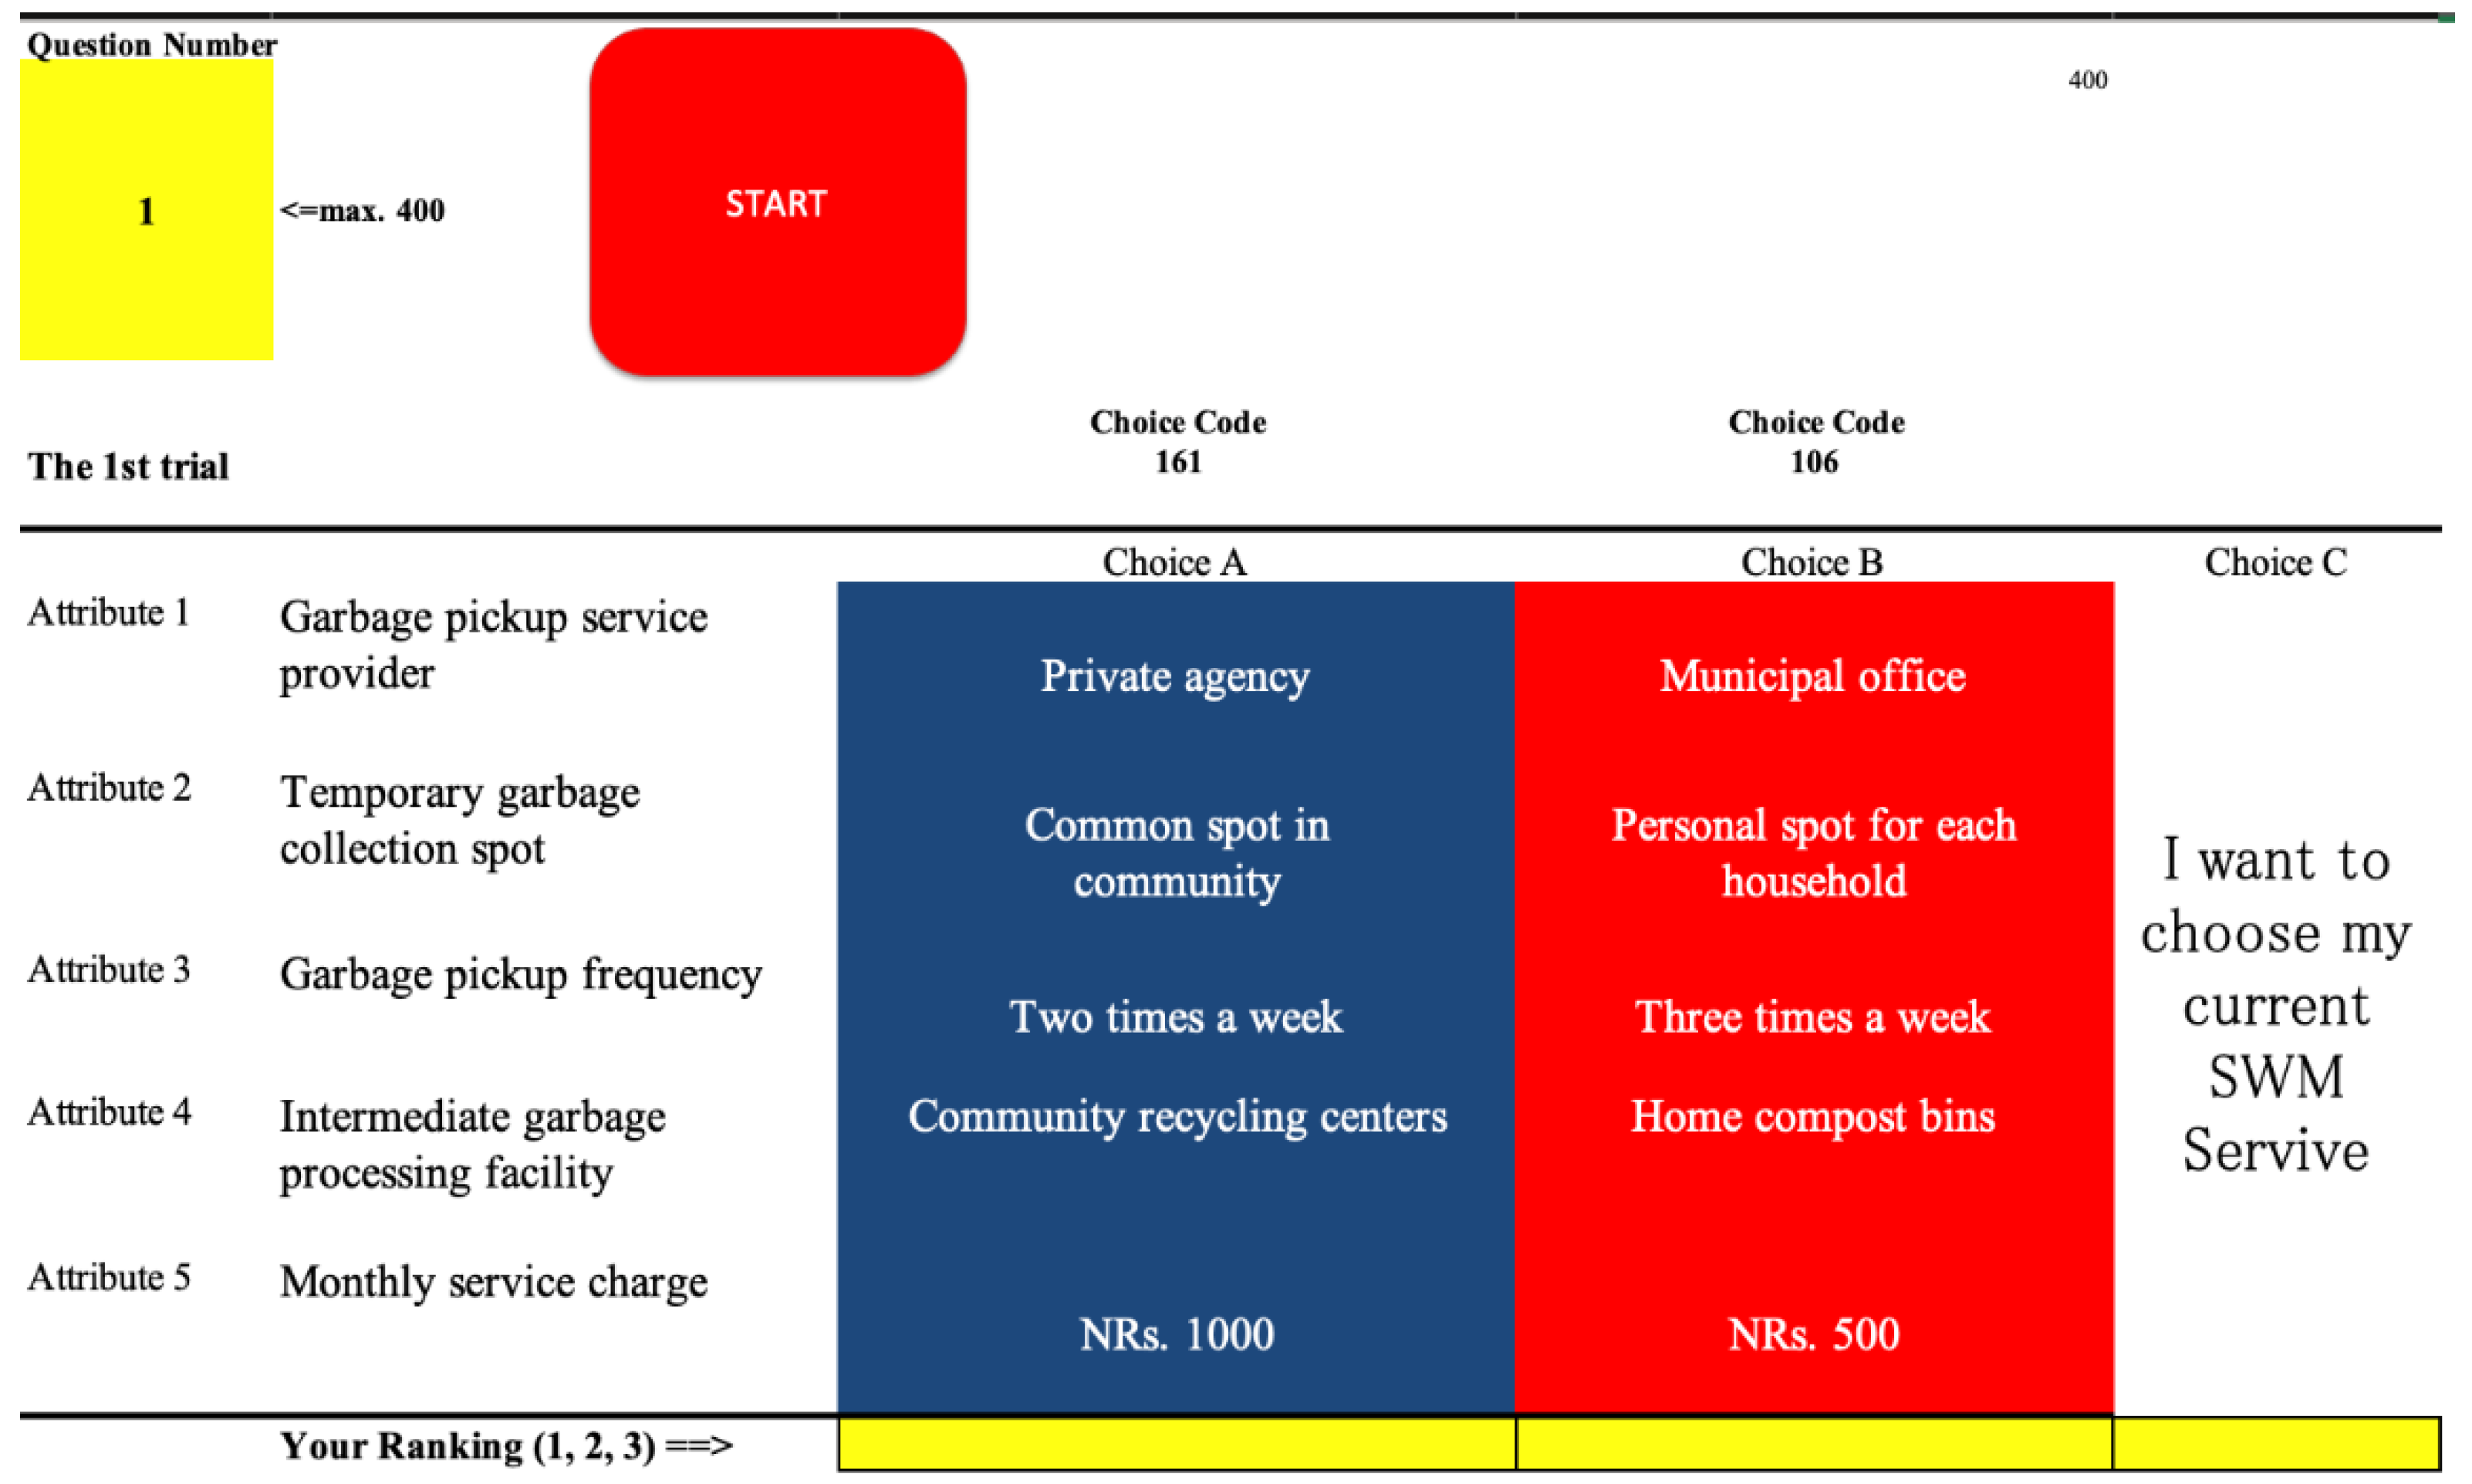
After reading the scenario, respondents were asked to rank the most preferable set of choices by choice set (A), choice set (B), or choice set (C) and rank them as one, two, or three based on their preference for enhanced SWM services. Each profile was designed with different alternatives.
Figure 1 is one of the examples of the choice card. As this figure shows, choice sets (A) and (B) consist of combinations from the attribute table (which randomly appeared).
In this study, we tried to identify factors that significantly influence household preferences for hypothetically improved solid waste management policies by estimating the probability of internal choice and external choice. Regarding internal probability, the preference of respondents under two hypothetical alternative policies, choice (A) and choice (B), was estimated. This result shows if there would be only two choices such as (A) and (B), respondents would prefer which choice more. Meanwhile, in external choice probability, we estimate the preference of respondents between the status quo and two alternative hypothetical policies. The first two are hypothetical alternatives with five attributes and levels, and the third alternative is the status quo. This means if there are three choices including the status quo (current SWM services), respondents would prefer which choice more. These attributes are randomized to avoid any possibility of an ordering effect for each respondent. Similarly, to avoid cognitive strain, the order was randomized for all three profiles presented to the same respondent. We followed the approach suggested by [
20] to estimate the probability of internal and external choice. They nonparametrically identified the average marginal component effect (AMCE) for each of the attributes and levels on the probability of choosing a profile by randomized conjoint analysis. As the attribute levels were assigned randomly, the ordinary least square (OLS) method was simply used to estimate the AMCE of each attribute as a coefficient based on a linear regression of the indicator of choice over the set of dummy variables for the attributes and levels. The model is as follows:
where
is a dummy variable for the
-th level of policy
in task
of respondent
ii = 1, …, 400, is the number of respondents,
l = 1, …, 5, is the number of attributes,
Dl = (D1, D2, D3, D4, D5) = (4, 4, 3, 3, 2) is the number of levels of the attributes, and
is the number of choice card task repetitions.
is the coefficient, and denotes the error terms. ϵ {0, 1} is a choice indicator variable: in the internal choice probability estimation, = 1 if the preference rank of policy j is higher than its alternative policy and 0 if the rank is lower. In the estimation of the external choice probability, = 1 if the preference rank of policy j is higher than the status quo. The constant term can be interpreted as the possibility the respondents chose the combination of benchmark attributes.
The advantages of using this approach are the assumption of conditional independence since the order of attributes for each respondent is assigned purely at random. Nonparametric estimation of the effect is conducted using all variables as the dummy ().
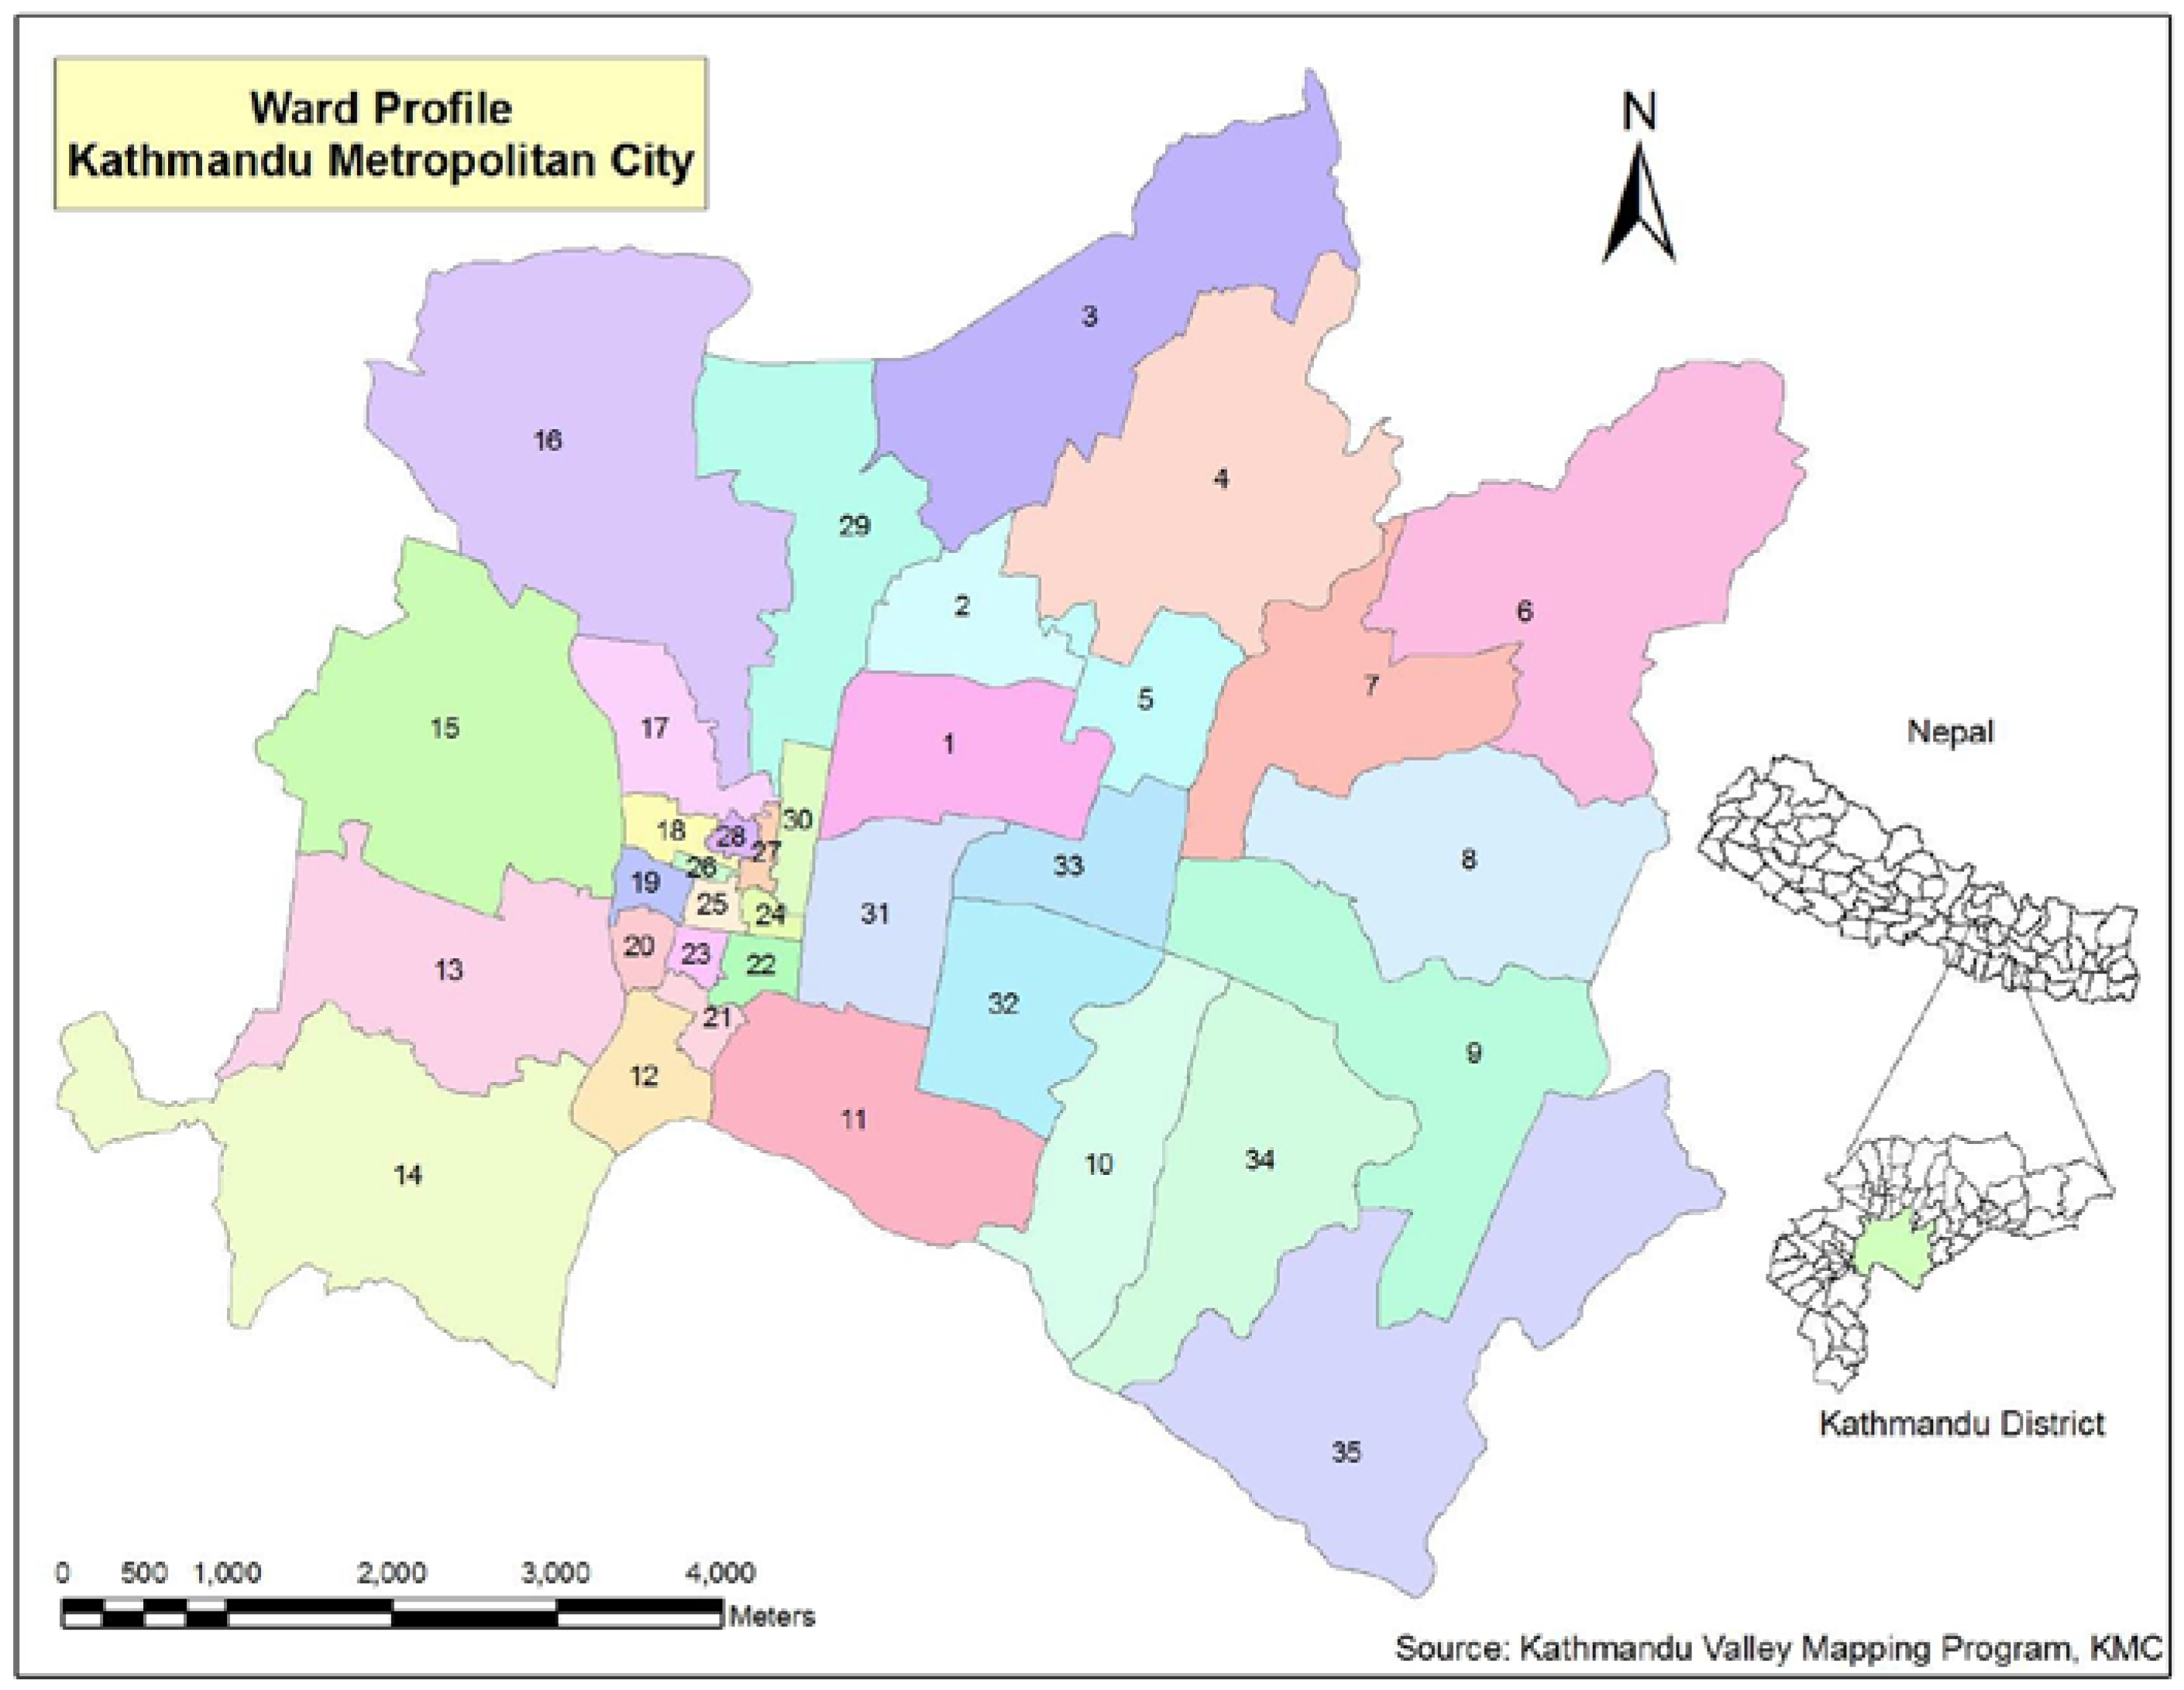
This experiment was carried out in Kathmandu Metropolitan City Ward no. 10, Nepal. This ward is one of 32 wards in the KMC, where solid waste management has been a major issue for several years. This study helps us understand the preferences of households for improved solid waste management services in the urban hub of Kathmandu Metropolitan City. For our research study, the data were collected in two phases: the pilot and the main survey. The purposive selection of KMC Ward No. 10 was made based on three major criteria (
Figure 2): (i) high population density, (ii) severe SWM problems, and (iii) administrative and trade hubs. The study area, KMC Ward No. 10, occupies a 1.57 square km area and is home to 39,820 people. For study purposes, we randomly chose the 8 toles from 38 toles of KMC Ward No. 10 by drawing the lottery 8 times and assigned the number 1 to 8 to the selected toles. Then, for odd-numbered toles, we visited every third house with an odd house number; for even-numbered toles, we visited every third house with an even house number. The main survey lasted twelve days based on the paper-based street survey method. During the survey, we visited 420 households, which are around 1% of the residents in the ward, but 400 households participated in our survey which was based on a face-to-face interview. The response rate was 95.23%. Since those households answered choice-card selection five times for two kinds of type, the observation number for the study totaled four thousand as a result.
4. Results
4.1. Overall Results
In this study, 50.5% of respondents were male, and the rest were female. The highest proportion (31.75%) of our respondents belonged to the Kshetri ethnic group, followed by Brahmin (31%). We found that 75.50 percent of the respondents were married, followed by single respondents (23 percent). We found that 62 percent of the respondents lived in rented homes, while 37.25 percent of the respondents lived in self-owned homes. Details of the respondents’ demographic and water supply-related characteristics are shown below (
Table 2).
The analysis permits us to calculate both internal and external choice probabilities, which can also be referred to as external causal effects and internal causal effects, respectively. At the same time, we also calculated the interaction effects and heterogeneous effects on preferences.
The AMCE of the attributes on the internal and external choice probabilities are depicted through the core plot graph in
Figure 2 and
Figure 3, respectively. The solid circle represents a point estimate of AMCE, and the horizontal bar represents the cluster-robust 95 percent confidence interval.
The levels used as the baseline supposedly define the “best-case scenario” for the respondents and include monthly service charge Nrs. 220 (about 1.85 US dollars), no intermediate garbage processing facility, garbage pickup frequency two times a week, undesignated temporary garbage collection spot, and a private agency as a service provider.
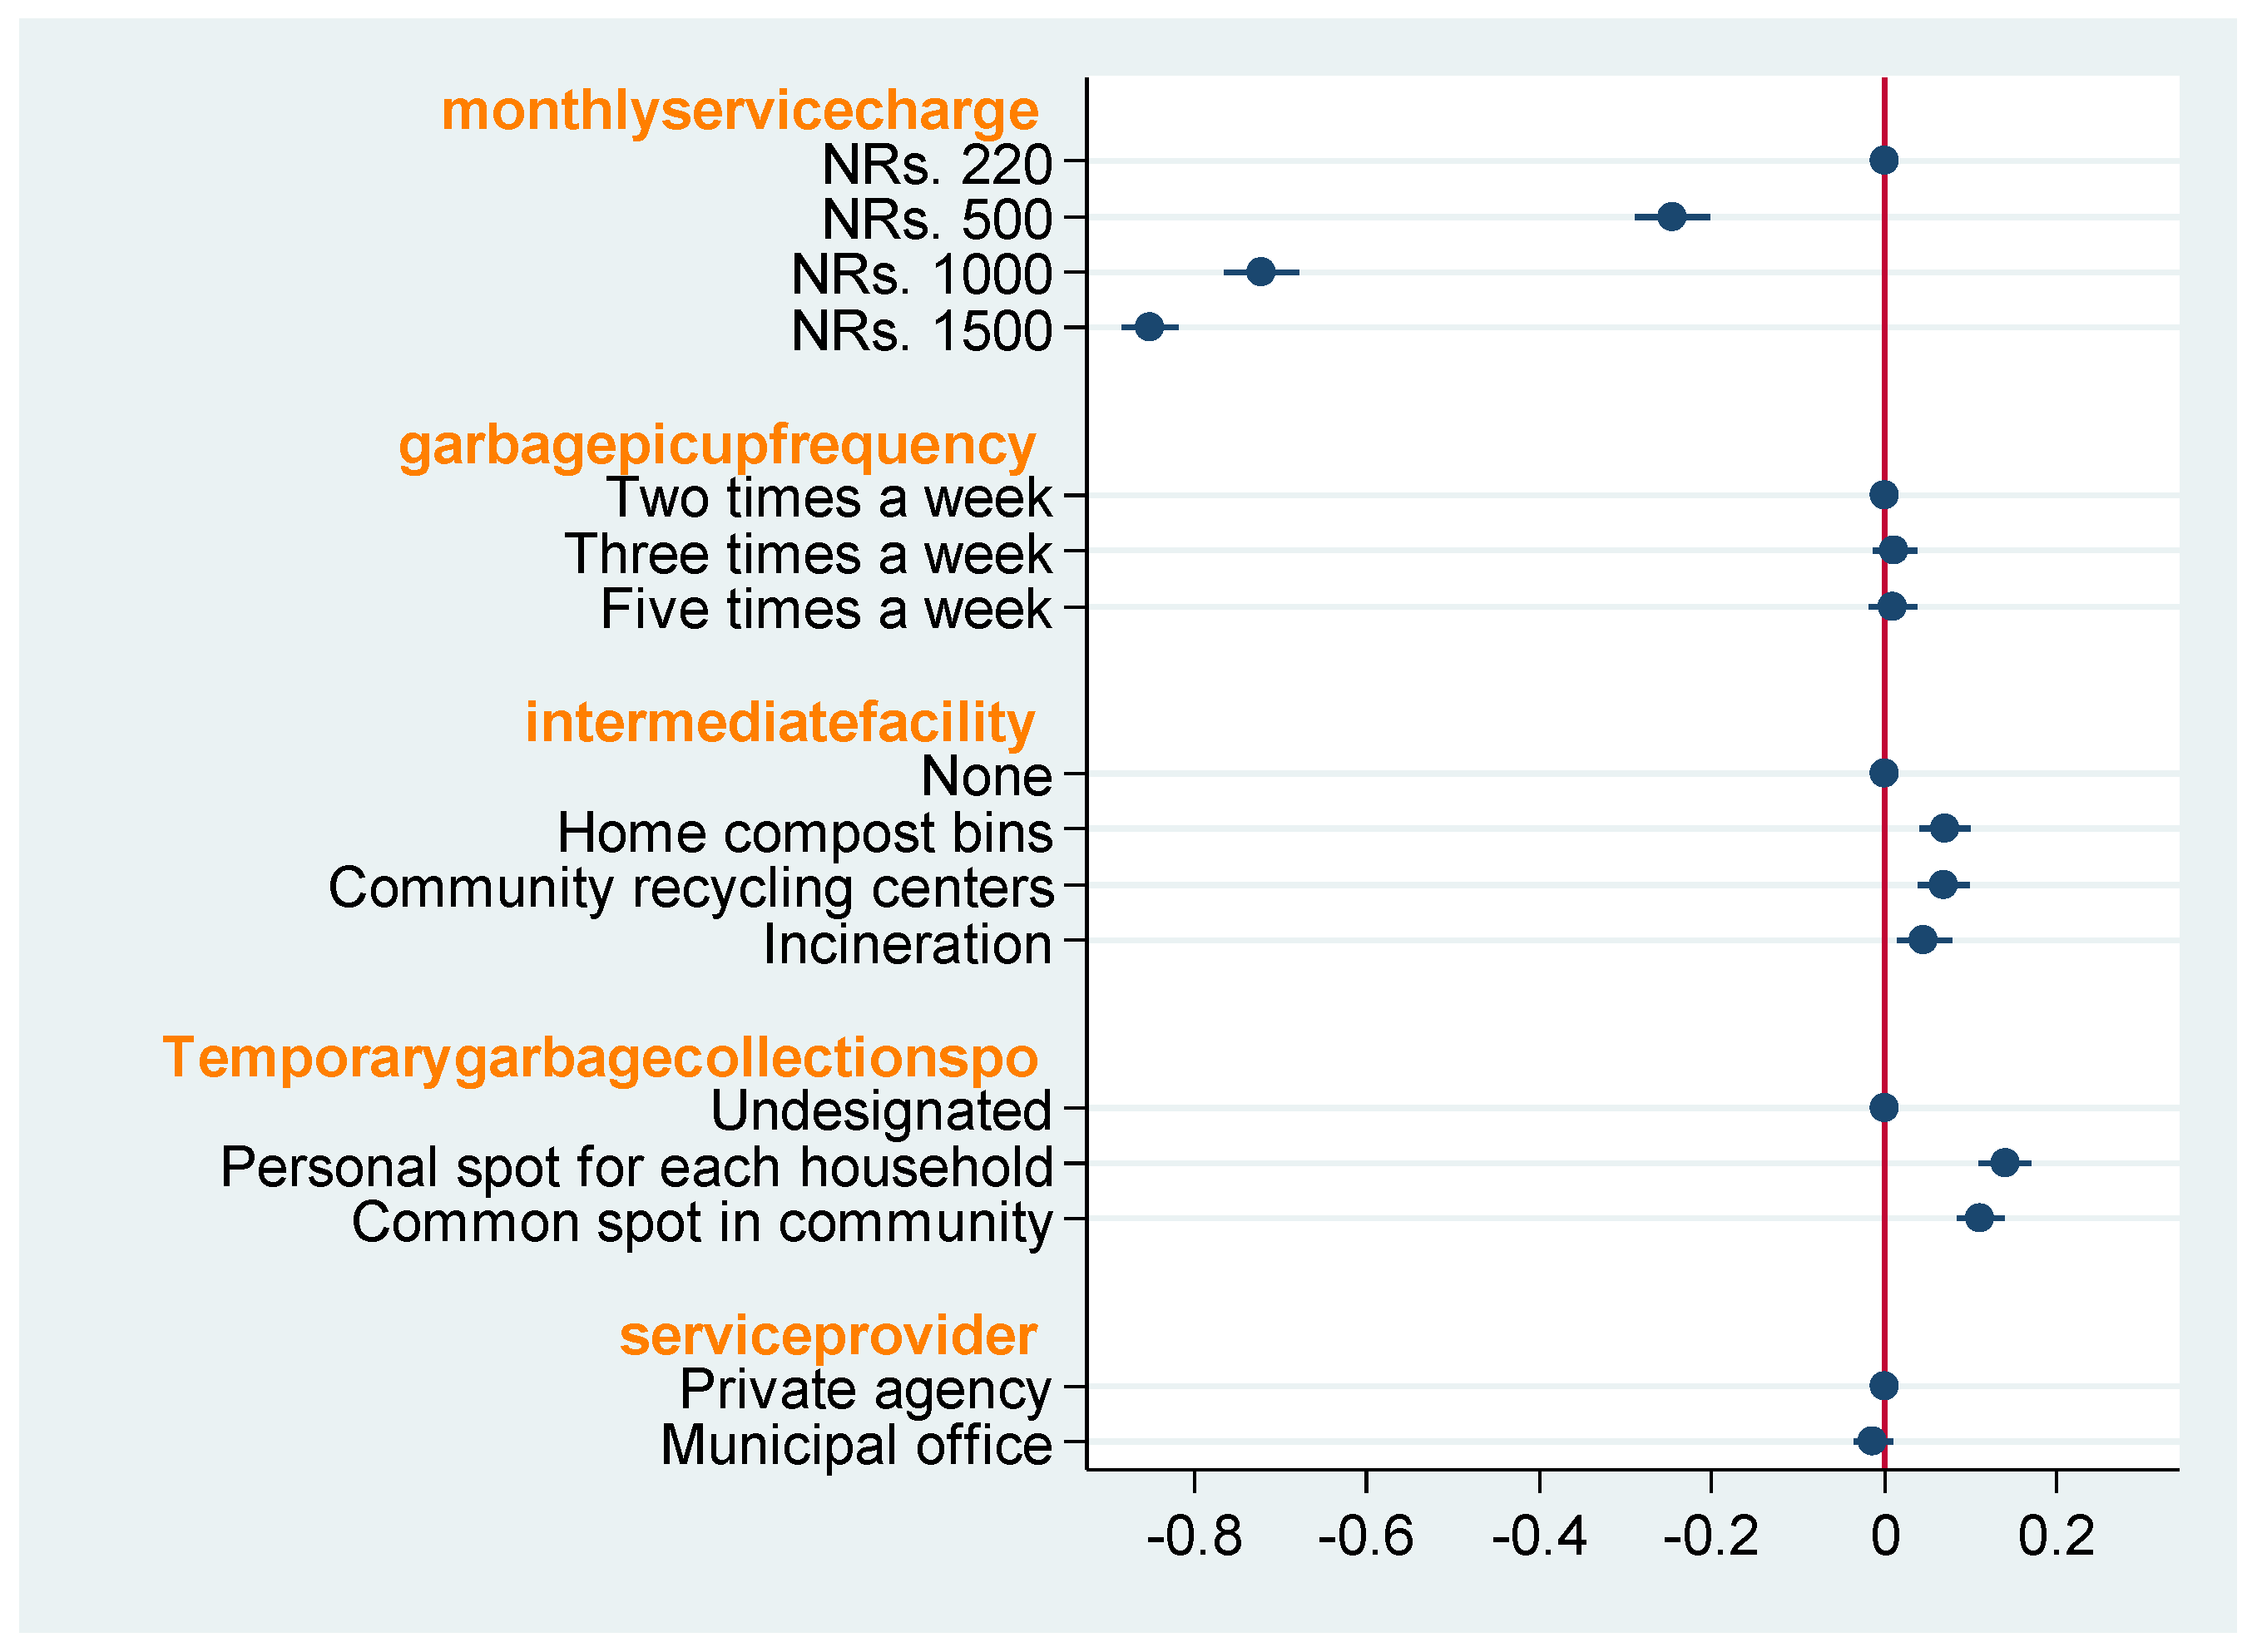
The probability of external choice shows that households accept the new and improved SWM service compared to the current situation (status quo).
Figure 3 shows the external causal effects of the attributes on preferences. The status quo is the current SWM services. The hypothetical baseline setting is preferred to the status quo.
We find that monthly service charge, intermediate facility, and temporary garbage collection spots have a statistically significant effect on preferences. However, the other two attributes (garbage pickup frequency and service provider) do not have a statistically significant (within the 95% confidence interval) effect. When monthly service charge is at level 2 (NRs. 500) 24.62%, at level 3 (NRs. 1000) 72.15% and at level 4 (NRs. 1500) 85.15% of the respondents demonstrate that this has a statistically significant negative influence on their preferences, which means the increasing cost drastically reduces the probability to choose a new SWM service. Similar to prior studies, it indicates that respondents most negatively respond to the price of the service.
Regarding intermediate facilities, at level 2 (home compost bins) 7.03%, at level 2 (community recycling centers) 6.91%, and at level 3 (incineration) 4.5% of the respondents show a statistically significant positive influence. This shows that these intermediate facilities can increase the probability to choose a new SWM service rather than no facility, meaning that respondents currently have dissatisfaction with the situation of SWM in Kathmandu and want to introduce some intermediate facilities more (although they don’t care about the type of facility). Here, we can say the difference in their preference among facilities isn’t huge.
Meanwhile, in the case of the temporary garbage collection spot, at level 2 (personal spot for each household) 13.96% and at level 3 (common spot in community), 11.10% of the respondents show that these attributes have a significant positive influence on their choices. This result means that these temporary garbage collection spots can increase the probability to choose a new SWM service rather than the status quo. It shows many households feel insufficiency for current undesignated garbage collection spots and would like to set some designated spots such as common spot or a personal spot.
The constant value (
β0) of the external choice probability in our estimation was 0.862, but this means that the majority of respondents (86%) are willing to choose the proposed baseline SWM services over the existing services. This baseline consists of factors based on the current SWM in Kathmandu and indicates that most of the respondents tend to still choose the current SWM services without any information. However,
Figure 3 shows that intermediate facility and temporary garbage collection spot are significant marginal attributes for their preference.
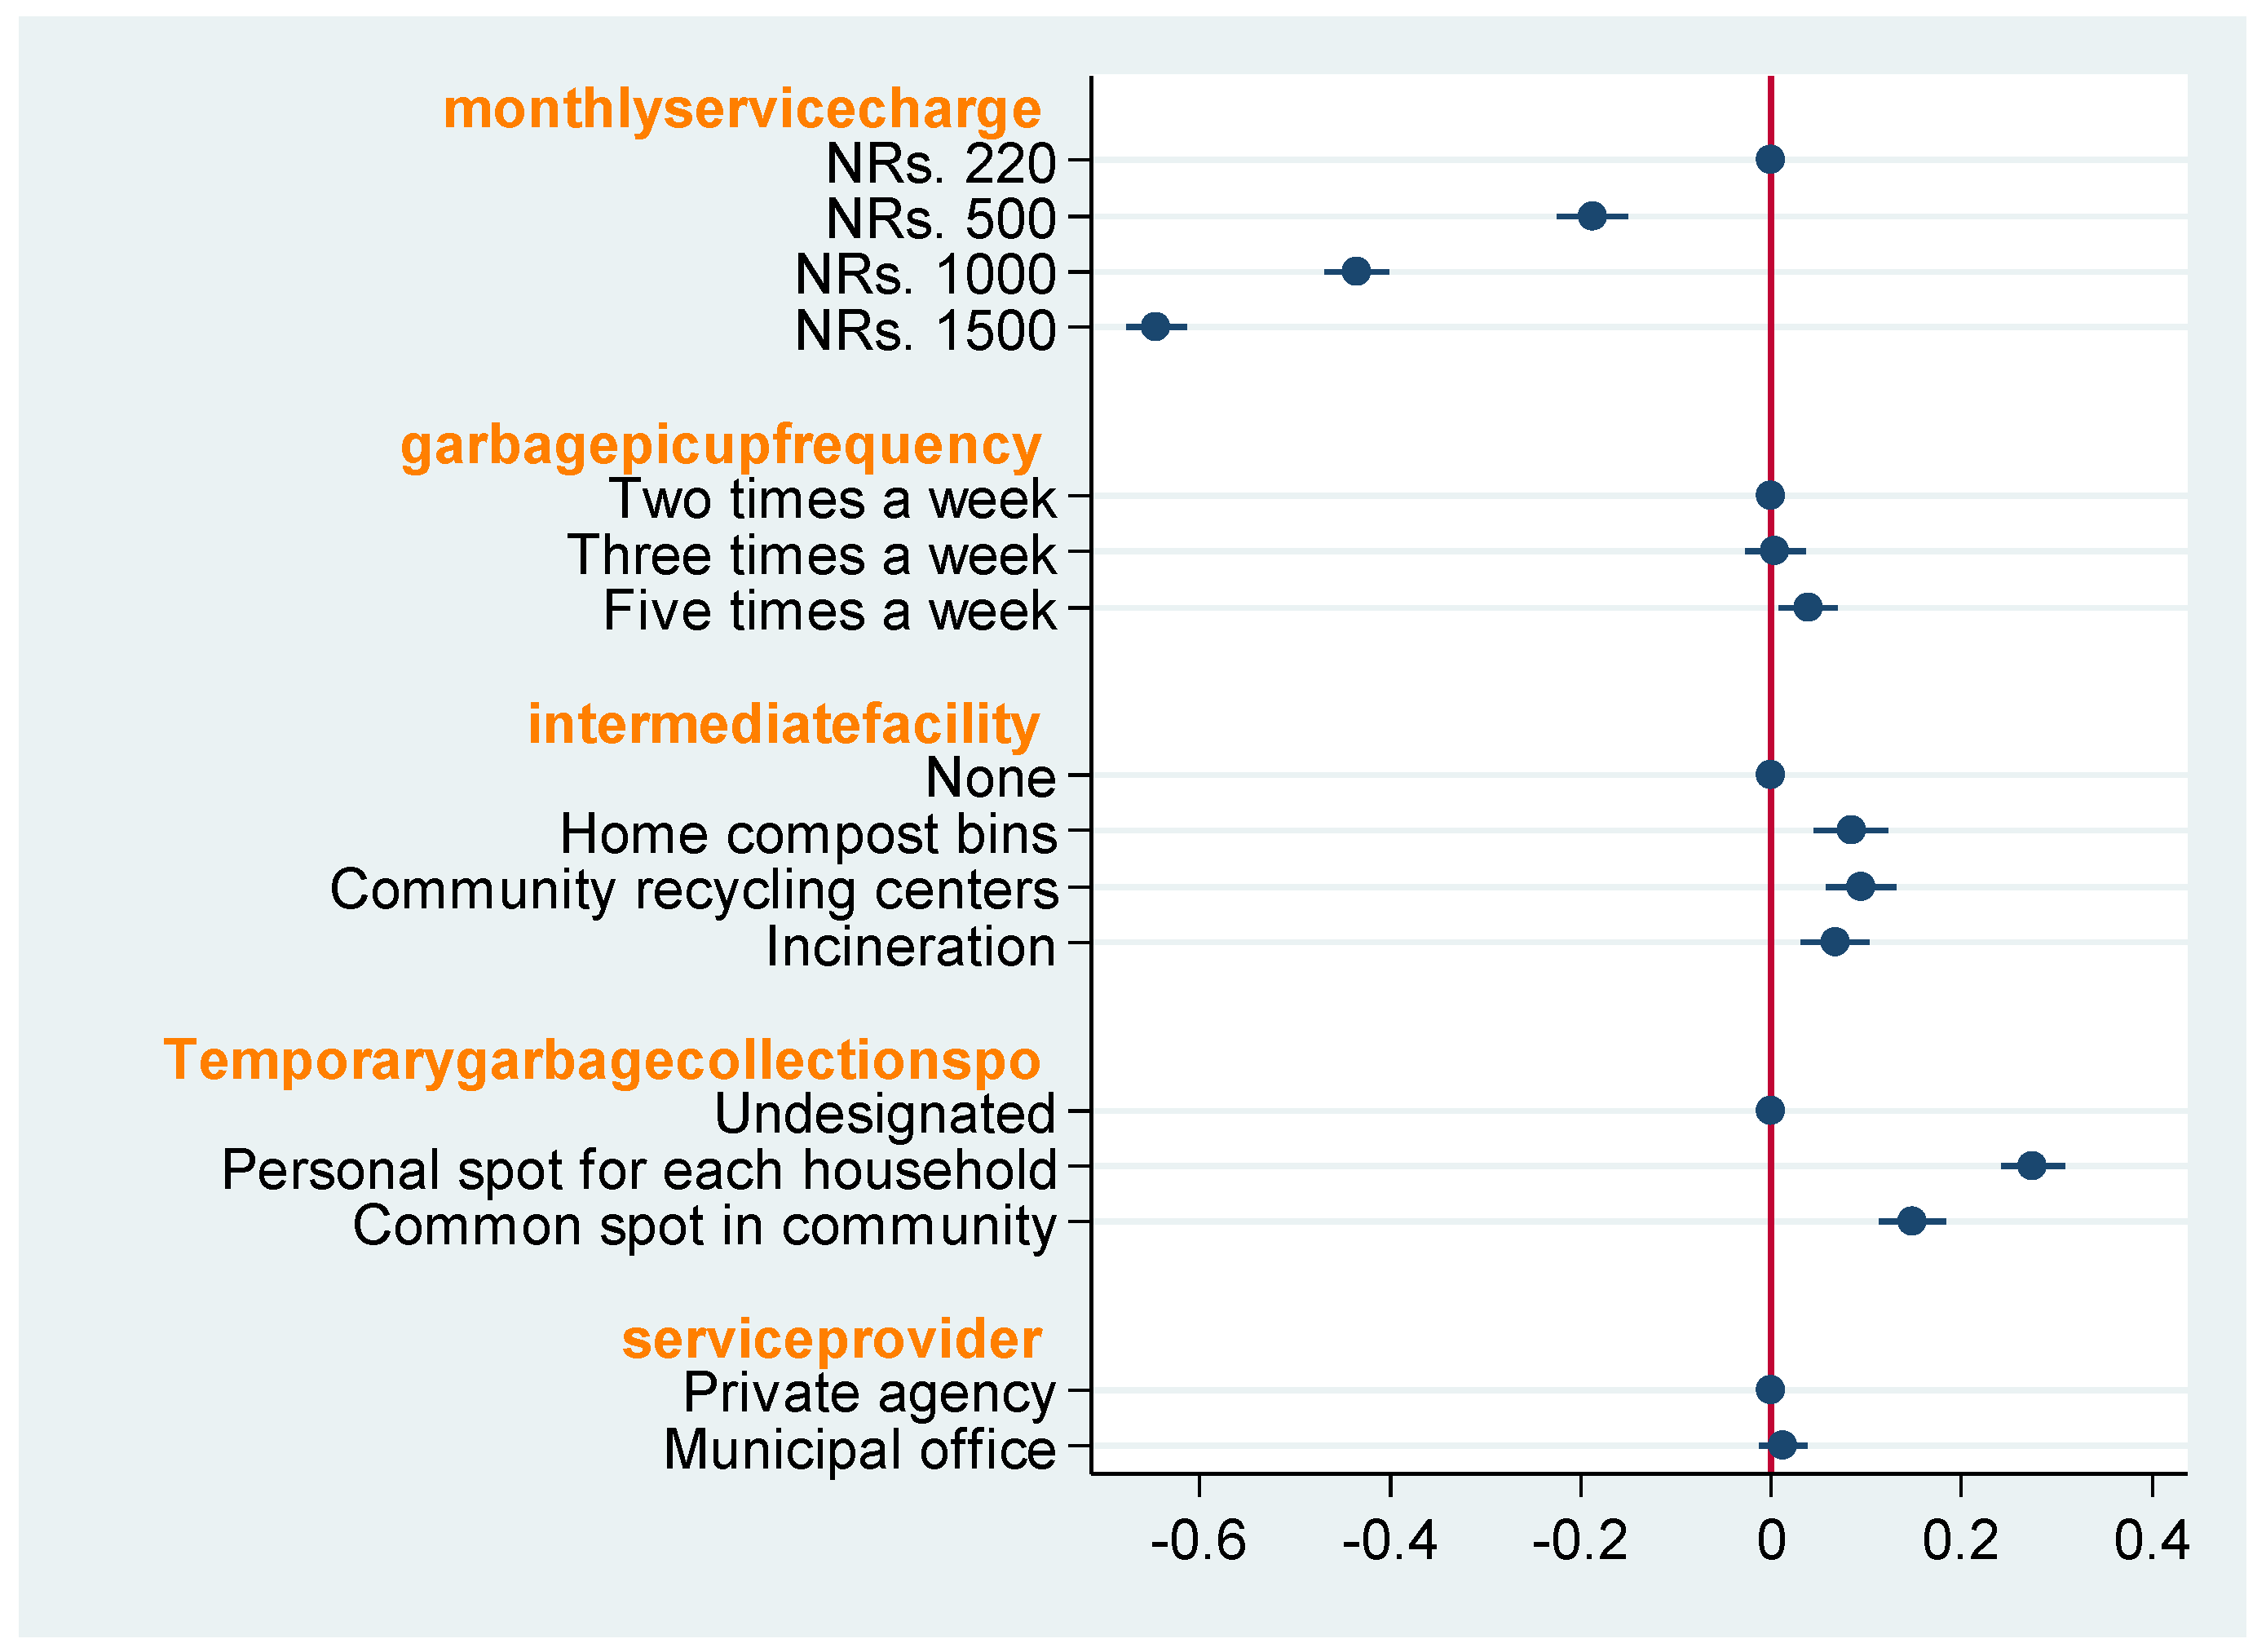
In
Figure 4, internal choice probability reveals the most preferred profile between the two proposed improvement profiles, namely profile (A) and profile (B). Here, we find that monthly service charge, intermediate facility, and temporary garbage collection spot have a significant effect on preferences. However, the other two attributes (garbage pickup frequency and service provider) do not have a statistically significant effect.
When monthly service charge is at level 2 (NRs. 500) 18.76%, at level 3 (NRs. 1000) 43.48%, and at level 4 (NRs. 1500) 64.52%, respondents show that these factors have a statistically significant negative influence on their preferences, which means the increasing cost reduces the probability to choose a new SWM service. Regarding intermediate facilities, at level 2 (home compost bins) 8.44%, at level 2 (community recycling centers) 9.47%, and at level 3 (incineration) 6.73%, respondents show these factors have a significant positive influence. Additionally, in the case of temporary garbage collection spots, at level 2 (personal spot for each household) 27.46% and at level 3 (common spot in community) 14.83%, respondents showed a significant positive influence. This shows that these intermediate facilities can increase the probability to choose a new SWM service rather than no facility. We can conclude that the preferences in the subsample analysis shown above are similar to the overall findings. However, the magnitude of the effects is different. In the case of monthly service charges, the respondents tend to be affected more by service charges in external choice probability than internal choice probability. Meanwhile, more respondents were positively influenced by intermediate facilities and temporary garbage collection spots in internal choice than external choice.
The figures for each level of the three significant attributes are compared in
Table 3.
Comparison of these results shows that respondents positively react to two attributes (i.e., intermediate facility and temporary garbage collection spot) marginally more than current services. It can be noted that most of the respondents significantly raise their choice probability for any type of intermediate facility and temporary garbage spot. Simultaneously, they show their negative reaction to any amount of increase in the service charge.
4.2. Subsample Analysis
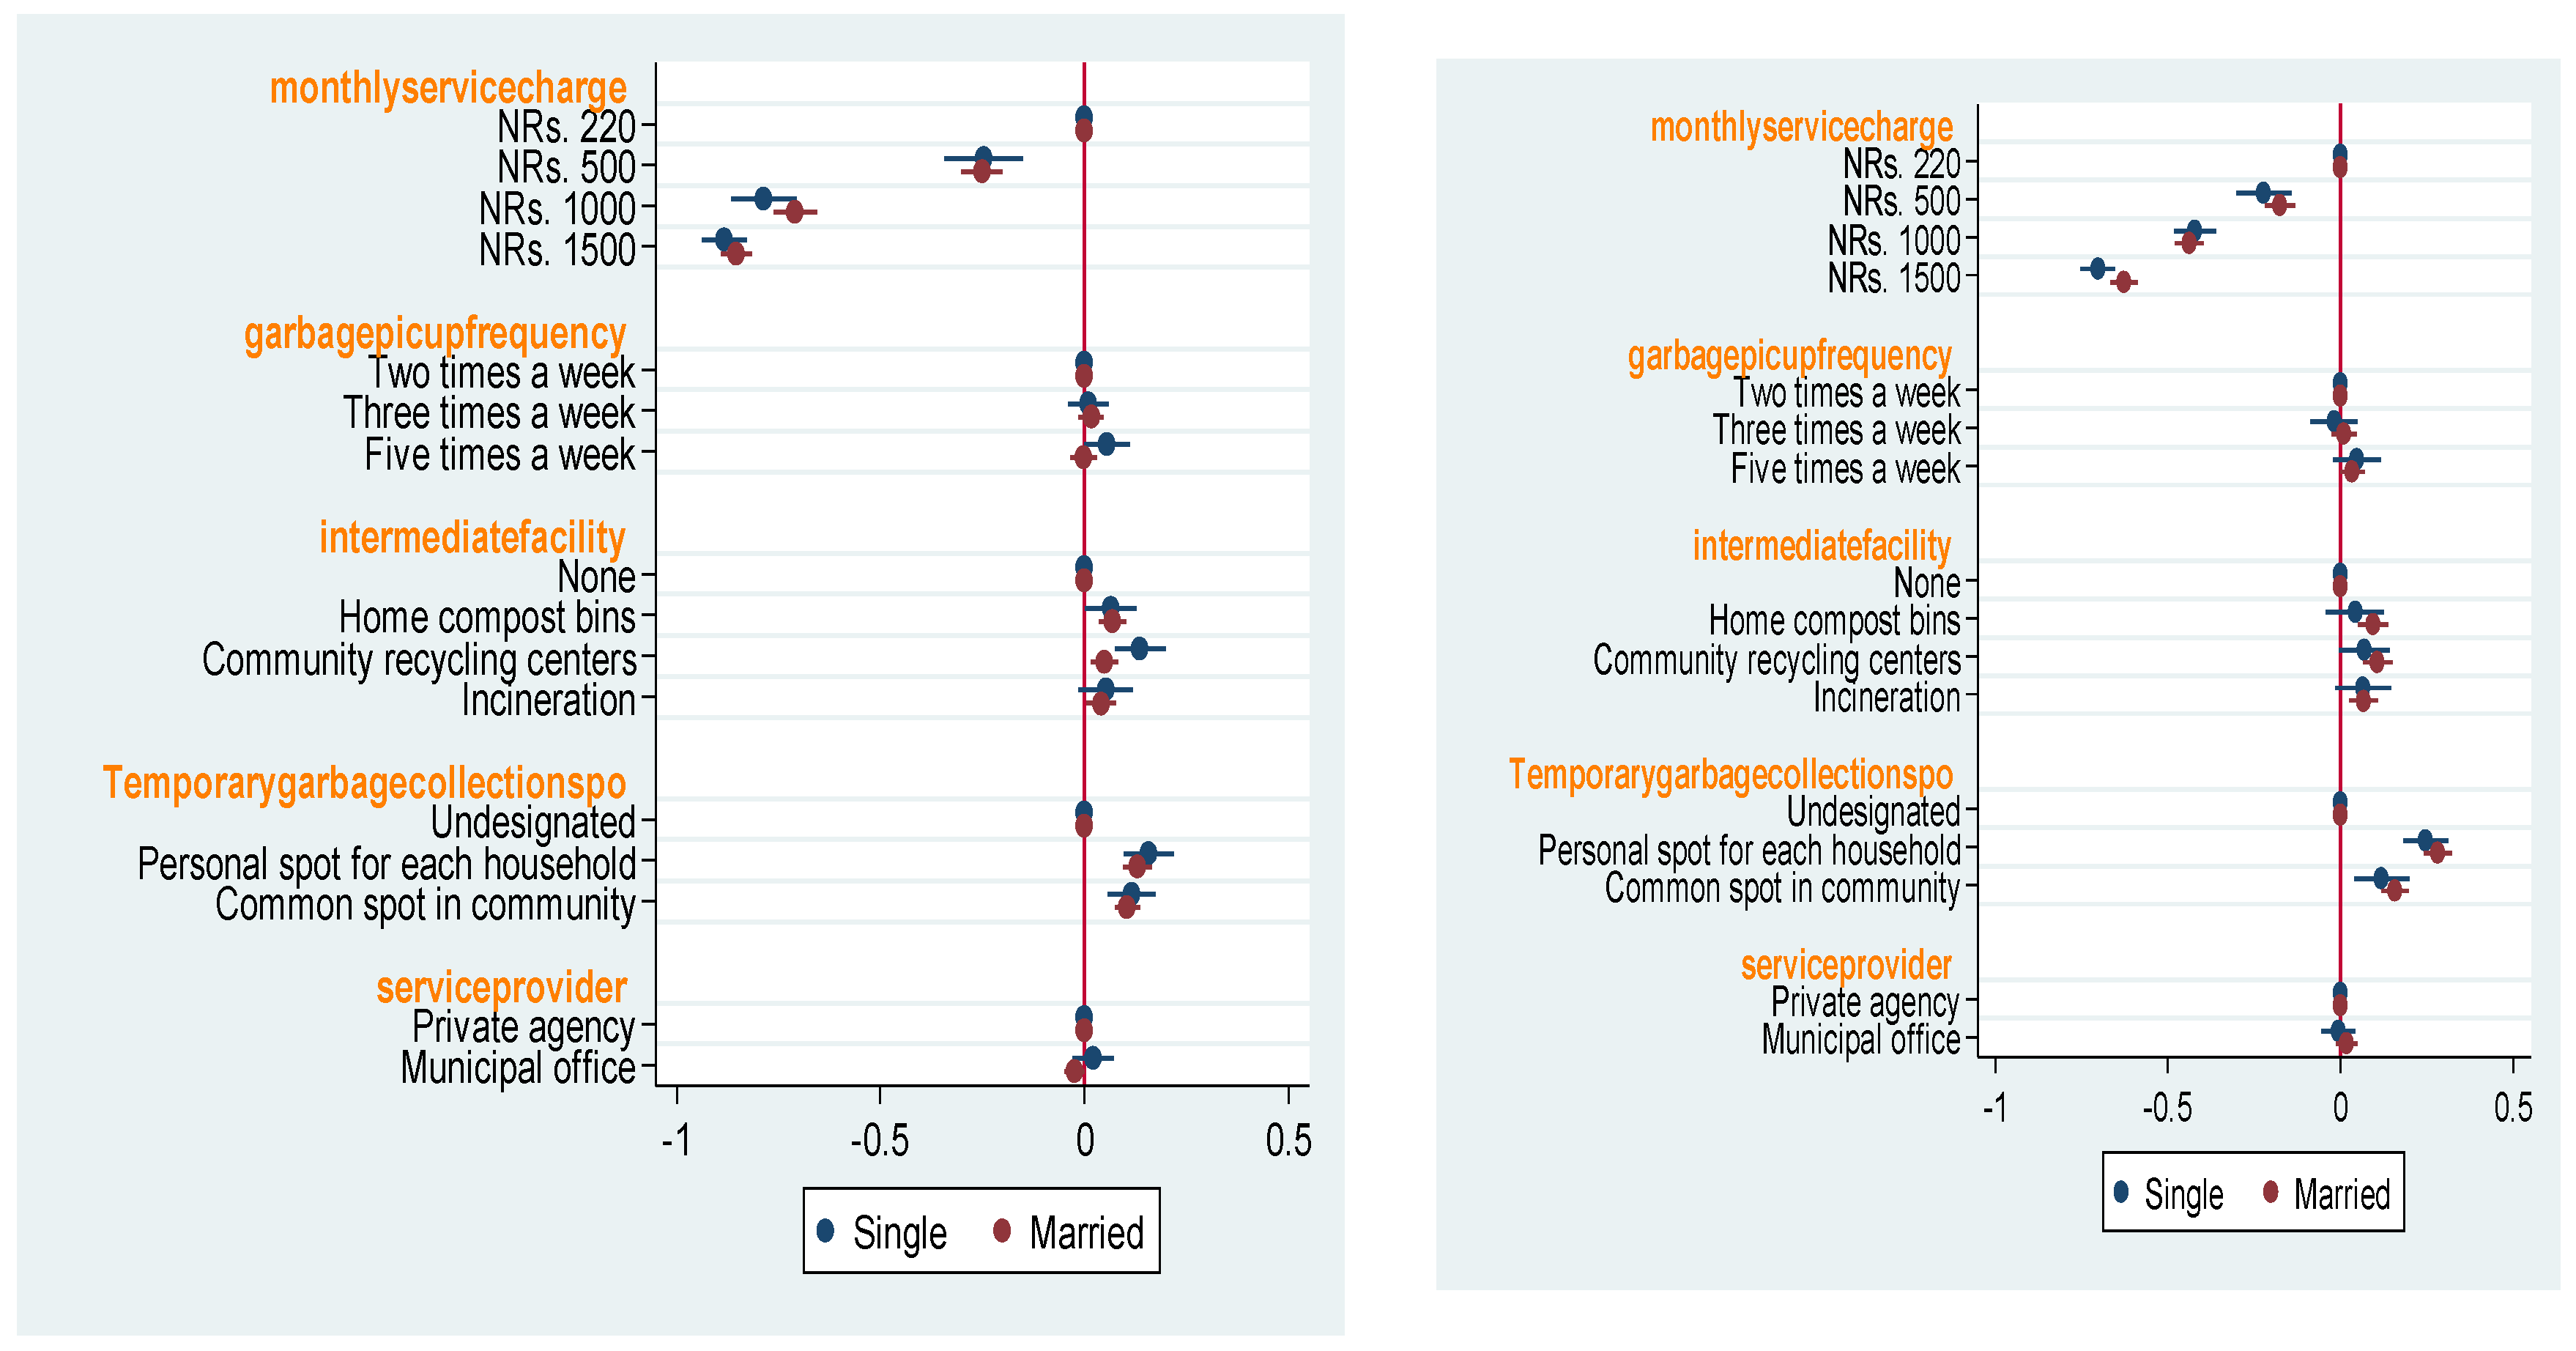
This study estimated the subsample analysis using subsamples broken down to find differences or features between the heterogeneous groups. The causal effects were measured according to marital status, education attainment, monthly income, and years of living in KMC. All of the subsample analyses broadly aligned with the overall results, indicating significant effects of monthly service charges, temporary garbage collection spots, and intermediate garbage processing facilities on preferences. Here, only some of the outcomes are listed below.
By analyzing the subsample by marital status, we identified that married respondents care about intermediate facilities, while single respondents had no significant preference for such facilities in making their choices (
Figure 5). This might be due to the fact that married people were more likely to be engaged in gardening and farming using compost manure. Meanwhile, single respondents may be unable to manage their time for such activities.
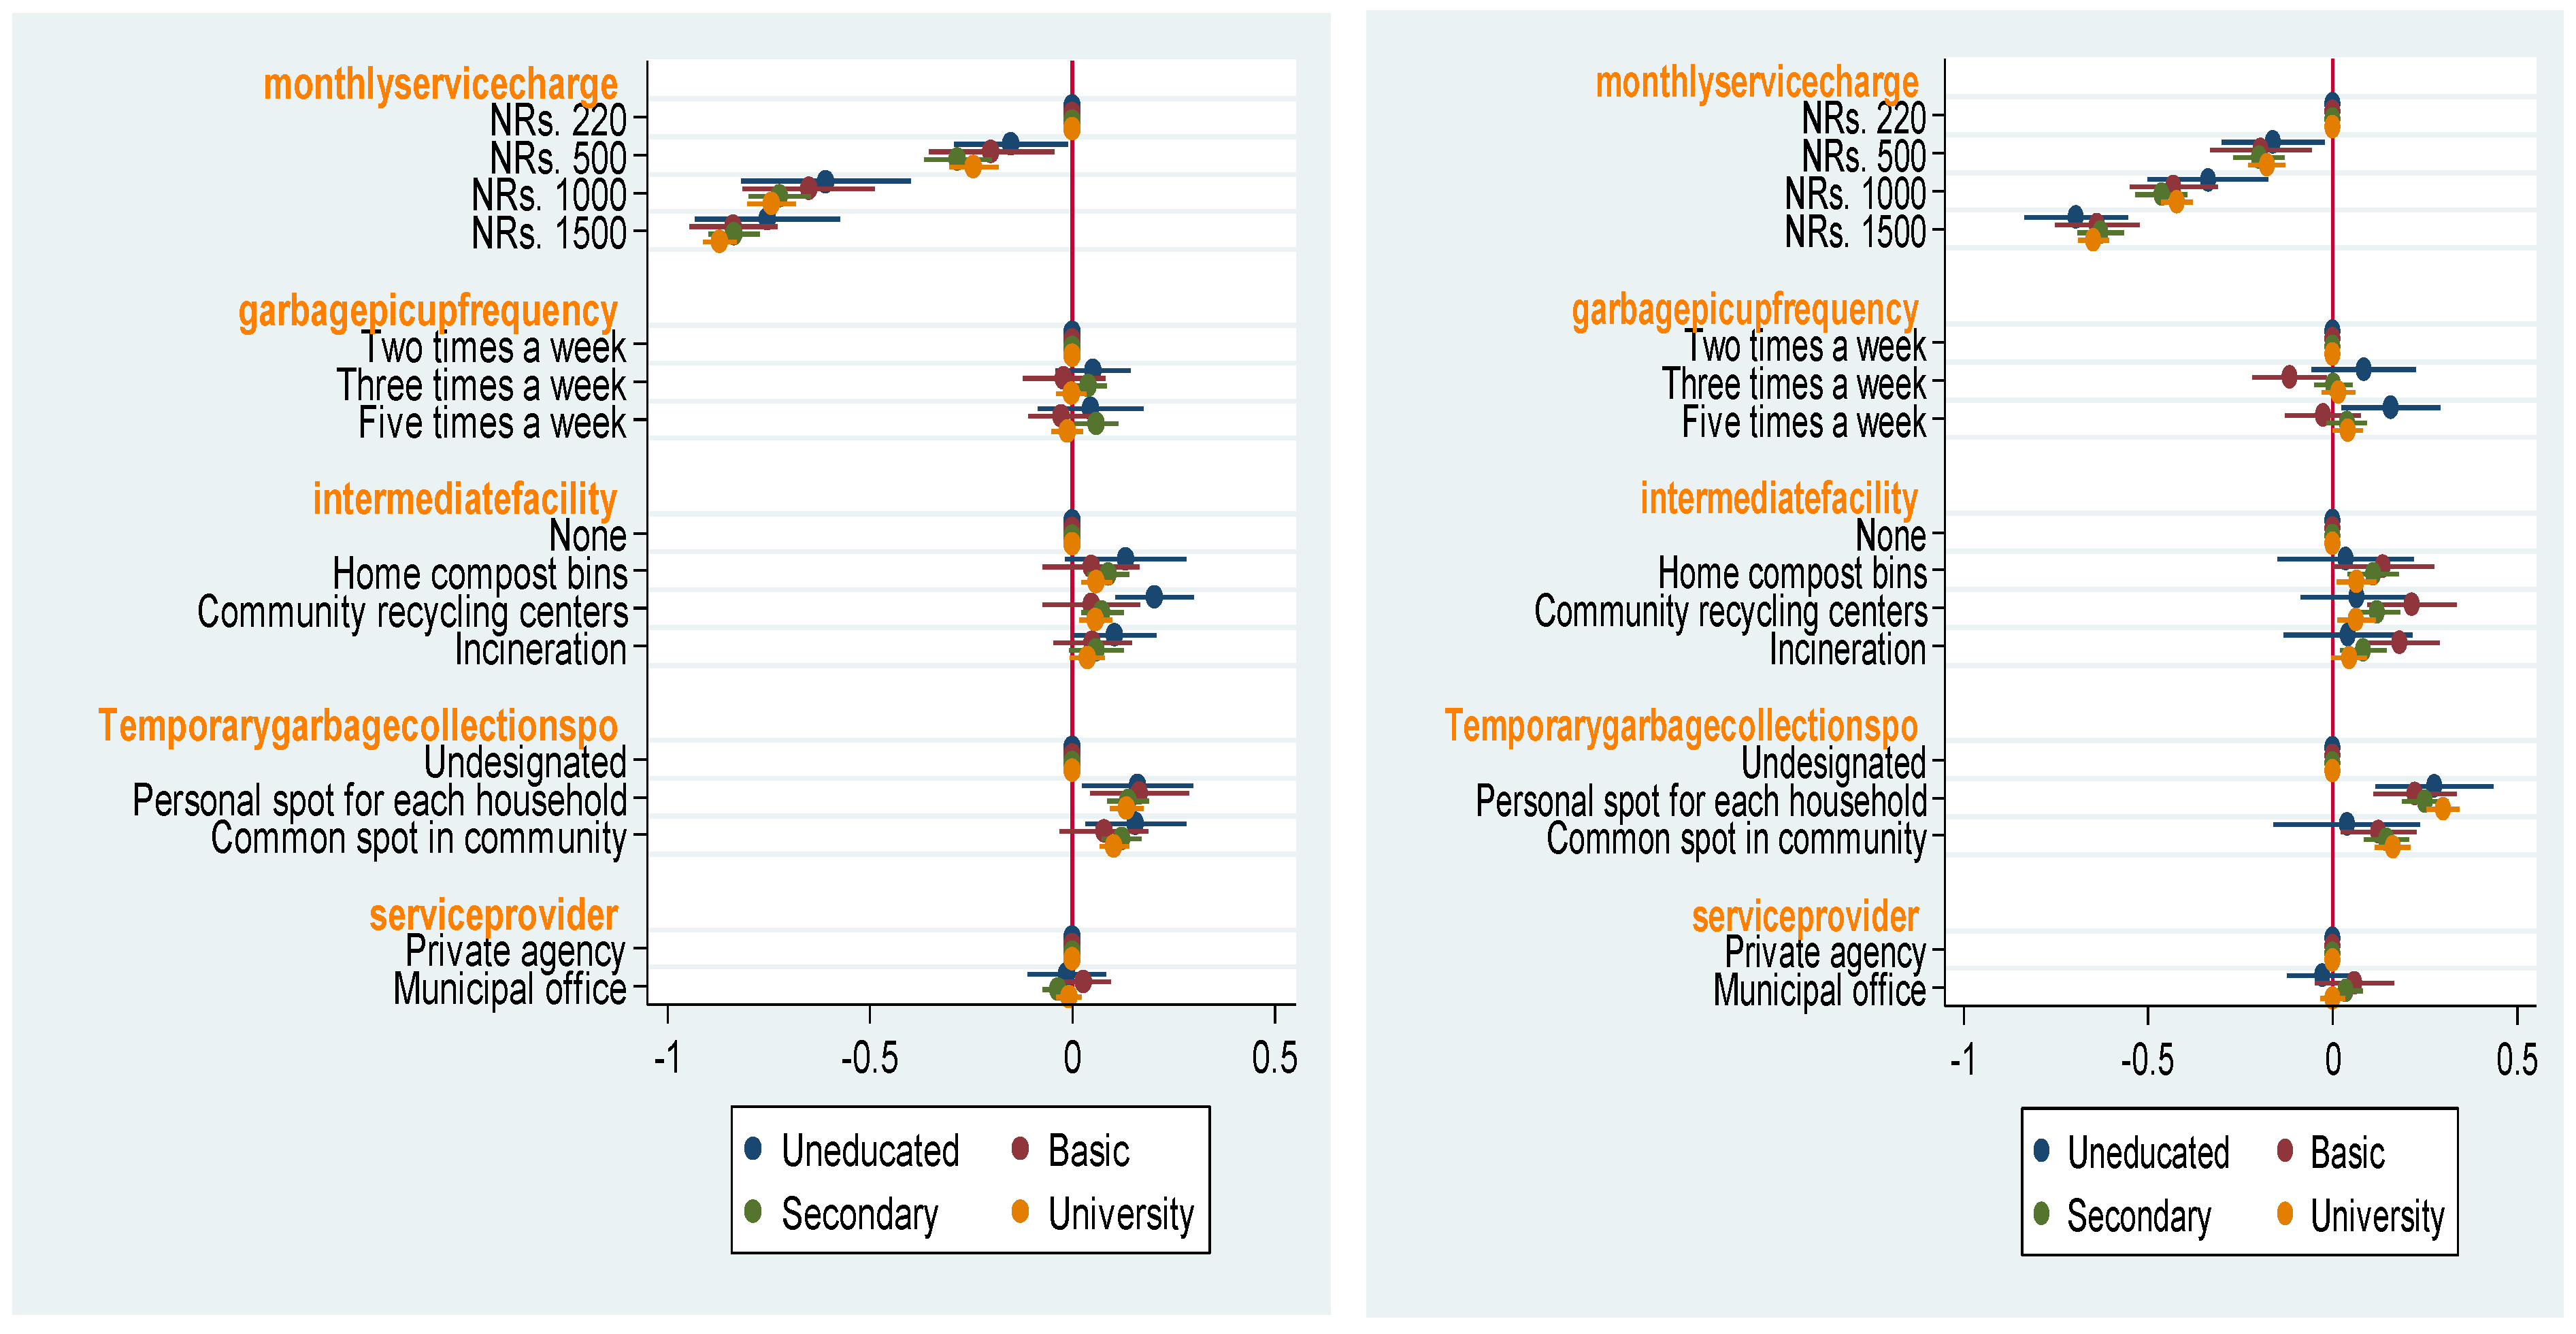
By analyzing the subsample using education attainment, we found that respondents with a university-level education (55% of respondents) did not have a significant preference for incineration in either internal or external choice probabilities (
Figure 6). This might be due to the fact that people with higher education are more likely to have a greater sense of environmental and climate change awareness than other people. Meanwhile, except in the uneducated category, all other educated people preferred intermediate facilities in internal choice probability. Uneducated people do not choose intermediate facilities, probably since either they do not know about the procedures to use these facilities or they are unaware of the benefits of such intermediate facilities.
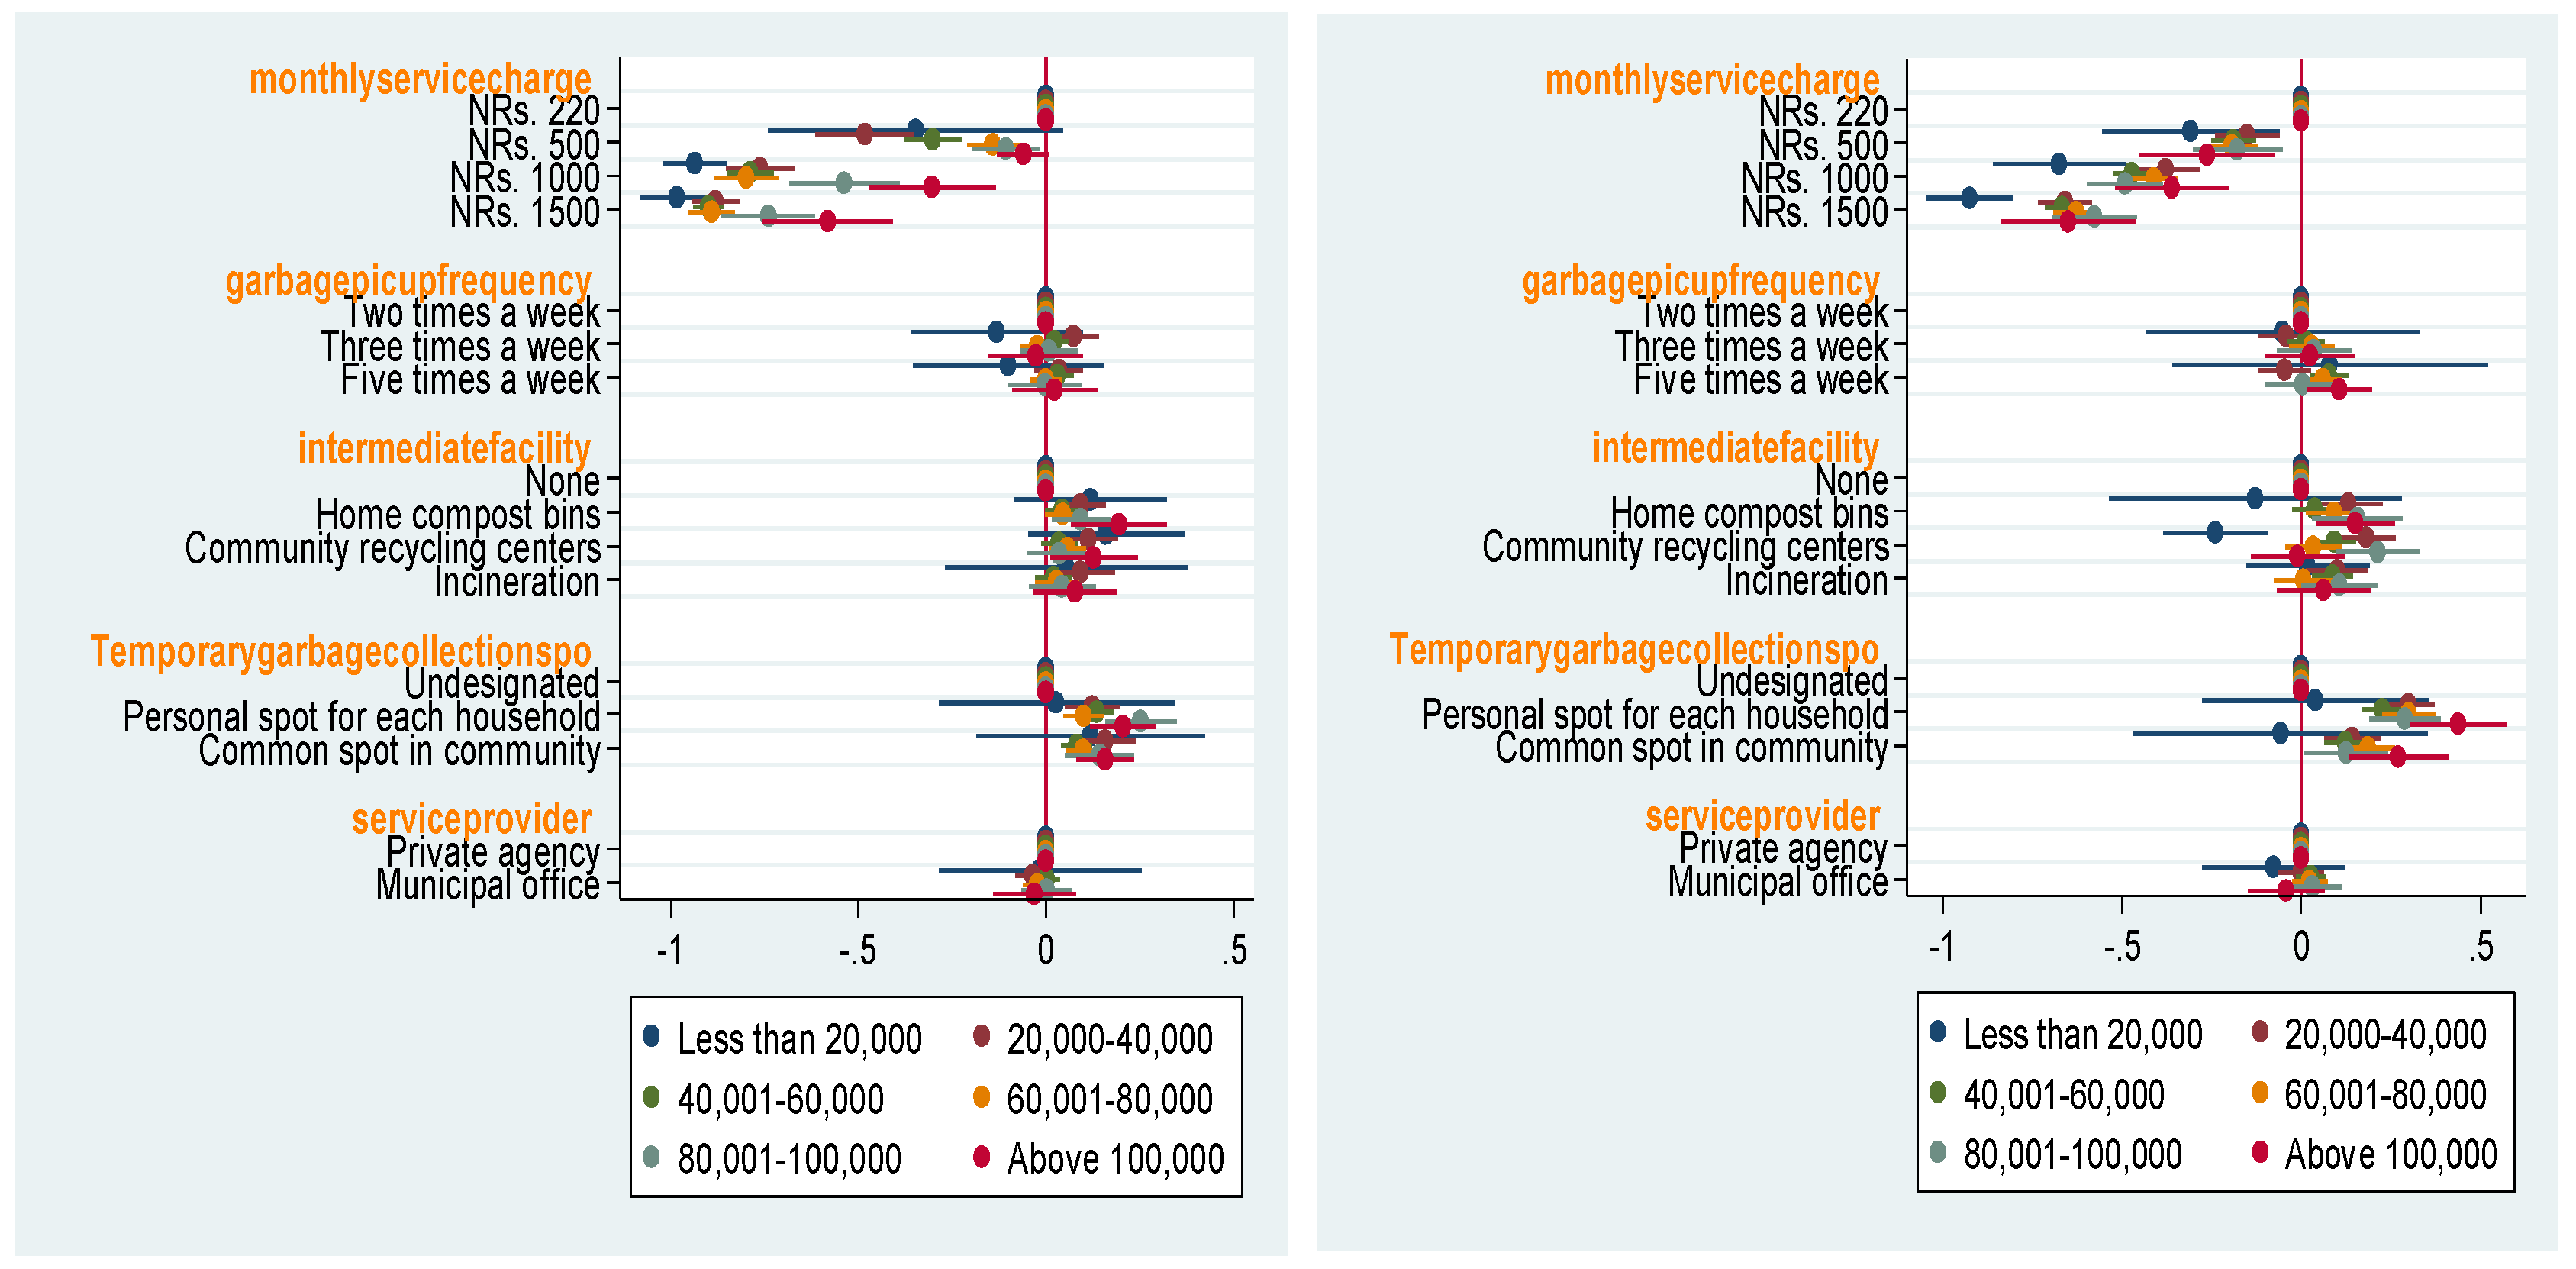
Based on households’ monthly income, we found that households with higher income (e.g., above 100,000) tend to prefer individual-type activities such as “home compost bin” and “personal spot for each household” (
Figure 7). This is probably due to the fact that middle- and higher-income households can afford to choose personal measures as well as community-based activities. On the other hand, households of less than NRs 20,000 monthly incomes are insignificant for other attributes, unlike other households. However, their share of total respondents only accounts for only 1.8%, so this group’s result is not entirely certain.
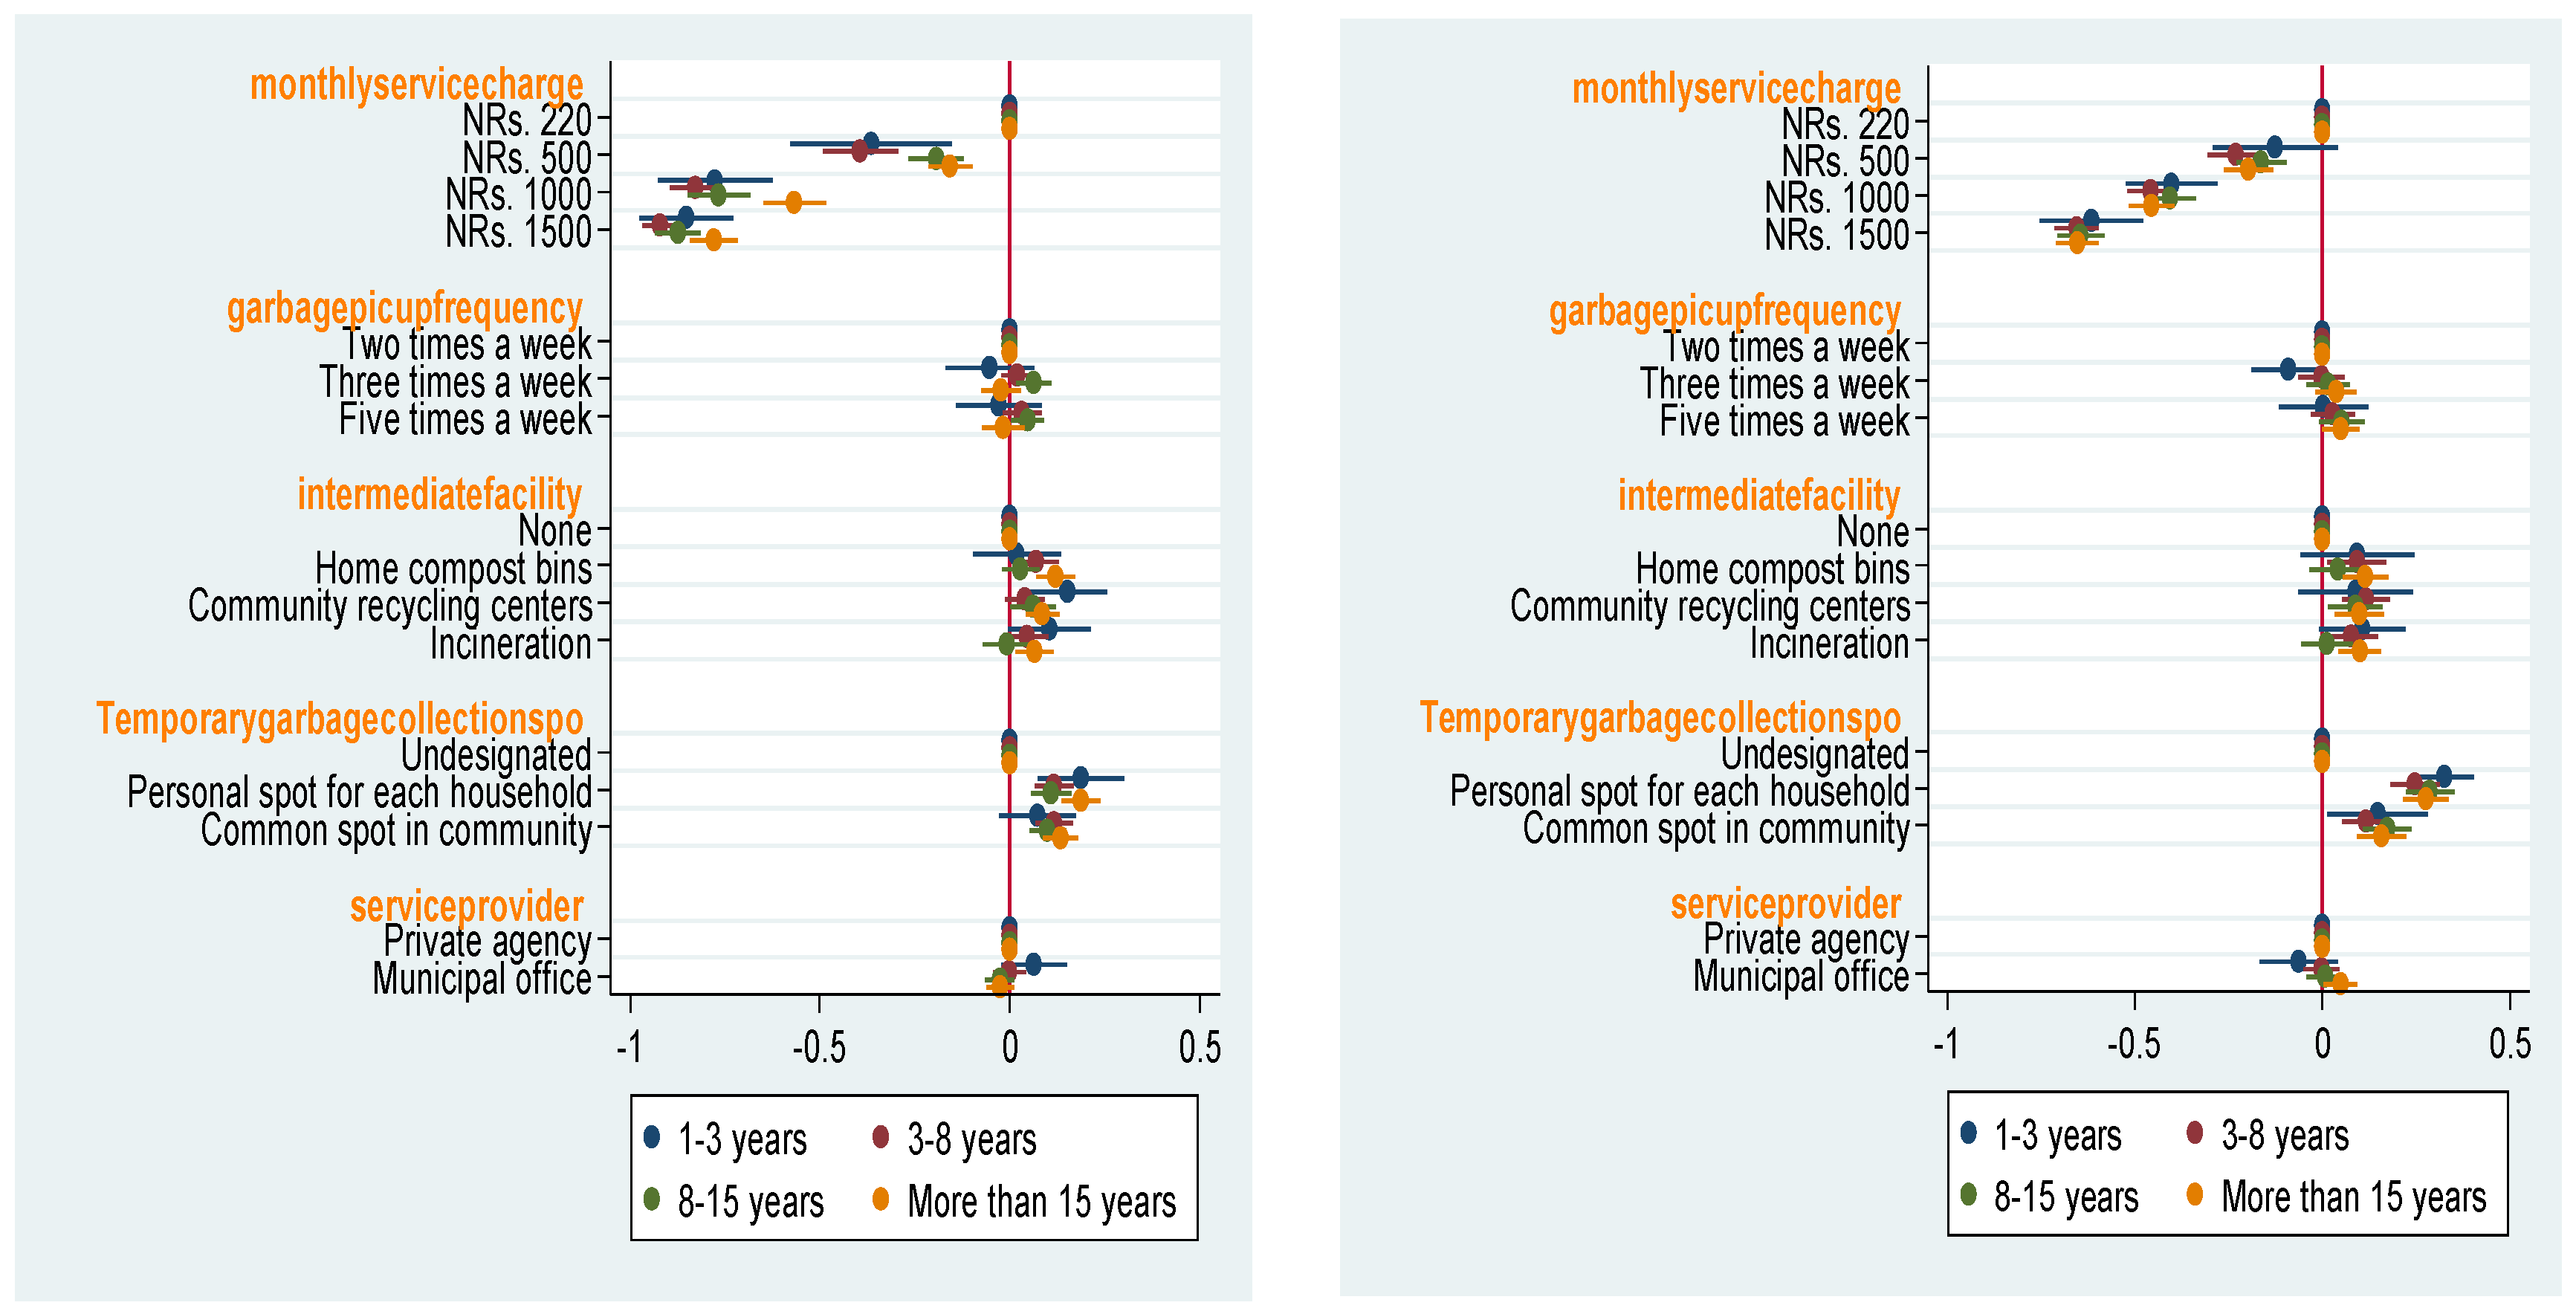
In terms of respondents’ length of stay in Kathmandu, we found that all length of stay respondents tend to prefer designated collection spots such as personal spots and common spots (
Figure 8) as same as
Figure 3. This means almost all respondents want to change the current situation for SWM in Kathmandu despite their staying duration there. It is obvious that people are eagerly looking for collection spots to solve their garbage problem while they sensitively react to costs for the services as other all figures show similar results.
5. Discussion
As mentioned above, many respondents tend to prefer three factors such as monthly service charge, intermediate facility, and temporary garbage collection while they also remain mainly choosing the current situation of SWM. Simultaneously, households do not care much about service providers whether it is the municipal office itself or private agency, and garbage pickup frequency is also not a great concern of households in Kathmandu. Many respondents are seeking a personal spot for each household as a temporary garbage collection spot. From subsample analysis, we find that single, low income, uneducated, and short length of stay people do not care much about intermediate facilities in comparison to married, moderate as well as high income, educated, and higher length of stay people, respectively.
As far as we found, three attributes such as monthly service charge, intermediate facility, and temporary garbage collection spots are keys to improving the current SWM system in Kathmandu. So, we can say that while formulating a new policy, it is better to focus on the fair monthly service charge, provision of intermediate facilities, and temporary garbage collection spot packages to motivate households to the new system.
Compared to the prior similar study such as [
16] and [
15], households in Kathmandu prefer setting collection spots more than the frequency of collection, which is different from the reaction of households in Jakarta and Surabaya, Indonesia. This result would mean the number of collection spots for garbage in Kathmandu is entirely more insufficient than in Jakarta. On the other hand, establishing garbage facilities such as incineration, composting, and recycling facilities has similar significance among cities. The negative response to the service charge is basically common in each city (maybe in other cities). The sensitive response to pecuniary information is similarly shown in [
15]. This would indicate that some kinds of financial support should be necessary to improve SWM anywhere.
As we mentioned in the Introduction, although the improvement for SWM has been recognized to be necessary in general, the prioritization of components for the improvement is not necessarily clear. According to our result and prior study, support for the garbage service charge, equipping any type of intermediate facilities such as composting and incineration, and setting collection spots might be more important than frequency of collection and the type of business agents.
Attributes that we accepted in this study were reasonable and useful to compare to previous relevant studies since they used similar ones as well. As the first trial, attributes such as service charge, intermediate facilities, and garbage collection spots should be appropriate for the study to consider factors that attract households to improve the current situation of SMW. In terms of the heterogeneous groups, our results show some different characteristics by education, income level, and the length of their living (although the tendency as a whole remains the same). Those say educated people seem to have relatively high consciousness about the environment, higher-income households tend to choose personal measures such as personal collection spots and home compost bins, and people who stay longer in Kathmandu are likely to prefer designated collection spots. To clarify these differences among groups attributes that this study accepted seem to be suitable. On the other hand, as [
19] mentioned, Brussels’ consumers showed different preferences for incineration and reusing electrical and electric equipment. This difference might come from an environmental background and economic development stage between Europe and Asia, as well as characteristics of electrical and electric equipment. As mentioned above, in developing countries such as Indonesia and Nepal, there seems to have a tendency that intermediate processing for SWM such as composting and recycling are commonly demanded, which might indicate that the lack of garbage collection has become more serious. It could mean that throwing garbage itself has damaged residential areas directly in developing countries more than developed countries such as the Netherlands, where people worry about environmental destruction by garbage processing. This point should be seriously considered further in the future.
However, these results come from only a few pieces of research (including Kathmandu City with randomized conjoint experiments), so the further accumulation of similar research based on households’ choice should be necessary to find more universal results for the improvement of SWM.
6. Conclusions
This paper is a case study focused on the urban hub of Kathmandu, where SWM services can play a crucial role in households to ensure sanitation and an improved standard of living. We focused on examining households’ preference for improved SWM services in KMC Ward No. 10. A choice-based conjoint experiment is applied that includes 5 attributes and 16 levels which may affect any household’s preference for switching to improved SWM services. Although most people in the ward still tend to prefer the current SWM services according to our result, simultaneously it shows temporary garbage collection spots and intermediate garbage processing facilities are marginally attractive attributes for their preference. While households are looking for improved SWM service, they are strongly against an increase in the current monthly service charge. However, they do not care much about service providers whether they are private agencies or municipal offices. Garbage pickup frequency is also not a great concern of households in Kathmandu. From the subsample analysis, we found that single, low income, uneducated, and short length of stay people do not care much about intermediate facilities in comparison to married, moderate and high income, educated, and higher length of stay people.
Our results indicate that respondents are not happy with current services for some attributes such as intermediate facility and temporary garbage collection spot, which will support SWM-related policy-makers in formulating and implementing an effective SWM policy that takes household preferences into proper consideration. As a policy implication, we can say some points: (1) most people in Kathmandu would like to improve the current situation of SWM; (2) they want to introduce not only home compost bins but also community recycling center as a facility for SWM, but they don’t care about frequency of garbage picking; and (3) they don’t want to pay much money for SWM, which might mean public expenditure should improve the current waste management in Kathmandu.
This study shows only an example study about the improvement of SWM focusing on Kathmandu as a typical dense urban area to measure how much stakeholders such as households wish to change the current SWM. Our method based on randomized conjoint experiments can be applied to other areas. Further studies should accumulate many experiences in various areas to consider more appropriate ways to efficiently improve the SWM, based on residents’ wishes. In that case, attributes and levels in the experiments can be changed flexibly for each study, which is one advantage of this method.


