Article

Research and Application of Supersaturated Dissolved Oxygen Technology Combined with Magnetization Technology in the Improvement of Water Quality: Taking the South-to-North Water Diversion Project of China as a Pilot Project

1
International Joint Laboratory of Watershed Ecological Security and Collaborative Innovation Center of Water Security for Water Source Region of Middle Route Project of South-North Water Diversion in Henan Province, College of Water Resource and Environment Engineering, Nanyang Normal University, Nanyang 473061, China
2
Nanyang Branch Bureau of Construction and Administration Bureau of South-to-North Water Division Project, Nanyang 473000, China
3
College of Henan River, North China University of Water Resources Electric Power, Zhengzhou 450045, China
4
River and Lake Protection Center, Ministry of Water Resources of the People’s Republic of China, Beijing 100053, China
5
Beijing Huanerkang Technology Development Co., Ltd., Beijing 100053, China
6
Department of Hydrobiology, Faculty of Biology, Adam Mickiewicz University in Poznan, Uniwersytetu Poznanskiego 6, 61-614 Poznań, Poland
*
Authors to whom correspondence should be addressed.
Sustainability 2022, 14(5), 2684; https://doi.org/10.3390/su14052684
Submission received: 14 January 2022 / Revised: 29 January 2022 / Accepted: 23 February 2022 / Published: 25 February 2022

Abstract

:
Supersaturated dissolved oxygen and magnetization (SDOXM) technology is a composite technology that combines supersaturated dissolved oxygen with water magnetization technologies. Compared with conventional water purification technology, the advantages introduced by such technology include obvious and efficient improvement in purified water quality without adding any chemicals, removing sludge and changing the original function of the river. In this study, taking the Middle-Route (MR) of the South-to-North Water Diversion Project of China (SNWDPC) as a pilot project, the effects of the SDOXM composite process on microbial activity, phytoplankton community structure, and removal efficiency of the main nutritional indexes in the canal of the MR were evaluated. Aiming at static and flowing water bodies, this study was divided into two parts: static and dynamic experiments (two groups: a group with artificial aquatic plants and another group without artificial aquatic plants). The performance of the SDOXM system was assessed by monitoring the organic matter removal as well as the relative light unit (RLU) of ATP, changes in the community structure of phytoplankton, and the effects of artificial aquatic plants as a biofilm carrier on organic matter removal and microbial activity. During the study period, SDOXM technology was able to increase the concentration of dissolved oxygen (DO) in water and maintained the state of supersaturation for more than three days. The removal effect of organic matter from water was obvious. The community structure of phytoplankton changed from the Bacillariophyta-Cyanophyta type to the Bacillariophyta-Cyanobacteria type. Finally, the introduction of artificial aquatic plants has contributed to the improvement in water quality. Therefore, SDOXM technology can be used as a new water quality improvement technology to enhance the self-restoration ability of a river natural ecology.

1. Introduction

The MR of the SNWDPC is an important infrastructure for alleviating water shortages and realizing rational allocation of water resources in northern China [1]. According to a survey of water quality in the canal of MR in recent years, total nitrogen (TN) is on the high side, chemical oxygen demand (CODMn) shows an obvious upward trend along the canal every year, and total phosphorus (TP) is on the lower side, but show an increasing trend year by year [2,3,4]. The canal has high safety requirements. Any technology with potential risks will be prohibited, and no additional engineering measures that may interfere with the safety and water-carrying capacity of the structures will be imposed in the canal. Traditional river water purification technologies such as aquatic plant absorption, biological manipulation, biological agents, chemical agents, membrane bioreactor (MBR), oxygen aeration, etc. [5,6], cannot meet the requirements of water quality improvement under the special conditions of the MR project. Therefore, there is an urgent need to develop new technologies to meet the needs of water quality improvement in the MR.
In recent years, magnetic fields (MFs) have been widely used as a high-efficiency, low-cost, and easy-to-operate technology to improve the performance of wastewater treatment (WWT) [7,8,9]. Wang et al. reviewed the photo-magnetic coupling technology and the application of MF in domestic wastewater treatment. Moreover, the mechanism by which MF improves WWT performance has been elaborated from the perspective of magnetic physics, chemistry, and biology [10]. The combination of an alternating frequency magnetic field and coagulation process can improve the removal efficiency of COD, chroma, and turbidity of printing and dyeing wastewater [11]. The biological effect of magnetized WWT showed that the activity of microorganisms and their ability to biodegrade organic matter were enhanced, and the primary productivity of algae could be improved [12]. Research on the effect of MF on the activity of activated sludge in wastewater treatment has found that it promotes the growth of microorganisms and affects their degradation ability [13,14,15]. Supersaturated dissolved oxygen (SDOX) has an obvious removal effect on NH4-N and COD in water by promoting the absorption and transformation of nutrients by microorganisms [16]. Pan et al. designed an automatic supersaturated oxygen generator that obtained a dissolved oxygen concentration of approximately 12 mg/L and described the application field of supersaturated dissolved oxygen [17]. As an alternative technology for DO supply in biological wastewater treatment (WWT), the SDOX system can improve the treatment capacity of WWT for high mixed liquid suspended solid concentrations without affecting the biological performance of MBRs [18]. Dissolved oxygen is the process of melting solute oxygen molecules into the intermolecular space of solvent water. The size of the water molecular gap not only refers to the physical space of water but is also affected by the valence bond force of the solute on water molecules [16]. Magnetization treatment can destroy the original structure of water and change a larger group of associated water molecules into smaller or even single water molecules [7,19].
In this study, fine molecular supersaturated dissolved oxygen technology was combined with water magnetization technology. Oxygen and water were fully integrated under the action of turbulence, friction, and cutting to form nanoscale oxygen microbubbles [20]. However, the transfer coefficients and transfer rates of oxygen in water are improved under the action of magnetization, and the high concentration of dissolved oxygen in water is finally transformed into reactive oxygen. Compared with conventional water purification technology [5,6], the SDOXM composite process has the advantages of no pollution without adding any chemicals and simple construction, and thus can meet the requirements of safe water transportation in the MR project. The objectives of this study were to answer the following questions: how does the SDOXM composite process improve water quality? The answers to this question could help evaluate the effect of the SDOXM composite process on water quality by monitoring the removal of nutritional indices, microbial activity, and overall variations in the phytoplankton community.

2. Materials and Methods

2.1. Study Site

The site of the experiment was located at the sluice hub of the inverted siphon of the Baihe River, approximately 16 km northeast of Nanyang City, Henan Province (Figure 1). This junction was used to replenish and discharge water from the MR canal to the Baihe River. The sluice hub site was used to conduct water quality improvement experiments during the period when the MR canal stopped discharging.

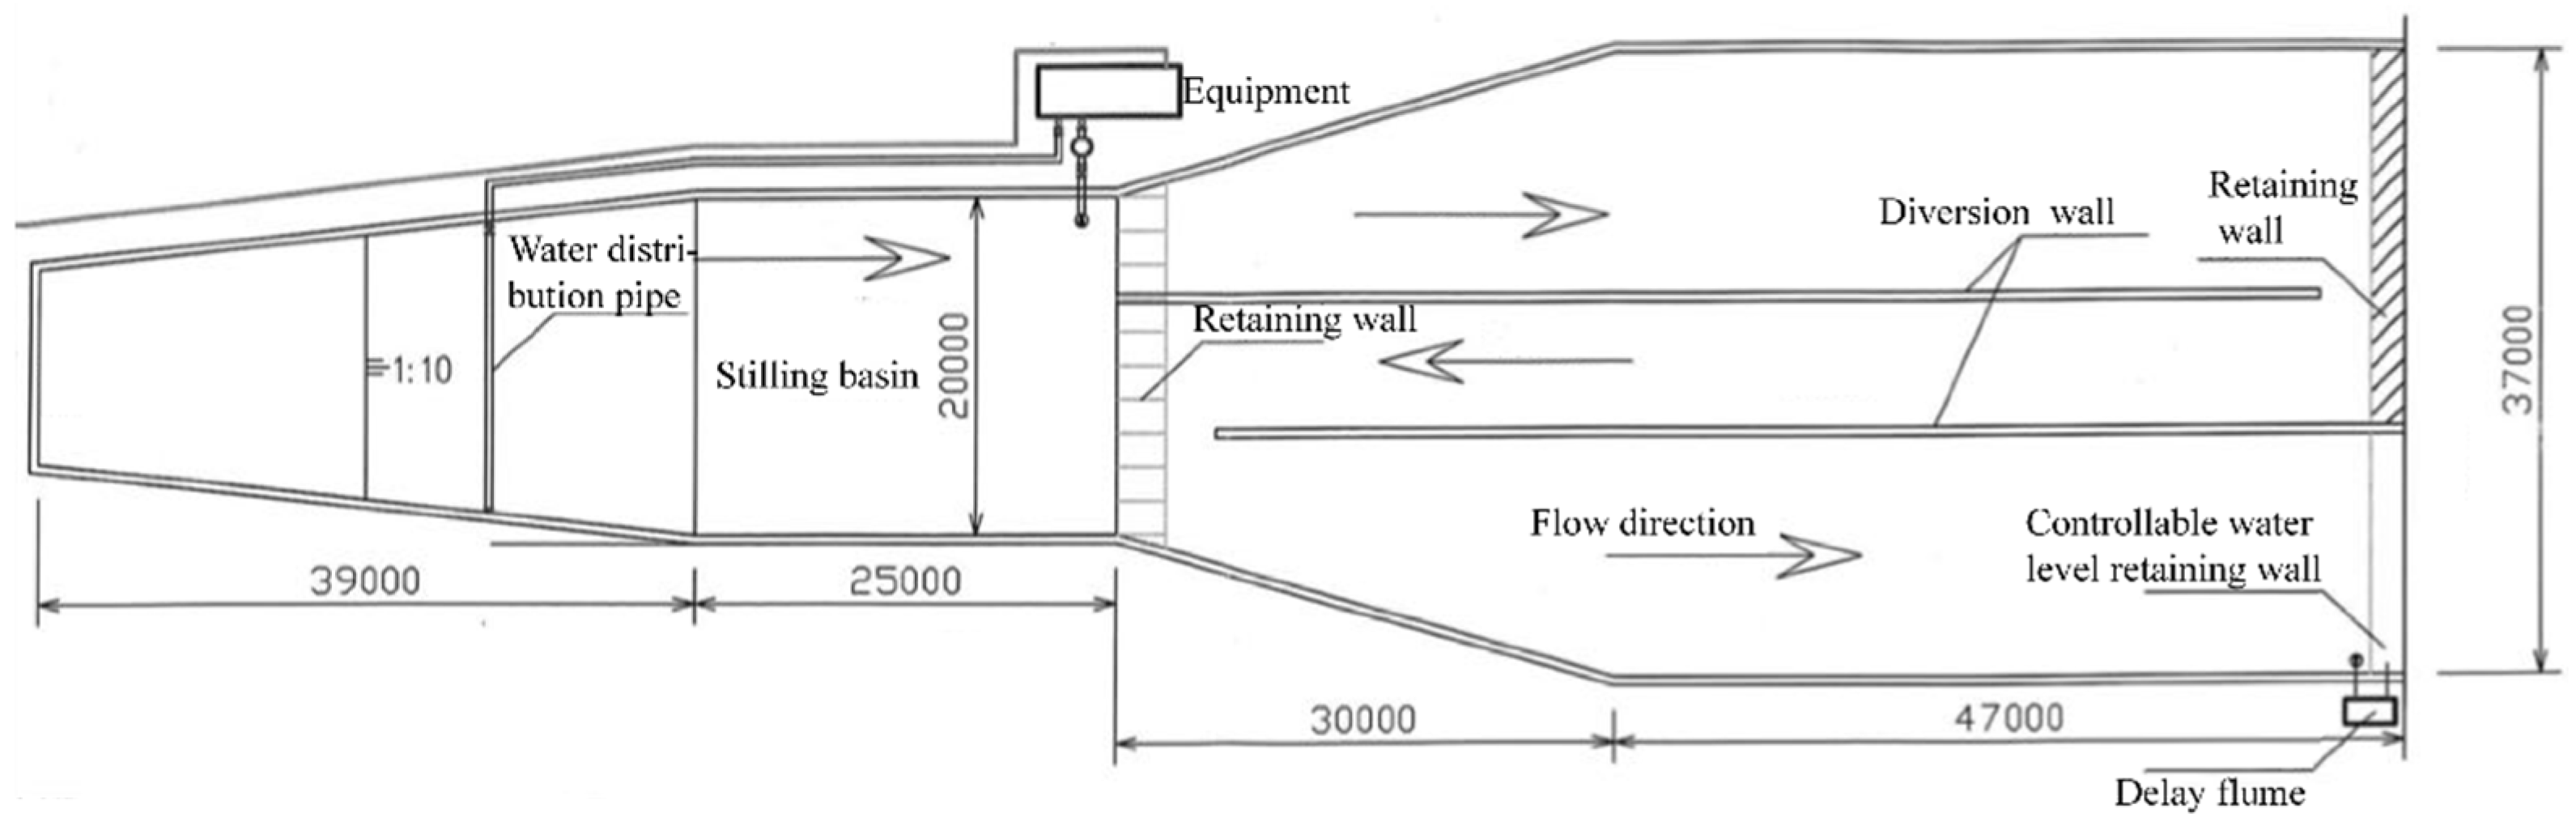
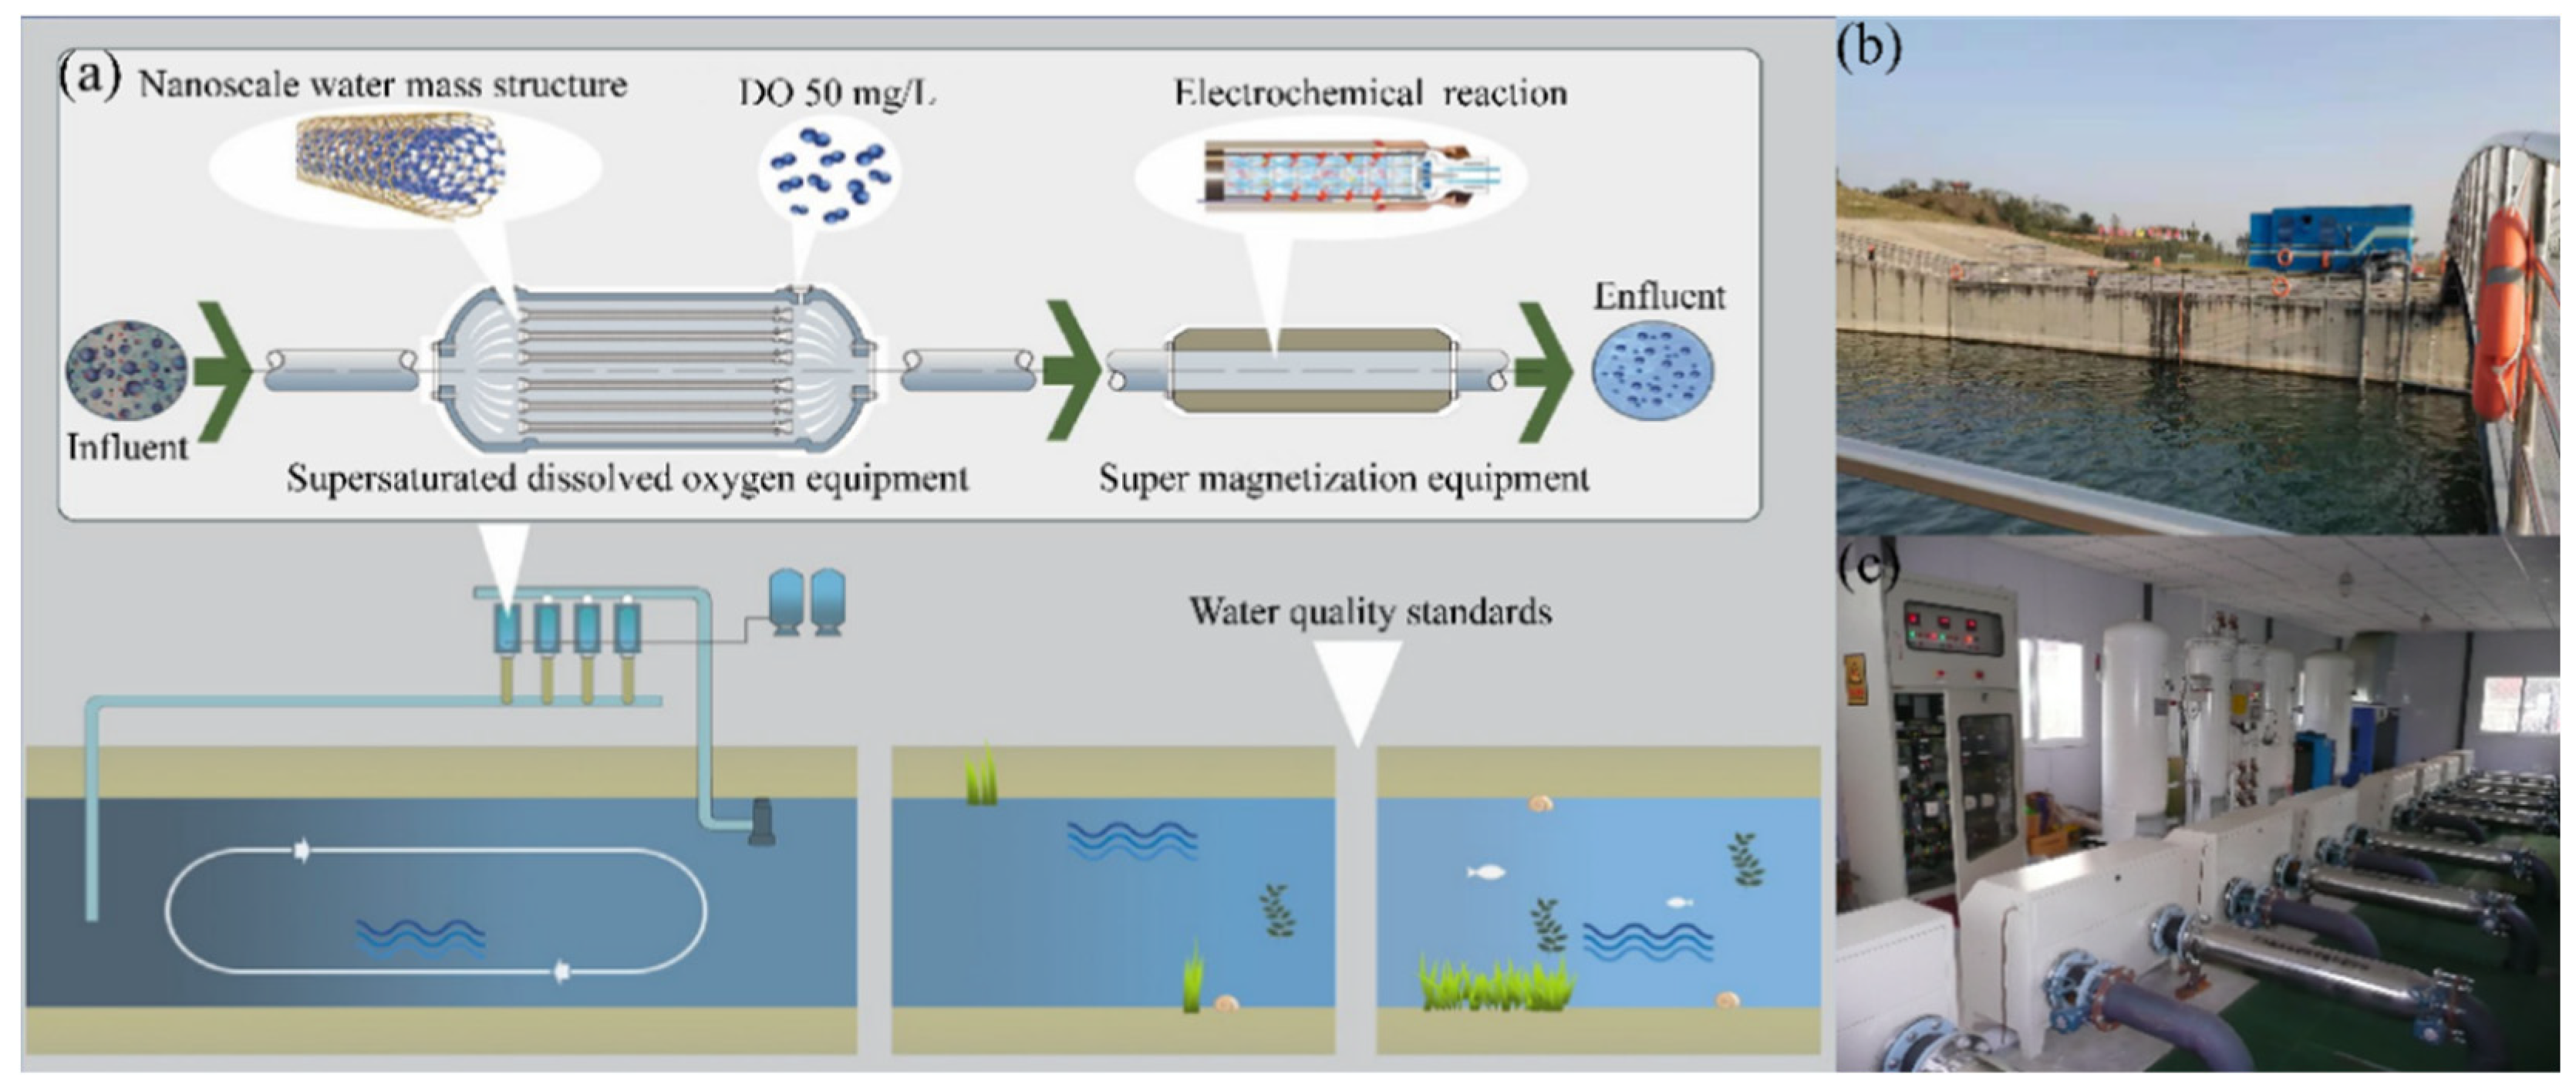
2.2. Reconstruction Layout of Experimental Site

To ensure that the space of the sluice hub met the experimental conditions, the structures of the stilling basin and downstream connection (DSC) section were reformed (Figure 2). According to the handling capacity of the SDOXM equipment, the height of the existing retaining wall was raised by 0.5 m to maintain the water storage capacity of the stilling basin at 3400 m3. Three series of anti-seepage diversion channels were built in the DSC section to extend the water flow path, so that the water from the stilling basin was discharged to the Baihe River through the diversion channel with a total length of 216 m and an average section of 5.8 m. In order to control the diversion flow from the MR canal, four PVC siphons were installed at the sluice, whose flow was controlled by the opening of the cut-off valve installed below.
A flume (called the delay flume in this study) was set at the outlet of the DSC section to ensure that the effluent in this section remained in the delay flume for 48 h to investigate the continuous water purification effect after flowing out of this area. The delay flume is a box structure with four guide tanks in series, made of PVC, with a cumulative length of 6 m and a section of 1.4 m (height) × 0.75 m (width). Most of the reconstructed projects are concrete structures, which have problems of low biomass and weak microbial activity in the water with fast velocity and low nutrition level. Therefore, artificial aquatic plants were selected as microbial carriers and laid at the bottom of the diversion channel in the DSC section to compare the effects of artificial aquatic plants on water quality improvement. The area of artificial aquatic plants was 1 m2, with a thickness of 4 cm and material made of food safety grade nylon, and the proportion of the laying area was 25%.
The water treatment capacity of the SDOXM equipment used in this experiment was 400 m3/h, which was arranged on the left bank of the stilling basin. The internal structure and principles are shown in Figure 3a and Figure 3c, respectively. The equipment water inlet was on the side of the stilling basin close to the water retaining wall (Figure 3b), and the drilled water distribution pipe was arranged upstream of the stilling basin, 70 m away from the equipment water inlet (Figure 2).

2.3. Design of the Experiment

Aimed at static and flowing water, this study was divided into two parts: static and dynamic. The static experiment mainly explores the effect of SDOXM technology on the improvement in the water quality of static water bodies such as urban landscape water bodies, lakes, and reservoirs, and provides a reference for the practical application of composite technology. The dynamic experiment mainly explores the improvement effect of the SDOXM technology process on the water quality of flowing water bodies such as the MR canal of South-to-North Water Transfer, urban rivers, and natural watersheds.

2.3.1. Static Experiment

The water in the MR canal was introduced into the stilling basin through the siphons so that the water storage volume in the stilling basin was 3400 m3, the cut-off valve of the siphon was closed, and the water was treated with SDOXM equipment (Figure 4a). In this experiment, the water was treated once, twice, and thrice (the running time of the equipment was 8.5, 17, and 25 h, respectively). After the equipment was shut down, the changes in water quality in each group were observed after standing for 24, 48, and 72 h. Before each set of tests, the water of the previous set in the stilling basin was emptied, and new water was diverted from the main channel to the stilling basin again.

2.3.2. Dynamic Experiment

Figure 4b presents the experimental model of the dynamic experiment. The water body was continuously diverted from the MR canal through the siphon, and then the water extracted from the outlet of the stilling basin was mixed with the water of the canal at the outlet of the siphon through the water distribution pipe after being treated with SDOXM equipment. Mixed water was discharged into the Baihe River through the diversion channel in the DSC section. The flow rate of the pump was controlled to extract part of the water from the outlet of the DSC section to allow it to flow out after remaining in the delay flume. The flow velocities of the dynamic experiment, which were divided into two groups, one with and the other without artificial aquatic plants, were set as 0.025, 0.045, and 0.104 m/s, respectively (the ratios of treatment capacity to water diversion were 1:1, 1:2, and 1:5, respectively). Under different flow velocities, the water quality improvement effects of each group were investigated after treatment with SDOXM equipment and mixing with the main canal water for 12, 24, and 48 h, respectively.

2.4. Sampling and Analysis

In the static experiment, water and phytoplankton samples were collected five times for each group before starting, after shutdown, and after shutdown of the SDOXM equipment for 24, 48, and 72 h, respectively. In the dynamic experiment, water and phytoplankton samples in the MR canal were collected before each group of the SDOXM equipment was started. Water and phytoplankton samples of the canal, outlet of the DSC section, and outlet of the delay flume were collected simultaneously at 12, 24, and 48 h after each group of SDOXM equipment was started.
For the quantitative analysis of phytoplankton, water samples were taken with a water sampler at a depth of 0.5 m below the surface and transferred to 2 L polyethylene bottles. The phytoplankton samples were preserved by adding 15 mL of Lugol’s iodine solution to brown glass bottles of 1000 mL. The subsamples were allowed to settle for 48 h to achieve complete precipitation, followed by algal cell counting using an inverted microscope (CKX-41; Olympus). Phytoplankton species have been identified based on morphology [21,22,23].
Surface water samples were also taken simultaneously with phytoplankton sampling, transferred to 2 L polyethylene bottles, and transported to the laboratory immediately for hydrochemical analyses. Physicochemical parameters such as water temperature (WT), electrical conductivity (Cond), oxidation-reduction potential (ORP), dissolved oxygen (DO), and pH were measured in situ using a portable multi-parameter device (YSI Professional Plus, USA). Velocity flow (Vel) of the canal was provided by the management office. The RLUs of ATP were directly measured at the sampling sites using a portable ATP fluorescence detector (HM-ATP, China).
The concentrations of total phosphorus (TP), total nitrogen (TN), ammonia nitrogen (NH4-N), and nitrate nitrogen (NO3-N) were analyzed by spectrophotometry. The chemical oxygen demand (CODMn) was determined using the permanganate index. Chlorophyll a (Chl. a) was measured by spectrophotometry after acetone extraction. All parameters were analyzed on the day of sampling using the standard methods described in MEPPRC [24].

Statistical Analysis

The formula for calculating the dominance index was as follows:
Y = ( n i / N )   f i
where N is the total number of individuals of all species; ni is the number of individuals of species I; Y is the dominance index; fi is the frequency of species I; and the species with Y > 0.02 is defined as the dominant species [25].
Detrended correspondence analysis (DCA) of phytoplankton abundance data was used to determine whether linear or unimodal ordination methods should be applied. Redundancy analysis (RDA) was performed to analyze the relationship between environmental factors and phytoplankton community based on the DCA results. The significance of the canonical axes and environmental variables in explaining the variance of the community was tested using Monte Carlo simulations. All environmental variables except pH were Log10 (x + 1) transformed [26]. All data were processed using Microsoft Excel. Pearson correlations between phytoplankton abundance and environmental factors were conducted by RStudio3.6.3 software. The t-test was used to check the significance of the parameters between the two factors. The levels of significance used were 0.05 (“significant”) and 0.01 (“highly significant”). Statistical analysis was performed using SPSS version 23.0. DCA and RDA was completed based on “vegan” package of RStudio3.6.3 software [27,28].

3. Results and Analysis

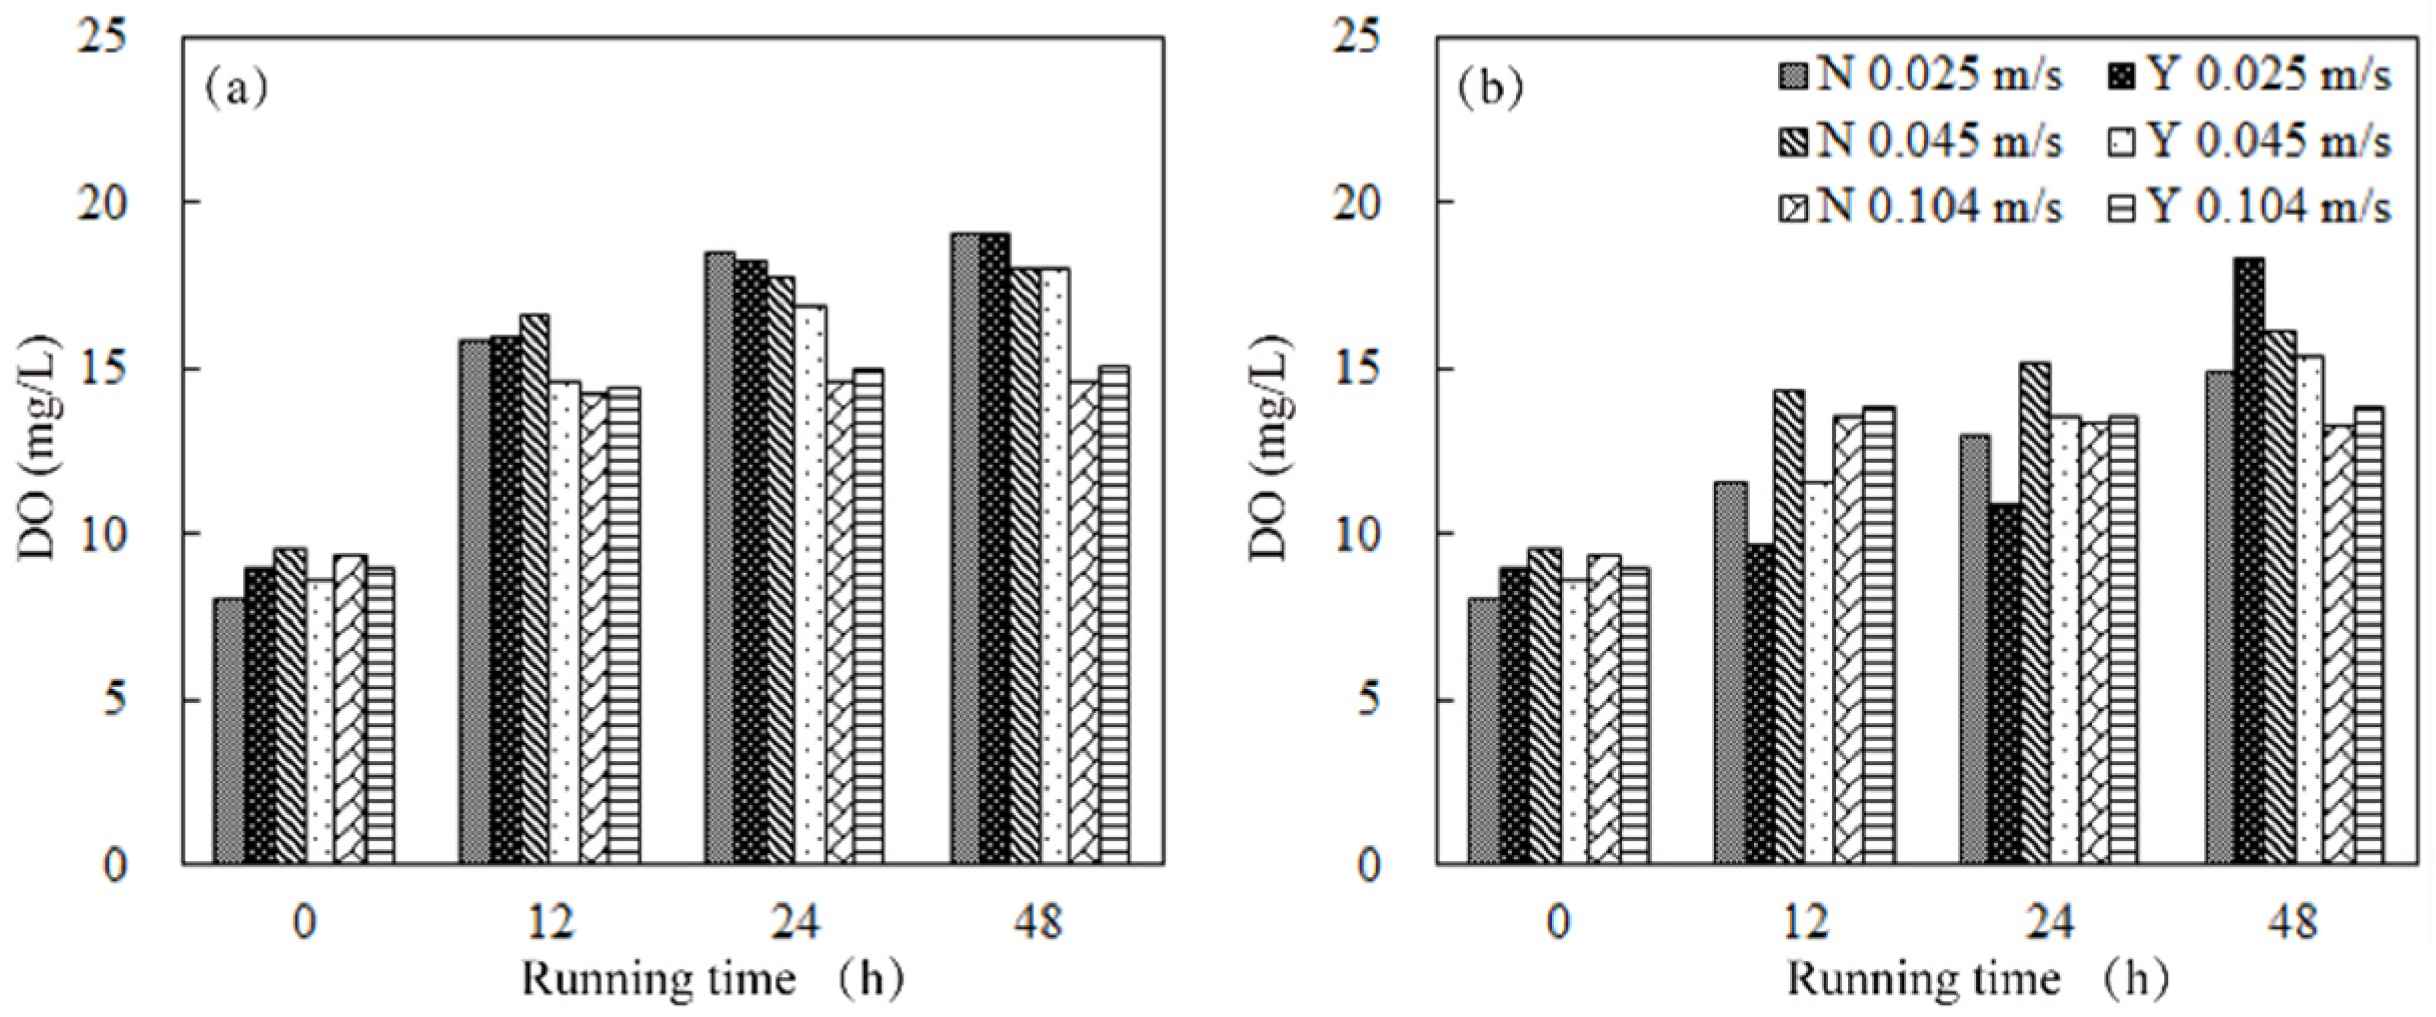
3.1. Temporal Variations of DO Concentration and Organic Matter Removal in Static Experiment

During the static experiment, the DO concentration in the canal varied from 8.59 to 9.43 mg/L. After being treated once, twice, and three times by the SDOXM equipment, the DO concentrations were 23.09, 29.28, and 38.70 mg/L, respectively. In addition, the t-test indicated highly significant differences (p < 0.01) in the DO concentrations before and after treatment. Figure 5 describes the changes in the DO concentrations and removal rates of organic matter as a function of standing time. When the SDOXM equipment was stopped, the DO concentration decreased as the standing time progressed. After standing for 72 h, the DO concentrations of 15.62 ± 0.41, 18.04 ± 0.03, and 22.42 ± 0.03 mg/L were obtained for one, two, and three processing times. It can be concluded that DO concentrations in the water can remain in a supersaturated state for more than three days after treatment by the SDOXM equipment. Figure 5a shows the changes in the removal rate of NH4-N in the stilling basin after the shutdown of the device. The removal rate of NH4-N (processed once) was negative (standing time of 24 h). This phenomenon was possibly caused by the agitation of the sediment at the initial stage of the experiment. However, after three different treatments, SDOXM exhibited excellent overall NH4-N removal efficiencies of 48.11, 44.58, and 32.35%, respectively. Figure 5b,c shows the removal rates of NO3-N and TN, respectively, during the evaluated period. As the standing time increased, the removal rates of NO3-N continued to increase, with final removal rates of 13.66, 19.38, and 30.40%. A similar variation trend in the removal rate of TN was observed at final removal rates of 11.48, 18.30, and 28.65%, respectively. During the static experimental study, the TP concentrations in the canal were very low and varied from 0.019 to 0.027 mg/L, which resulted in a limited removal effect. The final TP removal rates were 27.96%, −4.11% and 9.66%, respectively (Figure 5d). In addition, the t-test indicated no significant differences (p > 0.05) in the TP concentrations between the once processed and the influent of MR. Similar observations were observed between the twice processed and the influent of MR. In addition, CODMn removal was monitored (Figure 5e). The range in variation of CODMn in the canal was 2.31~2.75 mg/L. The removal rate of CODMn fluctuated significantly during the initial stage of standing and stabilized with standing time. The final removal rates were 4.19, 14.29, and 20%, respectively.

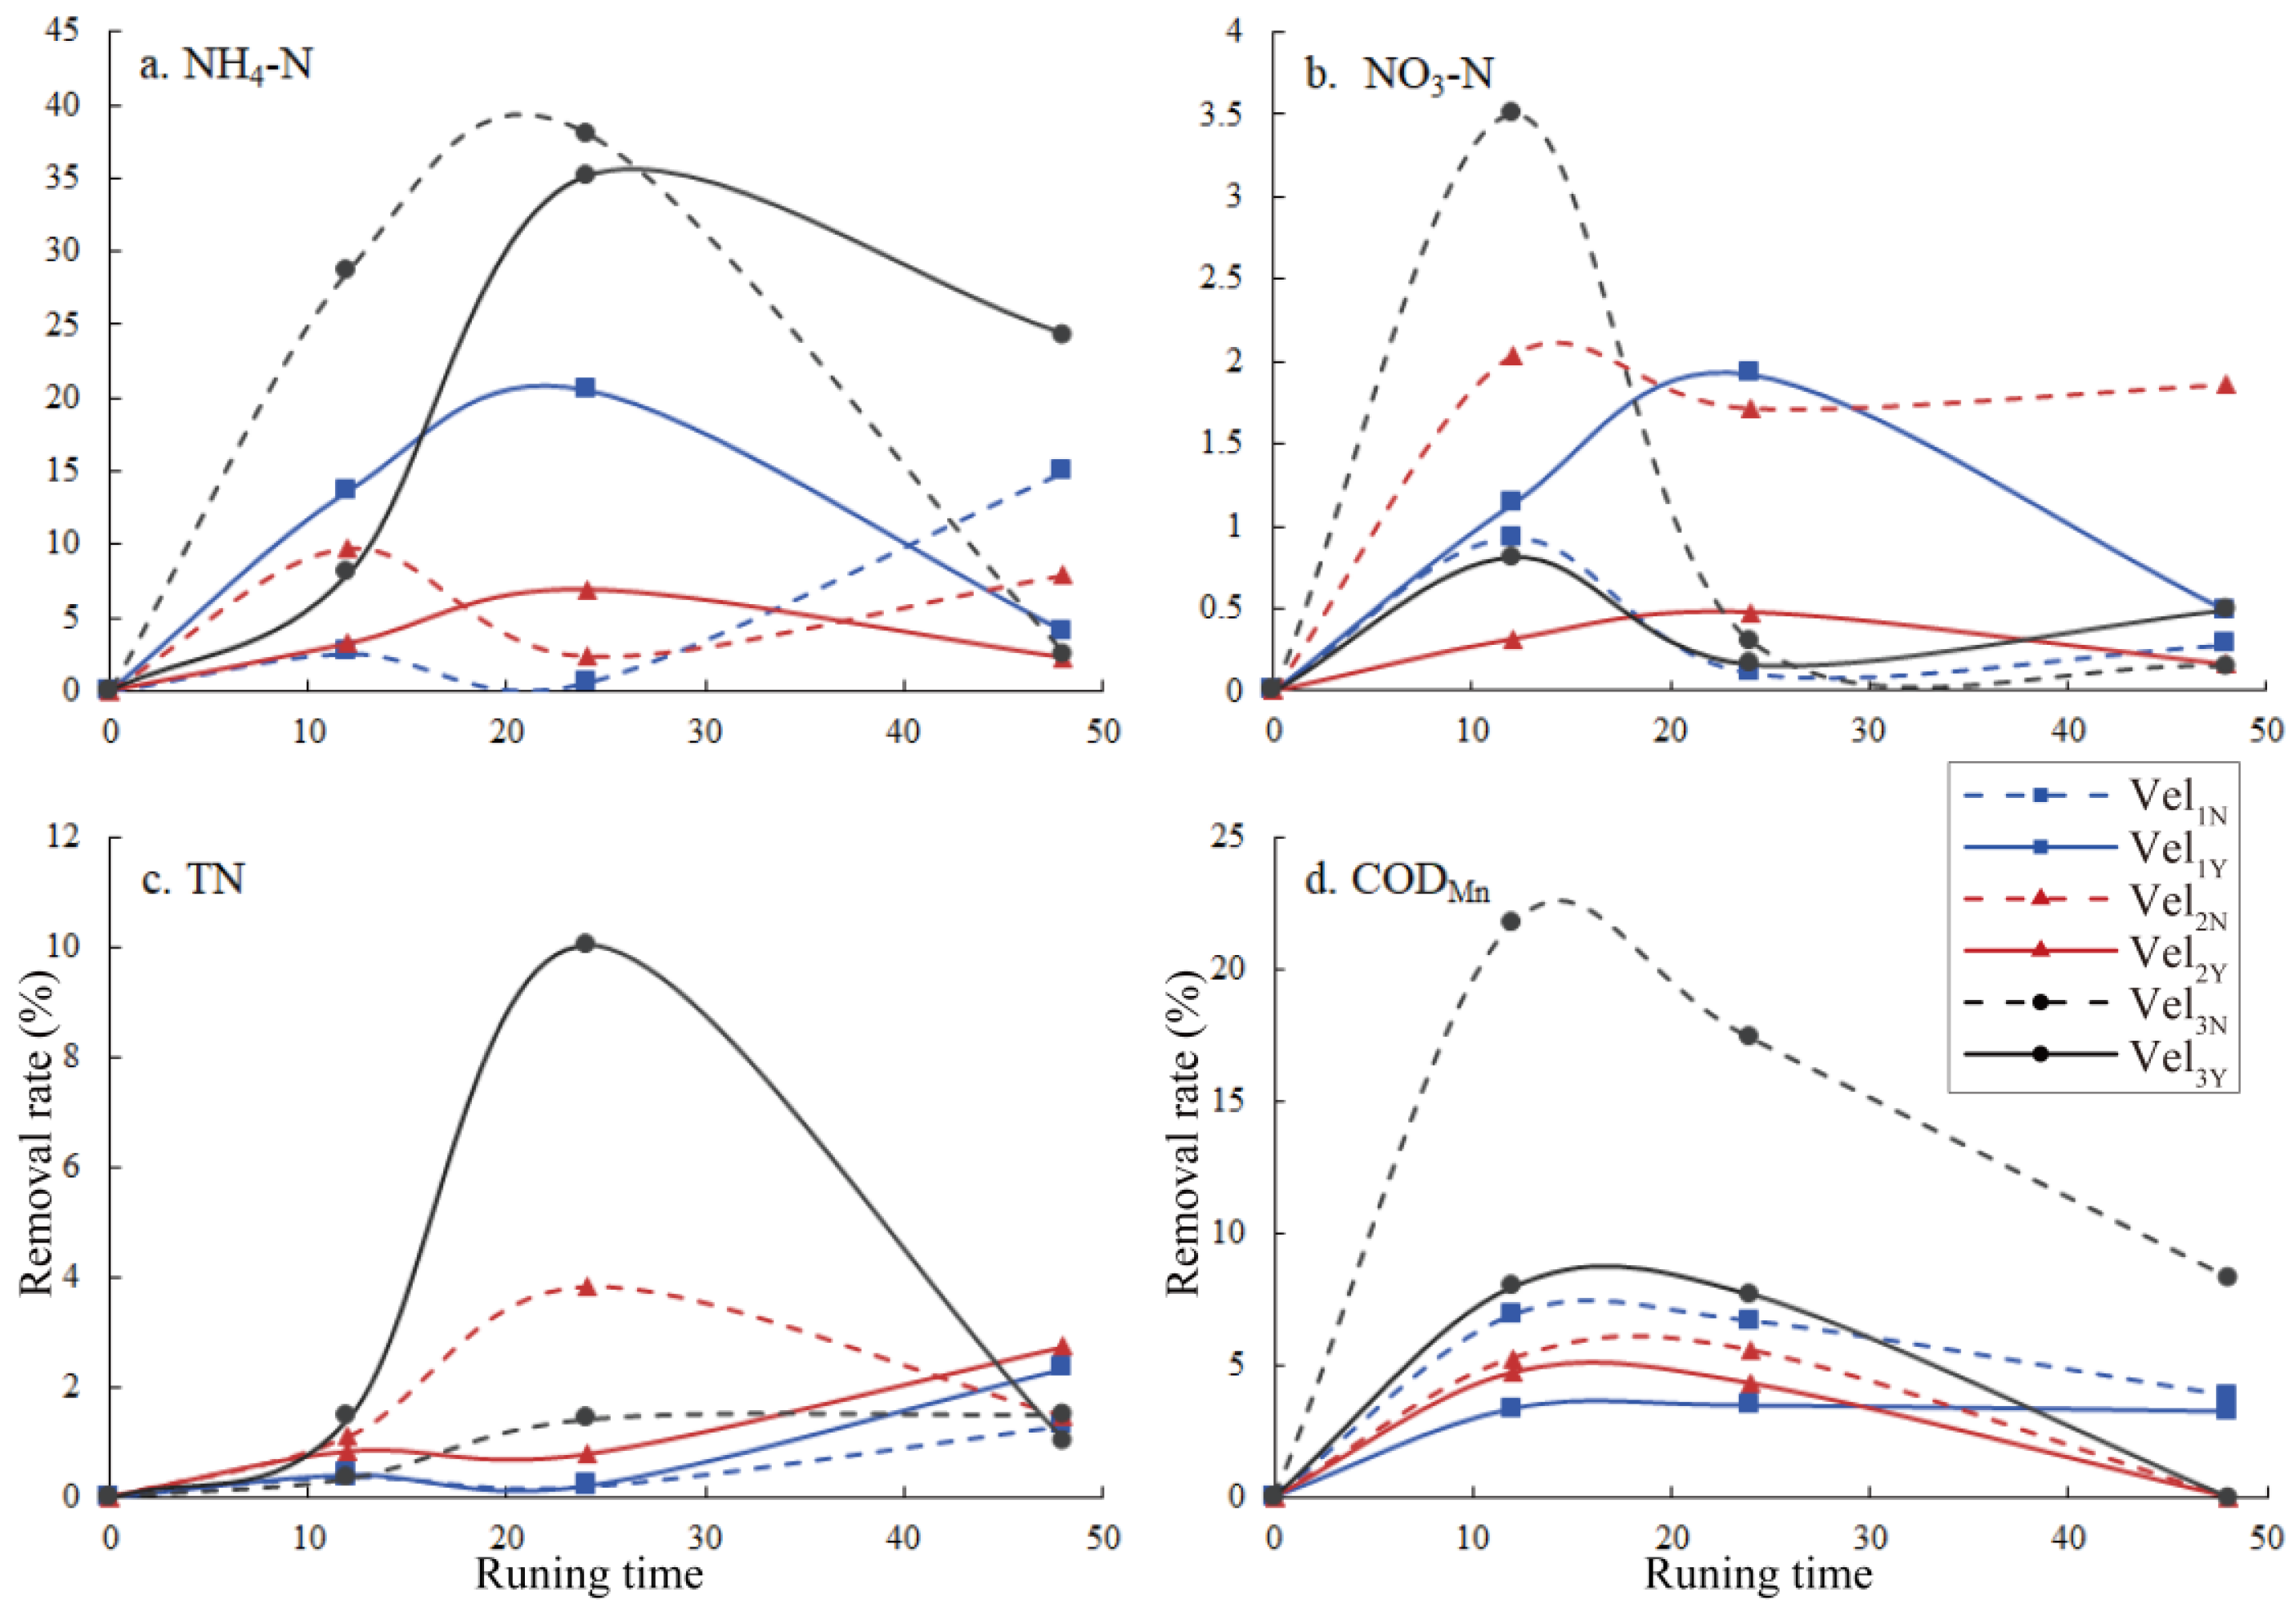
3.2. Temporal Variations of DO Concentration and Organic Matter Removal in Dynamic Experiment

During the study period of the dynamic experiment, the range in DO concentrations in the canal was 8.08~9.54 mg/L. With an increase in the running time of the equipment, after the water body was treated by the equipment and mixed with the influent from the canal, the DO concentrations at the outlet of the DSC section increased gradually, as indicated in Figure 6a. After 48 h of operational time, the maximum DO concentrations in the outlet of the DSC were 19.12 (Vel 0.025 m/s), 18.05 (Vel 0.045 m/s), and 15.04 mg/L (Vel 0.104 m/s), respectively. With an increase in flow velocity, the DO concentrations at the outlet of the DSC decreased under the same treatment time, which was due to the decrease in the equipment treatment ratio caused by the increase in flow velocity. In addition, the independent sample t-test indicated no significant differences (p > 0.05) in DO concentrations with and without artificial aquatic plants.
The DO concentrations in the effluent of the delay flume were lower than those in the DSC section, but were significantly higher than those in the water body of the canal (Figure 6b). This result indicated that the DO concentrations were still able to maintain supersaturation for a long time after flowing out of the DSC section. However, there was a huge gap between the velocity of the water body in the delay flume and that in the natural watershed and/or MR. Thus, further research is needed to confirm the time for DO concentrations to remain supersaturated in natural water in specific applications in the future.
The variation rule of the NH4-N and NO3-N removal rates with treatment time is shown in Figure 7a,b, respectively. During the initial period of equipment operation (0~12 h), a rapid increase was observed, after which, it stabilized and even slightly increased. The removal rate of TN fluctuated greatly with the increase in treatment time and tended to stabilize after 24 h of operation (Figure 7c). Moreover, the removal rates of NH4-N, NO3-N, and TN were similar as a function of operation time. First, the removal rate decreased with an increase in flow velocity, which was caused by the decrease in the treatment ratio of the water body by the equipment. Second, the removal rate of the group with artificial aquatic plants was higher than that of the group without artificial aquatic plants. Thus, under the condition of 0.025 m/h flow velocity with artificial aquatic plants, the removal rates of NH4-N, NO3-N, and TN were the highest at 57.2%, 11.5%, and 15.2%, respectively. As indicated in Figure 7d, the CODMn removal rate increased with increasing flow velocity, which demonstrated that the flow velocity had a significant influence on the CODMn removal rate. In addition, it could be seen that laying artificial aquatic plants in the DSC section contributed to the improvement in the CODMn removal rate, which was similar to that observed in the removal rate of NH4-N, NO3-N, and TN.
The variations in the removal rates of NH4-N, NO3-N, TN, and CODMn in the delay flume are presented in Figure 8. After entering the delay flume, the removal rates of NH4-N and NO3-N fluctuated greatly (Figure 8a,b), continued to increase within 12 h, and then gradually decreased with the increase in outflow time. The TN concentration in the delay flume was the same as that of the effluent from the DSC, and there was no obvious further removal effect (Figure 8c). The removal rate of CODMn changed significantly over time (Figure 8d). At the initial stage of the flume, the CODMn concentration continued to decrease compared to the outlet of the DSC section, and after 12 h, the concentration of CODMn gradually increased to the level of the outlet of the DSC section. This variation may be caused by time factors and/or a sharp decrease in the velocity of water entering the delay flume. During the entire study period, compared with the water body of the DSC section, the removal rates of the physical and chemical factors in the delay flume were all positive, indicating that the water body could continue to exert a purification effect after flowing out of the DSC section.
During the study period, TP concentrations in the canal of MR was extremely low, varying in the range of 0.02 to 0.04 mg/L. The TP concentrations in the canal and effluent of the DSC section and delay flume are shown in Table 1 and Table 2. Very low TP concentrations were detected only at Vel = 0.025 m/s. Under other conditions, TP concentrations in the treated water were lower than the detection limit, which was not detected. These results indicate that SDOXM technology was still effective for water bodies with low TP concentrations.

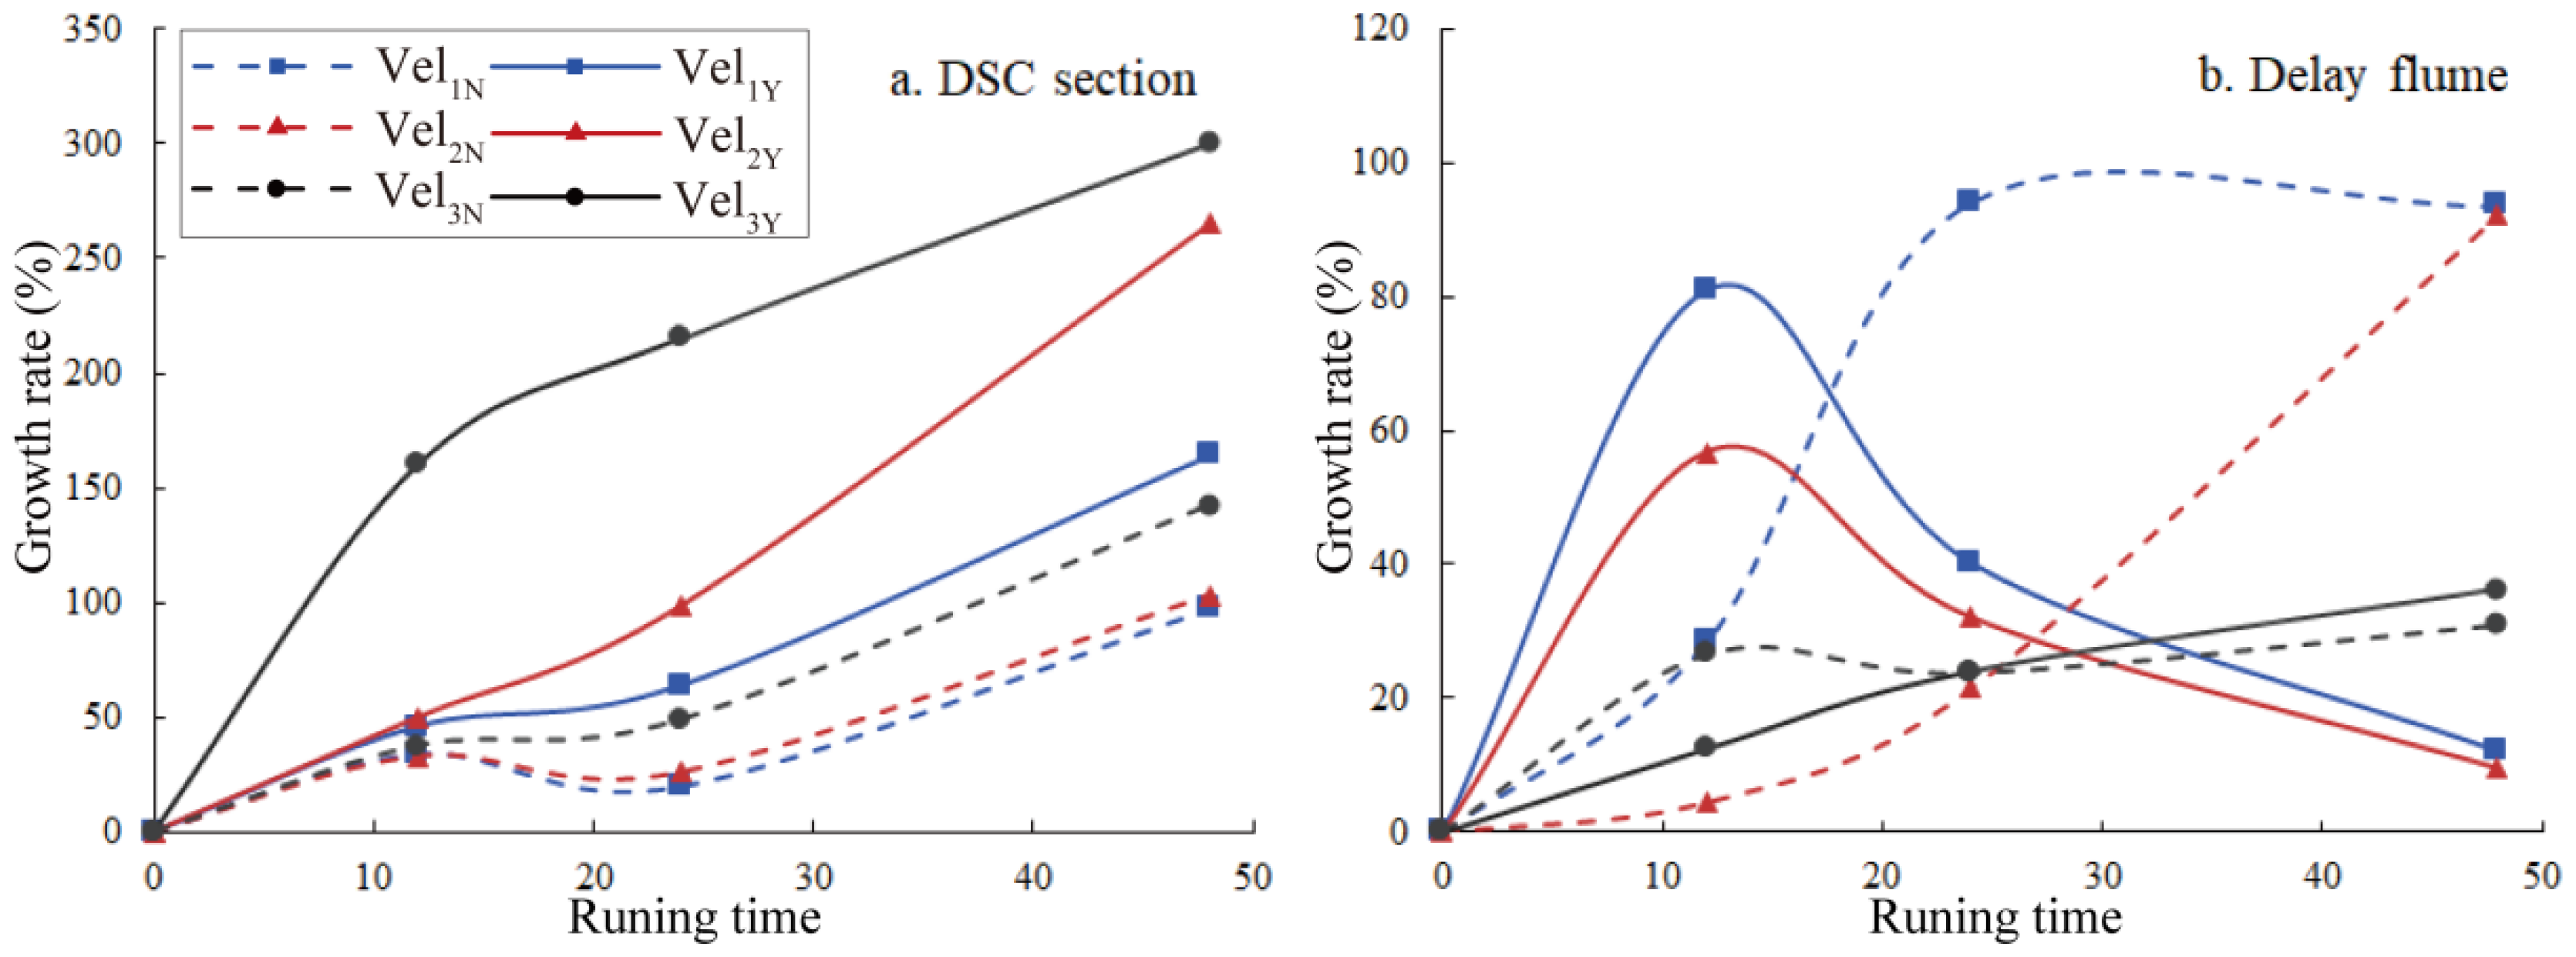
3.3. Effects of the SDOXM System on Microbial Activity in Dynamic Experiment

The effect of the SDOXM system on microbial activity was also evaluated by measuring the relative light unit (RLU) of ATP concentrations. Figure 9a,b shows the growth rate of RLU in the effluent of the delay flume and the DSC section, respectively. The fluorescence value of ATP in the MR canal ranged from 50 to 104 RLU. After equipment treatment, the highest fluorescence value was 292 RLU and the highest growth rate was 265%. As shown in Figure 9a, the longer the treatment time, the higher the growth rate of the fluorescence value of the ATP concentration (at a given Vel); the higher the Vel, the higher the growth rate of the fluorescence value of ATP concentration (at a given treatment time). In addition, the fluorescence value of ATP concentration was significantly affected by artificial aquatic plants (p < 0.05). That is, the increase rate of the fluorescence value with artificial aquatic plants was higher than that without artificial aquatic plants. After entering the time-lapse flume, the fluorescence values of ATP continued to increase (Figure 9b). Compared with the effluent of the DSC section, there was a decreasing trend (after 12 h) in the growth rate of RLU at flow velocities of 0.025 and 0.045 m/s in the presence of artificial plants. This result may be related to the growth law of the microorganisms.

3.4. Phytoplankton Community Composition

In this study, a total of 92 species of phytoplankton belonging to 65 genera and eight phyla were identified from the water samples. The most diverse phylum was Chlorophyta (27 genera, 41 species) (44.56%), followed by Bacillariophyta (20 genera, 29 species) (30.43%), Cyanobacteria (9 genera, 11 species) (11.96%), Cryptophyta (two genera, five species) (5.34%), Miozoa (three genera, three species) (3.26%), Euglenozoa (two genera, two species) (2.17%), Ochrophyta (one genera, one species) (1.09%), and Charophyta (one genus, one species) (1.09%). The average phytoplankton abundance in the canal was 4.09 × 10⁶ cells/L with a range of 1.06 × 10⁶∼13.32 × 10⁶ cells/L. After treatment with the equipment, the average phytoplankton abundance was 3.25 × 10⁶ cells/L, with a range of 2.08 × 10⁶∼9.33 × 10⁶ cells/L. In addition, the t-test results showed that there were significant differences in phytoplankton abundance before and after treatment. In terms of phytoplankton community composition, Bacillariophyta remained the most abundant group in the equipment-treated water bodies when compared to the canal phytoplankton community, with the average contribution to total abundance increasing from 22.62% to 31.79%; Chlorophyta replaced Cyanobacteria as the second dominant phylum, and the average contribution to the total abundance increased from 22.62% to 31.79%. However, the average contribution of Cyanobacteria to total abundance decreased from 33.89% to 19.66%.
As shown in Table 3, a total of 34 (22 species before treatment and 33 species after treatment) phytoplankton dominant species (Y > 0.02) belonging to six phyla and 21 genera were screened during the study period, most of which belonged to Bacillariophyta and Chlorophyte. The dominance of Cymbella sp., Aulacoseira granulate, and Cyclotella sp. of Bacillariophyta was always higher than that of other dominant species during the study period. The main dominant species of Cyanobateria were Microcystis sp. and Pseudanabaena sp., while those of Chlorophyta were Coelastrum microporum, Desmodesmus communis, and Oocystis sp. There were few dominant phytoplankton species in Miozoa and Cryptophyta. In addition, the dominant phytoplankton species increased, and the dominance generally increased after water was treated by the equipment.

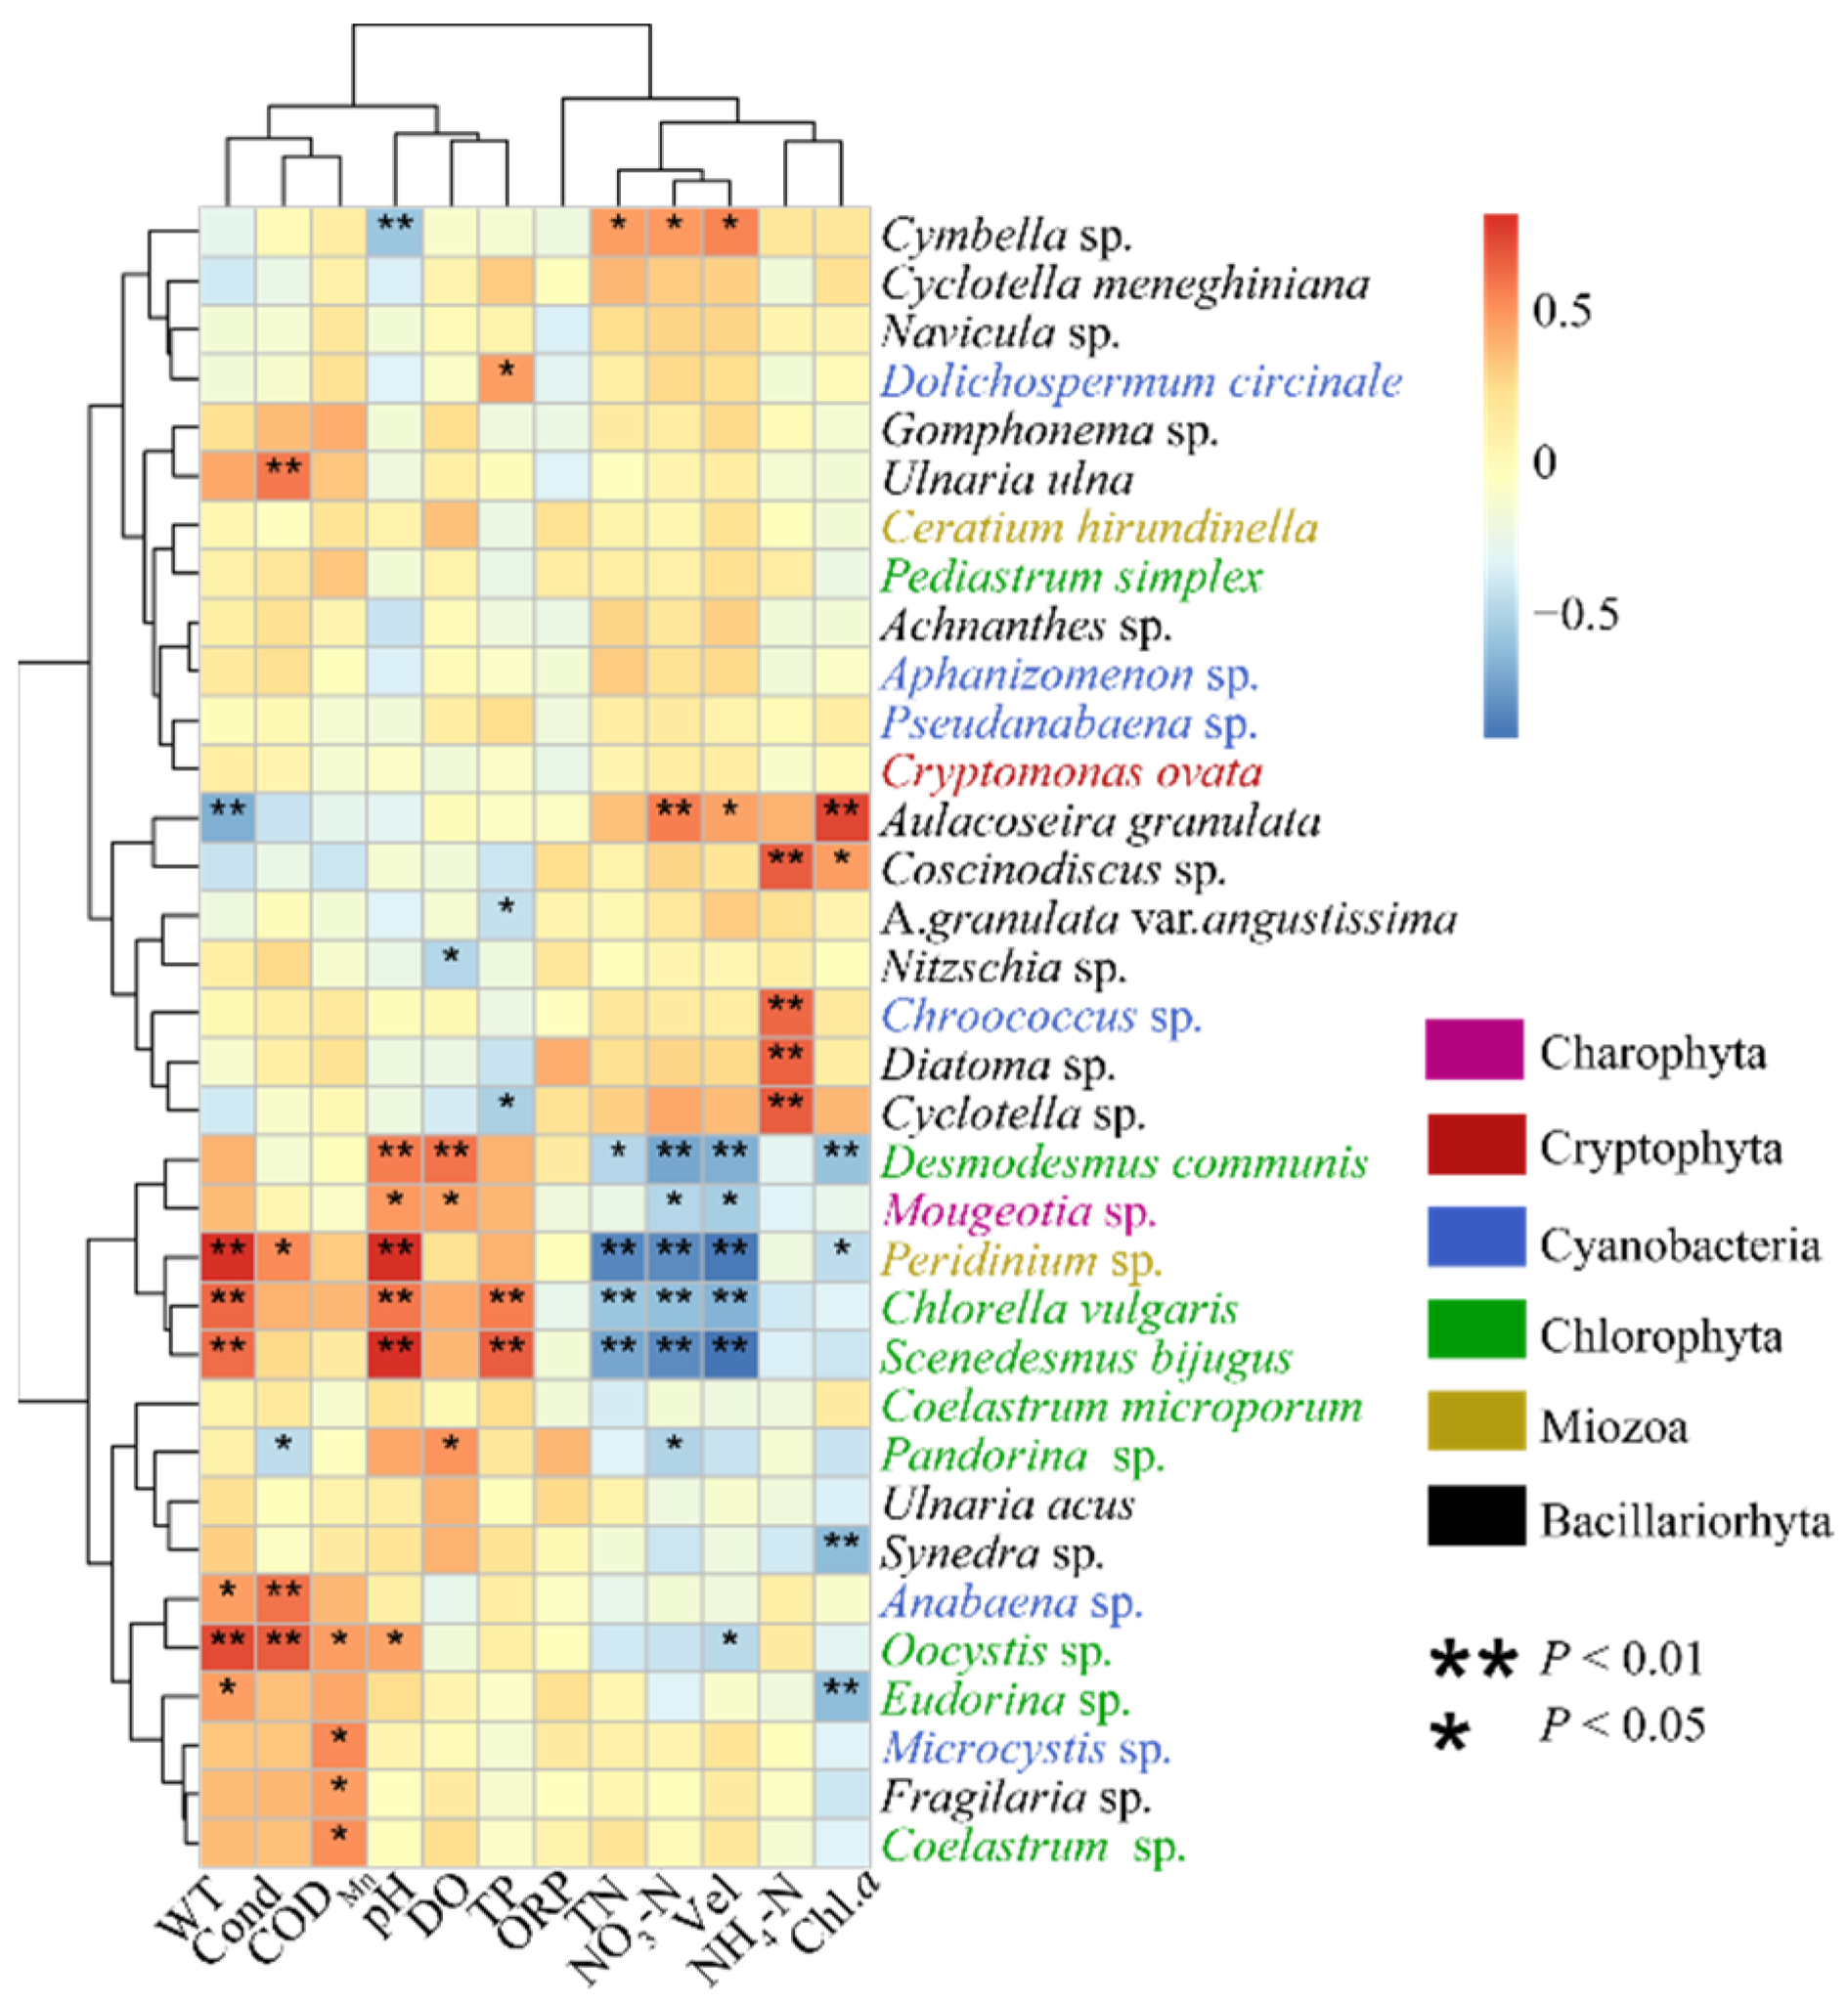
3.5. Relation between Phytoplankton Species and Environmental Factors

To explore the reasons for the change in phytoplankton community composition after water treatment, a total of 34 dominant species of phytoplankton (Y > 0.02) were selected for detrended correspondence analysis (DCA). DCA of the species data indicated that the maximum gradient length of the four axes was 2.3 (<3). Accordingly, redundancy analysis (RDA) was preferred for direct gradient analysis. In RDA, the forward selection method with the Monte Carlo permutation test was performed to choose the environmental variables that represented the major gradients, but did not correlate strongly with each other in explaining the variability among dominant species. Therefore, environmental variables with a variance inflation factor (VIF) above 20 were removed to avoid multicollinearity among the variables. From this process, WT, NO3-N, and Vel were found to be redundant and were thus removed from the analysis. The remaining variables, pH, TN, NH4-N, TP, DO, ORP, CODMn, Cond, and Chl.a had VIFs below 20, and these were the final environmental variables considered in the final RDA. The eigenvalues for the first two axes were 0.432 and 0.176, respectively, explaining 66.5% of the total variance in species data. The RDA ordination diagram including nine environmental variables and 34 dominant species is presented in Figure 10. The first RDA species axis was positively related to TP, pH, and DO and negatively related to TN, OPR, and NH4-N. The second RDA species axis was positively associated with CODMn and Cond, but negatively associated with Chl.a. The results indicated that these environmental variables were closely related to the phytoplankton community composition. It could be found that most species belonging to Chlorophyta, especially Desmodesmus communis, were positively correlated with DO and pH, but negatively correlated with NH4-N. Some dominant species of Bacillariophyta were negatively associated with TP at the positive end of axis 1 and positively associated with total TN at the negative end of axis 1. Dolichospermum circinale and Anabaena sp. showed a positive correlation with TP. Furthermore, at the positive end of axis 2, some Cyanobacteria, Bacillariophyta, and Chlorophyta species were positively correlated with CODMn.
Pearson’s correlation analysis was conducted between the dominant species of phytoplankton and environmental factors to further clarify the effects of environmental factors on phytoplankton community composition. As shown in Figure 11, Diatoma sp., Cyclotella sp., and Coscinodiscus sp. were significantly positively associated with NH4-N and Cymbella sp. was positively associated with TN and NO3-N, while Cyclotella sp. and A. granulata var. angustissima was negatively associated with TP. Moreover, Melosira granulate was positively correlated with NO3-N and Chl.a, while Fragilaria sp. was positively correlated with CODMn. Chlorella vulgaris, Scenedesmus bijugus, and Desmodesmus communis were positively related to pH and significantly negatively related to TN, NO3-N, and Vel. Pandorina sp. and Desmodesmus communis showed a positive correlation with DO. Microcystis sp. was significantly positively associated with CODMn and Dolichospermum circinale with TP, while Chroococcus sp. was associated positively with NH4-N. Furthermore, Peridinium. sp. belonging to Dinophyta showed a significantly negative correlation with TN and TP, and a positive correlation with pH and WT.

4. Discussion

4.1. Effects of the SDOXM System on DO Concentration

In this study, the SDOXM composite technology was used to better combine microbubbles with magnetized water. During the static test, DO concentration can rapidly increase to 23.09 ± 0.03 mg/L after the water was treated by equipment once (running 8.5 h), indicating that the oxygen transfer rate and oxygen transfer efficiency in the water were greatly improved after the treatment by SDOXM equipment. After continuous treatment three times (running 25 h), DO concentration in the water was up to 38.7 mg/L. After 72 h, the water was still in a supersaturated state (22.42 ± 0.03 mg/L), indicating that it could be maintained in a state of supersaturation for a long time. In the dynamic experiment, when the Vel of the DSC section was 0.025 m/s (treatment ratio of 1:1), the maximum concentration of DO was 19.12 mg/L at the outlet of the DSC section. After staying in the delay flume for 48 h, the DO concentration was still higher than that of natural water, which was in a supersaturated state. However, due to the large gap between the flow velocity in the delay flume and that in the natural watersheds and the MR canal, the time for maintaining supersaturation of DO concentration in natural water needs to be further explored in future specific applications.

4.2. Effects of the SDOXM System on Water Environmental Factors

The contribution rate of TN to the pollution index of most sections in the MR canal was above 50%, which was the most important pollution index, while the TP concentration was very low [3]. The fine molecular supersaturated dissolved oxygen device not only made the water supersaturated dissolved oxygen, but also reduced the partial pressure of NH4-N, thereby reducing the solubility of NH4-N in water, so that part of NH4-N was transferred from the liquid phase to the gas phase and discharged from the water body. In addition, the removal effects of NH4-N and TP in water were positively correlated with DO concentration [29,30]. The DO concentrations after treatment by equipment were in the supersaturated state for a long time (Figure 5 and Figure 6), which promoted the nitrification of microorganisms [31] to achieve the purpose of reducing NH4-N. After treatment with the equipment, the maximum removal rate of TP was 27.96% (static experiment) or the TP concentration was lower than the detection limit (dynamic experiment). This suggests that the SDOXM equipment can effectively promote the absorption and transformation of phosphorus by microorganisms and phytoplankton [32]. On one hand, under aerobic conditions, polyphosphate-accumulating bacteria absorb a large amount of phosphorus from the outside, store it in cells in the form of polyphosphate, and finally precipitate it in the sediment. On the other hand, phytoplankton also plays an important role in the removal of phosphorus in water by absorbing soluble phosphate in water [33]. Under supersaturated dissolved oxygen, denitrification was inhibited and the only way to remove nitrate was biological utilization [34]. ATP bioluminescence is a rapid assay that has become a widely accepted method for estimating the biomass of microorganisms in recent years. Bioluminescence RLU is directly proportional to ATP quantity, so it can indirectly reflect the biomass of microorganisms [35]. As observed in Figure 9, the RLU increased significantly after treatment. Certainly, it can be concluded that the biomass and activity of microorganisms in the water were effectively improved. Additionally, the proliferation of microorganisms absorbs and utilizes nitrogen elements in water, resulting in a significant reduction in the NO3-N concentration. There was a significant correlation between CODMn and DO [36,37]. In this study, the removal effect of CODMn was obvious with a significant increase in the DO concentration, and the maximum removal rates were 30% (static experiment) and 28.6% (dynamic experiment), respectively. During this research, the removal efficiency of the key performance indicator parameters (e.g., NH4-N, NO3-N, CODMn, TN, and TP) with artificial aquatic plants was better than that without artificial aquatic plants. The reason for this result is that the surface of artificial aquatic plants is covered with biofilms, which play a certain role in water purification. Moreover, it is worth mentioning that sediment beds and aquatic plants in natural watersheds can provide carriers for microbial proliferation, therefore, it can be inferred that SDOXM equipment can play a better role in natural basins.

4.3. Effects of the SDOXM System on Phytoplankton

The water quality of the MR canal is good throughout the year, with all sections capable of reaching the standard of class II or above [38]. During the study period, the phytoplankton community in the canal water body was mainly composed of Bacillariophyta, which is consistent with previous research [39]. Many factors such as WT, nutrients, and hydrodynamic conditions jointly affect the structure and function of the phytoplankton community [40], and WT has become the main controlling factor for the change in phytoplankton community structure by regulating cell activity. An increase in water temperature accelerates the growth and proliferation of algal populations, and there are species differences in the adaptability of different algae to WT, which leads to changes in dominant species with changes in water temperature [41]. In this study, there was also a significant correlation between some dominant species of phytoplankton and water temperature, as shown in Figure 11. Nutrients are necessary for phytoplankton growth and reproduction. TN and TP are important factors affecting the cell density and community structure of phytoplankton. Studies have shown that the proliferation of algae is mainly due to the rapid absorption and utilization of nitrogen [40] Chlorella vulgaris, Desmodesmus communis, and Scenedesmus bijugus were negatively correlated with NH4-N and TN (Figure 10), and highly significantly negatively correlated with TN and NO3-N (Figure 11), indicating that SDOXM technology improved the primary productivity of Chlorophyta, accompanied by a large amount of nitrogen consumption. The TN:TP ratio(16:1 by atoms) has been extensively used as a criterion to assess nutrient limitation [42,43]. During this research, TN concentration was high (0.81~1.89 mg/L) and TP concentration was low (0~0.03 mg/L), showing phosphorus limitation (TN:TP > 16). However, Cyanobacteria species are usually adapted to growing in environments with high phosphorus concentrations [44]. After the water was treated by the SDOXM equipment, the phosphorus concentration decreased, and most TP was not detected, resulting in a decrease in the relative abundance of Cyanobacteria. As shown in Figure 10 and Figure 11, TP was significantly positively correlated with Dolichospermum circinale, which was consistent with the analysis results. The optimal phosphorus concentration for diatom growth was low (0.002–0.01 mg/L), so the dominant position of diatoms was not affected [45,46]. In addition, Microcystis sp. of Cyanobacteria was positively correlated with CODMn (Figure 10 and Figure 11), and the removal effect of CODMn was obvious during the experiment, which may lead to a decrease in the abundance of Cyanobacteria [47]. Additionally, RDA results showed that the abundance of Chlorophyta increased gradually with the increase in DO concentration, and species such as Desmodesmus communis and Chlorella vulgaris are closely related to DO concentration (Figure 10). The results of the current study indicate that the phytoplankton community changed from Bacillariophyta-Cyanobacteria to Bacillariophyta-Chlorophyta, and Chlorophyta replaced Cyanobacteria as the second dominant species in water. In addition, although the WT varied widely during the study period (16.00~28.20 °C), the samples before and after SDOXM treatment were collected simultaneously, and the treatment of the equipment did not cause a change in WT. Therefore, the change in phytoplankton community structure was mostly caused by a decrease in TP concentration and the increase in DO concentration, rather than a change in WT.

4.4. Operating Cost of the SDOXM System

The operational cost of the SODXM system was estimated according to the capital investment of this test. The total annual operational cost is approximately 843,000 yuan, and the treatment cost per ton of water is approximately 0.03 yuan.

5. Conclusions

It has been proven in this research that the SDOXM technology can effectively improve DO concentration in water by combining supersaturated dissolved oxygen technology with water magnetization technology. SDOXM technology can not only improve the oxygen transfer rate and oxygen transfer efficiency in water, but also maintain the supersaturated state of DO concentration for more than three days.
SDOXM technology can effectively remove the main nutritional indexes (e.g., NH4-N, NO3-N, CODMn, TN, and TP), enhance the activity of microorganisms, and improve the community structure of phytoplankton by creating a super aerobic environment for the water body and improving the purification capacity in the natural aquatic ecosystem.
The DO concentration was not affected by the introduction of artificial aquatic plants. The removal rates of the main detection index were increased by the action of artificial aquatic plants, although the DO concentration was not affected by the introduction of artificial aquatic plants.
As the results in this study have proven, SDOXM technology is a promising technology for the purification of water bodies. Static experiments provide reference data and technical support for the application of SDOXM technology to improve the water quality of static water bodies (South-to-North Water Transfer Savings Project, lakes, and reservoirs), and dynamic experiments provide important technical support for the application of SDOXM technology to improve the water quality of flowing water bodies (main channels of South-to-North Water Transfer, natural basins, and urban rivers).
Due to the limitations of the experimental field space, the operating conditions such as the treatment times and the flow rates set in this experiment are far from the actual situation of the MR canal and/or the natural watershed. For example, there is a significant difference between the flow velocity of water in the delay flume and that in the natural water body and the MR canal; there are also essential differences among sedimentary beds, aquatic plants, and artificial aquatic plants in natural watersheds and lakes and the concentrations of organic matter and nutrients in the water of the MR canal are far lower than those in the natural watershed. Therefore, further experimental exploration is required to verify the purification effect of the SDOXM composite process on water.

Author Contributions

Y.Y. and Y.L. conceived the study; Y.Y., K.H. and Z.M. analyzed the data; Z.C. used software to draw pictures; Y.Y. and Y.L. wrote the manuscript of the paper. And all other authors collected data and commented on the manuscript; B.M. revised the manuscript of the paper. All authors have read and agreed to the published version of the manuscript.

Funding

This work was financially supported by National Natural Science Foundation of China (No.51879130), higher discipline innovation and talent introduction base of Henan Province (No.CXJD2019001), River and Lake Management and River and Lake Chief System Project of River and Lake Protection Center of Ministry of Water Resources of China (HHZX2021-15), and the Key Science and Technology Project of China National Tobacco Corporation Henan Branch (2020410000270020).

Institutional Review Board Statement

Not applicable.

Informed Consent Statement

Not applicable.

Data Availability Statement

Not applicable.

Acknowledgments

The authors would like to thank River and Lake Management and River and Lake Chief System Project of River and Lake Protection Center of Ministry of Water Resources of China for their financial support for conducting this research. The authors would also like to thank Beijing Huanerkang Technology Development Co., Ltd., Beijing for their technical support.

Conflicts of Interest

The authors declare that they had no known competing financial interests or personal relationships that could have appeared to influence the work reported in this paper.

References

  1. Wei, Y.; Chao, W.; Xiaokang, X. Thinkings on water quality management of main channel in Middle Route of South-to-North Water Transfer Project. Yangtze River 2020, 51, 17–24. [Google Scholar]
  2. Sun, J.; Han, P.; Wang, C.; Xin, X.; Lei, J.; Yin, W. Study on the comprehensive evaluation of water quality status of the middle route main channel of the South-to-North Water Diversion Project. South-North Water Transf. Water Sci. 2019, 17, 102–112. [Google Scholar]
  3. Nong, X.; Dongguo, S.; Zhong, H.; Liang, B. Evaluation of water quality in the South-to-North Water Diversion Project of China using the Water Quality Index (WQI) Method. Water Res. 2020, 178, 115781. [Google Scholar] [CrossRef] [PubMed]
  4. Liang, J.; Xin, X.; Lu, L.; Hu, S.; Zhu, D.; Tang, J. Analysis of water quality variation and potential pollution sources in main channel of Middle Route Project of South to North Water Diversion. Yangtze River 2017, 48, 6–9. [Google Scholar]
  5. Hoffmann, C.C.; Ba Attrup-Pedersen, A. Re-establishing freshwater wetlands in Denmark. Ecol. Eng. 2007, 30, 157–166. [Google Scholar] [CrossRef]
  6. Gs, A.; Rg, A.; Sfr, A.; Uha, B. The use of pure oxygen for aeration in aerobic wastewater treatment: A review of its potential and limitations. Bioresour. Technol. 2020, 312, 123595. [Google Scholar]
  7. Chibowski, E.; Szcze, A. Magnetic water treatment–a review of the latest approaches. Chemosphere 2018, 203, 54–67. [Google Scholar] [CrossRef]
  8. Mohammed, R.R.; Ketabchi, M.R.; Mckay, G. Combined magnetic field and adsorption process for treatment of biologically treated palm oil mill effluent (POME). Chem. Eng. J. 2014, 243, 31–42. [Google Scholar] [CrossRef]
  9. Zielinski, M.; Rusanowska, P.; Debowski, M.; Hajduk, A. Influence of static magnetic field on sludge properties. Sci. Total Environ. 2018, 625, 738–742. [Google Scholar] [CrossRef]
  10. Wang, Y.; Gu, X.; Quan, J.; Xing, G.; Hu, Y. Application of magnetic fields to wastewater treatment and its mechanisms: A review. Sci. Total Environ. 2021, 773, 145476. [Google Scholar] [CrossRef]
  11. Gu, S.; Lian, F.; Yan, K.; Zhang, W. Application of polymeric ferric sulfate combined with cross-frequency magnetic field in the printing and dyeing wastewater treatment. Water Sci. Technol. A J. Int. Assoc. Water Pollut. Res. 2019, 80, 1562–1570. [Google Scholar] [CrossRef] [PubMed]
  12. Wang, X.; Wang, P. Biological effects of magnetization in sewage treatment. Environ. Sci. Technol. 2000, 2, 33–36. [Google Scholar]
  13. Ji, Y.; Wang, Y.; Sun, J.; Yan, T.; Jing, L.; Zhao, T.; Yin, X.; Sun, C. Enhancement of biological treatment of wastewater by magnetic field. Bioresour. Technol. 2010, 101, 8535–8540. [Google Scholar] [CrossRef] [PubMed]
  14. Morrow, A.C.; Dunstan, R.H.; King, B.V.; Roberts, T.K. Metabolic effects of static magnetic fields on streptococcus pyogenes. Bioelectromagnetics 2010, 28, 439–445. [Google Scholar] [CrossRef]
  15. Tomska, A.; Wolny, L. Enhancement of biological wastewater treatment by magnetic field exposure. Desalination 2008, 222, 368–373. [Google Scholar] [CrossRef]
  16. Zhai, Y.; Ju, S. Experiment on the improvement of surface water quality by supersaturated dissolved oxygen. Water Purif. Technol. 2019, 38, 60–63. [Google Scholar]
  17. Pan, Z.; Yu, D. Experimental and features automatic supersaturated aerator. Sci. Technol. 2015, 7, 5–6. [Google Scholar]
  18. Sang, Y.K.; Lopez-Vazquez, C.M.; Curko, J.; Matosic, M.; Garcia, H.A. Supersaturated-oxygen aeration effects on a high-loaded membrane bioreactor (HL-MBR): Biological performance and microbial population dynamics. Sci. Total Environ. 2020, 771, 144847. [Google Scholar]
  19. Gabrielli, C.; Jaouhari, R.; Maurin, G.; Ke Dd Am, M. Magnetic water treatment for scale prevention. Water Res. 2001, 35, 3249–3259. [Google Scholar] [CrossRef]
  20. Yoshida, A.; Takahashi, O.; Ishii, Y.; Sekimoto, Y.; Kurata, Y. Water purification using the adsorption characteristics of microbubbles. Jpn. J. Appl. Phys. 2008, 47, 6574–6577. [Google Scholar] [CrossRef]
  21. Hu, H.; Wei, Y. The Freshwater Algae of China—Systematics, Taxonomy and Ecology; Science Press: Beijing, China, 2006. [Google Scholar]
  22. Zhang, Q.; Liu, G.; Hu, Z. Study on freshwater genus Peridiniopsis (Dinophyta) from China. Acta Hydrobiol. Sin. 2012, 36, 751–765. [Google Scholar]
  23. Sun, C.C.; Wang, Y.S.; Sun, S.; Zhang, F.Q. Analysis dynamics of phytoplankton community characteristics in Daya Bay. Acta Ecol. Sin. 2006, 12, 3948–3958. [Google Scholar]
  24. NEPAC—The National Environmental Protection Agency of China; Ministry of Environmental Protection of the People’s Republic of China. Standard Methods for the Examination of Water and Wastewater; Environmental Science Press: Beijing, China, 2002. [Google Scholar]
  25. Hao, Y.; Sun, G.; Zhang, L.; Gong, X.; Xu, S.; Liu, H.; Zhang, F. Relationship between community characteristics of the phytoplankton and environmental factors in Heihe River basin. J. Lake Sci. 2014, 26, 121–130. [Google Scholar]
  26. Lepš, J.; Amilauer, P. Multivariate Analysis of Ecological Data Using CANOCO 5; Cambridge University Press: Cambridge, UK, 2003. [Google Scholar]
  27. Wickham, H. Ggplot2: Elegant Graphics for Data Analysis; ggplot2: Elegant Graphics for Data Analysis; Springer: New York, NY, USA, 2009. [Google Scholar]
  28. Wood, S.N. Fast stable restricted maximum likelihood and marginal likelihood estimation of semiparametric generalized linear models. J. R. Stat. Soc. Ser. B Stat. Methodol. 2011, 73, 3–36. [Google Scholar] [CrossRef] [Green Version]
  29. Du, L.; Trinh, X.; Chen, Q.; Wang, C.; Wang, H.; Xia, X.; Zhou, Q.; Xu, D.; Wu, Z. Enhancement of microbial nitrogen removal pathway by vegetation in Integrated Vertical-Flow Constructed Wetlands (IVCWs) for treating reclaimed water. Bioresour. Technol. 2017, 249, 644–651. [Google Scholar] [CrossRef]
  30. Zhab, C.; Jing, D.D.; Zsb, C.; Rui, M.C.; Yzb, C.; Xc, E.; Xf, E.; Cy, A. Nitrogen removal of anaerobically digested swine wastewater by pilot-scale tidal flow constructed wetland based on in-situ biological regeneration of zeolite. Chemosphere 2019, 217, 364–373. [Google Scholar]
  31. Liu, Y.; Shi, H.; Xia, L.; Shi, H.; Shen, T.; Wang, Z.; Wang, G.; Wang, Y. Study of operational conditions of simultaneous nitrification and denitrification in a Carrousel oxidation ditch for domestic wastewater treatment. Bioresour. Technol. 2010, 101, 901–906. [Google Scholar] [CrossRef]
  32. Mahapatra, D.M.; Chanakya, H.N.; Ramachandra, T.C. Treatment efficacy of algae-based sewage treatment plants. Environ. Monit. Assess. 2013, 185, 7145–7164. [Google Scholar] [CrossRef]
  33. Trabelsi, L.; Ouada, H.B.; Zili, F.; Mazhoud, N.; Ammar, J. Evaluation of Arthrospira platensis extracellular polymeric substances production in photoautotrophic, heterotrophic and mixotrophic conditions. Folia Microbiol. 2013, 58, 39–45. [Google Scholar] [CrossRef]
  34. Rangarajan, C.; Mishra, P. Simultaneous nitrification and denitrification in biofilters with real time aeration control. Water Sci. Technol. 2001, 43, 269–276. [Google Scholar]
  35. Chen, F.C.; Godwin, S.L. Comparison of a rapid ATP bioluminescence assay and standard plate count methods for assessing microbial contamination of consumers’ refrigerators. J. Food Protect. 2006, 69, 2534–2538. [Google Scholar] [CrossRef]
  36. Wei, L.; Kang, K.; Liu, Q.; Liu, Y. Investigation on water quality assessment model of surface water with high dissolved oxygen and potassium permanganate index. Environ. Sci. Manag. 2014, 39, 178–182. [Google Scholar]
  37. Sha, H.; Fan, L. Study on relative characteristics between DO, CODCr and CODMn on surface water. GuangZhou Chem. Ind. 2021, 49, 105–106. [Google Scholar]
  38. Zhang, C.; Zhu, Y.; Song, G.; Wujuan, M.; Bi, Y.; Wang, S.; Ling, J.; Shang, M. Spatiotemporal pattern of phytoplankton community structure and its determining factors in the channel of the middle route of South-to-North Water Diversion Project. J. Lake Sci. 2021, 33, 675–686. [Google Scholar]
  39. Zhang, C.; Mi, W.; Xu, Y.; Song, G.; Zhu, Y.; Bi, Y. Phytoplankton community characteristics and water environment assessment in the Main Channel of the Middle Route of the South-to-North Water Diversion Project. J. Hydroecol. 2021, 42, 47–54. [Google Scholar]
  40. Wu, L.; Yu, Y.; Zhang, T.; Feng, W.; Zhang, X.; Li, W.; Wu, L.; Yu, Y.; Zhang, T.; Feng, W. PCR-DGGE fingerprinting analysis of plankton communities and its relationship to lake trophic status. Int. Rev. Hydrobiol. 2010, 94, 528–541. [Google Scholar] [CrossRef]
  41. Trombetta, T.; Vidussi, F.; Mas, S.; Parin, D.; Mostajir, B. Water temperature drives phytoplankton blooms in coastal waters. PLoS ONE 2019, 14, e214933. [Google Scholar] [CrossRef] [Green Version]
  42. Bergström, A.K. The use of TN:TP and DIN:TP ratios as indicators for phytoplankton nutrient limitation in oligotrophic lakes affected by N deposition. Aquat. Sci. 2010, 72, 277–281. [Google Scholar] [CrossRef]
  43. Redfield, A.C. The biological control of chemical factors in the environment. Am. Sci. Sci. Prog. 1960, 11, 150–170. [Google Scholar]
  44. Reynolds, C.S.; Vera, H.; Carla, K.; Luigi, N.F.; Sergio, M. Towards a functional classification of the freshwater phytoplankton. J. Plankton Res. 2002, 24, 417–428. [Google Scholar] [CrossRef]
  45. Yang, W.; Deng, D.G.; Meng, X.L.; Zhang, S. Temporal and spatial variations of phytoplankton Community Structure in Lake Erhai, a Chinese plateau lake, with reference to environmental factors. Russ. J. Ecol. 2019, 50, 352–360. [Google Scholar] [CrossRef]
  46. Stamou, G.; Katsiapi, M.; Moustaka-Gouni, M.; Michaloudi, E. Trophic state assessment based on zooplankton communities in Mediterranean lakes. Hydrobiologia 2019, 884, 83–103. [Google Scholar] [CrossRef]
  47. Chao, W.; Hong, Z.; Pei, L.; Xiaokang, X.; Aijing, Z.; Wei, Y. Evidence on the causes of the rising levels of CODMn along the middle route of the South-to-North Diversion Project in China: The role of algal dissolved organic matter. J. Environ. Sci.-China 2022, 113, 281–290. [Google Scholar]
Figure 1. Location of the study site.
Sustainability 14 02684 g001
Figure 2. Reconstruction layout of the experimental site.
Sustainability 14 02684 g002
Figure 3. Experimental setup of the SDOXM system. (a) Technological process; (b) Experimental setup; (c) Internal structure of the setup.
Sustainability 14 02684 g003
Figure 4. Design of the experiment. (a) Experimental model of static experiment. (b) Experimental model of dynamic experiment.
Sustainability 14 02684 g004
Figure 5. Temporal variations of DO concentration and removal rates during the static experiment period. (a) NH4-N; (b) NO3-N; (c) TN; (d) TP; (e) CODMn. red denotes the removal rates of nutrients and organic pollutants, black denotes the changes of dissolved oxygen concentration.
Sustainability 14 02684 g005
Figure 6. Temporal variations of DO concentration during the dynamic experiment period. (a) DSC section; (b) delay flume. Y denotes group with artificial aquatic plants, N group without artificial aquatic plants.
Sustainability 14 02684 g006
Figure 7. Temporal variations of organic matter removal rates in the effluent of the DSC section. (a) NH4-N; (b) NO3-N; (c) TN; (d) CODMn. Vel1, Vel2, and Vel3 represent flow velocities of 0.025, 0.045, and 0.104 m/s, respectively; Y denotes the group with artificial aquatic plants; N denotes the group without artificial aquatic plants.
Sustainability 14 02684 g007
Figure 8. Temporal variations of organic matter removal rates in the effluent of the delay flume. (a) NH4-N; (b) NO3-N; (c) TN; (d) CODMn. Vel1, Vel2, and Vel3 represent flow velocities of 0.025, 0.045, and 0.104 m/s, respectively; Y denotes the group with artificial aquatic plants, N denotes the group without artificial aquatic plants.
Sustainability 14 02684 g008
Figure 9. Temporal variations of RLU growth rates during the dynamic experiment period. (a) DSC section; (b) delay flume. Vel1, Vel2, and Vel3 represent the flow velocities of 0.025, 0.045, and 0.104 m/s, respectively; Y denotes group with artificial aquatic plants, N group without artificial aquatic plants.
Sustainability 14 02684 g009
Figure 10. RDA ordination diagram of the phytoplankton dominant species and environmental variables.
Sustainability 14 02684 g010
Figure 11. Heatmap of Spearman correlation coefficients between dominant species of phytoplankton and environmental factors (* indicates significant correlation at the 0.05 level; ** indicates highly significant correlation at the 0.01 level).
Sustainability 14 02684 g011
Table 1. TP concentration in the effluent of the DSC section.
VelOperational Time (h)Detection LimitNot Detected
0122448
N 0.025 m/s0.0240.0260.0250.020.01 mg/L“-”
Y 0.025 m/s0.02---
N 0.045 m/s0.02---
Y 0.045 m/s----
N 0.104 m/s----
Y 0.104 m/s0.04---
“Y” denotes the group with artificial aquatic plants, “N” group without artificial aquatic plants.
Table 2. TP concentration in the effluent of delay flume.
VelOperational Time (h)Detection LimitNot Detected
0122448
N 0.025 m/s0.020.0150.0190.0150.01 mg/L“-”
Y 0.025 m/s0.02---
N 0.045 m/s----
Y 0.045 m/s0.02---
N 0.104 m/s----
Y 0.104 m/s----
“Y” denotes group with artificial aquatic plants, “N” group without artificial aquatic plants.
Table 3. Predominant species and dominance value (Y) of phytoplankton during the study period.
PhylaDominant SpeciesY
Before TreatmentAfter Treatment
CyanobacteriaAnabaena sp.-0.022
Aphanizomenon sp.-0.109
Chroococcus sp.-0.075
Dolichospermum circinale-0.036
Microcystis sp.0.1280.116
Pseudanabaena sp.0.0210.026
ChlorophytaChlorella vulgaris0.050.091
Coelastrum microporum0.0220.054
Coelastrum sp.0.0530.149
Desmodesmus communis0.0270.031
Eudorina sp.-0.035
Oocystis sp.0.0370.093
Pandorina sp.-0.055
Pediastrum simplex0.0210.054
Scenedesmus bijugus0.0430.076
BacillariophytaAchnanthes sp.-0.031
Aulacoseira granulata0.5010.517
A. granulata var. angustissima-0.197
Coscinodiscus sp.0.0320.059
Cyclotella meneghiniana0.0250.027
Cyclotella sp.0.4510.469
Cymbella sp.0.5480.487
Diatoma sp.0.02-
Fragilaria sp.0.0950.07
Gomphonema sp.0.0280.034
Navicula sp.0.1620.294
Nitzschia sp.-0.026
Synedra sp.0.070.053
Ulnaria acus-0.157
Ulnaria ulna-0.057
MiozoaCeratium hirundinella0.0210.063
Peridinium sp.0.0870.086
CryptophytaCryptomonas ovata-0.022
CharophytaMougeotia sp.0.020.049
“-” indicates that this species appears during the study period but is not the dominant species.
Publisher’s Note: MDPI stays neutral with regard to jurisdictional claims in published maps and institutional affiliations.

