Article

Pervious Concrete Reinforced with Waste Cloth Strips

by
Sandra Juradin
1,*,
Frane Mihanović
2,
Nives Ostojić-Škomrlj
1 and
Ela Rogošić
1
1
Faculty of Civil Engineering, Architecture and Geodesy, University of Split, Matice hrvatske 15, 21000 Split, Croatia
2
Department of Health Studies, University of Split, Ruđera Boškovića 35, P.P. 464, 21000 Split, Croatia
*
Author to whom correspondence should be addressed.
Sustainability 2022, 14(5), 2723; https://doi.org/10.3390/su14052723
Submission received: 30 December 2021 / Revised: 17 February 2022 / Accepted: 21 February 2022 / Published: 25 February 2022
(This article belongs to the Special Issue Application of Waste Materials in Pavement Structures)

Abstract

:
Pervious concrete is considered an environment-friendly paving material and its main feature is that it allows water to penetrate within its structure. Because of open pores in pervious concrete structures, there is a high risk of corrosion, so this concrete is used without any reinforcement or with fiber reinforcement. The incorporation of fibers in concrete is known to substantially increase the tensile strength, toughness, and ductility of concrete. The fast-fashion trend encourages people to buy more clothes and dispose of them in a shorter period of time, resulting in 85% of clothes ending up in landfills or being burned. In this paper, old cotton T-shirts were cut into narrow strips about 5 ± 1 cm long for the purpose of reinforcing pervious concrete. A total of eight concrete mixtures were made: four without reinforcement and four with textile-strip reinforcement. The number of textile strips was 1% of the total volume. Tests carried out on the specimens were: slump, density, porosity, compressive and flexural strength, water absorption, infiltration rate, and abrasion resistance. Multi-slice computed tomography (MSCT) was used for an X-ray examination and quantitative analysis of the specimens (ROI; region of interest) and 3D visualization (VRT; volume rendering technique). With an X-ray examination, the large holes in the cross sections of the specimens have been observed. They were caused by an insufficient compaction effort during the specimens’ placement, which affected the test results. Based on the obtained laboratory results, the waste strips improved the compressive strength, flexural strength, and abrasion resistance of the concrete with the addition of fine fractions, and generally increases the ductility of pervious concrete.

1. Introduction

Pervious concrete is mainly composed of cement, water, and coarse aggregate. The basic characteristic of pervious concrete is permeability, with a high porosity between 15% and 35%, which is achieved by the fact that there is little or no fine aggregate in the composition of the concrete [1,2,3,4,5,6]. Due to its high porosity, pervious concrete can develop compressive strength in the range of 3.5 to 28 MPa [7] and flexural strength in the range of 1 to 3.5 MPa [6]. Zhong and Wille [8] have shown on pervious concrete with an ultra-high-performance matrix that compressive strength exceeding 50 MPa can be achieved without reducing hydraulic conductivity.
Pervious concrete, also known as porous, no-fine, gap-graded, permeable, draincrete, was first used in 1852 in the United Kingdom [9]. Today, it is widely used, especially in the United States, Europe, and Japan, due to the increased awareness of environmental protection [10]. Pervious concrete was traditionally used in greenhouses, tennis courts, driveways, parking lots, streets, zoo areas, road shoulders, and swimming pool decks [11,12]. It was used in China in the spongy city plan to alleviate overloaded drainage systems [13].
Researchers consider three key parameters that affect the quality of this concrete, namely the size of the aggregate, the amount of cement/binder, and the compaction method. Sonebi and Bassuoni [14] found that the increase in the amount of cement reduces the number of voids and the permeability of concrete. The origin and grain-size distribution of aggregate affected the properties of pervious concrete. Usually, a single-sized coarse aggregate or grading between 9.5 and 19 mm is used. Yang et al. [1] investigated the influence of the 4.75 mm sieve-passing percentage on pervious concrete compressive strength and concluded it increases with the increased sieve-passing percentage. The percentage of passages on the sieve varied from 2.55 to 20% and the highest compressive strength was obtained for the passage of 20%. According to Croush et al. [15], the compaction method has a significant impact on strength and permeability. In study [16], the authors recommended using impact methods for compaction
Some authors used construction and demolition waste and post-consumer urban waste in pervious concretes [17,18,19]. Zaetan et al. [17] investigated the properties of pervious concrete containing recycled concrete-block aggregate and recycled concrete aggregate and found that the replacement of natural aggregate with both recycled aggregates increased compressive strengths and abrasion resistance. Lu et al. [18] studied an eco-friendly pervious concrete product using a waste glass cullet and recycled concrete aggregate. As a replacement for fine aggregates, the authors used crushed waste glass from post-consumer beverage bottles and, as a replacement for natural coarse granite aggregate, they used recycled concrete aggregate. Even though it was found that using crushed waste glass reduced the compressive strength, high permeability, and thermal insulating properties, this eco-friendly pervious concrete with post-consumer waste seems to be promising for use on building construction. Gesoğlu et al. [19] found that the replacement of natural aggregate with rubber particles resulted in an increase of the toughness and ductility of concrete, and suggested that this kind of pervious concrete can be used in constructing parking areas, walkways, and road shoulders.
Synthetic, glass, carbon, and even cellulose fibers can be used to improve the properties of pervious concrete [20,21,22]. Although steel fibers are used to reinforce standard concrete, they are not used in pervious concrete due to the risk of corrosion. Kevern et al. [22] found that the addition of macro synthetic fibers reduces the permeability of the pervious concrete. Liu et al. [23] reinforced pervious concrete with basalt fibers and found that they can increase the flexural strength and toughness of pervious concrete. In study [20], the authors used four different types of fibers, namely glass, polypropylene, hemp, and carbon fibers, and concluded that the addition of fibers generally improved the mechanical properties of concrete but negatively affected porosity and permeability.
Textile production has a noticeable impact on the environment because clothes production requires significant amounts of chemicals, water, and energy. Fast-fashion brands do not design their clothes to last, and with affordable prices, they encourage consumers to always get the latest clothes. As much as 85% of clothes, after being worn a few times, end up in landfills or incinerators. For some materials, it can take 200+ years to decompose in a landfill [24]. Europeans recycle only 25% of discarded textile waste [25]. Textile recycling has environmental benefits, such as the reduced consumption of energy and water, avoided pollution and decreased landfill space requirements, and the reduced use of virgin fibers and the usage of dyes [26]. Textile recycling can be categorized as pre-production or post-consumption material. Pre-production includes textiles, fibers, yarns, and the production process residues, while post-consumption includes discarded materials, such as clothing, shoes, and furniture [27]. The use of textile waste materials in building materials has great potential either as thermal insulation or as a reinforcement of composites.
Knowing that it takes 7000 liters of water just to grow the cotton for one cotton T-shirt and about 2.6 kg of CO₂ to produce it, and with the fact that the average number of wears a T-shirt has before being thrown away is falling [28], the idea is to use old cotton T-shirts as reinforcement. Worldwide, over 10 billion tons of concrete is being produced each year, and with only a 1% replacement of the volume of concrete with textiles, 6.25 million tons of textile waste would be disposed of.
Anglade et al. [29] found that concrete blocks with polyester textile waste were superior thermal insulators. Tran et al. [30] have investigated concrete reinforced with nylon or polypropylene carpet fibers. Adding textile waste fibers to concrete usually improves its flexural strength, while the workability, compressive strength, and modulus of elasticity decrease [31,32,33,34,35]. Bartulović et al. [36] investigated the possibility of using small pieces of cotton knitted-fabric waste in concrete and concluded that the inclusion of waste cloth increases the tensile properties and ductility of concrete. In study [37], the authors studied the mechanical and durability properties of short textile waste fiber-reinforced cement pastes and found that composites provided a better mechanical performance in respect to reference specimens after accelerated ageing conditions. Selvaraj [38] cut waste cloths into small-sized pieces (approximately 20 mm × 20 mm) and dosed them in concrete in various percentages. The addition of these waste cloths in concrete increased the energy absorption and enhanced the flexural and tensile properties of concrete.
This study was conducted to investigate the possibility of using waste cotton as a reinforcement of pervious concrete and the influence of textile strips on the properties of pervious concretes with different aggregate gradations and maximum grain sizes.

2. Materials and Methods

2.1. Materials and Preparation of Specimens

In this study, eight mixtures of pervious concrete were prepared. The CEM I 42.5 R cement was used as binder in the amount of 350 kg per m3 for all mixtures. Three fractions (0/4 mm, 4/8 mm, 8/16 mm) of the crushed limestone aggregate were used for pervious concrete production. Four mix ratios were made by considering various aggregate sizes: 100% aggregate 4–8 mm (M1, M1-V); 100% aggregate 8–16 mm (M2, M2-V); 90% aggregate 4–8 mm + 10% aggregate 0–4 mm (M3, M3-V); and 90% aggregate 8-16 mm + 10% aggregate 0–4 mm (M4, M4-V). Cumulative sieving curves of aggregates in pervious concrete mixtures are shown in Figure 1. For all mixtures, the water/cement ratio was 0.35 and the amount of water in the concrete was checked by forming a stable ball in the hand without the appearance of crumbling [7] (Figure 2a). Chemical additives were not added to the mixtures.
Textile strips were obtained from waste cotton T-shirts, which were manually cut into strips of approximately equal length. The strips were cut to the same length of 5 ± 1 cm (Figure 2b). The strips were first immersed in water to remove impurities and to saturate them with water. They are well-drained before use to obtain a saturated surface dry state. Textile strips were added to 4 mixtures that contain the letter V in their designation.
The composition of concrete mixtures is given in Table 1.
All components were weighed and added to the laboratory pan mixer: aggregate; cement; and for –V mixtures, textile strips. They were mixed for 1 min, and another 5 min with the addition of water. The measured consistency of fresh concrete according to HRN EN 12350-2 [39] was 0 cm. The concrete specimens were poured into 15 cm cubes, 12 cm × 12 cm × 45 cm prisms and 60 cm × 60 cm × 6 cm slabs. The specimens were cast into the cube and prism molds in 2 equal layers, each layer was compacted by 15 strokes with a tamping rod and 10 strokes with a wooden tamper (Figure 2c). During installation in slabs, pervious concrete was compacted in the same way but only in one layer. The compaction of the slab was executed in segments so that the slab was virtually divided into 12 fields in which each part was compacted by 15 strokes with a tamping rod and 10 strokes with a wooden tamper. The specimens were extracted from the molds 24 h after casting and cubes and prism were placed in water at 20 ± 5 °C, while the slabs were put in a wet chamber and watered every day until the test day.

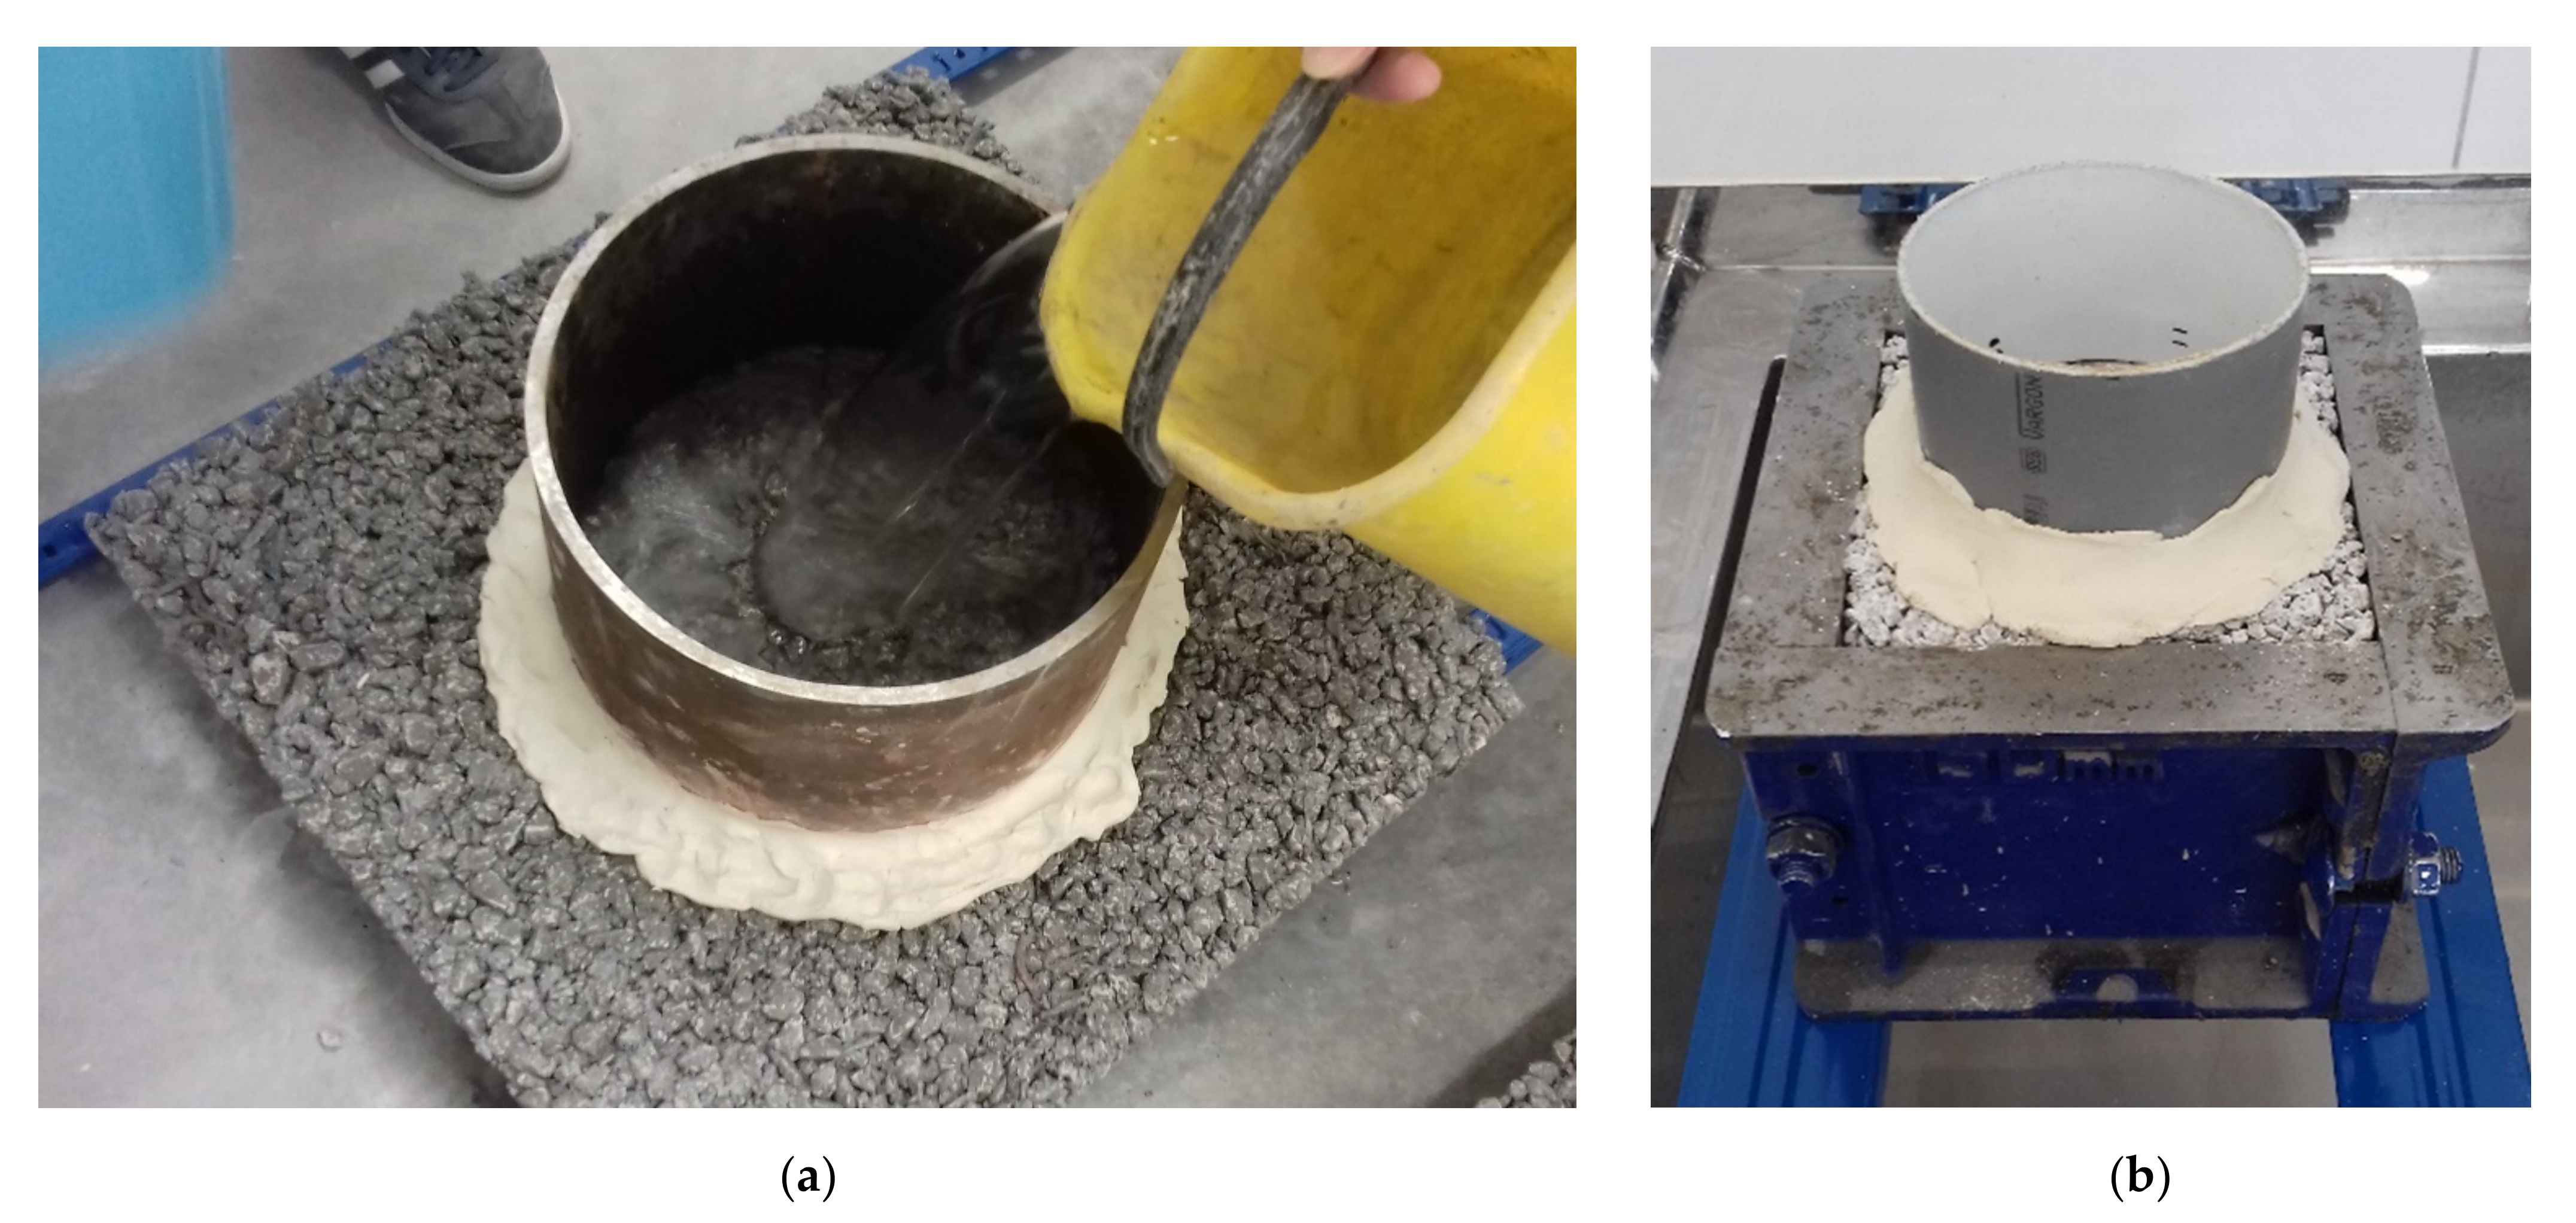
2.2. Testing of Hardened Pervious Concrete Specimens

The density of pervious concrete was tested on the series of three 28-days-old cubes for each mixture, before compressive strength determination. Compressive strength was determined in accordance with HRN EN 12390-3 [40], with a constant loading rate of 0.50 MPa/s. Flexural strength was tested on prismatic-shaped specimens in accordance with EN 12390-5 [41]. Porosity, water absorption, infiltration rate, and X-ray examination were tested on the same cube specimens of 15 cm edge length. Porosity (P) was calculated using the expression:
P = 1 M 1 M 2 V ρ w · 100   %
where M1 (kg) is oven-dried specimen weight, M2 (kg) is specimen submerged underwater weight, V (m3) is the volume of the specimen, and ρw (kg/m3) is the density of water at room temperature. Water absorption (A) was determined by the expression:
A = M 2 M 1 M 1 · 100   %
where M1 (g) is oven-dried specimen weight and M2 (g) is wet weight after the specimens were immersed in water for 24 h and then surface dried.
The tests of the infiltration rate in accordance with ASTM C 1701 Standard [42], which is the standard test procedure for determining the infiltration rate of a pervious concrete, were made on slabs and cubes (Figure 3). The aim of these tests is not only to examine the permeability but also to establish a relationship between the results on the cubes and on the slabs. Sonebi et al. [6] pointed out the need for more studies aimed at correlating the results obtained from laboratory and field data in respect to compaction, porosity, durability, and permeability. With the assumption that the measurement on cubes corresponds to laboratory conditions and the measurement on slabs corresponds to field conditions, the resulting relationship will allow engineers to predict more easily the field hydraulic behavior of pervious concrete as well as its behavior under different precipitation regimes.
The permeameter for the testing on the slabs was a steel ring with a diameter of 30.48 cm (12 in) and for the cubs, it was a plastic ring with a diameter of 10.5 cm. The rings to the surface were secured with sealant (Figure 3). For the test on cubes, the specimens were wrapped on four sides with metal mold to block the water flowing out of the specimens (Figure 3b). All specimens were placed on two metal supports. According to ASTM C 1701, a prewetting test should be made, followed by an actual test within 2 min of prewetting. In the prewetting and actual test process, the total time of required amounts of water passing through the specimen was measured, wherein the water was kept at a height of 1–1.5 cm inside the ring. Slabs were prewetted using 3.6 L of water measuring time for water to infiltrate through the specimen. A quantity of 18 L of water was used for the actual test on the seven slabs and 3.6 L on one slab, because its prewetting stage took more than 30 s (more precisely, 2.46 min). The cubes were prewetted and tested using 1.2 L of water, according to study [43].
The infiltration rate (I) was determined according to the expression:
I = K · M   D 2 · t     ( mm / h )
where M (kg) is mass of infiltrated water, D (mm) is inner diameter of permeameter, t (s) is time required for a measured amount of water to infiltrate the specimen and K (mm3·s/kg/h) is constant of 4,583,666,000 [44,45].
Abrasion resistance was determined by the Böhme abrasion test according to HRN 1128—annex M [46] (Figure 4). The specimens were placed on the Böhme disc and subjected to an abrasive load of 294 N for 16 cycles, each consisting of 22 revolutions [47]. Abrasion resistance was determined by the loss of volume of the specimen (ΔV) in cm3 in an area of 50 cm2, according to the expression:
Δ V = Δ m ρ
where Δm (g) is the mass loss after 16 cycles, and ρ (g/mm3) is the specimen density.
The medical device MSCT (multi-slice computed tomography), Siemens Sensation 64, Siemens Healthcare, Erlangen, Germany was used for X-ray examination. The following parameters were used to examine concrete samples: kVp 140, mAs 420, layer thickness 4 mm, slice increment 3.7, reconstruction kernel D45 medium sharp. On MSCT axial layers, a rectangular shape of ROI (region of interest) was used to obtain quantitative data. MSCT devices quantify the attenuation of radiation passing through the material using the Hounsfield scale (−1071 to 3071), where water is 0 expressed in Hounsfield units (HU). For post-processing and analysis of the obtained data, the medical software Osirix MD v. 11.0.2, Pixmeo Sarl, Geneva area, Switzerland, was used. For each sample and each layer, the size of the ROI was determined to be slightly smaller than the sample so that the surrounding air would not enter the analysis. The obtained values for each individual layer within the ROI (minimum, maximum, mean, SD, median, and area) were exported to Excel for statistical processing.
The obtained values for each layer were used to obtain statistical results of attenuation of the sample volume according to the example for mean according to the formula:
M V = M s 1 + M s 2 + + M s N N
where MV is mean volume, MS1 is mean slice 1, and N is the number of total slices.
For 3D visualization of concrete samples, the VRT (volume rendering technique) transparent display technique (light blue—more air, dark blue—more concrete) was used.

3. Results and Discussion

The results obtained by the laboratory tests are shown in Table 2.
Table 2 shows the average values and standard deviation of the measured results. Since the infiltration rate on cubes, water absorption, porosity, and CT scanning were determined on the same specimens, only the measured values were given in Table 2 to establish a connection between the measured values. The characteristics of the pervious concrete that were investigated by analyzing the results of CT scanning and 3D reconstruction are shown in Table 3 and Figure 5 and Figure 6.
The possibilities of using pervious concrete mixtures are for a concrete pavement, the parking areas for passenger cars with small axle loads, concrete curb units, concrete paving flags, and concrete paving blocks. According to Guide for the Design and Construction of Concrete Parking Lots, ACI 330-08 by the American Concrete Association (ACI) [48], HR EN 1338 [49], HR EN 1339 [50], and HR EN 1340 [51]—for Class 1—the target flexural strength is 3.5 MPa. According to Table 2, only the mixture M1 met this condition.
Figure 7, Figure 8 and Figure 9 show the ratio of the properties of pervious concrete with the addition of a fine aggregate, textile strips, or both and the single-sized concrete, M1 and M2, respectively, in order to examine the impact of these additives on the properties of pervious concrete.
According to Table 2, all mixtures have significantly lower compressive strength than mixture M1, even mixture M1-V, which has almost the same composition as referent single-size concrete except the addition of waste cloth strips. Since all eight mixtures have the same amount of cement and water, the cause may be in the particle size distribution of the aggregate and/or the compaction effort during placement. Mixtures M1-V, M3, and M3-V have 35–43% lower compressive strength compared to M1 (Figure 7). According to the results from Figure 1 and Figure 7, and the conclusion in study [1], it seems that the higher the percentage of the sieve passage of 4 mm (higher than 20%), the more the compressive strength of the concrete begins to decrease. Additionally, with the increase of the maximum aggregate size, the compressive strength decreases, and the lowest value was achieved by the mixture M4, with only 43% of M1’s compressive strength. Since all mixtures have an equal consistency and water–cement ratio, in part to some previous cracking of the paste around larger pieces of aggregate, larger aggregates exhibit lower concrete strengths. M2 and M4-V have almost identical compressive strength. Similar results were obtained for flexural strength. Figure 7 shows that the addition of a fine aggregate, textile strips, or both, reduces the compressive and flexural strength of pervious concrete. Mixtures M3 and M3-V have a slightly higher value compared to the others (Table 2) and have almost reached the required Class 1 condition but are still about 25% lower than M1’s flexural strength. The porosity values range from 28.9 to 36.1% (Table 2), which is more than the usual 15 to 25% [7]. All mixtures have a higher porosity than mixture M1, especially the mixtures with larger maximum grain size. Mixtures M1-V, M3, and M3-V have a higher porosity than M1, which may have caused lower compressive and flexural strength compared to the reference mixture.
According to Table 2, the higher the compressive strengths, the better the abrasion resistance of the pervious concrete specimens (Figure 10a). Sherwani et al. came to the same conclusion in study [52] that by increasing the compressive strength of pervious concrete, higher abrasion resistance can be achieved. As in study [52], as the size of aggregates increases, the loss of volume increases. According to abrasion resistance classes in EN 1339, only mixture M1 can be classified as Class 2, and the other mixtures have much higher volume losses/50 cm2. Additions to concrete with a lower maximum grain size have a stronger influence on abrasion resistance than concrete with larger maximum grain size. According to Table 2, EN 1338, EN 1339, and EN 1340, for water absorption results, mixtures M1, M1-V, M3, M3-V, and M4-V can be classified as Class 1, while M2, M2-V, and M4 can be classified as Class 2. Pervious concretes with lower water absorption have better resistance to freezing and thawing, which increases the durability of concrete and helps with achieving a possible longer service life during application. The density values range from 1709.9 to 1834.2 kg/m3 and mixture M1 has the highest value (Table 2). As can be seen in Table 2, Figure 7, Figure 8 and Figure 10b, concrete of higher porosity has a lower density, which coincides with the conclusions in studies [2,53,54,55].
Table 2 and Figure 9 show that the M1 has the lowest permeability, measured by both methods: infiltration rate on test slabs and infiltration rate on the cube specimens. Mixtures with larger grains have significantly higher permeability. According to study [56], the specimens with small particles produce meandering paths for water permeation, and specimens consisting of large grains produce straight paths, which affect the infiltration rate of the water flowing out of the specimens. The typical permeability of pervious concrete is in the interval 1.4–12.2 mm/s [13,57], while Gesoğlu et al. [19] obtained permeability coefficients between 0.25 and 6.1 mm/s, which the authors said fell in the recommended limits for pervious concretes. Only the infiltration rate measured on the test slab of mixture M1 is significantly below that range of 1.4–12.2 mm/s but slightly below the value according to study [19]. Values obtained on other mixtures are either in this range or higher.
Based on the results from Table 2, it is possible to establish a linear relationship between the infiltration rate on test slabs and the infiltration rate on cube specimens (Figure 11). Although Figure 11 shows a very strong positive linear relationship between the results, Table 2 shows that the measurements on the cube in relation to measurements on the slab can be not only lower, but almost the same, or higher. The obtained results confirm the conclusion of the authors Lederle et al. in reference [45], in which the authors showed that there is a high specimen to specimen variation within the same mixture of concrete despite very similar values of global porosity. The established relationship from Figure 11 should be verified with the specimens installed in the field.
Table 3 and Figure 5 and Figure 6 show the obtained values on MSCT for the same concrete cubes on which the infiltration rate was tested. As mentioned earlier, MSCT devices quantify the attenuation of radiation passing through the material using the Hounsfield scale within each rectangular shape. According to reference [58], the HU range can be selected from −960 to 800 for pores, from 800 to 2000 for cement paste, and from 2000 to 2974 for aggregates. For cellulosic materials such as cotton the values are ranging from −750 HU to −430 HU [59]. If these values are selected in the display settings to display the distribution of the cloth strips in the specimens, Figure 12 is obtained.
According to Figure 12, it can be seen that especially in the specimens with larger grain sizes, the displays of cloth strips and pores overlap. Therefore, Figure 13 shows the cross-sectional appearance of the textile after the flexural strength test.
The variability of the local volume fraction of the constituents is visible by the value of the minimum and maximum value and the standard deviation (Table 3). If the difference between the maximum and minimum values is higher, it can be assumed that the observed material has lower homogeneity. Likewise, a larger difference between mean and median values indicates greater inhomogeneity of the specimens. For example, a standard cement mortar was recorded on the same MSCT device and the difference between the mean value and the median was around 40 HU, while on the pervious concrete specimens this difference is up to nine times higher. The standard deviation of the data indicates the spread of scores from the mean values. The main characteristic of pervious concrete is that it contains voids that allow water to percolate through to the specimen, so it is to be expected that there is a correlation between porosity, permeability, and standard deviation. Figure 14 shows a strong positive linear relationship between the standard deviation and porosity and both infiltration rate measuring methods.
Looking at Figure 5 and Figure 6, it can be seen that there are large holes in the cross sections of the samples that are caused by an insufficient compaction effort during the specimens’ placement. A similar conclusion was reached in studies [4,60], where the authors observed that rod holes in specimens do not get completely filled in when the rod is removed. The specimens were cast into the cube in two equal layers, while slabs were compacted in one layer. Each layer of the cube was compacted by 15 strokes with a tamping rod and 10 strokes with a wooden tamper, used from the set for the flow table test of the fresh concrete. The strokes were of an intensity equal to those for the testing slump of the fresh concrete. As mentioned before, the compaction of the slab was executed in segments, so each segment was compacted by 15 strokes with a tamping rod and 10 strokes with a wooden tamper. Since the middle of the slab is significantly away from the edges of the mold, it is certainly better compacted compared to the cube. Furthermore, the thickness of the slab is less than the thickness of one layer in the cube. This is probably the reason why the results of the infiltration rate on the M1 slab are lower compared to the results obtained on the cube. The wooden tamper is made from a soft material and it is not suitable for the compaction of zero-slump concrete.
The effect of the addition of a fine fraction on the properties of pervious concrete was evaluated by the ratio of the properties of the pervious concrete mixtures containing 10% fine fraction and the reference single-size pervious concrete mixtures (Figure 15, Figure 16 and Figure 17). The following ratios of properties were considered in this way: M1/M3, M1-V/M3-V, M2/M4, and M2-V/M4-V. As can be seen in Figure 15, contrary to the expectations and research in study [7], the addition of the fine fraction did not increase compressive strength. The exception to this is M4-V. The flexural strength is increased in reinforced mixtures and the porosity is increased in mixtures with a lower maximum aggregate grain. In reference [1], it was observed that porosity decreases with increasing fine aggregate content, which only applies to specimens with a larger maximum grain size in this study. In standard concrete, fine and coarse aggregate should be graded in such a way as to reduce the voids inside the concrete, while in pervious concrete the voids are desirable. According to the principle of geometric similarity in one fraction of aggregate grain size, equality in the content of cavities is valid. By mixing the aggregate fractions, the specific aggregate volume increases. If there is a gap between the fractions, the higher specific aggregate volume can be achieved, increasing the gap between the nominal sizes of the smallest and the largest fraction [61,62]. The obtained results are probably influenced by the large number of undersized grains in the 4-8 mm fraction and insufficient compaction effort during placement. Moreover, consideration should be given to reducing the fine fraction maximum grain size to 2 mm.
The addition of a fine fraction generally reduces abrasion resistance, increases water absorption, has not significantly affected density (Figure 16), and has had a larger impact on concretes with lower maximum grain size. As can be seen in Figure 10a, the abrasion resistance of concrete increases as the compressive strength is increased. It is also known that abrasion resistance is increased as the percentage of sand is reduced [63], which is in line with the results obtained. An excessive amount of the particle size of 0.125 mm is harmful to abrasion resistance, so it is recommended that this amount does not exceed 5% by the weight of cement for concrete with high resistance to abrasion [61]. The content of particles of less than 0.125 mm in size was higher (Figure 1); as such, reducing the content of these particles would ensure better results.
According to Figure 17, the influence of the fine fraction mainly increases the permeability measured on the slabs and the decreases measured on the cubes. Bonicelli et al. [64] found that too much sand and improper compaction energy may reduce the drainage features of pervious concrete, which is in accordance with the above-mentioned undersized grains and the method of installation.
The effect of the incorporation of waste cloth strips on the properties of pervious concrete was evaluated by the ratio of the properties of the pervious concrete mixtures containing strips and reference to pervious concrete mixtures without strips (Figure 18, Figure 19 and Figure 20). The following ratios of properties were considered as mixture/mixture-V.
Figure 18 and Figure 19 show that textile strips improved the compressive strength, flexural strength, and abrasion resistance of concrete with the addition of a fine fraction. It is possible that textile reinforcements can delay the formation and growth of cracks at the interface of the cement matrix and aggregate and thus increase strength. Textile strips do not adversely affect porosity, water absorption, and density. According to Figure 20, the influence of textile strips mainly increases the permeability measured on the slabs and decreases the a infiltration rate on the cubes with the addition of a fine fraction.
The main reason for adding textile strips is for the purpose of reinforcing pervious concrete. Based on the values measured during the testing of prisms, σ–δ ratios are shown in Figure 21.
The reference specimens M2, M3, and M4 break immediately after exceeding the flexural strength during testing, and thus, the σ–δ curves are terser then reinforced mixtures M2-V, M3-V, and M4-V. The inclusion of waste strips increases the ductility of pervious concrete due to the reinforcing effect of textile strips. The M1-V mixture did not achieve good results compared to M1. In general, the M1-V mixture has only better porosity and permeability compared to M1.

4. Conclusions

This work was directed towards investigating the performance of waste cloth strips-reinforced pervious concrete by determining the density, porosity, compressive and flexural strength, water absorption, infiltration rate, and abrasion resistance. “Fast fashion” is mass-produced cheap clothing that encourages a “throw-away” culture. The clothing is worn only a few times before it ends up in landfill or incineration. This paper examines the possibility of recycling these types of waste, so the cotton T-shirts were manually cut into strips of the length of 5 ± 1 cm and added to pervious concrete in an amount of 1% by volume. A total of eight mixtures were made: four with reinforcement and four without waste cloth strips reinforcement. Based on the tests carried out, the following conclusions can be drawn:
  • Only one mixture met the condition for a concrete pavement for the parking area of passenger cars with a small axle load, concrete curb units, concrete paving flags, and concrete paving blocks. By reducing the very high porosity of single-size pervious concrete with a maximum grain size of 8 mm, it is possible to increase permeability and further improve its properties;
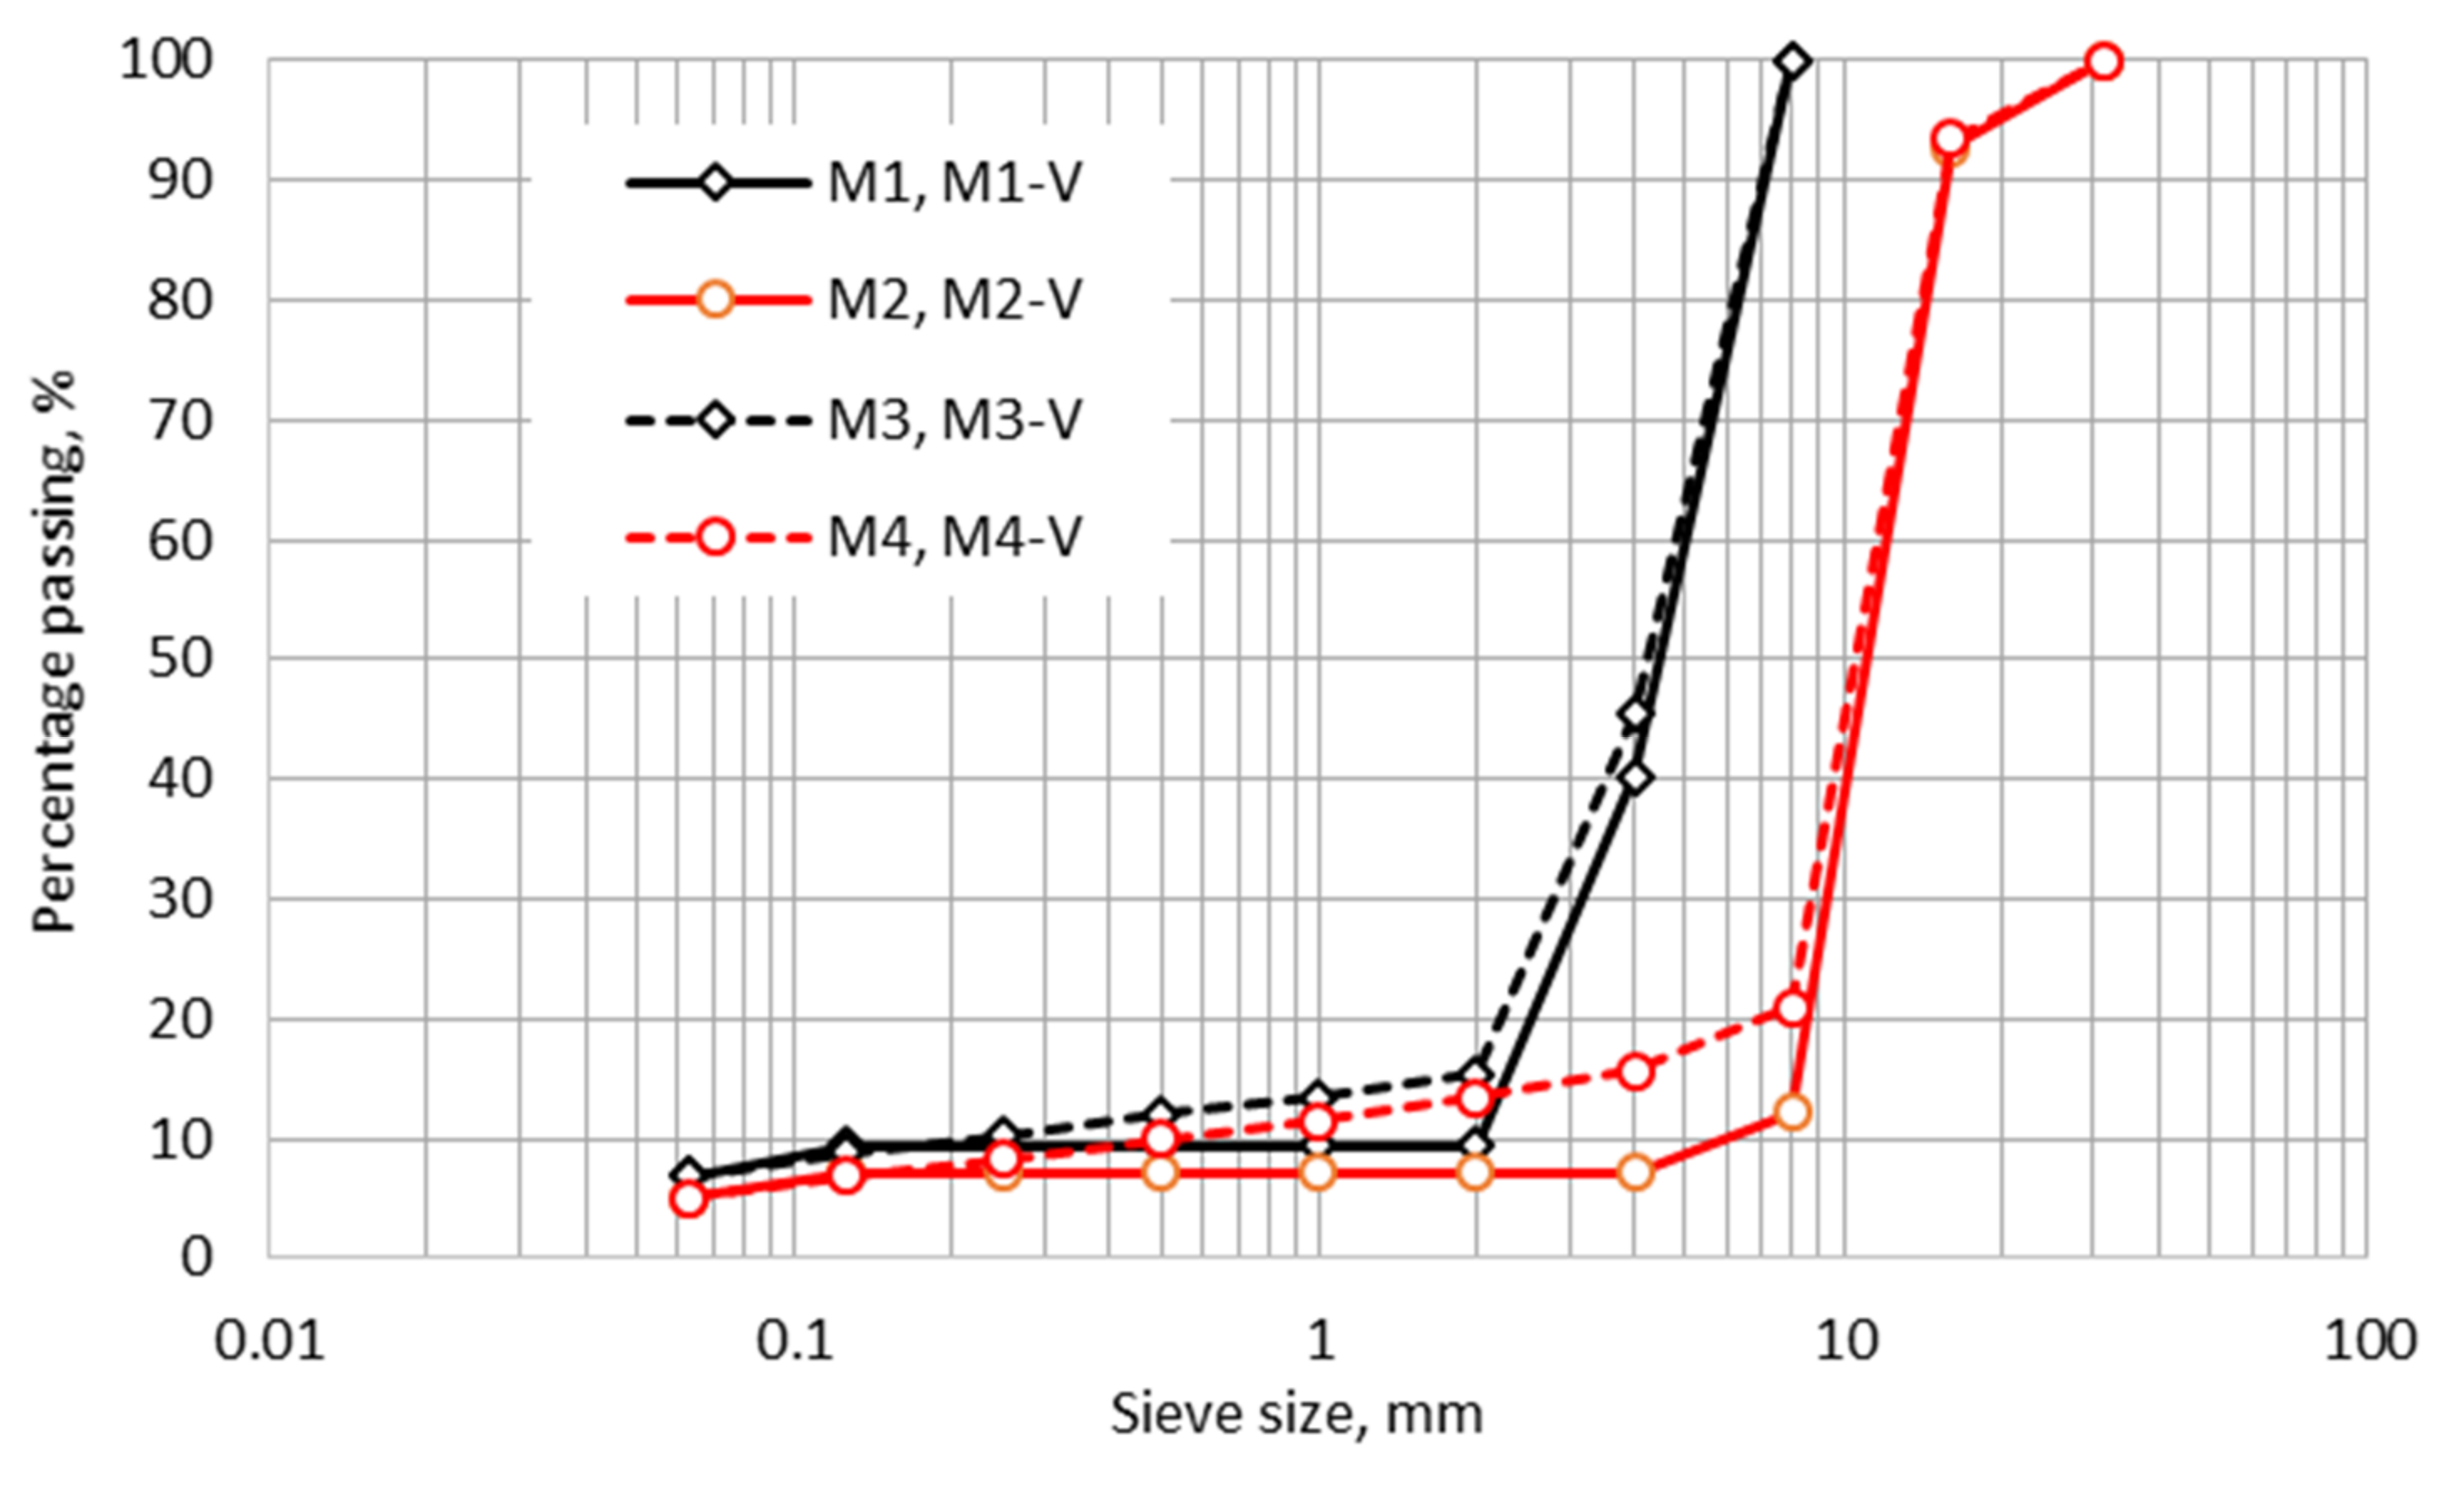
  • The granulometric composition of the aggregate, especially the percentage of passages on the 4 mm sieve significantly affects the properties of pervious concrete. Furthermore, the maximum grain size of the fine fraction should be reduced to 2 mm;
  • With the increase of the maximum aggregate grain size, compressive strength and abrasion resistance decrease while porosity and permeability increase;
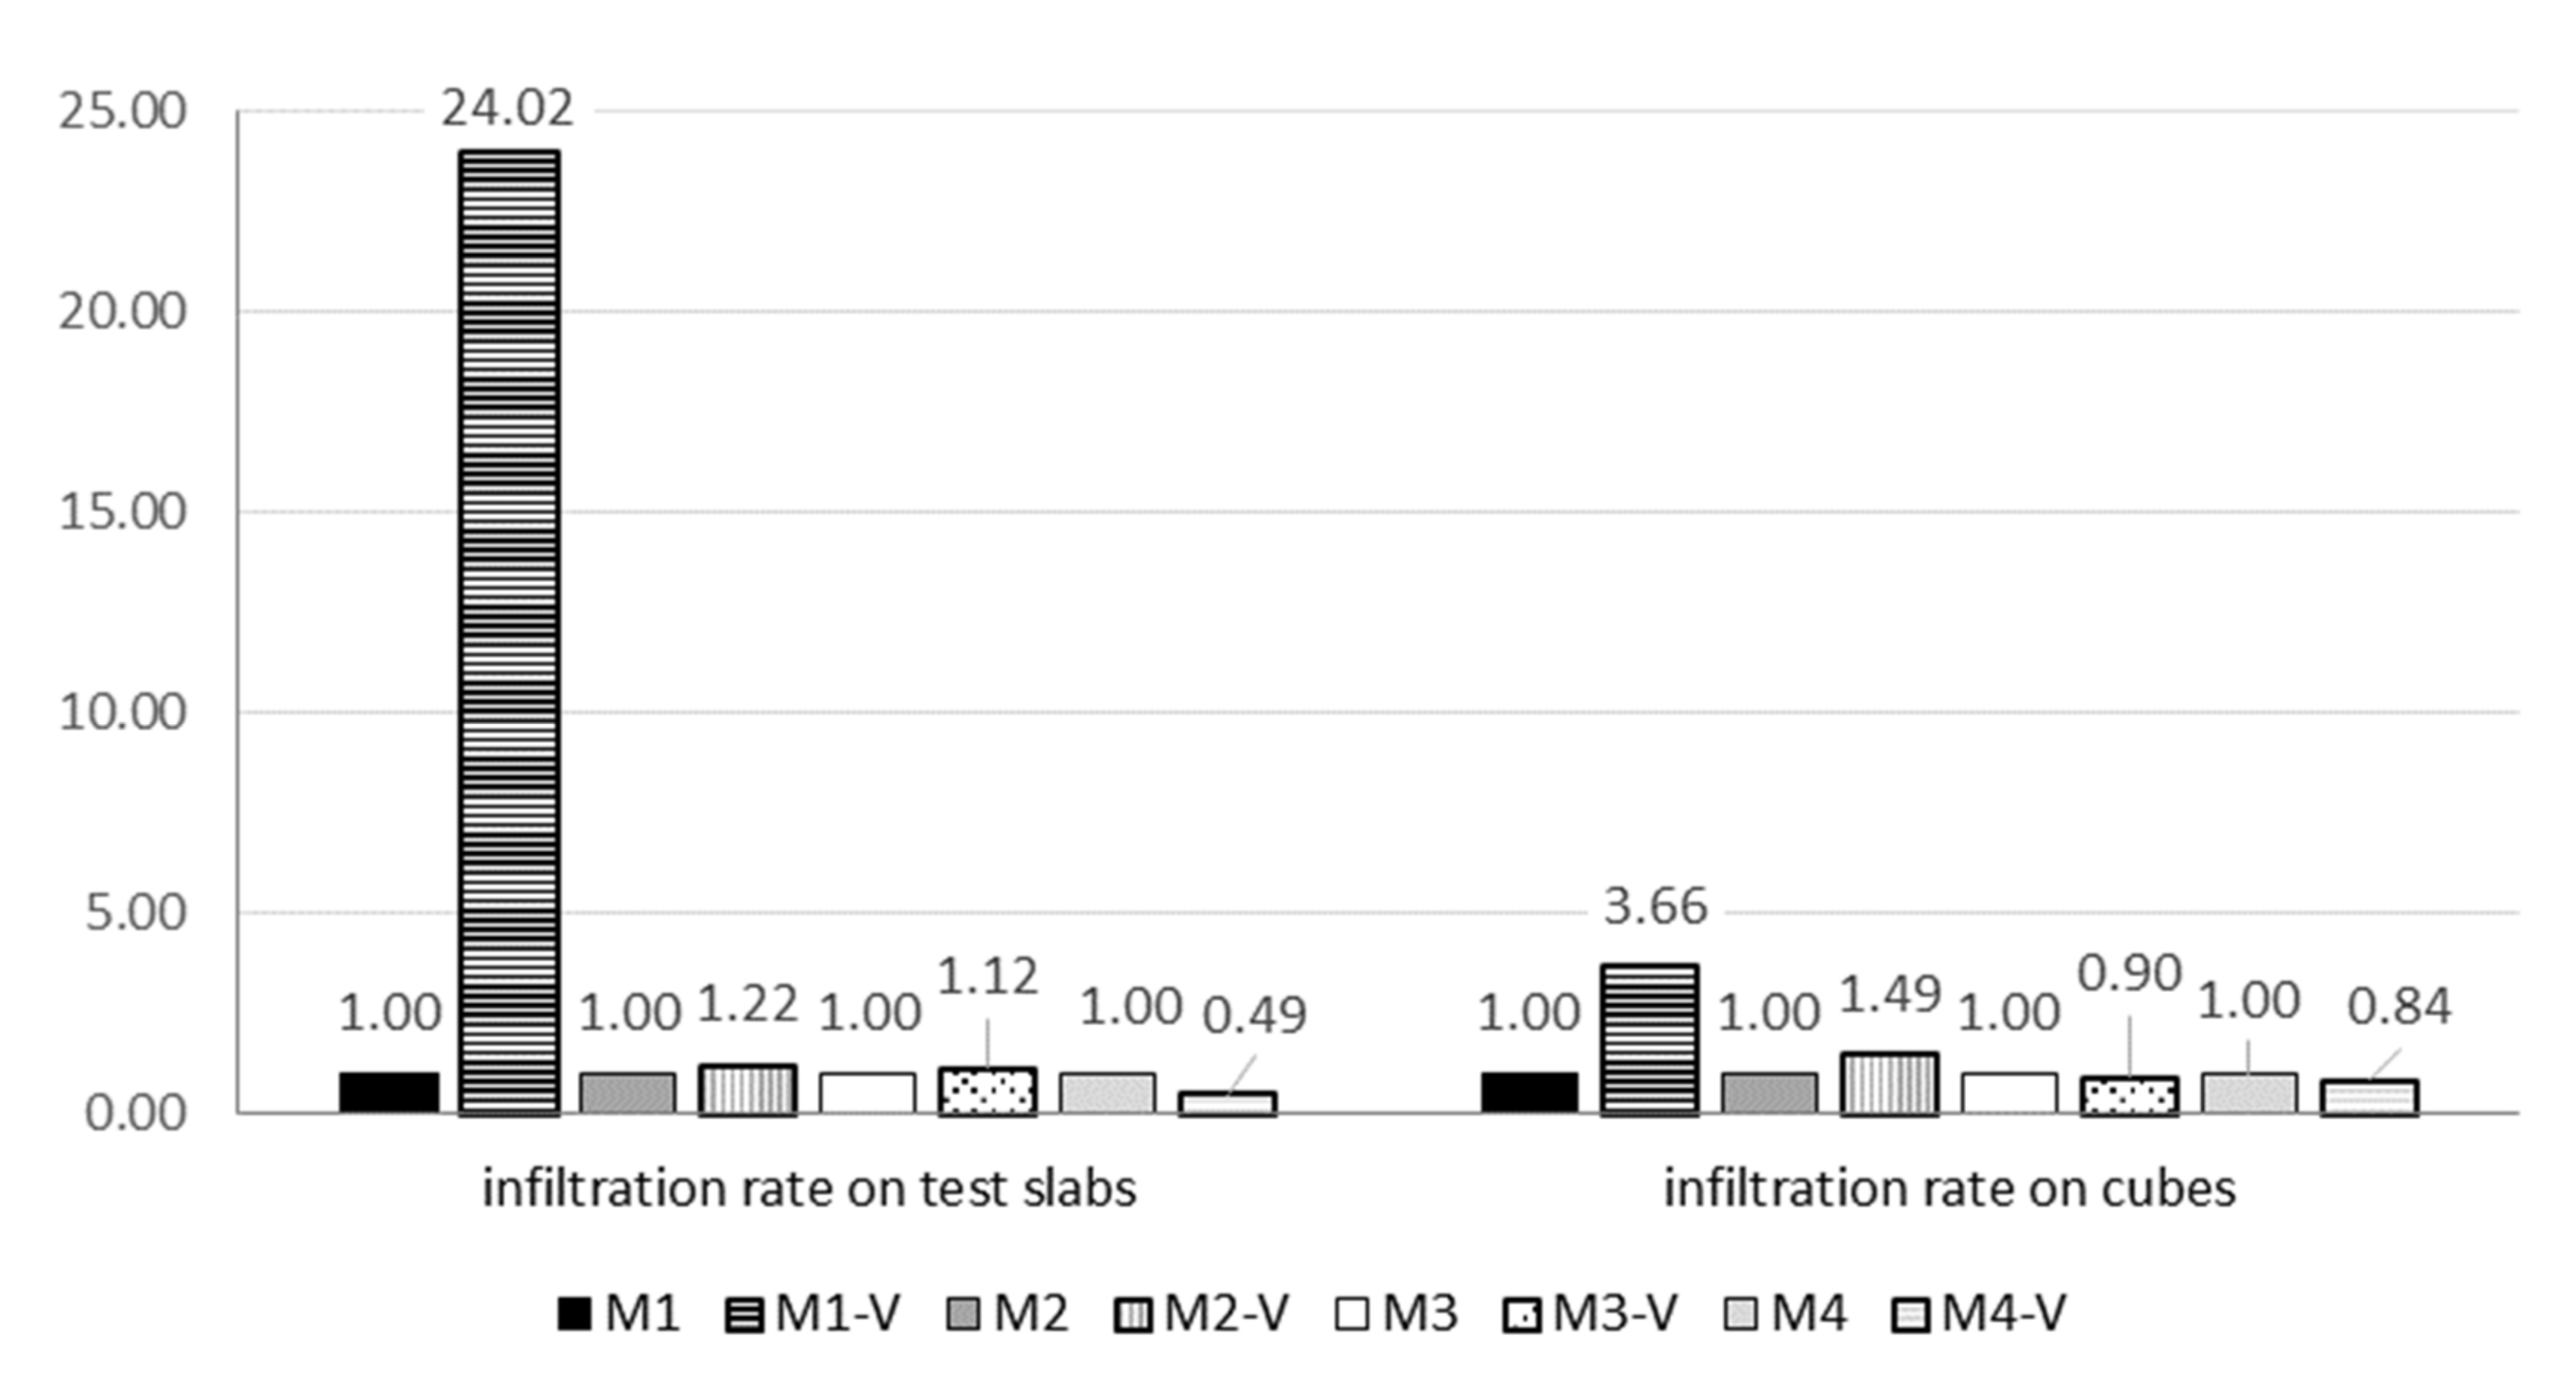
  • This paper presents a linear equation to correlate the infiltration rate on test slabs and the infiltration rate on cubes, in order to correctly predict the field hydraulic behavior of a pervious concrete mixture;
  • The relationship between the standard deviation of the MSCT results and porosity, and both infiltration rates measuring methods, are established;
  • An X-ray examination of the specimens showed large holes in the cross sections of specimens caused by an insufficient compaction effort during the specimens’ placement. The compaction of zero-slump concrete with a combination of rod and wooden tamper produced specimens that had a greater degree of variability in test results;
  • Waste strips improved the compressive strength, flexural strength, and abrasion resistance of pervious concrete with the addition of a fine fraction. In most specimens, the inclusion of waste strips increased the ductility of pervious concrete due to the reinforcement. The amount and form of the use of the waste cloth should be further elaborated.
Fibers are used as reinforcement to improve the properties of pervious concrete. The advantage of replacing artificial fibers with waste cloth strips is the reduction of the amount of landfilled or incinerated material, and less pollution and carbon emissions produced by manufacturers. Preparing strips by cutting waste cloth requires less energy than any other type of recycling, and textile recycling is safe to handle and does not generate any new hazardous waste. Additionally, further studies could focus on the influence of this reinforcement on other properties of pervious concrete, such as noise absorption or reducing pollutant concentrations.

Author Contributions

Conceptualization, S.J.; methodology, S.J., F.M. and N.O.-Š.; validation, S.J., F.M. and E.R.; formal analysis, S.J. and E.R.; investigation, S.J., F.M. and E.R.; resources, N.O.-Š., S.J. and F.M.; data curation, S.J. and F.M.; writing—original draft preparation, S.J.; writing—review and editing, F.M. and E.R.; visualization, S.J.; supervision, S.J. and F.M.; project administration, N.O.-Š.; funding acquisition, N.O.-Š. and S.J. All authors have read and agreed to the published version of the manuscript.

Funding

This research received no external funding.

Institutional Review Board Statement

Not applicable.

Informed Consent Statement

Not applicable.

Data Availability Statement

The data presented in this study are available from the corresponding author upon request.

Acknowledgments

This research is partially supported through project KK.01.1.1.02.0027, a project co-financed by the Croatian Government and the European Union through the European Regional Development Fund—the Competitiveness and Cohesion Operational Programme.

Conflicts of Interest

The authors declare no conflict of interest.

References

  1. Yang, Z.; Ma, W.; Shen, W.; Zhou, M. The aggregate gradation for the porous concrete pervious road base material. J. Wuhan Univ. Technol.-Mat. Sci. Edit. 2008, 23, 391–394. [Google Scholar] [CrossRef]
  2. Juradin, S.; Ostojić-Škomrlj, N.; Brnas, I.; Prolić, M. Influence of binder, aggregate and compaction techniques on the properties of single-sized pervious concrete. Adv. Concr. Constr. 2020, 10, 211–220. [Google Scholar] [CrossRef]
  3. Shu, X.; Huang, B.; Wu, H.; Dong, Q.; Burdette, E.G. Performance comparison of laboratory and field produced pervious concrete mixtures. Constr. Build. Mater. 2011, 25, 3187–3192. [Google Scholar] [CrossRef]
  4. Putman, B.J.; Neptune, A.I. Comparison of test specimen preparation techniques for pervious concrete pavements. Constr. Build. Mater. 2011, 25, 3480–3485. [Google Scholar] [CrossRef]
  5. Schaefer, V.R.; Wang, K.; Suleiman, M.T.; Kevern, J. Mix Design Development for Pervious Concrete in Cold Climates; Technical Report; National Concrete Pavement Technology Center: Ames, IA, USA, 2006; Available online: https://www.perviouspavement.org/downloads/Iowa.pdf (accessed on 26 December 2021).
  6. Sonebi, M.; Bassuonib, M.; Yahiac, A. Pervious concrete: Mix design, properties and applications. RILEM Tech. Lett. 2016, 1, 109–115. [Google Scholar] [CrossRef]
  7. Tennis, P.D.; Leming, M.L.; Akers, D.J. Pervious Concrete Pavements; EB302.02; Portland Cement Association: Skokie, IL, USA; National Ready Mixed Concrete Association: Silver Spring, MD, USA, 2004. [Google Scholar]
  8. Zhong, R.; Wille, K. Material design and characterization of high-performance pervious concrete. Constr. Build. Mater. 2015, 98, 51–60. [Google Scholar] [CrossRef]
  9. Ghafoori, N.; Dutta, S. Building and non-pavement applications of no-fines concrete. J. Mater. Civ. Eng. 1995, 7, 286–289. [Google Scholar] [CrossRef]
  10. Bhutta, M.A.R.; Tsuruta, K.; Mirza, J. Evaluation of high-performance pervious concrete properties. Constr. Build. Mater. 2012, 31, 67–73. [Google Scholar] [CrossRef]
  11. Lian, C.; Zhuge, Y. Optimum mix design of enhanced permeable concrete—An experimental investigation. Constr. Build. Mater. 2010, 24, 2664–2671. [Google Scholar] [CrossRef]
  12. Geethanjali, S.; Manonmani, B.; Sowmya, P.; Suvetha, T.; Balakumar, V. Experimental study of Pervious (No Fine) Concrete. Int. J. Sci. Eng. Res. 2020, 11, 83–86. Available online: https://www.ijser.org/researchpaper/Experimental-study-of-Pervious-No-Fine-Concrete.pdf (accessed on 26 December 2021).
  13. AlShareedah, O.; Nassiri, S. Pervious Concrete Mixture Optimization, Physical, and Mechanical Properties and Pavement Design: A Review. J. Clean. Prod. 2021, 288, 125095. [Google Scholar] [CrossRef]
  14. Sonebi, M.; Bassuoni, M.T. Investigating the effect of mixture design parameters on pervious concrete by statistical modelling. Constr. Build. Mater. 2013, 38, 147–154. [Google Scholar] [CrossRef]
  15. Croush, L.K.; Pitt, J.; Hewitt, R. Aggregate effects on pervious portland cement concrete static modulus of elasticity. J. Mater. Civ. Eng. 2007, 19, 561–568. [Google Scholar] [CrossRef]
  16. Seeni, B.S.; Madasamy, M. A review of factors influencing performance of pervious concrete. Građevinar 2021, 73, 1007–1030. [Google Scholar] [CrossRef]
  17. Zaetang, Y.; Sata, V.; Wongsa, A.; Chindaprasirt, P. Properties of pervious concrete containing recycled concrete block aggregate and recycled concrete aggregate. Constr. Build. Mater. 2016, 111, 15–21. [Google Scholar] [CrossRef]
  18. Lu, J.; Yan, X.; He, P.; Sun, C. Sustainable design of pervious concrete using waste glass and recycled concrete aggregate. J. Clean. Prod. 2019, 234, 1102–1112. [Google Scholar] [CrossRef]
  19. Gesoğlu, M.; Güneyisi, E.; Khoshnaw, G.; İpek, S. Investigating properties of pervious concretes containing waste tire rubbers. Constr. Build. Mater. 2014, 63, 206–213. [Google Scholar] [CrossRef]
  20. Juradin, S.; Netinger-Grubeša, I.; Mrakovčić, S.; Jozić, D. Impact of fibre incorporation and compaction method on properties of pervious concrete. Mater. Constr. 2021, 71, e245. [Google Scholar] [CrossRef]
  21. Amde, A.M.; Rogge, S. Development of High Quality Pervious Concrete Specifications for Maryland Conditions; Final Report MD-13-SP009B4F; State Highway Administration (SHA) Maryland Department of Transportation: Baltimore, MD, USA, 2013. Available online: https://www.roads.maryland.gov/OPR_Research/MD-13-SP009B4F_Pervious-Concrete-Specifications_Report.pdf (accessed on 26 December 2021).
  22. Kevern, J.T.; Biddle, D.; Cao, Q. Effects of macrosynthetic fibers on pervious concrete properties. J. Mater. Civ. Eng. 2014, 27, 06014031. [Google Scholar] [CrossRef]
  23. Liu, R.; Chi, Y.; Jiang, Q.; Meng, X.; Wu, K.; Li, S. Physical and mechanical properties of pervious concrete with multi-admixtures. Mag. Concr. Res. 2021, 73, 448–463. [Google Scholar] [CrossRef]
  24. Brown, R. The Environmental Crisis Caused by Textile Waste. Available online: https://www.roadrunnerwm.com/blog/textile-waste-environmental-crisis (accessed on 25 December 2021).
  25. Ernantez, K.P.E.; Barrera, M.M.B.; Navacerrada, M.A. Textile Wastes: State of the Art. J. Textile Sci. Eng. 2017, 7, 1000322. Available online: https://www.hilarispublisher.com/open-access/textile-wastes-state-of-the-art-2165-8064-1000322.pdf (accessed on 25 December 2021).
  26. Hansen, P.; Grujoska, V.; Jovanoska, M. Textile as Material in Human Built Environment Interaction. In Rethinking Sustainability Towards a Regenerative Economy. Future City; Andreucci, M.B., Marvuglia, A., Baltov, M., Hansen, P., Eds.; Springer Nature: Cham, Switzerland, 2021; Volume 15, pp. 215–225. [Google Scholar] [CrossRef]
  27. Pichardo, P.P.; Martínez-Barrera, G.; Martínez-López, M.; Ureña-Núñez, F.; Ávila-Córdoba, L.I. Waste and Recycled Textiles as Reinforcements of Building Materials. In Natural and Artificial Fiber-Reinforced Composites as Renewable Sources; Guay, E., Ed.; 52249153; IntechOpen: London, UK, 2017; Available online: https://www.intechopen.com/chapters/56947 (accessed on 26 December 2021).
  28. Sumner, M. Following a T-Shirt from Cotton Field to Landfill Shows the True Cost of Fast Fashion. Available online: https://theconversation.com/following-a-t-shirt-from-cotton-field-to-landfill-shows-the-true-cost-of-fast-fashion-127363 (accessed on 26 December 2021).
  29. Anglade, J.; Benavente, E.; Rodrígue, J.; Hinostroza, A. Use of Textile Waste as an Addition in the elaboration of an Ecological Concrete Block. IOP Conf. Ser. Mater. Sci. Eng. 2021, 1054, 012005. Available online: https://iopscience.iop.org/article/10.1088/1757-899X/1054/1/012005 (accessed on 25 December 2021). [CrossRef]
  30. Tran, N.P.; Gunasekara, C.; Law, D.W.; Houshyar, S.; Setunge, S.; Cwirzen, A. Comprehensive review on sustainable fiber reinforced concrete incorporating recycled textile waste. J. Sustain. Cem. Mater. 2021, 11, 1–22. [Google Scholar] [CrossRef]
  31. Sadrolodabaee, P.; Claramunt, J.; Ardanuy, M.; de la Fuente, A. A Textile Waste Fiber-Reinforced Cement Composite: Comparison between Short Random Fiber and Textile Reinforcement. Materials 2021, 14, 3742. [Google Scholar] [CrossRef] [PubMed]
  32. Mohammadhosseini, H.; Tahir, M.M.; Sam, A.R.M.; Lim, N.H.A.S.; Samadi, M. Enhanced performance for aggressive environments of green concrete composites reinforced with waste carpet fibers and palm oil fuel ash. J. Clean. Prod. 2018, 185, 252–265. [Google Scholar] [CrossRef]
  33. Xuan, W.; Chen, X.; Yang, G.; Dai, F.; Chen, Y. Impact behavior and microstructure of cement mortar incorporating waste carpet fibers after exposure to high temperatures. J. Clean. Prod. 2018, 187, 222–236. [Google Scholar] [CrossRef]
  34. Mohammadhosseini, H.; Awal, A.S.M.A.; Yatim, J.B.M. The impact resistance and mechanical properties of concrete reinforced with waste polypropylene carpet fibres. Constr. Build. Mater. 2017, 143, 147–157. [Google Scholar] [CrossRef]
  35. Wang, Y.; Wu, H.C.; Li, V.C. Concrete reinforcement with recycled fibers. J. Mater. Civ. Eng. 2000, 12, 314–319. [Google Scholar] [CrossRef]
  36. Bartulović, B.; Juradin, S.; Žižić, D.; Mrakovčić, S. Possibility of Using Cotton Knitted Fabric Waste in Concrete. IOP Conf. Ser. Mater. Sci. Eng. 2021, 1203, 022074. Available online: https://iopscience.iop.org/article/10.1088/1757-899X/1203/2/022074 (accessed on 26 December 2021). [CrossRef]
  37. Sadrolodabaee, P.; Claramunt, J.; Ardanuy, M.; de la Fuente, A. Mechanical and durability characterization of a new textile waste micro-fiber reinforced cement composite for building applications. Case Stud. Constr. Mater. 2021, 14, e00492. [Google Scholar] [CrossRef]
  38. Selvaraj, R.; Priyanka, R. Study on Recycled Waste Cloth in Concrete. Int. J. Eng. Res. 2015, 4, 891–895. Available online: https://www.ijert.org/research/study-on-recycled-waste-cloth-in-concrete-IJERTV4IS090437.pdf (accessed on 26 December 2021). [CrossRef]
  39. Testing Fresh Concrete—Slump Test. In HRN EN 12350-2:2019; CSI: Zagreb, Croatia, 2019.
  40. Testing Hardened Concrete—Part 3: Compressive Strength of Test Specimens. In HRN EN 12390-3:2019; CSI: Zagreb, Croatia, 2019.
  41. Testing Hardened Concrete—Part 5: Flexural Strength of Test Specimens. In HRN EN 12390-5:2019; CSI: Zagreb, Croatia, 2019.
  42. Standard Test Method for Infiltration Rate of In-Place Pervious Concrete. In ASTM C1701/C1701M−09; ASTM: West Conshohocken, PA, USA, 2009.
  43. Hung, V.V.; Seo, S.-Y.; Kim, H.-W.; Lee, G.-C. Permeability and Strength of Pervious Concrete According to Aggregate Size and Blocking Material. Sustainability 2021, 13, 426. [Google Scholar] [CrossRef]
  44. Anderson, I.A.; Suozzo, M.; Dewoolkar, M.M. Laboratory and Field Evaluations of Pervious Concrete; College of Engineering and Mathematical Sciences: Burlington, VT, USA, 2013. [Google Scholar]
  45. Lederle, R.; Shepard, T.; Meza, V.D.L.V. Comparison of methods for measuring infiltration rate of pervious concrete. Constr. Build. Mater. 2020, 224, 118339. [Google Scholar] [CrossRef]
  46. Concrete—Guidelines for the Implementation of HRN EN 206-1. In HRN 1128:2007; CSI: Zagreb, Croatia, 2007.
  47. Horszczaruk, E. Abrasion resistance of high-performance hydraulic concrete with polypropylene fibers. Tribologia 2012, 1, 63–72. Available online: http://yadda.icm.edu.pl/yadda/element/bwmeta1.element.baztech-article-BPS1-0047-0005 (accessed on 26 December 2021).
  48. Guide for the Design and Construction of Concrete Parking Lots; ACI 330R-08; American Concrete Institute: Farmington Hills, MI, USA, 2008.
  49. Concrete Paving Blocks—Requirements and Test Methods. In HRN EN 1338:2003; CSI: Zagreb, Croatia, 2003.
  50. Concrete Paving Flags—Requirements and Test Methods. In HRN EN 1339:2004/AC:2007; CSI: Zagreb, Croatia, 2007.
  51. Concrete Kerb Units—Requirements and Test Methods. In HRN EN 1340:2004/AC:2007; CSI: Zagreb, Croatia, 2007.
  52. Sherwani, A.F.H.; Faraj, R.; Younis, K.H.; Daraei, A. Strength, abrasion resistance and permeability of artificial fly-ash aggregate pervious concrete. Case Stud. Constr. Mater. 2021, 14, e00502. [Google Scholar] [CrossRef]
  53. Kevern, J.T.; Schaefer, V.R.; Wang, K. Evaluation of Pervious Concrete Workability Using Gyratory Compaction. J. Mater. Civ. Eng. 2009, 21, 764–770. [Google Scholar] [CrossRef]
  54. Ibrahim, A.; Mahmoud, E.; Yamin, M.; Patibandla, V.C. Experimentally study on Portland cement pervious concrete mechanical and hydrological properties. Constr. Build. Mater. 2014, 50, 524–529. [Google Scholar] [CrossRef]
  55. Tho-in, T.; Sata, V.; Chindaprasirt, P.; Jaturapitakkul, C. Pervious high-calcium fly ash geopolymer concrete. Constr. Build. Mater. 2012, 30, 366–371. [Google Scholar] [CrossRef]
  56. Fu, T.C.; Yeih, W.; Chang, J.J.; Huang, R. The Influence of Aggregate Size and Binder Material on the Properties of Pervious Concrete. Adv. Mater. Sci. Eng. 2014, 2014, 963971. [Google Scholar] [CrossRef] [Green Version]
  57. Report on Pervious Concrete; ACI 522R-10; American Concrete Institute: Farmington Hills, MI, USA, 2011.
  58. Stefanou, G.; Savvas, D.; Metsis, P. Random Material Property Fields of 3D Concrete Microstructures Based on CT Image Reconstruction. Materials 2021, 14, 1423. [Google Scholar] [CrossRef]
  59. Hou, M.; Acton, P.D. Understanding the tampon density and density gradient through computed tomography imagin. Text. Res. J. 2016, 86, 573–579. [Google Scholar] [CrossRef]
  60. Sahdeo, S.K.; Chandrappa, A.; Biligiri, K.P. Effect of Compaction Type and Compaction Efforts on Structural and Functional Properties of Pervious Concrete. Transp. Dev. Econ. 2021, 7, 19. [Google Scholar] [CrossRef]
  61. Krstulović, P. Properties and Technology of Concrete; Faculty of Civil Engineering, University of Split, Institut IGH: Split, Croatia, 2000. (In Croatian) [Google Scholar]
  62. Powers, T.C. The Properties of Fresh Concrete; John Wiley & Sons: New York, NY, USA, 1698. [Google Scholar]
  63. Troxell, G.E.; Davis, H.E.; Kelly, J.W. Composition and Properties of Concrete; McGraw-Hill, Incorporated: New York, NY, USA, 1968. [Google Scholar]
  64. Bonicelli, A.; Giustozzi, F.; Crispino, M. Experimental study on the effects of fine sand addition on differentially compacted pervious concrete. Constr. Build. Mater. 2015, 91, 102–110. [Google Scholar] [CrossRef]
Figure 1. Cumulative sieving curves of aggregates in pervious concrete mixtures.
Sustainability 14 02723 g001
Figure 2. (a) Sample of M4-V pervious concrete formed into a ball; (b) the samples of waste cloth strips with the scale in cm; (c) compaction with a wooden tamper.
Sustainability 14 02723 g002
Figure 3. Equipment and progress for measuring infiltration rate: (a) ASTM C1701 test set-up for slab; (b) ASTM C1701 test set-up for cube.
Sustainability 14 02723 g003
Figure 4. Abrasion resistance was determined by Böhme test: (a) Bohme Abrasion Wheel Tester with specimen M3; (b) Specimen M4 after testing.
Sustainability 14 02723 g004
Figure 5. A 3D visualization of pervious concrete specimens with transparent display technique (light blue—more air, dark blue—more concrete): (a) M1; (b) M1-V; (c) M2; (d) M2-V; (e) M3; (f) M3-V; (g) M4; (h) M4-V.
Sustainability 14 02723 g005aSustainability 14 02723 g005b
Figure 6. Images of MSCT scanning: (a) M1; (b) M1-V; (c) M2; (d) M2-V; (e) M3; (f) M3-V; (g) M4; (h) M4-V.
Sustainability 14 02723 g006aSustainability 14 02723 g006b
Figure 7. The ratio of the compressive strength, flexural strengths, and porosity of the pervious concretes and single-sized pervious concretes M1 and M2.
Sustainability 14 02723 g007
Figure 8. The ratio of the abrasion resistance, water absorption, and density of the pervious concretes and single-sized pervious concretes M1 and M2.
Sustainability 14 02723 g008
Figure 9. The ratio of the infiltration rate on test slabs and infiltration rate on cubes of the pervious concretes and single-sized pervious concretes M1 and M2.
Sustainability 14 02723 g009
Figure 10. (a) Relationship between abrasion resistance and compressive strength; (b) relationship between density and porosity.
Sustainability 14 02723 g010
Figure 11. Relationship between infiltration rate on test slabs and infiltration rate on cubes.
Sustainability 14 02723 g011
Figure 12. Images of MSCT scanning: (a) M1-V; (b) M2-V; (c) M3-V; (d) M4-V; (e) display settings.
Sustainability 14 02723 g012aSustainability 14 02723 g012b
Figure 13. Cross section of specimens: (a) M1-V; (b) M4-V.
Sustainability 14 02723 g013
Figure 14. Relationship between the standard deviation of MSCT results and porosity and both infiltration rate measuring methods.
Sustainability 14 02723 g014
Figure 15. The ratio of the compressive strength, flexural strengths, and porosity of the pervious concretes and the reference single-size pervious concretes.
Sustainability 14 02723 g015
Figure 16. The ratio of the abrasion resistance, water absorption, and density of the pervious concretes and the reference single-size pervious concretes.
Sustainability 14 02723 g016
Figure 17. The ratio of the infiltration rate on test slabs and infiltration rate on cubes of the pervious concretes and the reference single-size pervious concretes.
Sustainability 14 02723 g017
Figure 18. The ratio of the compressive strength, flexural strengths, and porosity of the pervious concretes with waste cloth strips and the reference pervious concretes.
Sustainability 14 02723 g018
Figure 19. The ratio of the abrasion resistance, water absorption, and density of the pervious concretes with waste cloth strips and the reference pervious concretes.
Sustainability 14 02723 g019
Figure 20. The ratio of the infiltration rate on test slabs and infiltration rate on cubes of the pervious concretes with waste cloth strips and the reference pervious concretes.
Sustainability 14 02723 g020
Figure 21. σ–δ plot of the reference specimen and specimens containing waste cloth strips: (a) M1, M1-V; (b) M2, M2-V; (c) M3, M3-V; (d) M4, M4-V.
Sustainability 14 02723 g021
Table 1. Concrete mixtures.
Constituent/MixturesM1M1-VM2M2-VM3M3-VM4M4-V
Cement (kg/m3)350350350350350350350350
Water/cement ratio0.350.350.350.350.350.350.350.35
Textile strips (kg/m3)-2.2-2.2-2.2-2.2
Aggregate0–4 mm (kg/m3)----148.6146.0148.6146.0
4–8 mm (kg/m3)1486.31459.5--1337.71313.6
8–16 mm (kg/m3)--1486.31459.5- 1337.71313.6
Table 2. Pervious concrete test results: mechanical and physical properties.
Measured ValuesM1M1-VM2M2-VM3M3-VM4M4-V
Compressive strength [MPa]20.3 ± 0.713.1 ± 0.510.5 ± 0.69.9 ± 0.311.6 ± 0.812.2 ± 0.58.7 ± 0.410.4 ± 0.9
Flexural strength [MPa]4.50 ± 0.263.07 ± 0.112.62 ± 0.172.31 ± 0.063.35 ± 0.113.44 ± 0.032.27 ± 0.102.70 ± 0.07
Abrasion resistance [cm3/50cm2]24.7 ± 1.231.1 ± 1.737.9 ± 2.144.7 ± 2.939.3 ± 3.539.1 ± 3.146.3 ± 3.840.5 ± 2.6
Density [kg/m3]1834.2 ± 9.11776.9 ± 8.31719.3 ± 6.51709.9 ± 29.01793.0 ± 15.31736.5 ± 6.51738.9 ± 12.21731.3 ± 31.9
Porosity [%]28.932.136.036.131.033.634.934.4
Water absorption [%]7.46.35.96.08.58.85.86.2
Infiltration rate on cubes [mm/s]3.2011.7317.3225.817.186.4814.4512.08
Infiltration rate on test slabs according to ASTM C 1701 [mm/s]0.225.3914.8818.115.906.6117.148.42
Table 3. The obtained values for concrete mixtures on MSCT.
Measured ValuesM1M1-VM2M2-VM3M3-VM4M4-V
N5038343537383637
Area [cm2]143.891164.275151.567127.046145.664146.348146.572154.026
Minimum [HU]−922.440−934.368−987.324−950.257−827.378−851.684−922.361−928.459
Maximum [HU]2193.3402224.3952239.9712114.9712098.4762093.4212124.7782118.703
Mean [HU]1195.7691142.1881138.6281127.5451150.2361087.7821166.5231172.472
Median [HU]1382.8401300.7371492.6181432.6291245.7841190.0261464.0831440.270
Standard deviation [HU]641.954669.879876.152785.273496.628544.550731.713707.829
Publisher’s Note: MDPI stays neutral with regard to jurisdictional claims in published maps and institutional affiliations.

