Article

Attention Pedestrians Ahead: Evaluating User Acceptance and Perceptions of a Cooperative Intelligent Transportation System-Warning System for Pedestrians

1
School of Engineering, Newcastle University, Cassie Building, Newcastle upon Tyne NE1 7RU, UK
2
Jiangsu Key Laboratory of Urban ITS, Jiangsu Province Collaborative Innovation Centre of Modern Urban Traffic Technologies, School of Transportation, Southeast University, Nanjing 211189, China
*
Author to whom correspondence should be addressed.
Sustainability 2022, 14(5), 2787; https://doi.org/10.3390/su14052787
Submission received: 18 January 2022 / Revised: 22 February 2022 / Accepted: 25 February 2022 / Published: 27 February 2022

Abstract

:
Warning system for pedestrians (WSP), one of cooperative intelligent transport system (C-ITS) applications, is designed to increase safety for pedestrians but also for drivers and other road users. The evaluation of end-user acceptance and perceptions of this technology is crucial before deploying it in transportation systems. Five WSP human–machine interfaces (HMIs) were designed and simulated using a driver’s first-view video footage of driving through a pedestrian crossing in Newcastle upon Tyne. The five WSP designs were evaluated with 24 younger end users (35 years old and younger). This study first evaluated the usefulness of the unified theory of acceptance and use of technology (UTAUT) in modelling end-user acceptance in terms of behavioural intentions to use WSP. The results suggest that the UTAUT can be applied to investigate the end-user acceptance of WSP, with performance expectancy and effort expectancy influencing the behavioural intentions to use WSP. Furthermore, we investigated end-user attitudes towards various WSP human–machine interface (HMI) designs. Participants showed more positive attitudes towards visual-only interfaces than towards audio-only and multi-modal (combinations of visual and audio) interfaces. Above all, the findings of this research increase our understanding of public acceptance and perceptions of this C-ITS application.

1. Introduction

Cooperative intelligent transport systems (C-ITS; also known as cooperative vehicle–infrastructure systems) enable cars to communicate with each other (vehicle to vehicle (V2V)) and also allow vehicles to exchange and share information with the infrastructure (vehicle to infrastructure (V2I)) [1]. Direct communication between vehicles, roadside infrastructures, and traffic control centres through C-ITS potentially delivers significant benefits, including improved road safety, traffic management, road user experience, and energy efficiency, as well as reducing traffic congestion and emissions [2]. Over the last decade, there has been increasing interest in C-ITS, with projects such as COOPERS, SAFEPOT, DRIVE C2X, and Compass4D, examining the potential of the design and use of various types of applications, including road hazard warning (RHW), red light violation warning (RLVW), weather warning (WW), road works warning (RWW), emergency brake light warning (EBLW), traffic jam ahead warning (TJAW), in-vehicle signage (IVS) and energy efficient intersection (EEIS) [2]. The European Union’s Horizon 2020 Research and Innovation Programme project C-Mobile (Accelerating C-ITS Mobility Innovation and Deployment in Europe) introduced C-ITS in eight sites (Barcelona, Bilbao, Bordeaux, Copenhagen, North Brabant, Newcastle, Thessaloniki, and Vigo). The project ‘integrates C-ITS concepts in practical, real-life and complex environments that aims to provide a safe and efficient road transport without casualties and serious injuries on European roads, in particular in complex urban areas and for vulnerable road users’. Among the variety of C-ITS applications designed and developed in the C-Mobile project, a warning system for pedestrians (WSP) has the potential to deliver significant safety benefits for drivers and pedestrians.
Uncontrolled pedestrian crossings pose safety risks for vehicle drivers and pedestrians, in addition to negatively affecting the efficiency of urban road networks [3]. The UK Highway Code states that the ‘driver must give way when a pedestrian has moved onto a crossing’. However, in reality, drivers may fail to give way to pedestrians, as they may not be aware of someone crossing the road, or they may ignore the crossing areas [4]. To deal with such issues, a common strategy is a roadside pedestrian warning system which detects pedestrians crossing via roadside sensors and warns drivers with flashlights embedded in the pavement near marked crossings [4,5]. One limitation of such infrastructure could be that drivers may fail to pay attention to unexpected roadside warnings [6], and people have much faster responses when a stimulus is closer to them [6]. The development of CITS-WSP enables a vehicle to communicate with the infrastructure to provide in-vehicle warnings to drivers through its human–machine interfaces (HMIs). This system would be particularly beneficial when drivers are distracted or visibility is poor; for example, pedestrians might emerge from between parked vehicles that block a driver’s sight.
Driving is a complex, multi-task activity in which a driver needs to interact with the vehicle to perform primary driving tasks, such as steering, accelerating, braking, and changing gear [7]. Drivers also perform secondary tasks within the vehicle, which often involve interacting with the in-vehicle HMI [7]. WSP aims to provide warning alerts to drivers about potentially dangerous situations involving pedestrians via the in-vehicle HMI. The HMI design of a WSP should be carefully designed to take into account the fact that drivers’ engagement with it could potentially contribute to increased distraction if the driver focuses on the HMI instead of the road [8,9]. Driver distraction is a major factor in road safety and a key element responsible for crash and near-crash events [10]. Moreover, the HMI design of the WSP should also consider drivers’ physical and cognitive capabilities, which are closely linked to the perceived usefulness and the driver’s acceptance of the system [9]. Since the design of HMIs is strongly associated with the usability and safety of in-vehicle driver assistance systems [7,11,12], it is imperative to understand drivers’ requirements and their acceptance of HMIs, in order to ensure that a WSP design would be usable and beneficial to end users [13,14].

1.1. Measuring Driver Acceptance

Driver acceptance is an important criterion in the evaluation of the effectiveness of in-vehicle HMIs [13,15]. Driver acceptance is defined as ‘the degree to which an individual intends to use a system and, when available, incorporates the system in his/her driving’ [16]. Driver acceptance is also strongly associated with a user’s attitudes, subjective experience, and willingness to use a technology [15]. Modelling technology acceptance is necessary to increase the likelihood that a particular technology is accepted by end users [17]. A number of social–psychological models have been developed to explain and predict factors affecting technology acceptance and use, among which the technology acceptance model (TAM) [18] and the unified theory of acceptance and use of technology (UTAUT) [19] are the most commonly used. TAM built upon the theory of reasoned action (TRA) [20] to suggest that perceived usefulness and perceived ease of use have direct impacts on behavioural intentions [18]. UTAUT is based on TAM, integrating eight influential acceptance models into a synthesised technology acceptance model [19]. UTAUT proposes four components which could influence an individual’s behavioural intentions to use technology: performance expectancy (PE), effort expectancy (EE), social influence (SI), and facilitating conditions (FCs) [19]. Moreover, in this model, age, gender, and experience are all hypothesised to act as moderators (Figure 1).
Traditionally, UTAUT has been used to study user intentions to use information systems, such as health information technology (home telehealth services) [21], educational and communication technology (interactive whiteboards) [22], mobile banking services [23], and e-government services [24]. UTAUT has also been applied to understand driver acceptance of vehicle technology in recent years. For example, Adell [16] used UTAUT to evaluate the SASPENCE driver support system, which aims to assist drivers to keep safe speeds and distances from vehicles ahead. Performance expectancy and social influence were found to have significant effects on behavioural intentions, but the explanatory power of the model for intentions to use this system was only 20% when independent variables (PE, EE, and SI) were included in the modelling. Henzler, Boller [25] used UTAUT to investigate driver acceptance of a driver assistance system which provides eco-driving recommendations. The results showed that performance expectancy and effort expectancy may both have a direct effect on behavioural intentions. Rahman and Lesch [17] applied UTAUT to evaluate driver acceptance of an advanced driver assistance system (ADAS). The results indicated that the model could account for a 71% variance in behavioural intentions towards this system, with performance expectancy, effort expectancy, and social influence found as significant predictors.

1.2. Statement of the Problem

The testing and evaluation of C-ITS applications at an early stage are important for the successful deployment of these services in a transport system [1]. An important task is to investigate drivers’ comprehension and understanding of the applications [9]. However, knowledge regarding the user’s acceptance and perceptions of C-ITS applications is still relatively scarce in an underdeveloped research field.
As an important example of C-ITS applications, the potential safety benefits of WSP have been widely recognised by previous studies [4,26,27,28,29,30]. However, some studies focused on WSP that was designed to be implemented on the road [4,26]. For those who studied in-vehicle WSP, there is a trend in which their focus is mainly from a technical perspective focusing on the system architecture [27,28,29,30]. There is limited research focusing on studying the WSP from an end-user perspective. The exploration of end users’ attitudes and preferences towards the different designs of HMIs of WSP is significantly under-researched. The lack of such knowledge may potentially have a negative influence on the usability of the designed WSP and reduce its potential benefits in terms of enhancing road safety and efficiency.

1.3. Purpose of the Research

To solve this problem and fill the research gap identified above, this study aims to evaluate driver acceptance of, and intention to use, the C-ITS application of a warning system for pedestrians (WSP) while also exploring their attitudes towards various HMI designs. Two research objectives that the current study addressed were as follows:
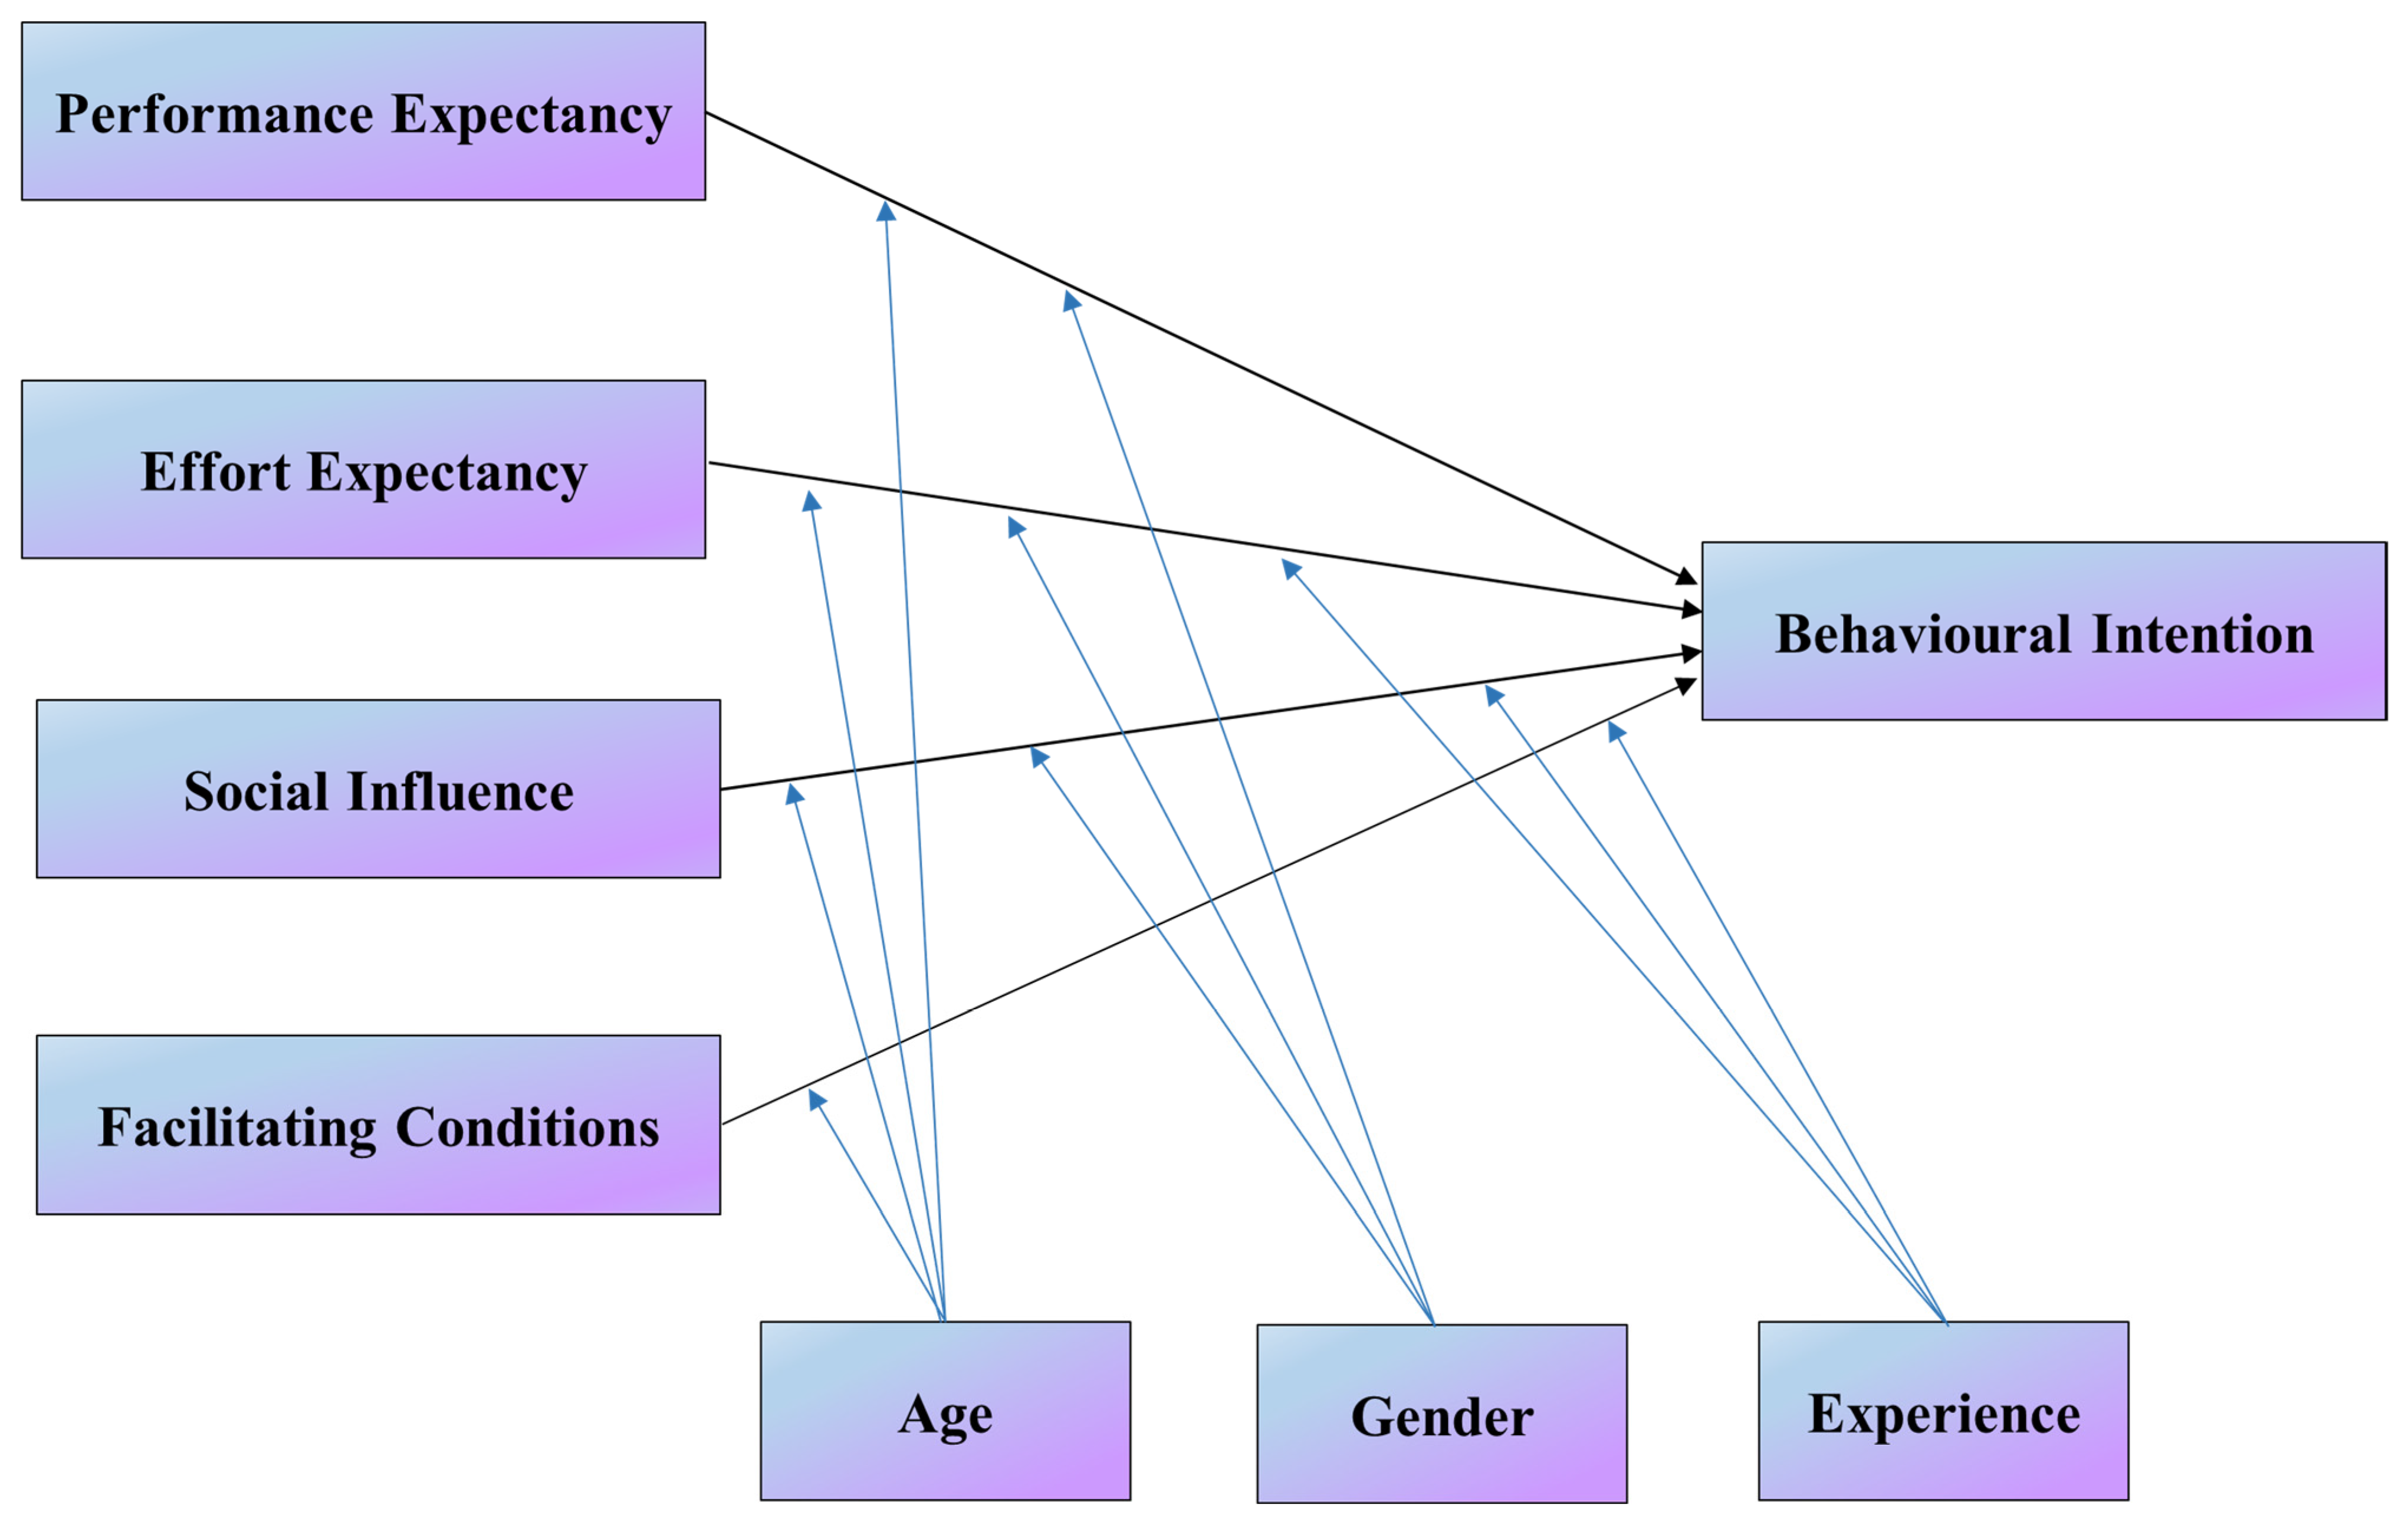
  • To examine the effect of UTAUT constructs of performance expectancy, effort expectancy, social influence, and facilitating conditions on users’ behavioural intention to use WSP;
  • To examine user attitudes towards the different types of WSP-HMIs.

2. Materials and Methods

2.1. Design of WSP-HMIs

The evaluation of the characteristics of the HMI in the early stage is necessary since one important element of the system includes the display and information provided to the driver. Information or warning messages can be displayed in different formats via in-vehicle HMIs, such as visual (text or pictures) and auditory display [7,31]. Visual displays are the most common mode of information presentation, and most HMIs use them as the primary mode of presentation [7]. In comparison with visual display, the auditory display is relatively underused for driving tasks. However, several studies have found that using an auditory display to present information has the least impact on driving performance and workload [32,33]. Moreover, the use of a multi-modal display with a combination of auditory and visual information could further enhance driver performance and is preferred by the majority of users, as discussed by Liu [31], Jakus and Dicke [34], and Edwards and Emmerson [35]. Therefore, in the current study, based on the driver’s first-view footage of driving through a pedestrian crossing on the B1318 Gosforth Corridor in Newcastle upon Tyne, we developed five different WSP-HMIs, including three single-modal displays (one audio-only and two visual-only displays) and two multi-modal displays. For the auditory display, we used speech-based information presentations in the form of a digitised human female voice to provide warning messages, as described by Liu [31]. For the visual display, we first adopted a pedestrian crossing sign and then combined the sign with a legend displayed below it. This design was recommended by Payre and Diels [9], who pointed out that displaying a legend below a warning sign could enhance the driver’s response and improve comprehension of the sign by users. The multi-modal displays combine audio and visual displays to provide warning messages with varying complexity to drivers. The detailed WSP-HMI designs are shown in Table 1 and Figure 2.

2.2. Measurements

In order to determine the factors affecting users’ intention to use WSP-HMIs, we adopted measures of performance expectancy, effort expectancy, social influence, facilitating conditions, and behavioural intentions, based on the UTAUT constructs identified by Venkatesh and Morris [19]. A total of 18 measurement items were used to measure each of the UTAUT constructs, as shown in Table 2, with all items measured on a seven-point Likert scale ranging from 1 (strongly disagree) to 7 (strongly agree).

2.3. Participants and Research Procedure

The sample consisted of 24 participants, comprising 7 females and 17 males, recruited from amongst students and staff members at Newcastle University. Their ages ranged from 18 to 35 years (M = 24.50, SD = 4.33).
Ethical approval was granted to the research team by Newcastle University Ethics Committee before the study. This investigation was carried out using an online survey. Prior to the experiment, the participants were given a brief introduction concerning the purpose of the study and the design concepts of the WSP-HMIs. Then, the experiment began, and the participants were asked to watch the first video clip of a WSP-HMI and subsequently evaluate it by completing the UTAUT questionnaire. After that, the participants were asked to repeat this process to evaluate the other four WSP-HMIs. The five videos were presented in a randomised order.

2.4. Data processing and Analysis

The internal consistency of each scale was evaluated using Cronbach’s alpha. The resulting values were compared against a minimum value of α = 0.70 in order to evaluate reliability coefficients in an absolute sense [37]. To examine construct validity, the entire sets of subscales were evaluated by means of factor analysis. After that, a hierarchical multiple regression analysis was employed to test the effect of predictor variables and moderator variables on behavioural intentions [38]. Ordinal attitudinal data were analysed using Mann–Whitney U and Friedman tests. Statistical analyses were carried out using IBM SPSS statistics, version 23.

3. Results

3.1. Behavioural Intentions towards WSP-HMIs

The results of the UTAUT analysis are summarised in this section. Cronbach’s alpha (α) was first calculated to evaluate the scale reliability. As shown in Table 3, Cronbach’s alpha (α) values were all above 0.70, indicating high internal consistency was observed in the data [37]. A factor analysis was conducted to determine the divergent and convergent validity of all subscales. Application of the Kaiser–Meyer–Olkin (KMO) test for the measurement of sampling adequacy yielded a score of 0.914, indicating that the dataset was appropriate of data for subsequent factor analysis. Bartlett’s test of sphericity also gave a significant value (χ2(153) = 2159.00, p < 0.001). The factor structure was then determined using principal component analysis (PCA) extraction and Promax rotation. Table 3 shows all factor loadings greater than 0.40, indicating that high construct validity was present in the data [36,39].
Prior to multiple linear regression, correlation analyses were conducted to explore the interrelationships between scales and their individual relationships with behavioural intentions. As shown in Table 4, there were significant relationships between behavioural intentions and performance expectancy (r = 0.866, p < 0.001), effort expectancy (r = 0.695, p < 0.001), social influence (r = 0.767, p < 0.001), and facilitating conditions (r = 0.632, p < 0.001).
Hierarchical multiple regression was used to test the moderated research model [38], and in the current study, the predictor variables (performance expectancy, effort expectancy, social influence, and facilitating conditions) and the moderator variables (age, gender, and experience) were entered into the model in separate steps. The results shown in Table 5 indicate that, in the first step of the model, Performance expectancy and effort expectancy were found to be significant predictors of behavioural intention and were able to explain 78.8% of the variance in behavioural intention. Performance expectancy was found to be the strongest predictor (β = 0.626, p < 0.001), followed by effort expectancy (β = 0.158, p = 0.014). However, social influence (β = 0.128, p = 0.112) and facilitating conditions (β = 0.060, p = 0.333) did not significantly predict behavioural intentions. In the second step of the model, the demographical variables also did not exhibit a significant effect; these results agree with the work of Madigan and Louw [36].

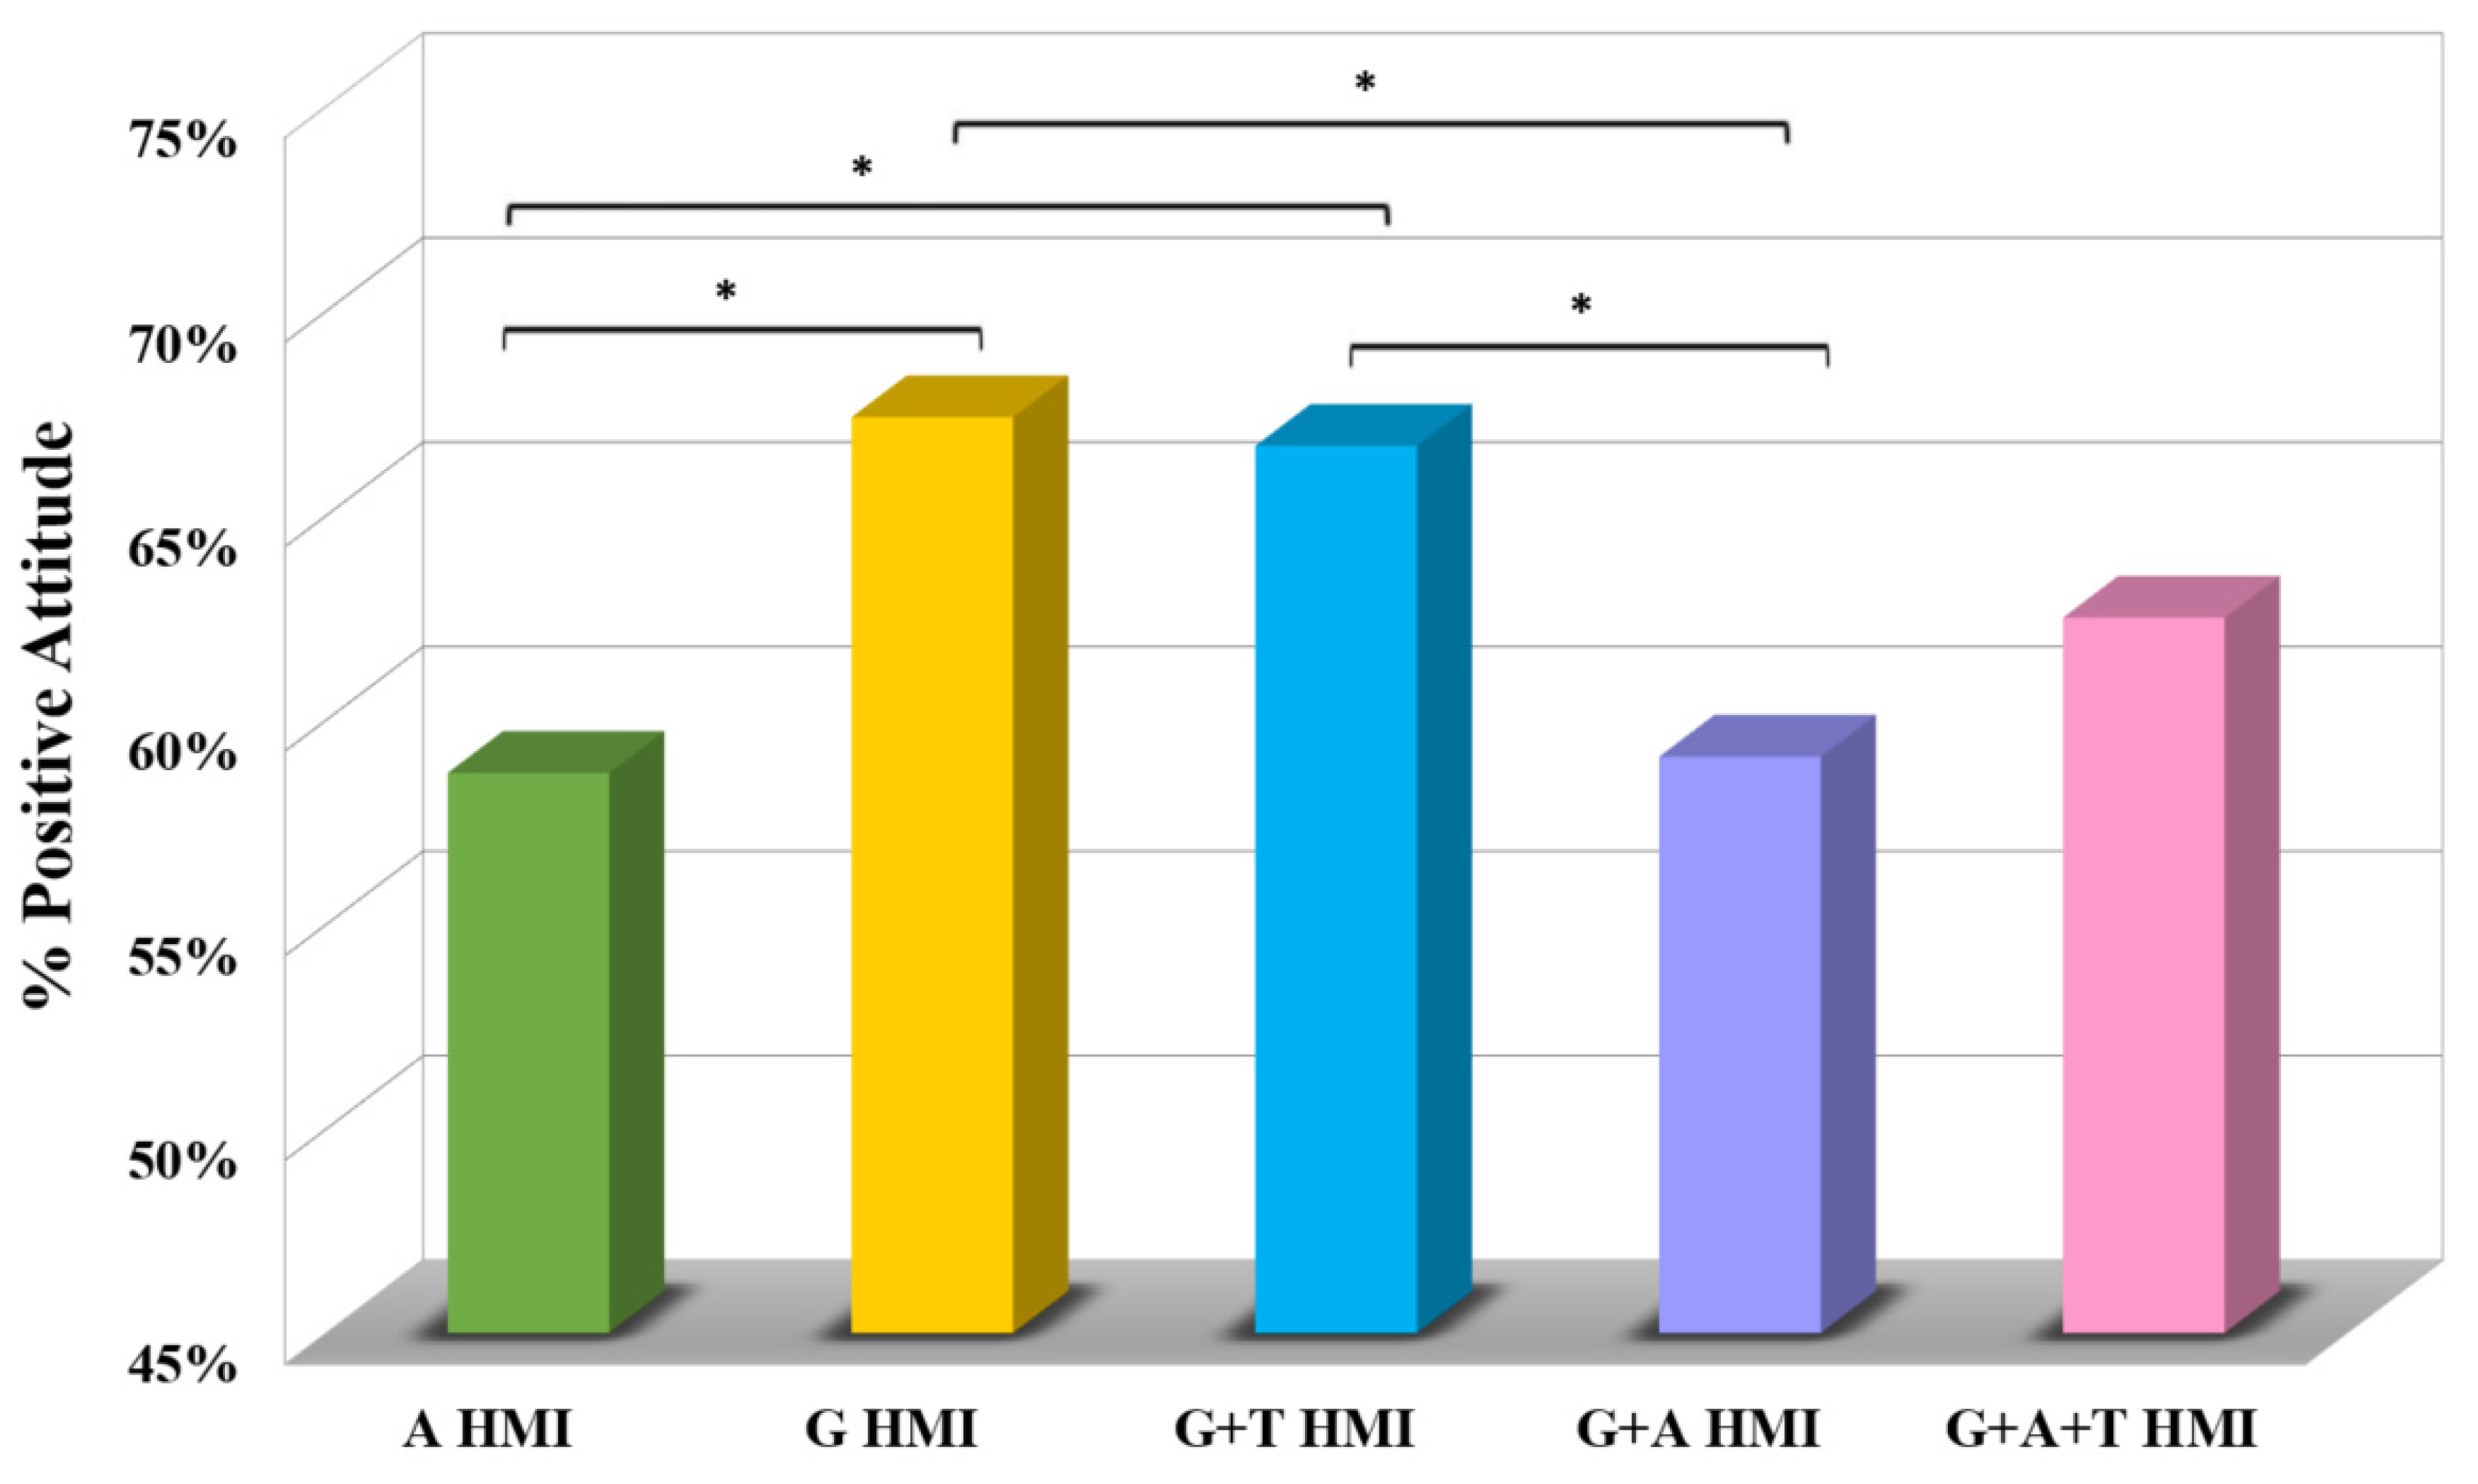
3.2. Attitudes towards Different Types of WSP-HMIs

Participants’ attitudes towards the five types of HMI were examined using the questionnaire items of PE1, PE2, PE3, PE4, EE1, EE2, EE3, EE4, BI1, BI2, and BI3. As Figure 3 shows, the lowest level of enthusiasm was observed for A HMI, for which 58.7% of the participants showed positive attitudes. This percentage was only slightly higher for G + A HMI (59.1%). For G + A+T HMI, 62.5% of the participants showed positive attitudes. The level of enthusiasm then increases to 66.7% for G + T HMI and 67.4% for G HMI.
The results of a Friedman test showed that there was a statistically significant difference in participants’ attitudes towards the different types of HMI, χ2(4) = 13.994, p = 0.007. A post hoc Wilcoxon signed-rank test showed that participants’ attitudes towards the G + T HMI were statistically significantly more positive, compared with A HMI (p = 0.020) and G + A HMI (p = 0.011). Moreover, participants’ attitudes towards G HMI were statistically significantly more positive, compared with A HMI (p = 0.012) and G + A HMI (p = 0.016).

4. Discussion

The evaluation of the acceptance and perceptions of C-ITS services among users is crucial before the deployment of such services in a real-world transportation environment [9]. In the current study, we first applied the UTAUT model to study the users’ acceptance of a C-ITS service of a WSP. The results indicate that the model was successful in predicting behavioural intentions towards the WSP, accounting for 78.8% of the total variance.
Performance expectancy was the strongest predictor of behavioural intentions of individuals, implying their belief that using the WSP would help them to detect pedestrians more quickly and improve their driving performance. This finding corresponds with those of studies by Adell [16] and Rahman and Lesch [17], which also identified performance expectancy as the strongest predictor of the acceptability of driver support systems. The definition of performance expectancy is very similar to that of perceived usefulness in TAM [19]. Rahman and Lesch [17] pointed out that perceived usefulness can be defined as a belief in the usefulness of ADAS in enhancing driving performance, and it was shown to have a direct effect on behavioural intentions. Similarly, the WSP aims to enhance driving performance, such as increased safety for drivers and other road users, and improved driver satisfaction. This perception of enhanced performance may contribute to the behavioural intentions to use the WSP.
Effort expectancy also had a strong impact on behavioural intentions to use the WSP, indicating that effort was a factor in such behavioural intentions. This finding is also supported by Rahman and Lesch [17], who identified effort expectancy as the second predictor affecting users’ acceptance of ADAS. To minimise the effect of secondary tasks on driving performance, it is necessary for an in-vehicle HMI to be easy to use and the input and output of the system should be clearly understandable [40]. Moreover, enhancement of performance is associated with a system that is easier to use [17]. The WSP service provides warning messages to users via auditory, visual, or multi-modal displays, and these various HMIs may improve the effectiveness of the functionality of the WSP. Consequently, it may be convenient for drivers to use it.
However, social influence failed to achieve significance in affecting behavioural intentions, suggesting that other people’s opinions may not have such a strong impact on whether an individual will choose to use a WSP. The social influence measure is built upon the construct of social factors from the model of PC utilisation (MPCU). Social factors were specifically used to measure users’ acceptance of computer systems in organisations, where the influence of co-workers may be more relevant [21]. Venkatesh and Morris [19] pointed out that ‘The role of social influence in technology acceptance decisions is complex and subject to a wide range of contingent influences’. Individuals’ decisions about the use of technology were voluntary in nature, and therefore, in such circumstances, the opinions of other people may not have significant effects on individual beliefs about the use of WSP.
Finally, facilitating conditions were not found to have significant impacts on behavioural intentions to use the WSP. In a car, facilitating conditions could be interpreted as the availability of a learning tool, a help menu, a manual, or a passenger that could support the driver in understanding and performing certain tasks [40]. In order to ensure that users had some knowledge of a specific type of driving technology, a previous study carried out by Madigan and Louw [36] asked participants to use the automated road transport systems (ARTSs) at least once before they completed the questionnaire. Consequently, it was found that facilitating conditions did have a positive impact on behavioural intentions to use ARTS. It is important that the users had a chance to interact with in-vehicle systems and understand the role of such systems in their driving, as discussed by Rahman, Lesch [17]. They found that participants who had experienced a driving simulator showed a significantly higher intention to use the ADAS than those who merely completed an online survey. Taken together, in order to further evaluate whether UTAUT could be a productive model in influencing users’ acceptance of WSP, future studies should consider other approaches (such as driving simulators) to provide users with hands-on experience of using a WSP.
In the current study, we also evaluated users’ attitudes towards various WSP-HMI modalities. The results firstly show that participants had the least positive attitudes towards the auditory HMI (A HMI). This finding corresponds with those of Jakus and Dicke [34], who found users’ experience of an auditory HMI led to perceptions that it was less predictable, supportive, and secure than audio–visual displays. Additionally, we found that participants had lower levels of enthusiasm for multi-model HMIs (G + A HMI and G + T + A HMI) than visual-only HMIs (G HMI and G + T HMI). Finally, the results show that there is no significant difference in positive attitudes between G HMI and G + T HMI. In the real world, both auditory and visual displays are associated with distraction. Compared with visual displays, users may feel that an auditory display is more distracting and annoying in that they cannot ignore it selectively [41]. Moreover, drivers were more seriously distracted by additional auditory warning messages if they were already somewhat distracted by different in-vehicle visual displays [8]. Furthermore, increased numbers of modalities result in increased ratings of urgency and annoyance among drivers [42]. Taken together, this might be a possible explanation for why participants preferred to use visual-only displays. However, although we found that participants had less positive attitudes towards multi-modal WSP-HMIs, it is still worth designing and developing such displays. Previous studies have reported that the audio–visual modality could in fact enhance driving performance and decrease mental load [34,35]. Moreover, Sodnik and Dicke [32] found that initially, users prefer to use visual interfaces because they were more effective and easier for the user, but they found auditory interfaces became more effective after a few uses. Therefore, there is a need for customised and/or hierarchical design in the future. For an in-vehicle alert system, it is important to consider when to present alarms to drivers; therefore, there is a need to further investigate the interaction effects between the urgency and modality of the WSP on driver acceptance and performance. The present study is based on videos, but it will be worth investigating drivers’ behaviour and performance and their subjective preferences towards WSP if they are seeing and experiencing these HMIs in a simulated or real driving environment.

5. Conclusions

This study aimed to understand end-user acceptance and perceptions towards one C-ITS application of a warning system for pedestrians (WSP). Five WSP concepts differentiated between HMI modalities were envisioned using a first-view, video-based method and subsequently evaluated with younger end users. We adopted the UTAUT to evaluate social–psychological factors affecting user acceptance of WSP. The results show that the UTAUT model was successful in predicting behavioural intentions towards the WSP, with strong explanatory power. Its performance and ease of use seem to be important factors influencing user acceptance of the WSP. Secondly, we investigated users’ attitudes towards various WSP-HMI designs, and most test subjects were found to prefer visual-only interfaces rather than audio-only and multi-modal interfaces. Auditory display and a multi-modal display with additional auditory warning messages may be more distracting and annoying to drivers. However, it is still worth considering and designing multi-model WSP HMIs in the future, as this design has the potential to improve drivers’ driving performance and decrease mental workload. Taken together, these findings provide evidence that increases our understanding of public acceptance and perceptions of this C-ITS application.
This study has generated useful knowledge to inform the design of the C-ITS warning system for pedestrians. There are still research limitations. This study revealed that the first-view, video-based method of envisioning designs is cost-efficient, safe, and eco-friendly but also effective in envisioning and evaluating the HMI designs of C-ITS systems. However, it is still necessary to further evaluate the designs in high fidelity simulated environment as well as in a real-world driving environment. Further research is planned to develop a prototype of the WSP system based on the findings of this study and evaluate it using the Newcastle University driving simulator as well as on real vehicles. Additionally, due to the limited time and resources, this study was not able to recruit a gender-balanced sample; therefore, future research could repeat the current study using a gender-balanced sample and investigate the impact of gender on end users’ preferences of C-ITS WSP systems. In addition, although the participants of this study were from a younger age group (aged 35 years and younger), the designed WSP system has the potential to benefit road users of all ages. Therefore, further studies evaluating the WSP designs with middle-aged and older age groups are planned. Considering older people were found to be a heterogeneous group when interacting with automated vehicles [43], it is worth for further studies to explore the influence of the different subgroups of older people on the acceptance and preferences of the C-ITS WSP. Furthermore, the sample size of the current study is 24, future studies could adopt a larger sample size to examine the effect of WSP on end users’ acceptance. Nonetheless, in order to further evaluate the usefulness of UTAUT and the acceptance of and preferences concerning WSP, future studies could consider using other approaches (such as driving simulators and virtual reality) to provide users with hands-on experience and enable them to interact with the designed systems. Finally, the current study focuses on WSP implemented in conventional vehicles with level 0 of automation. With the trend of the rapid development of vehicles with higher levels of automation (SAE Level 3 and over) [11,43,44,45,46], future research could explore how WSP could facilitate safe and efficient driving of automated vehicles.

Author Contributions

Conceptualisation, Y.Z., S.L., P.B., S.E., W.G., Y.J., J.X., P.G. and G.H. methodology, Y.Z., S.L. and P.B.; software, Y.Z.; validation, Y.Z., S.L. and P.B.; formal analysis, Y.Z. and S.L.; investigation, Y.Z. and S.L.; resources, P.B., S.E., Y.J. and P.G.; data curation, Y.Z. and S.L.; writing—original draft preparation, Z.Y., S.L. and P.B.; writing—review and editing, Y.Z., S.L., P.B., S.E., W.G., Y.J., J.X., P.G. and G.H.; visualisation, Z.Y. and S.L.; supervision, P.B., S.E., and P.G.; project administration, P.B., S.E., W.G., Y.J., J.X., W.G., P.G. and G.H. funding acquisition, P.B., W.G., S.E. and Y.J. All authors have read and agreed to the published version of the manuscript.

Funding

This study was funded by the European Union’s Horizon 2020 Research and Innovation Programme C-Mobile (Grant Number: 723311). We acknowledge the support of the UK’s Engineering and Physical Sciences Research Council (EPSRC) throughout the research through the funding awards from LC Transform (EP/N010612/1) and the Centre for Energy Systems Integration (EP/P001173/1), the National Key R&D Program of China (Grant Number 2018YFE0120100), and also from the UK Department for Transport (DfT) through their Smart Corridor funding.

Institutional Review Board Statement

This study was approved by the Ethics Committee of Newcastle University (protocol code 20-EDW-003 and date of approval 26 March 2020).

Informed Consent Statement

Informed consent was obtained from all subjects involved in the study.

Data Availability Statement

The data that support the findings of the current study are available on request from the corresponding author.

Conflicts of Interest

The authors declare no conflict of interest.

References

  1. Sjoberg, K.; Andres, P.; Buburuzan, T.; Brakemeier, A. Cooperative intelligent transport systems in europe: Current deployment status and outlook. IEEE Veh. Technol. Mag. 2017, 12, 89–97. [Google Scholar] [CrossRef]
  2. Edwards, S.; Hill, G.; Goodman, P.; Blythe, P.; Mitchell, P.; Huebner, Y. Quantifying the impact of a real world cooperative-ITS deployment across multiple cities. Transp. Res. Part A Policy Pract. 2018, 115, 102–113. [Google Scholar] [CrossRef] [Green Version]
  3. Beckwith, D.M.; Hunter-Zaworski, K.M. Passive pedestrian detection at unsignalized crossings. Transp. Res. Rec. 1998, 1636, 96–103. [Google Scholar] [CrossRef]
  4. Hakkert, A.S.; Gitelman, V.; Ben-Shabat, E. An evaluation of crosswalk warning systems: Effects on pedestrian and vehicle behaviour. Transp. Res. Part F Traffic Psychol. Behav. 2002, 5, 275–292. [Google Scholar] [CrossRef]
  5. Høye, A.; Laureshyn, A. SeeMe at the crosswalk: Before-after study of a pedestrian crosswalk warning system. Transp. Res. Part F Traffic Psychol. Behav. 2019, 60, 723–733. [Google Scholar] [CrossRef]
  6. Liu, Y.-C.; Jhuang, J.-W. Effects of in-vehicle warning information displays with or without spatial compatibility on driving behaviors and response performance. Appl Ergon. 2012, 43, 679–686. [Google Scholar] [CrossRef]
  7. Harvey, C.; Stanton, N.A.; Pickering, C.A.; McDonald, M.; Zheng, P. In-vehicle information systems to meet the needs of drivers. Intl. J. Hum. Comput. Interact. 2011, 27, 505–522. [Google Scholar] [CrossRef]
  8. Chen, W.-H.; Lin, C.-Y.; Doong, J.-L. Effects of interface workload of in-vehicle information systems on driving safety. Transp. Res. Rec. 2005, 1937, 73–78. [Google Scholar] [CrossRef]
  9. Payre, W.; Diels, C. Designing in-vehicle signs for connected vehicle features: Does appropriateness guarantee comprehension? Appl Ergon. 2019, 80, 102–110. [Google Scholar] [CrossRef]
  10. Klauer, S.G.; Dingus, T.A.; Neale, V.L.; Sudweeks, J.D.; Ramsey, D.J. The Impact of Driver Inattention on Near-Crash/Crash Risk: An Analysis Using the 100-Car Naturalistic Driving Study Data; National Highway Traffic Safety Administration: Washington, DC, USA, 2006; Report No. DOT HS 810 594. [Google Scholar]
  11. Li, S.; Blythe, P.; Guo, W.; Namdeo, A.; Edwards, S.; Goodman, P.; Hill, G. Evaluation of the effects of age-friendly human-machine interfaces on the driver’s takeover performance in highly automated vehicles. Transp. Res. Part F Traffic Psychol. Behav. 2019, 67, 78–100. [Google Scholar] [CrossRef]
  12. Emmerson, C.; Guo, W.; Blythe, P.; Namdeo, A.; Edwards, S. Fork in the road: In-vehicle navigation systems and older drivers. Transp. Res. Part F Traffic Psychol. Behav. 2013, 21, 173–180. [Google Scholar] [CrossRef] [Green Version]
  13. Vaezipour, A.; Rakotonirainy, A.; Haworth, N.; Delhomme, P. Enhancing eco-safe driving behaviour through the use of in-vehicle human-machine interface: A qualitative study. Transp. Res. Part A Policy Pract. 2017, 100, 247–263. [Google Scholar] [CrossRef]
  14. Li, S.; Blythe, P.; Guo, W.; Namdeo, A. Investigation of older drivers’ requirements of the human-machine interaction in highly automated vehicles. Transp. Res. Part F Traffic Psychol. Behav. 2019, 62, 546–563. [Google Scholar] [CrossRef]
  15. François, M.; Osiurak, F.; Fort, A.; Crave, P.; Navarro, J. Automotive HMI design and participatory user involvement: Review and perspectives. Ergonomics 2017, 60, 541–552. [Google Scholar] [CrossRef] [PubMed]
  16. Adell, E. Acceptance of driver support systems. In Proceedings of the European conference on human centred design for intelligent transport systems, Humanist VCE, Berlin, Germany, 29–30 April 2010. [Google Scholar]
  17. Rahman, M.M.; Lesch, M.F.; Horrey, W.J.; Strawderman, L. Assessing the utility of TAM, TPB, and UTAUT for advanced driver assistance systems. Accid Anal. Prev. 2017, 108, 361–373. [Google Scholar] [CrossRef] [PubMed]
  18. Davis, F.D. Perceived usefulness, perceived ease of use, and user acceptance of information technology. MIS Q. 1989, 13, 319–340. [Google Scholar] [CrossRef] [Green Version]
  19. Venkatesh, V.; Morris, M.G.; Davis, G.B.; Davis, F.D. User acceptance of information technology: Toward a unified view. MIS Q. 2003, 27, 425–478. [Google Scholar] [CrossRef] [Green Version]
  20. Fishbein, M.; Ajzen, I. Belief, Attitude, Intention, and Behavior: An Introduction to Theory and Research. Reading; Addison-Wesley: Boston, MA, USA, 1975. [Google Scholar]
  21. Cimperman, M.; Brenčič, M.M.; Trkman, P. Analyzing older users’ home telehealth services acceptance behavior—Applying an Extended UTAUT model. Int. J. Med. Inf. 2016, 90, 22–31. [Google Scholar] [CrossRef] [Green Version]
  22. Šumak, B.; Šorgo, A. The acceptance and use of interactive whiteboards among teachers: Differences in UTAUT determinants between pre-and post-adopters. Comput Human Behav. 2016, 64, 602–620. [Google Scholar] [CrossRef]
  23. Zhou, T.; Lu, Y.; Wang, B. Integrating TTF and UTAUT to explain mobile banking user adoption. Comput. Hum. Behav. 2010, 26, 760–767. [Google Scholar] [CrossRef]
  24. Alawadhi, S.; Morris, A. (Eds.) The Use of the UTAUT Model in the Adoption of E-government Services in Kuwait. In Proceedings of the 41st Annual Hawaii International Conference on System Sciences (HICSS 2008), Waikoloa, HI, USA, 7–10 January 2008. [Google Scholar]
  25. Henzler, M.; Boller, A.; Buchholz, M.; Dietmeyer, K. Are truck drivers ready to save fuel? The objective and subjective effectiveness of an ecological driver assistance system. In Proceedings of the 2015 IEEE 18th International Conference on Intelligent Transportation Systems, Gran Canaria, Spain, 15–18 September 2015. [Google Scholar]
  26. Huang, H.; Ronald, H.; Charles, Z.; Marsha, N. An Evaluation of the Lightguard Pedestrian Crosswalk Warning System; Florida Department of Transportation Safety Office: Tallahassee, FL, USA, 1999.
  27. Ka, D.; Lee, D.; Kim, S.; Yeo, H. Study on the framework of intersection pedestrian collision warning system considering pedestrian characteristics. Transp. Res. Rec. 2019, 2673, 747–758. [Google Scholar] [CrossRef]
  28. Vladyko, A.; Elagin, V.; Rogozinsky, G. Method of early pedestrian warning in developing intelligent transportation system infrastructure. Transp. Res. Procedia 2020, 50, 708–715. [Google Scholar] [CrossRef]
  29. Gavrila, D.M.; Giebel, J.; Munder, S. Vision-based pedestrian detection: The protector system. In Proceedings of the IEEE Intelligent Vehicles Symposium, Parma, Italy, 14–17 June 2004. [Google Scholar] [CrossRef]
  30. Gavrila, D.M. Sensor-based pedestrian protection. IEEE Intell Syst. 2001, 16, 77–81. [Google Scholar] [CrossRef]
  31. Liu, Y.-C. Comparative study of the effects of auditory, visual and multimodality displays on drivers’ performance in advanced traveller information systems. Ergonomics 2001, 44, 425–442. [Google Scholar] [CrossRef] [PubMed]
  32. Sodnik, J.; Dicke, C.; Tomažič, S.; Billinghurst, M. A user study of auditory versus visual interfaces for use while driving. Int. J. Hum. Comput. Stud. 2008, 66, 318–332. [Google Scholar] [CrossRef]
  33. Weinberg, G.; Harsham, B.; Medenica, Z. Evaluating the usability of a head-up display for selection from choice lists in cars. In Proceedings of the 3rd International Conference on Automotive User Interfaces and Interactive Vehicular Applications, Salzburg, Austria, 30 November–2 December 2011. [Google Scholar]
  34. Jakus, G.; Dicke, C.; Sodnik, J. A user study of auditory, head-up and multi-modal displays in vehicles. Appl. Ergon. 2015, 46, 184–192. [Google Scholar] [CrossRef]
  35. Edwards, S.; Emmerson, C.; Namdeo, A.; Blythe, P.; Guo, W. Optimising landmark-based route guidance for older drivers. Transp. Res. Part F Traffic Psychol. Behav. 2016, 43, 225–237. [Google Scholar] [CrossRef] [Green Version]
  36. Madigan, R.; Louw, T.; Wilbrink, M.; Schieben, A.; Merat, N. What influences the decision to use automated public transport? Using UTAUT to understand public acceptance of automated road transport systems. Transp. Res. Part F Traffic Psychol. Behav. 2017, 50, 55–64. [Google Scholar] [CrossRef]
  37. Nunnally, J.C. Psychometric Theory; McGraw-Hill: New York, NY, USA, 1978. [Google Scholar]
  38. Aiken, L.S.; West, S.G.; Reno, R.R. Multiple Regression: Testing and Interpreting Interactions; Sage: London, UK; Newbury Park, CA, USA, 1991. [Google Scholar]
  39. Field, A. Discovering Statistics Using IBM SPSS Statistics; Sage: London, UK, 2013. [Google Scholar]
  40. Osswald, S.; Wurhofer, D.; Trösterer, S.; Beck, E.; Tscheligi, M. Predicting information technology usage in the car: Towards a car technology acceptance model. In Proceedings of the 4th International Conference on Automotive User Interfaces and Interactive Vehicular Applications, Portsmouth, New Hampshire, 17–19 October 2012. [Google Scholar]
  41. Mollenhauer, M.A.; Lee, J.; Cho, K.; Hulse, M.C.; Dingus, T.A. The effects of sensory modality and information priority on in-vehicle signing and information systems. In Proceedings of the Human Factors and Ergonomics Society Annual Meeting, Los Angeles, CA, USA, 1 October 1994; SAGE Publications Sage: Los Angeles, CA, USA, 1994. [Google Scholar]
  42. Politis, I.; Brewster, S.; Pollick, F. Evaluating multimodal driver displays of varying urgency. In Proceedings of the 5th International Conference on Automotive User Interfaces and Interactive Vehicular Applications, Eindhoven, The Netherlands, 28–30 October 2013; ACM Press: New York, NY, USA, 2013. [Google Scholar]
  43. Li, S.; Blythe, P.; Zhang, Y.; Edwards, S.; Xing, J.; Guo, W.; Ji, Y.; Goodman, P.; Namdeo, A. Should older people be considered a homogeneous group when interacting with level 3 automated vehicles? Transp. Res. Part F Traffic Psychol. Behav. 2021, 78, 446–465. [Google Scholar] [CrossRef]
  44. Li, S.; Blythe, P.; Guo, W.; Namdeo, A. Investigation of older driver’s takeover performance in highly automated vehicles in adverse weather conditions. IET. Intell. Transp. Syst. 2018, 12, 1157–1165. [Google Scholar] [CrossRef] [Green Version]
  45. Li, S.; Blythe, P.; Guo, W.; Namdeo, A. Investigating the effects of age and disengagement in driving on driver’s takeover control performance in highly automated vehicles. Transp. Plan. Technol. 2019, 42, 470–497. [Google Scholar] [CrossRef]
  46. Li, S.; Blythe, P.; Edwards, S.; Goodman, P.; Hill, G. Investigation of the influence of multitasking on drivers’ takeover performance in highly automated vehicles. In Proceedings of the 26th Intelligent Transport Systems World Congress, Singapore, 21–25 October 2019. [Google Scholar]
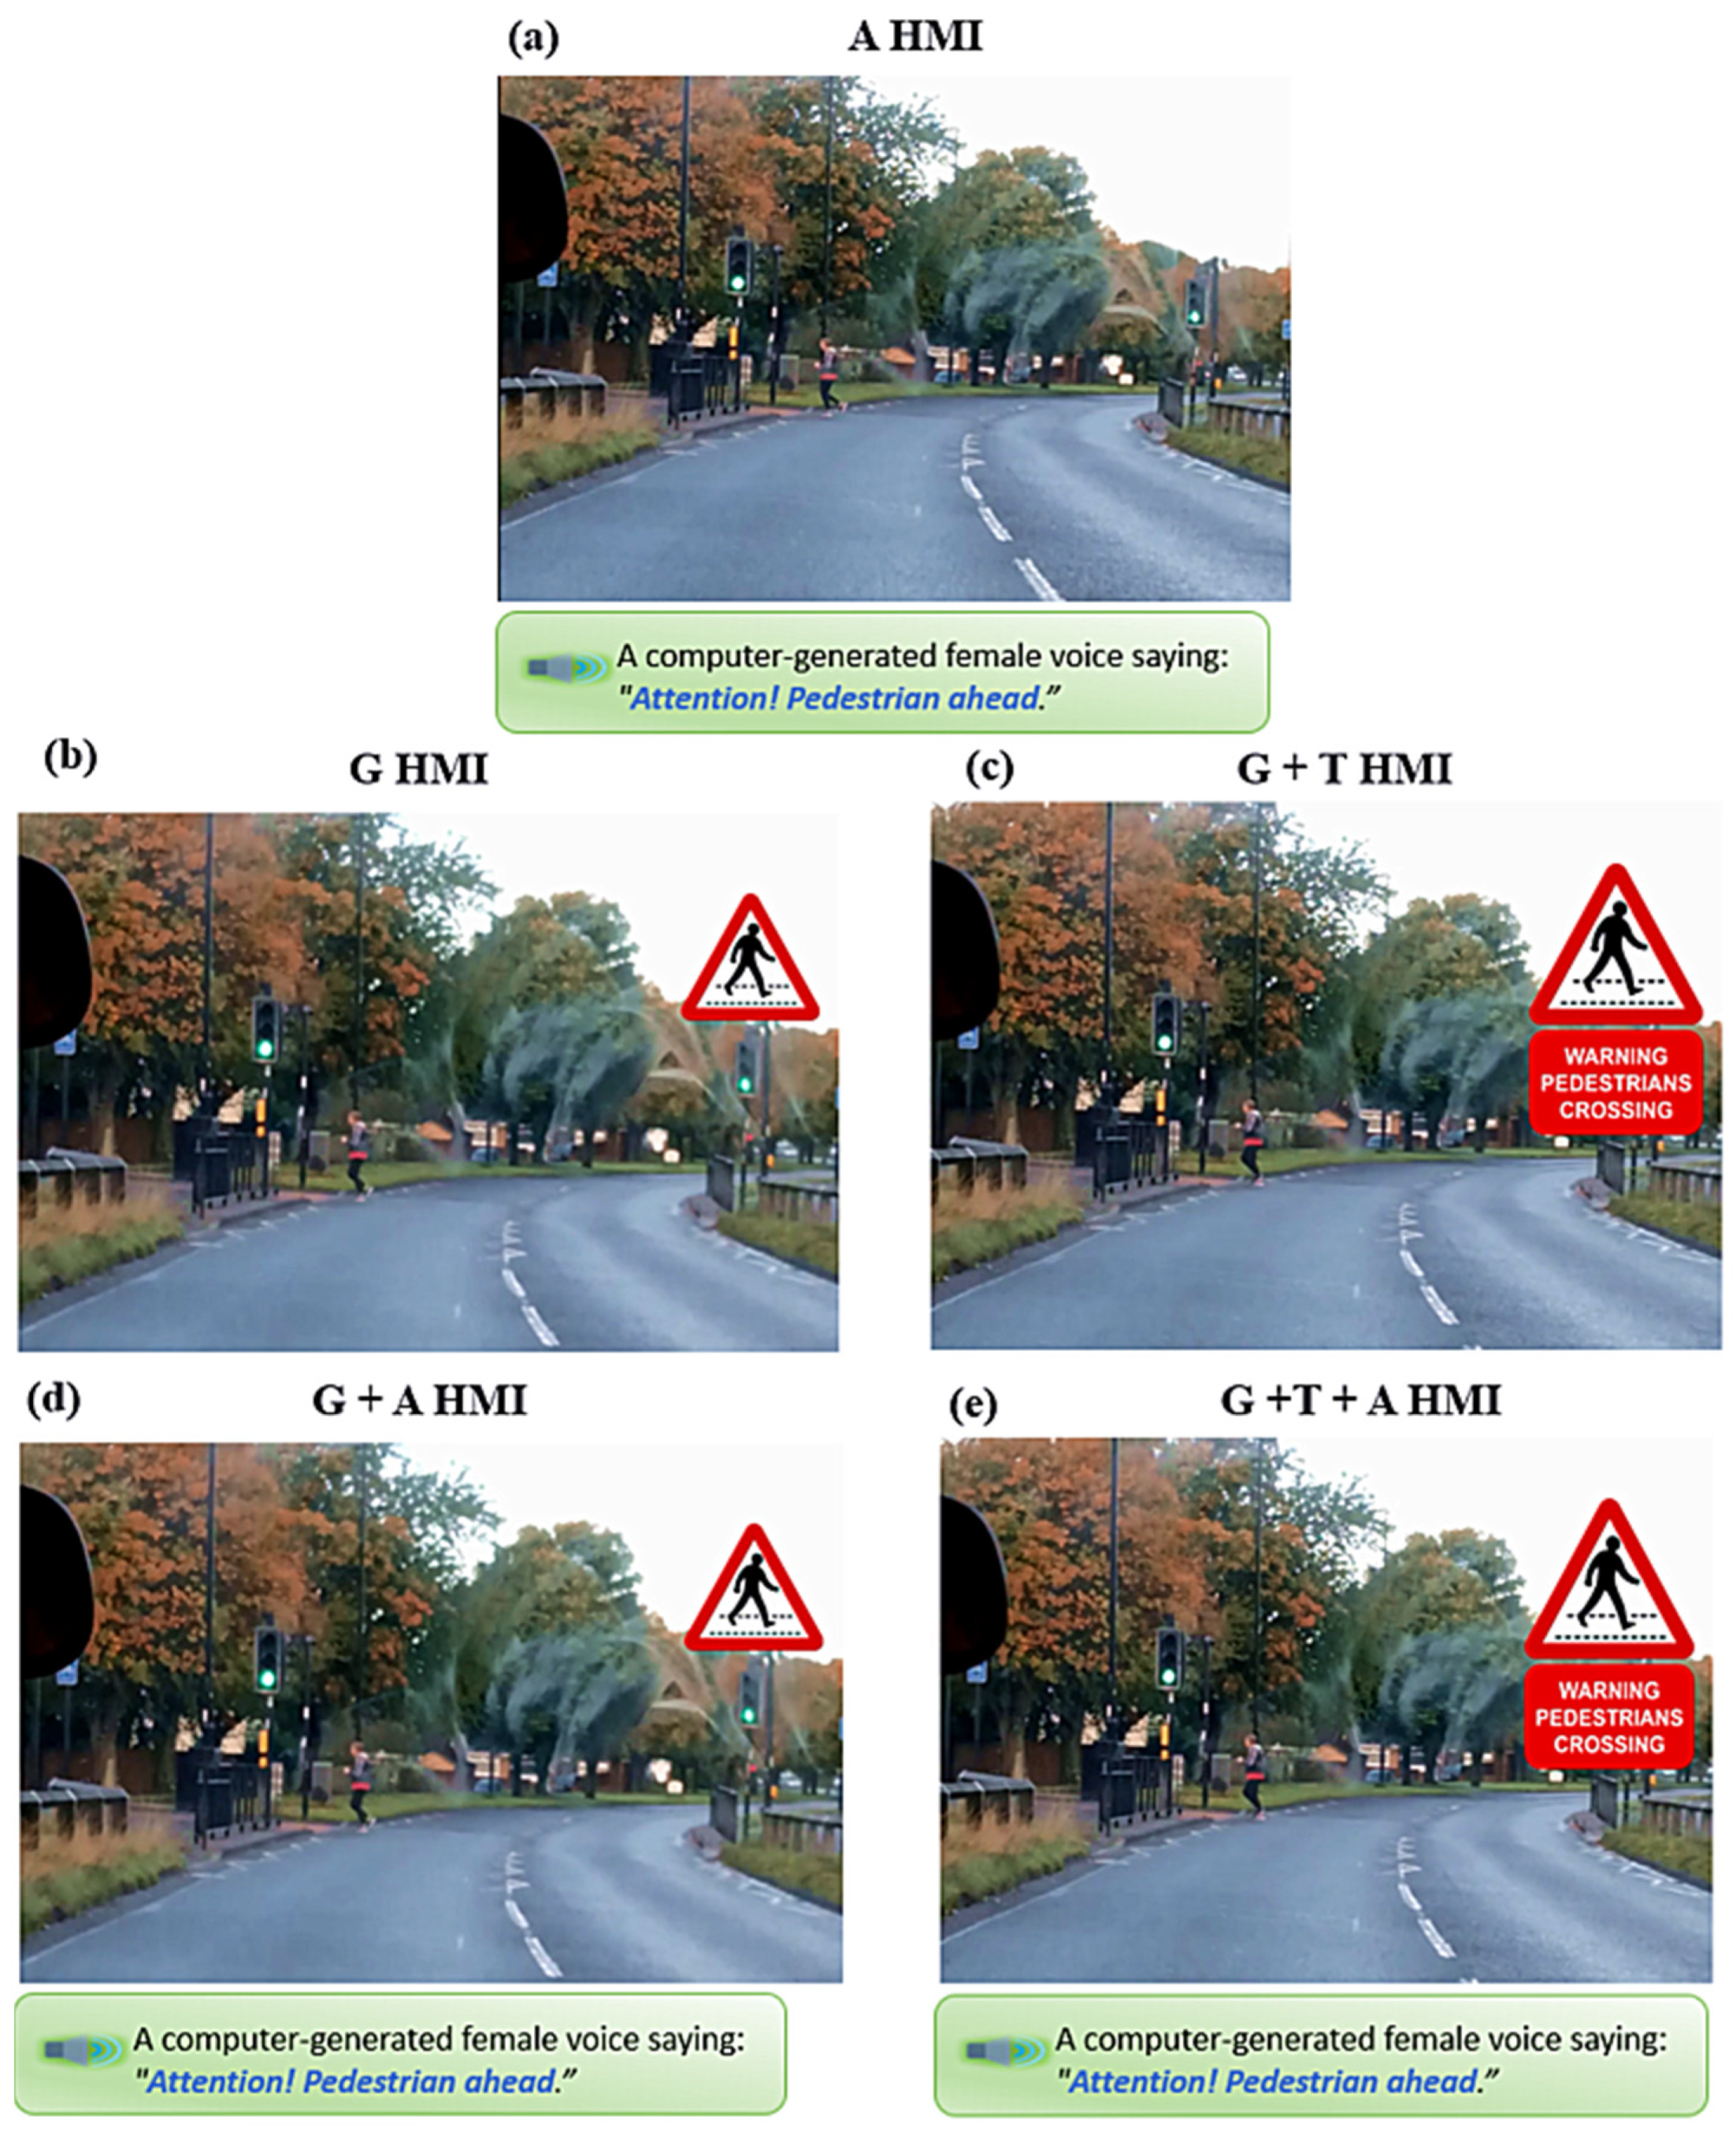
Figure 1. Research model of UTAUT, as adapted from Venkatesh and Morris [19].
Sustainability 14 02787 g001
Figure 2. Illustration of WSP HMI: (a) auditory HMI; (b) graphical HMI; (c) graphical with textual HMI; (d) graphical with auditory HMI; (e) graphical with textual plus auditory HMI.
Sustainability 14 02787 g002
Figure 3. Participants’ attitudes towards different types of WSP-HMIs, * p < 0.05.
Sustainability 14 02787 g003
Table 1. Technical description of WSP designs.
HMI ModalityType of HMIVisual ElementAuditory ElementDescription
Auditory HMI
(A HMI)
Single-modalN/AComputer Generated Voice Message (2000 Hz, 75 dB)First-view driving footage integrated with a warning sound.
Graphical Sign HMI
(G HMI)
Single-modalRed Graphical SignN/AFirst-view driving footage integrated with a pedestrian crossing warning sign.
Graphical Sign + Textual HMI
(G + T HMI)
Single-modalRed Graphical Sign + TextN/AFirst-view driving footage integrated with a pedestrian crossing warning sign and a warning legend below the sign.
Graphical Sign + Auditory HMI
(G + A HMI)
Multi-modalRed Graphic SignComputer Generated Voice Message (2000 Hz, 75 dB)First-view driving footage integrated with a pedestrian crossing warning sign and a warning sound.
Graphical Sign+ Textual + Auditory HMI
(G + T + A HMI)
Multi-modalRed Graphic Sign + TextComputer Generated Voice Message (2000 Hz, 75 dB)First-view driving footage integrated with a pedestrian crossing warning sign, a warning legend below the sign, and a warning sound.
Table 2. Questionnaire items.
Construct aAdopted Item b
Performance expectancy (PE): the degree to which individuals believe that using WSP will help them increase their driving performance
PE1I would find the system useful in my driving.
PE2Using the system would enable me to react to unsafe driving conditions more quickly.
PE3Using the system would improve my driving performance.
PE4Using the system, my risk of being involved in an accident would decrease.
Effort expectancy (EE): the degree of ease associated with the use of a WSP
EE1I found the system to be clear and understandable.
EE2I would quickly get used to operating the system.
EE3I would find the system difficult to use.
EE4I would find the system a distraction whilst driving.
Social influence (SI): the degree to which individuals perceive that important others (e.g., family, friends, and colleagues) believe that they should use WSP
SI1I would use the system if it was recommended by a trusted friend or family member.
SI2I would use the system if it was recommended by a trusted agency (e.g., police or motoring authority such as the AA).
SI3I would use the system if it was recommended by an authority (e.g., by your insurance company).
SI4In general, the authority would support the use of the system.
Facilitating conditions (FCs): technical support for using a WSP system
FC1I feel I have the understanding necessary to use the system.
FC2I believe guidance will be available to me when deciding whether to use the system.
FC3I believe specific persons (or a group) will be available for assistance with system difficulties.
Behavioural intentions (BIs)
BI1If my car is equipped with a similar system, I predict that I would use the system when driving.
BI2Assuming that the system is available, I intend to use the system regularly when I am driving.
BI3Assuming that I had access to the system, I predict that I would use it in the future.
a UTAUT construct definitions were adapted from Venkatesh and Morris [19]. b Questionnaire items were adapted from Venkatesh and Morris [19], Adell [16], Rahman and Lesch [17], and Madigan and Louw [36].
Table 3. Characteristics of WSP HMI.
ConstructItemFactor LoadingCronbach’s Alpha α
Performance expectancy (PE)PE10.8170.933
PE20.644
PE30.921
PE40.943
Effort expectancy (EE)EE10.7890.708
EE20.669
EE30.978
EE40.723
Social influence (SI)SI10.4640.896
SI20.615
SI30.605
SI40.681
Facilitating conditions (FCs)FC10.8780.889
FC20.859
FC30.836
Behavioural intentions (BIs)BI10.8220.944
BI20.926
BI30.818
Table 4. Correlations between PE, EE, SI, FC and BI.
FactorsPEEESIFCBI
PE10.657 ***0.777 ***0.621 ***0.866 ***
EE0.657 ***10.702 ***0.594 ***0.695 ***
SI0.777 ***0.702 ***10.700 ***0.767 ***
FC0.621 ***0.594 ***0.700 ***10.632 ***
BI0.866 ***0.695 ***0.767 ***0.632 ***1
***p < 0.001.
Table 5. Results of hierarchical multiple regression.
StepIndependent VariableStep1 βStep2 β R 2 R 2
1Performance expectancy0.626 ***0.648 ***0.7880.788
Effort expectancy0.158 *0.141 *
Social influence0.1280.107
Facilitating conditions0.0600.071
2Age −0.0200.7770.001
Gender 0.010
Experience −0.040
*p < 0.05, *** p < 0.001.
Publisher’s Note: MDPI stays neutral with regard to jurisdictional claims in published maps and institutional affiliations.

