3.2. Physico-Chemical Parameters of Megech River
The overall assessment of physico-chemical water quality parameters (
Table 2) showed significant spatial variations (
p < 0.05). Change in physico-chemical parameters of water such as temp, DO, pH and EC had the potential to influence biogeochemical processes such as sorption, precipitation and solubility of metals in the water column [
1,
24,
38]. The mean surface water temperature ranged from 16.9 to 24.9 °C with an increasing trend from M1 to M6 and was within the normal environmental temperature range of 21–27 °C in the area [
29]. Similarly, the observed maximum surface water temperature in this study also falls within the range (25–35 °C) for natural inland water bodies in the tropics [
39]. Significant spatial variations observed along the course of the river could be ascribed to canopy cover of vegetation, amount of sunlight, sampling time of the day, substrate composition and heat exchange with the inflow and atmosphere [
40].
The observed pH values measured in the water samples were slightly alkaline, ranged from 8.3 to 8.7, and still fell within the acceptable limits of the following different guidelines for drinking (6.5–9.2), livestock watering and irrigation (6.5–9.0) of inland water bodies [
41,
42,
43,
44]. The slightly alkaline nature of Ethiopian inland water bodies had been reported by Kassa [
45], Mengesha et al. [
46] and Wondimu [
24], who disclosed a pH of 8.92, 8.2 and 8.4 in littoral area of Lake Tana, Angereb reservoir and Megech River mouth, respectively. The slightly alkaline pH could be attributed to the highest carbonate and bicarbonate depositions in the region [
41,
42]. DO in the present study ranged between 7.5 and 9.9 mg L
−1 and was higher than the WHO minimum acceptable limits for aquatic life and domestic use [
43,
47,
48]. The highest DO value measured at site M1 might indicate relatively low anthropogenic influence and higher atmospheric diffusion. However, the slight decline in the downstream could be associated with the possible entry of oxygen-demanding wastewater from surface runoff and agricultural fields, which promote microbial decomposition [
1,
41,
49].
The Kruskal–Wallis nonparametric ANOVA showed a significant spatial difference (
p < 0.05) in EC along the river stretch. The maximum EC measured at site M2 (658.4 µS cm
−1) is an indicator for high concentrations of metallic ions or dissolved solids derived from domestic and industrial effluent of Gondar and Azezo towns that enhance ionization of most chemical compounds [
1,
39,
45]. It could possibly be associated with excavation and sand-mining activities, which allow soil particle to dissolve. Conversely, the minimum EC across Megech River was measured at M6, and it could be attributed to filtration and absorption of metal ions by water hyacinth and other aquatic macrophytes [
50,
51]. Maximum EC observed at site M2 was still within the WHO (2011) acceptable limit of 2500 µS cm
−1 for natural inland waters. Turbidity, which is the measure of water clarity, ranged from 52.7 (M6) to 575.0 (M5) NTU along the course of Megech River. The observed higher turbidity at M5 can be attributed to surface runoff and poor farming practice which provoke surface soil erosion [
24,
45]. Similarly, direct untreated effluent discharge into the river and huge sand-mining activities together with surface runoff due to precipitation seriously influence turbidity of aquatic systems [
39].
3.3. Dissolved Heavy Metals Concentrations in Megech River Water
The mean concentration of all dissolved heavy metals analyzed from water samples of the Megech River are presented in
Table 3. There is no significant upstream–downstream trend in terms of heavy metal content in water samples of the Megech River, resulting in varying concentrations among sampling sites. The mean concentrations of heavy metals from water samples decreased in the order of Fe > Mn > Cu ≈ Zn > Pb >Cr > Cd. Among the seven heavy metals of concern, Fe and Mn, which may have originated from both natural and anthropogenic sources, were prevalent in all water samples ranging from 2.5 to 7.6 mg L
−1 and 0.86 to 4.3 mg L
−1, respectively, and were above the maximum permissible limit of standards for drinking water (
Table 4). In Ethiopian context particularly in Megech River catchment, urbanization, unbalanced environmental protection together with rapid population growth resulted in limited availability of clean and sanitated potable water where the majority of the population depends on using untreated river water for domestic consumption [
25]. Therefore, higher concentration of Fe and Mn in drinking water can bring bad taste and result in different health-related problems such as fatigue, joint pain, tremor, gait disorders, psychological problems and heart diseases [
39,
51]. Apart from the anthropogenic sources, higher Fe and Mn concentrations could be attributed to the soil geology of the area. Domestic wastewater contaminated with potassium permanganate used as a common household disinfectant might also increase Mn concentration [
13].
Concentrations of most common metals in the Earth’s crust especially, Cu (0.11 to 0.17 mg L
−1) and Zn (0.11 to 0.16 mg L
−1) in the water, did not show significant spatial difference (
p > 0.05) and remained below the maximum permissible limits of standards for drinking, irrigation and animal watering [
41,
42,
43]. This is in contrast with previously stated severe anthropogenic activities along the course of the river and is probably associated with low solubility of metals together with the mineral nature of the sediment which leads to adsorption [
52] and the absorption of metals by aquatic macrophytes and other riparian vegetation [
4,
53,
54]. In natural waters, Cu and Zn appear during the dissolution of minerals due to redox condition. Cu and Zn are among the essential trace metals and have an important role in the proper functioning of body physiology. However, when consumed in excess, they cause gastrointestinal and cardiac toxicity [
52].
The result of the present study disclosed that the presence of Cr and Cd at site M5 and M6, and of Pb at site M5, were not detected in the water sample (
Table 4). These undetected amounts observed in the downstream section could be attributed to dilution effect by the high volume of water that masks the local concentration [
14,
54] and because of the meager solubility of metals due to the formation of complex compounds that bind with organic matter [
1]. Although the downstream section receives a continuous input of domestic and industrial wastewater effluents, relatively lower concentrations of heavy metals possibly might be due to absorption by water hyacinth and other riparian aquatic macrophytes which have a tremendous role in wastewater purification [
54]. On the other hand, there was no appreciable amount of Cd and Pb detected at any of the sampling sites, but concentrations remained above threshold concentrations for drinking water when detected (
Table 4). Chronic exposure of humans to any concentrations of Cr, Cd and Pb leads to several health-related disorders. Higher concentrations of Cd and Pb in aquatic systems could be found adsorbed onto organic substances including humic and detritus materials. Therefore, organic rich untreated domestic and industrial wastewaters coming from the highly populated Megech river catchment could be main sources [
52]. In addition, the observed high concentrations of Cd and Pb could be associated with leachates, discarded batteries from garages, car washings and sewages [
11].
Generally, concentrations of heavy metals found in the present study are lower than reported values from other Ethiopian inland water bodies [
1,
4,
5,
36]. However, concentrations of Fe, Mn, Cd and Pb exceeded permissible limits of different standards [
41,
42,
43] for domestic use. Hence, unless immediate management intervention and monitoring takes place, those metals that surpassed the guideline values could possibly cause health related problems in the vicinity. Because in the downstream section the water from Megech River is used for household consumption, animal watering and irrigation purposes, alarming toxicities associated with low IQ, kidney disorders, high cancer prevalence and teratogenic impacts might occur soon [
8,
13,
52].
3.4. Heavy Metals Concentrations in the Surface Sediment of Megech River
Distributions of heavy metals in the sediment of Megech River were significantly higher (
p < 0.01) than the heavy metals concentration in the surface water samples of the same site (
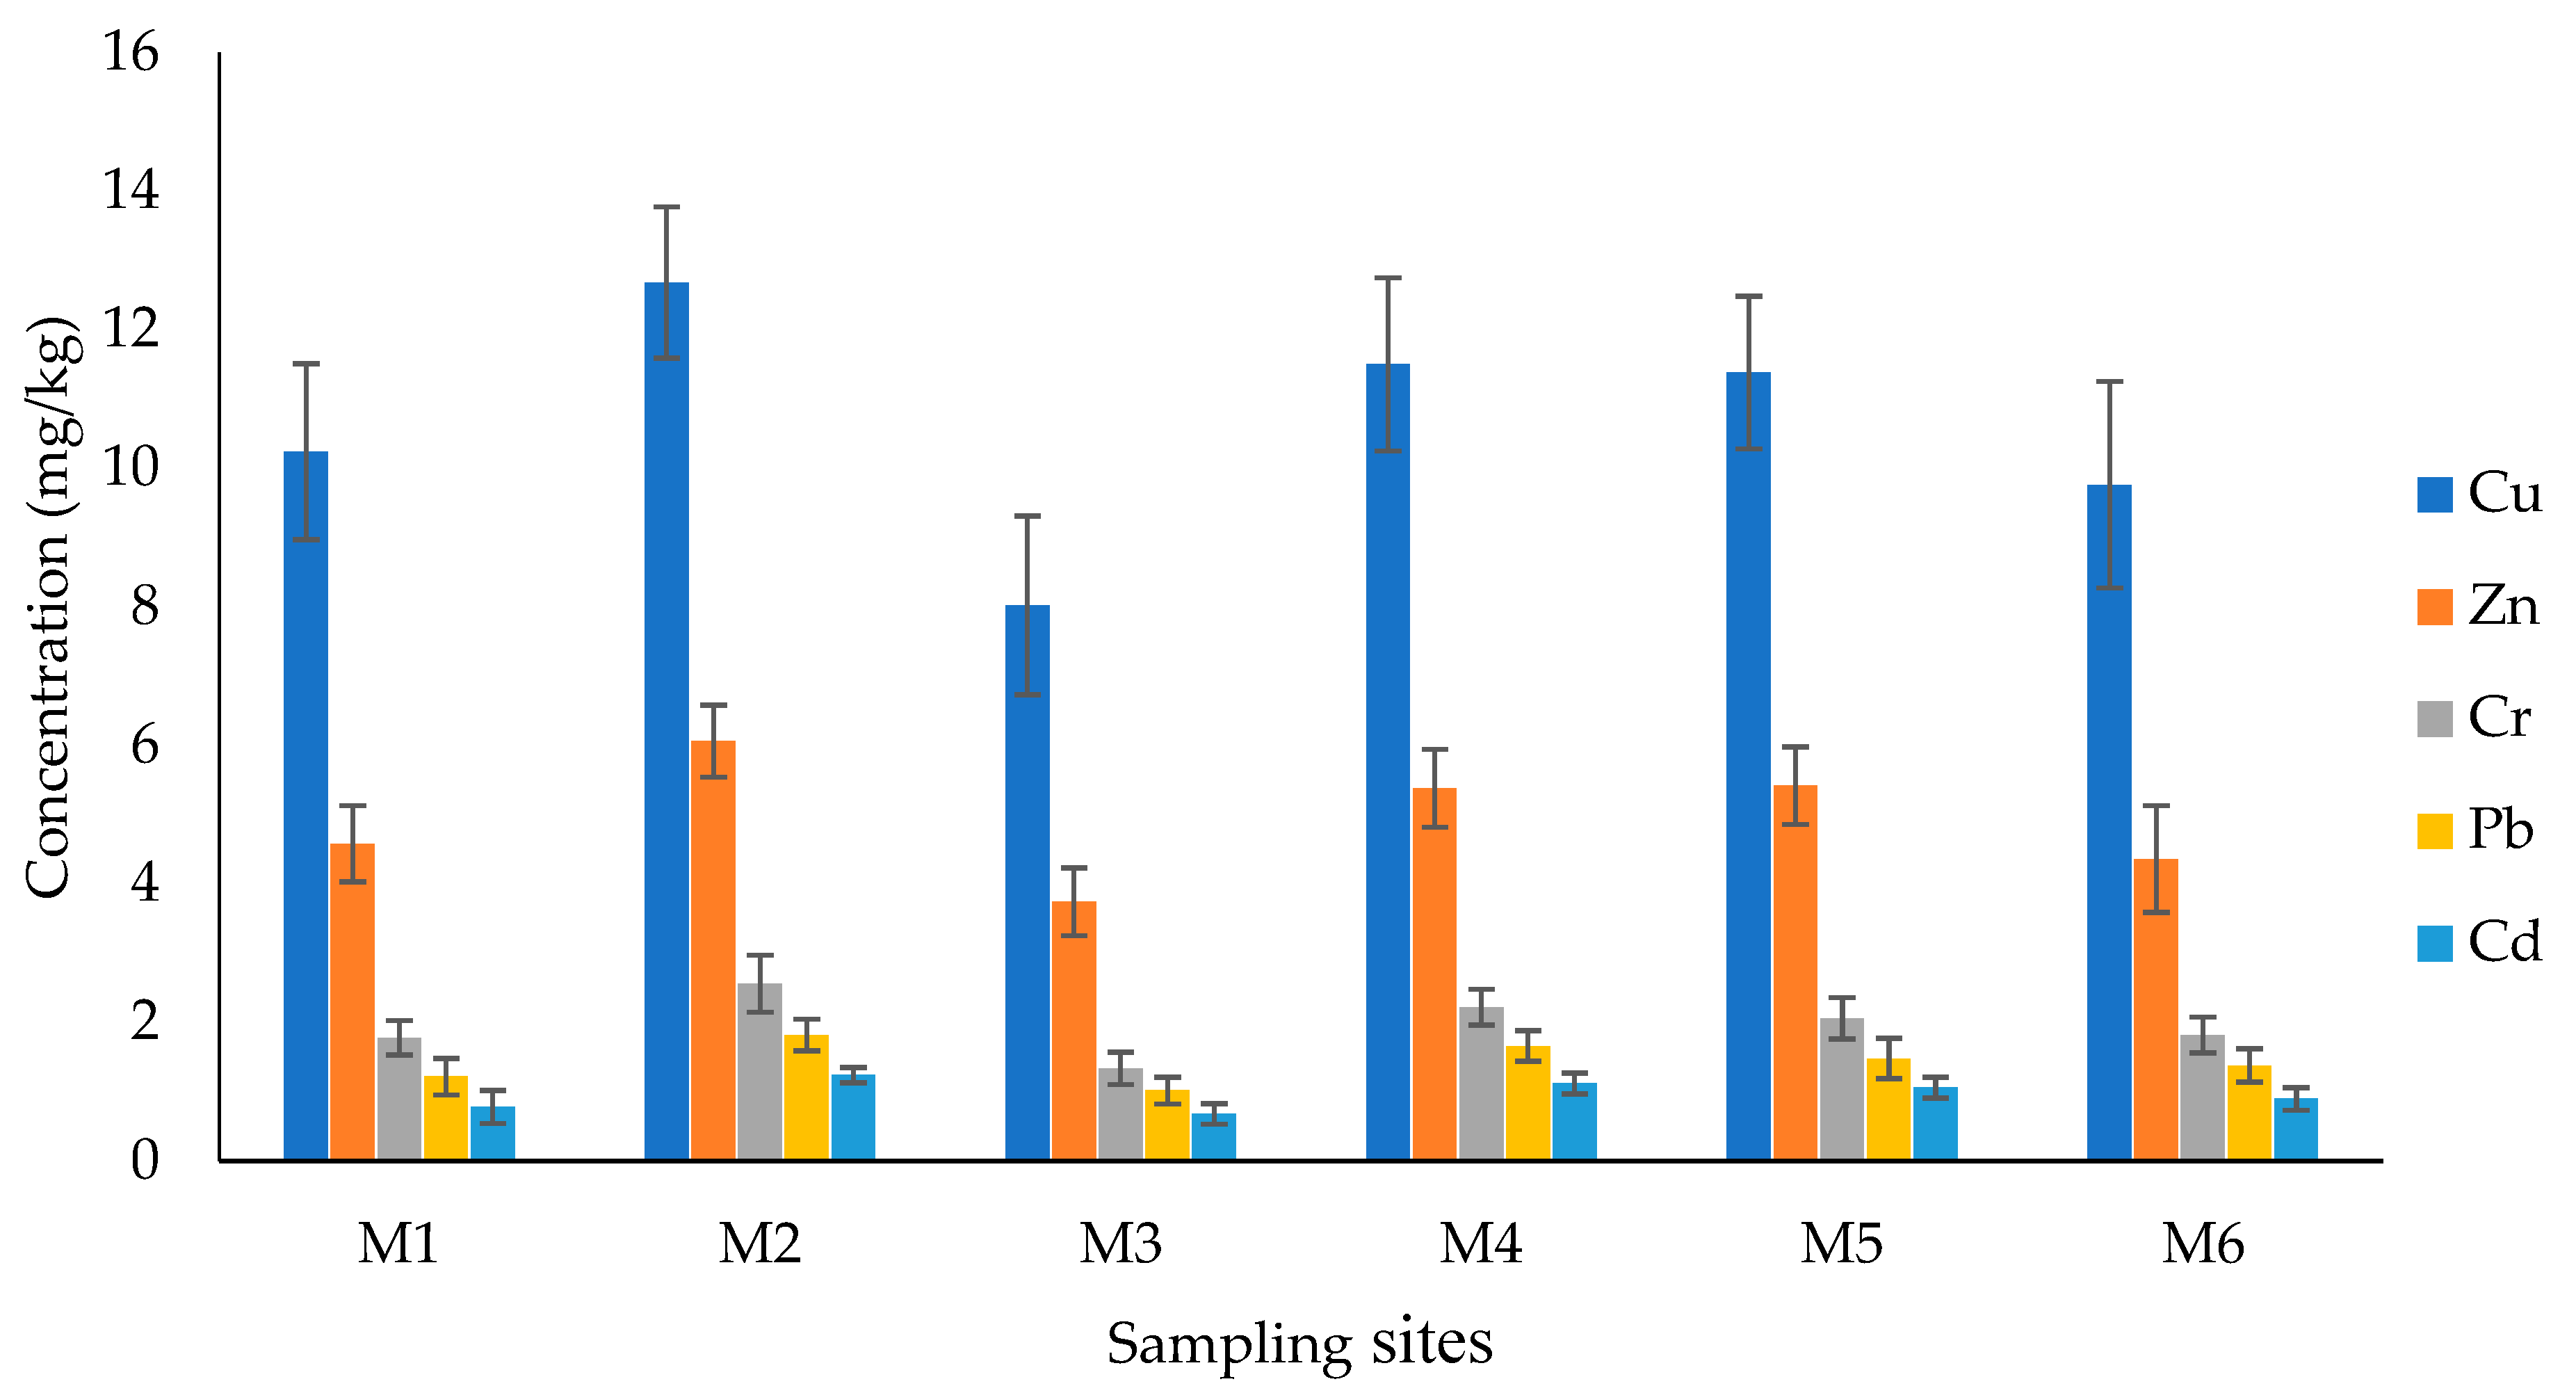
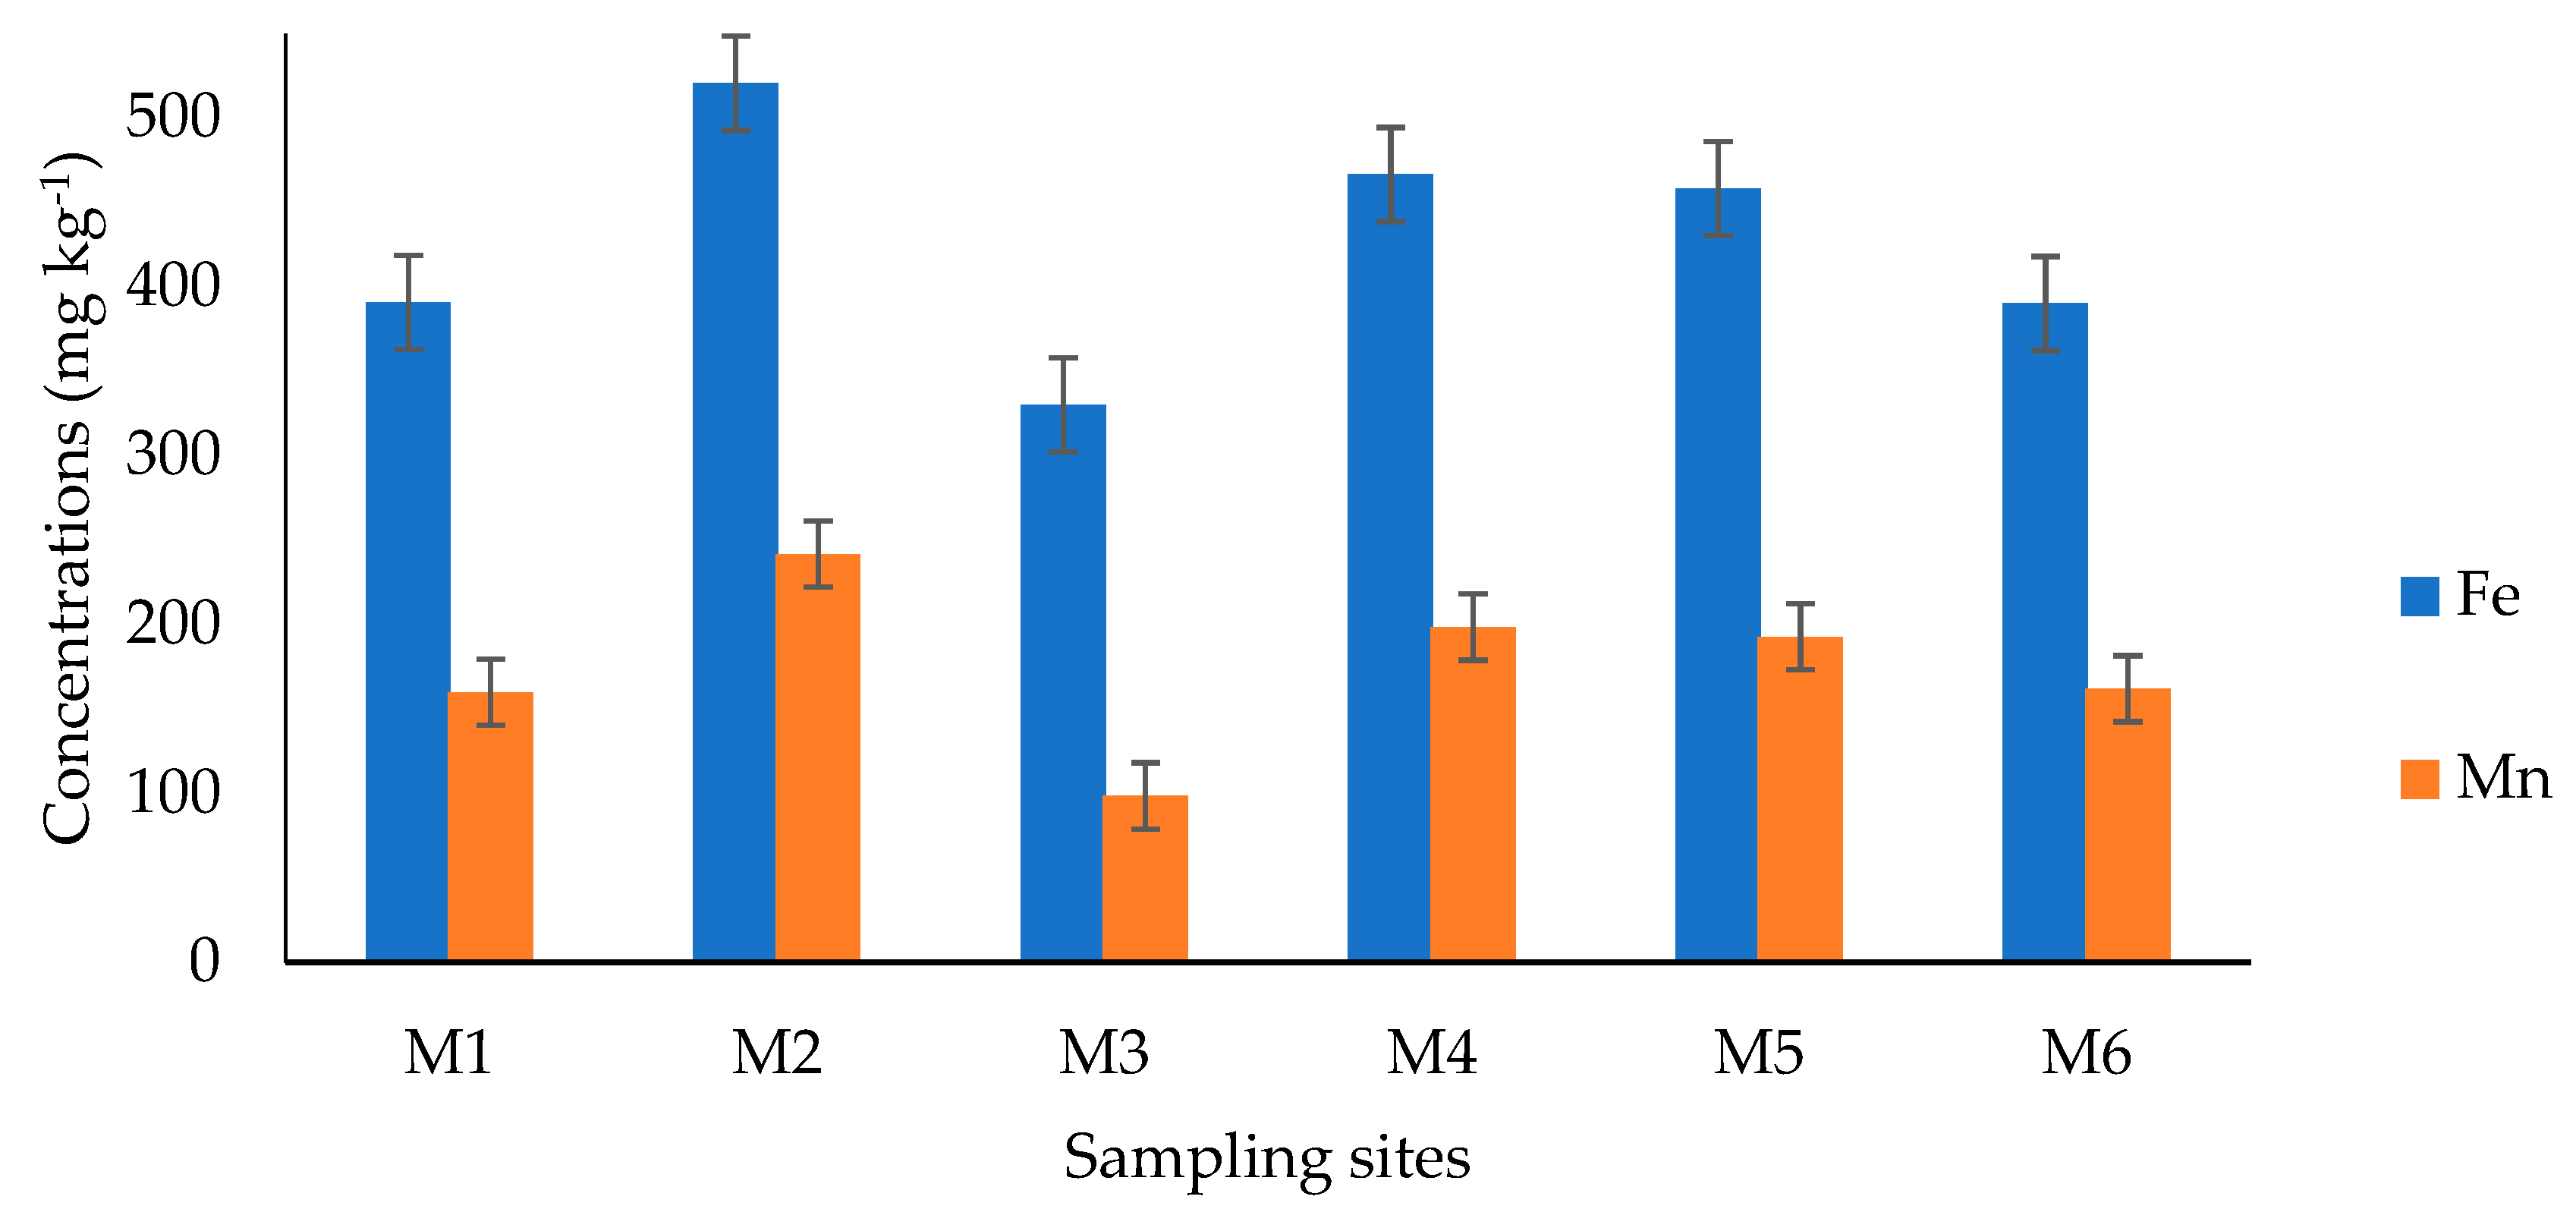
Table 3). Concentrations ranged from 330.1 to 520.6 mg kg
−1 for Fe, 98.6 to 241.8 mg kg
−1 for Mn, 8.02 to 12.68 mg kg
−1 for Cu, 3.74 to 6.06 mg kg
−1 for Zn, 1.34 to 2.56 mg kg
−1 for Cr, 0.68 to 1.24 mg kg
−1 for Cd and 1.02 to 1.82 mg kg
−1 for Pb. All the heavy metals analyzed from sediment samples followed the same decreasing order of abundance Fe > Mn > Cu > Zn > Cr > Pb > Cd from upstream to downstream in all sampling sites (
Figure 2 and
Figure 3).
The highest concentrations of all heavy metals, especially Fe and Mn (
Figure 3), analyzed from sediment samples were measured at site M2. This could be ascribed to geological presence and intensive anthropogenic activity including excavation, metal work effluents, garages and open burning of municipal solid waste [
4,
55,
56]. Additionally, other factors including grain size and organic matter content of the sediment also highly affect heavy metals concentrations [
1,
57]. For example, higher organic matter content and fine-grained sediment resulted in higher adsorption of heavy metals than organic poor and coarse-grained sediments. The statistically significant spatial differences (
p < 0.05, Kruskal–Wallis test) in heavy metal concentrations between site M2 and M3 could be attributed to factors including hydrological conditions of the river, chemical characteristics of the element and distance of the metal source and to the site [
55].
Concentrations of other toxic heavy metals such as Cu, Zn, Cr, Cd and Pb in the sediment of Megech River were generally higher than the water and did not show consistent upstream–downstream trend. This might be due to variation in availability of point and nonpoint sources of pollutants which is dependent on the association of sediment compounds and metals [
1]. In aquatics systems, sediments act as a ready sink or source for heavy metals which can easily disclose the historical pollution trend of the system and the catchment [
1,
4,
15]. In general, lower concentrations of heavy metals were noted in the present study compared to earlier reports from different inland water bodies of Ethiopia such as Lake Awassa, Awash and Akaki rivers [
1,
4,
5]. These heavy metals might form complexes with other organic compounds, making them stable, or heavy metals might have been transported into the downstream section [
55].
The mean geo-accumulation index for the extent of heavy metal contamination in the sediment samples suggests that Megech River is unpolluted (Igeo < 0) with Cu, Zn and Cr, whereas Mn and Pb are in the range of unpolluted to moderately polluted (0 < Igeo < 1). The index suggests that the river is moderately polluted with Fe and Cd (1 < Igeo < 2). Apart from being abundant in the earth’s crust, geo-accumulations of Fe and Mn in the sediment of Megech River are influenced by anthropogenic activities. Dumping of sewage sludge and domestic wastes were the major anthropogenic activities along the course of the river [
36]. Contaminations of the sediment sample in Megech River was detected at none to medium (0–1) level for Cu, Zn and Cr; at moderate level (2) for Mn and Pb; and at moderate to strong contamination (3) for Fe and Cd. The Cf may be sequenced as Cd > Fe > Pb > Mn > Cu > Cr according to the lithologic background values. Contaminations of Cu, Zn, Fe and Mn ascribed with anthropogenic activities such as fertilizers and pesticides [
16]. The overall
PLI values from the sediment indicated slight heavy metal pollution (1 ≤
PLI < 2) at each sampling site along the course of the river with the highest value observed at M2.
In order to describe the current pollution status of the systems and their effects on organisms, concentrations of heavy metals from the Megech River were compared with sediment quality guidelines (SQG, mg kg
−1) for freshwater systems and other previous reports from different Ethiopian inland water bodies (
Table 5). The result indicated that heavy metal levels were lower than the threshold effect concentrations (TEC) and the probable effect concentrations (PEC) [
1,
4,
14]. However, concentrations of heavy metals can easily become higher than the source through gradual accumulation or magnification [
58]. In developing countries like Ethiopia where untreated industrial effluents are major sources of pollution to inland waters, continuous and strict measures should be implemented before the situation worsens and affects biota of the catchment.
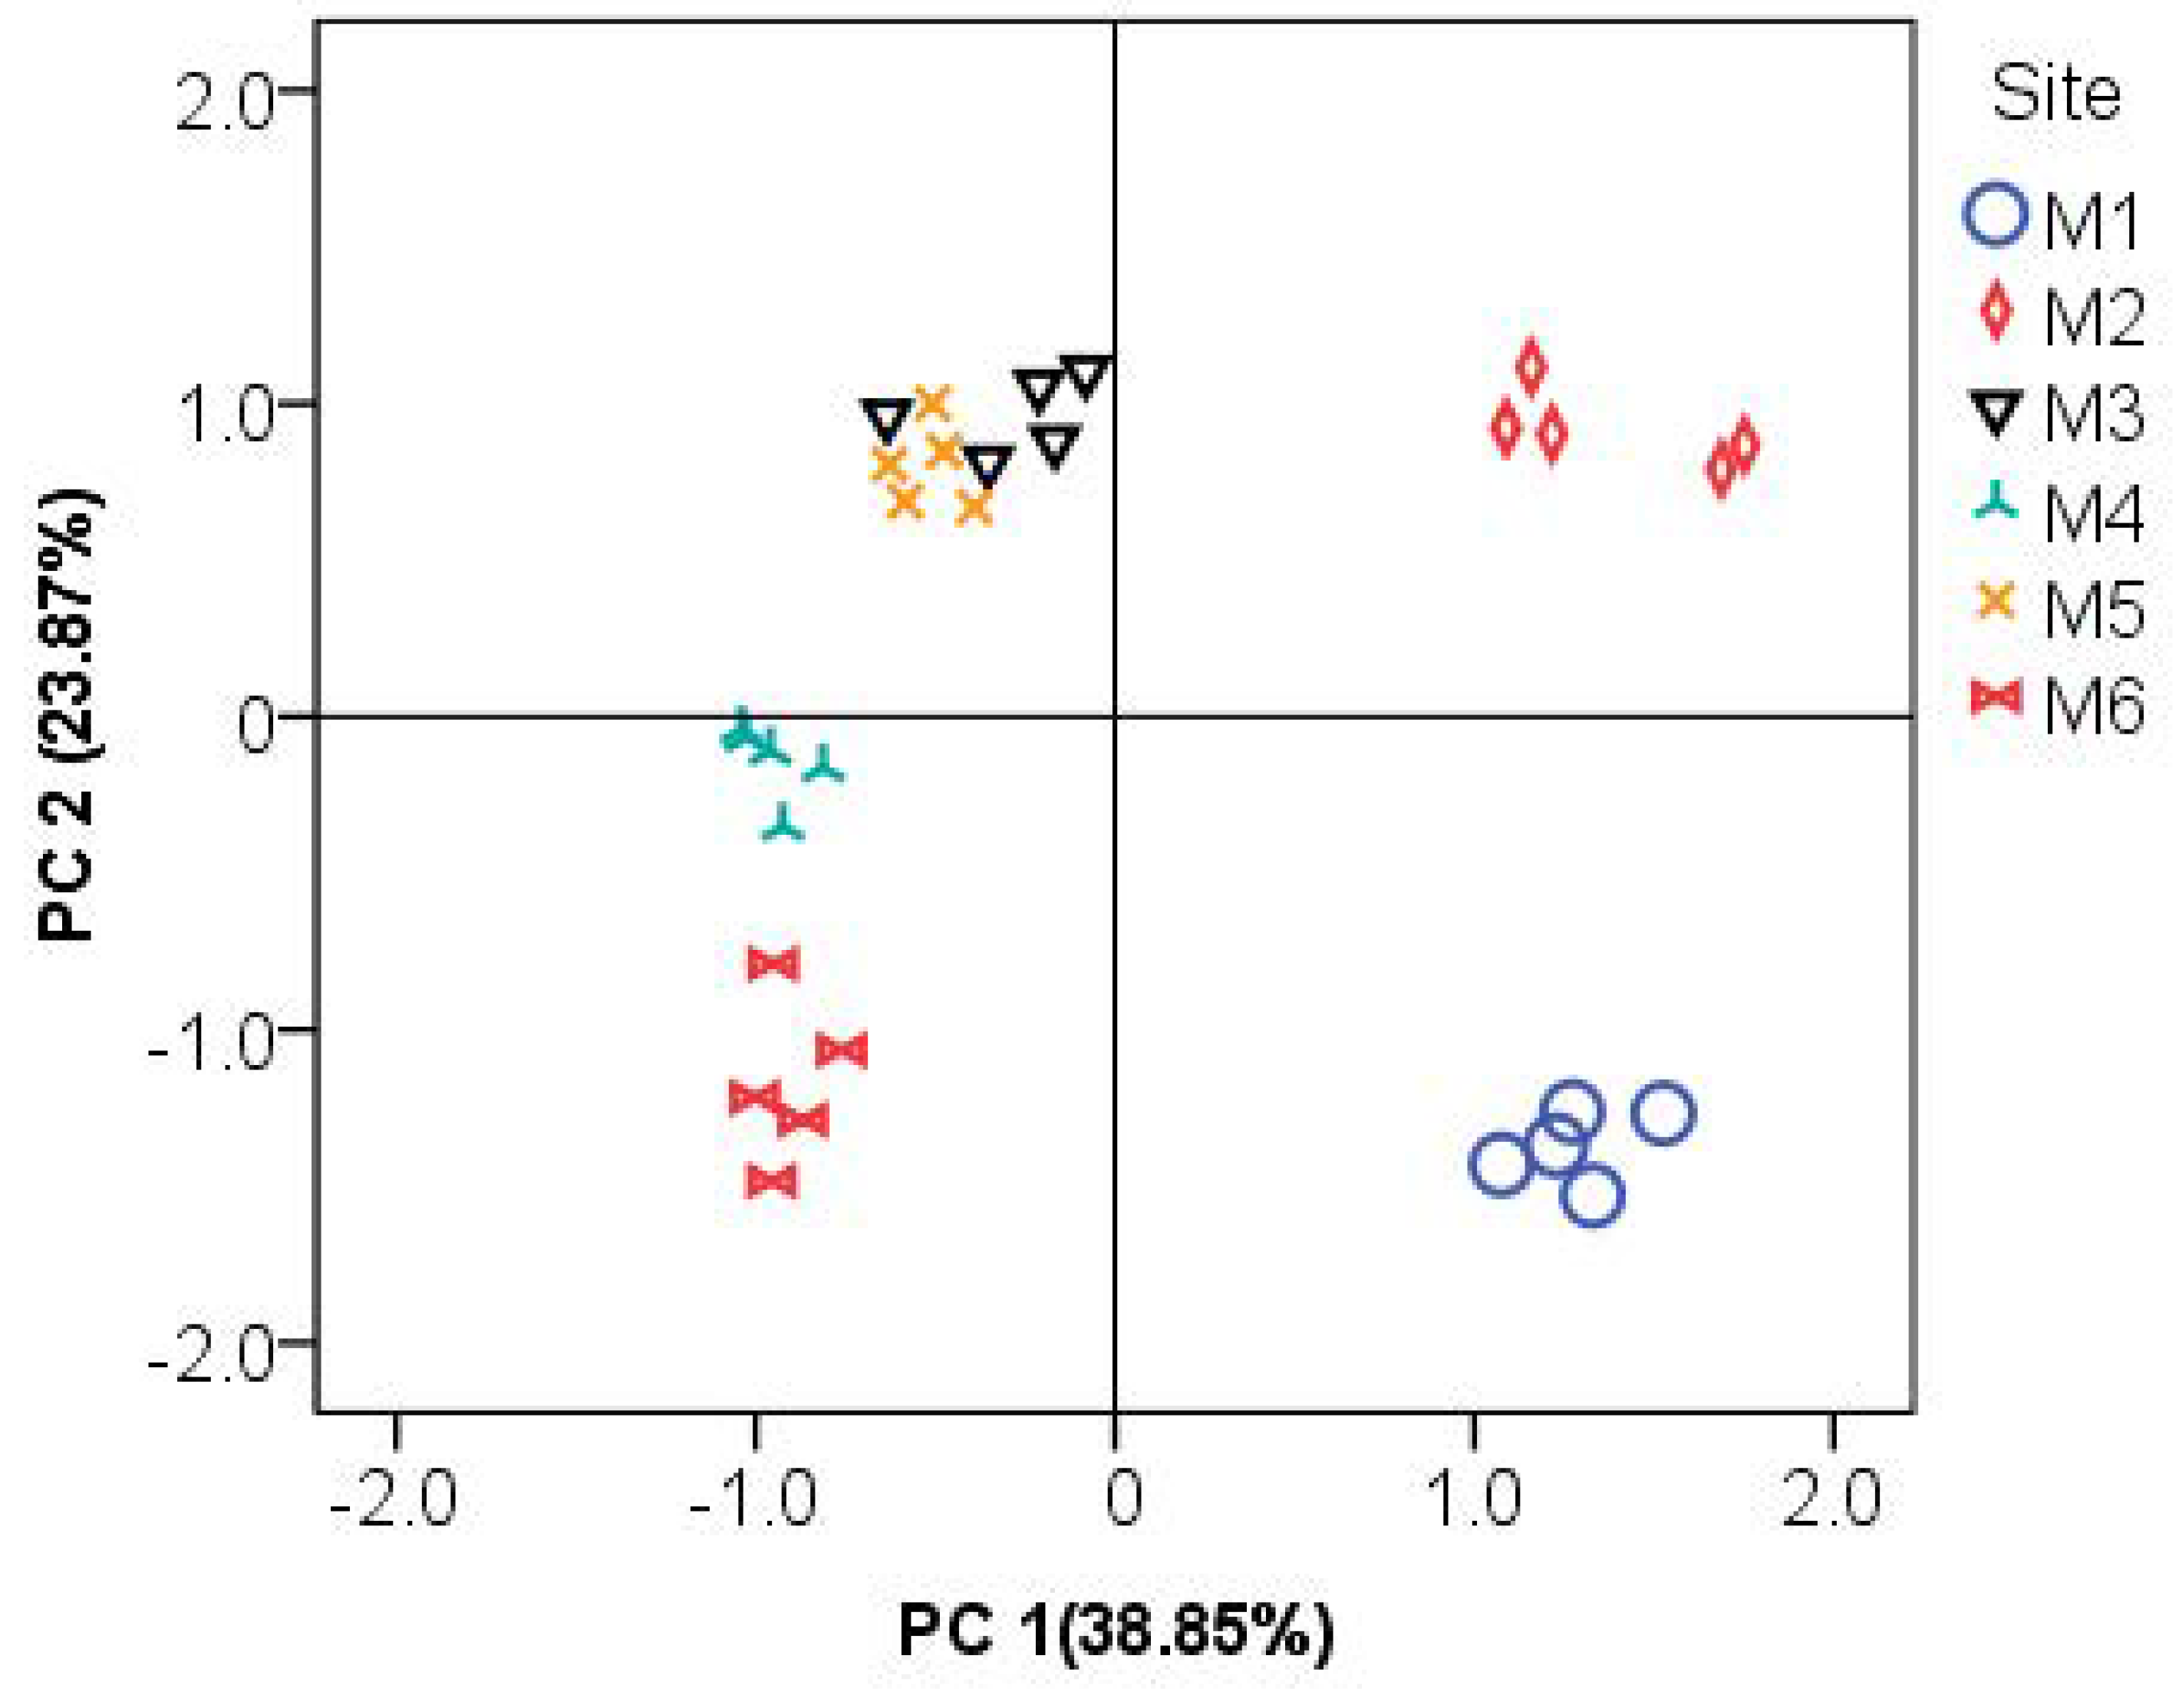
3.6. Principal Component Analysis
To reduce the number of observable variables and to infer the most probable source of heavy metal contamination which could either be anthropogenic or natural [
13,
54], a principal component analysis (PCA) was computed by combining all the physico-chemical parameters and heavy metals concentrations from both water and sediment samples. The output of PCA indicated that four principal components explained 85.45% of the total variance extracted at eigen values > 1. Total variation by each component includes PC1 = 38.85%, PC2 = 23.87%, PC3 = 12.69% and PC4 = 10.04%. Score plot of the combined PC indicated spatial heterogeneity of water and sediment samples (
Figure 4), which could be highly influenced by several point and nonpoint sources such as geochemical composition of the drainage basin, land use and land cover of the surrounding and anthropogenic activities in the vicinity [
59,
60,
61].
In the present study, loading values |>0.5| are considered as most important to the variation. PCA depicted spatial variability of sites owing to higher values of Mn-s (Mn in the sediment), Fe-s (Fe in the sediment) and Zn-s (Zn in the sediment) which had higher loading factors on the first axis. The second component PC2 was mainly explained by some environmental variables from the water (Mn-w, Tur and pH). Eigenvalues, proportions of variance, and loadings for the PC are given in
Table 7.


