1. Introduction
The main parameter that measures the quality of vehicular flow in a roadway is the level of service (LOS), which depends on the following indicators:
Q (vehicles flow) = vehicles/h;
V (average outflow speed) = km/h;
D (density) = Q/V;
C (capacity) = maximum vehicle flow for a fixed period in a lane section.
Considering a motorway road section with fixed lane width and numbers, the increase of vehicle flow over certain thresholds induces a decrease of the speed until critical congestion when the traffic conditions are close to the section capacity [
1].
In such a situation, the traditional required solution is the increase in the number of lanes, but it cannot always be carried out for many reasons, including economic and roadway constraints. Lane management is a solution that allows increasing a road section’s capacity without making significant infrastructural interventions, minimizing the economic and environmental impact.
Figure 1 shows the historical evolution of roadways cross-section that brought the useful introduction of the dynamic lane concept and future developments.
In double carriageways roads with large hard shoulders, an effective solution, in case of actual traffic congestion, is to convert the hard shoulder or “shoulder” lane into an ordinary transit lane, just for a time frame until traffic congestion is over. When a hard shoulder is subjected to such variation, it is called “hard shoulder running” (HSR). However, the dynamic lane concept does not regard just the road cross section, but it also refers to the overall geometric layout with traffic and speed management in every lane, according to the lane use and traffic flow density. The correct operation of a dynamic lane requires management choices and infrastructural adjustment. The first aspect refers to where, when, and how in a road section the dynamic lane will be activated; the second feature focuses on technical solutions aimed to guarantee an efficient safety level when the HSR is active, such as increasing the number of emergency refuge areas and monitoring systems and facilitating roadway accessibility to emergency vehicles. All these interventions aim to maintain safety and to compensate for the hard shoulder’s temporary absence when the HSR is activated.
In this paper, the implementation issues of HSR will be presented, considering both the infrastructural and management problems that need to be addressed. A case study with real data was applied to the urban motorway of the metropolitan area of Catania (Italy) to show the opportunities and issues in the application of microsimulation tools to analyze operational and safety performance in different management scenarios.
The introduction of the HSR to the aforementioned urban motorway is definitely appropriate because of the present congestion conditions and planning of the road agency to apply smart technologies. In this perspective, there are also the issues of high constrains and long times expected for the construction of a third regular lane.
The paper is organized as follows.
In the former part, we provided an overview to introduce the applicative heterogeneity of managed lanes, also considering that it maximizes its effectiveness if assisted by complementary techniques. Layout adjustments and digital infrastructure needs will be discussed because the realization of HSR requires the analysis of several design elements such as interchanges, recovery areas, traffic signals, and several operational techniques.
In the latter, a case study applied to the urban motorway of Catania metropolitan area will be presented with the application of different microsimulation tools. By using actual data, the case study was carried out with VISSIM® and SSAM® software to analyze different traffic and speed management strategies, comparing both operational and safety performance indicators.
Conclusion and limits of the study are discussed at the end of the paper.
2. Literature Survey
The realization of dynamic or hard shoulder running lanes, indicated in this paper as HSR, in the existing roadway constrains its original roadway class standards [
3,
4].
A dynamic lane must be managed in order to enhance traffic fluidity, to ensure services such as: the increase and optimization of roadway capacity, the achievement of temporary lanes closing, and clearance [
5,
6,
7].
Conditions that lead to the activation of a managed lane are mainly linked to massive volumes of traffic, and activation can occur at any moment of a day or at fixed times. A dynamic lane can be introduced in both directions of a carriageway or just in the one subjected to significant congestion phenomena.
Effects caused by dynamic lane management can be evaluated by analyzing three main aspects: safety (incidents reduction), efficiency (reduction of travel time losses, more regular traffic flow), and environment, including environment noise and pollutant emissions reductions [
8]. These parameters can be described as in the
Figure 2 trough “service radar” plot [
9].
Such an aspect results to be fundamental during design phases, then it is possible to carry out two main approaches: the all lane running (ALR) or the controlled motorway (CM) approach. These procedures have a central common aspect characterized by the removal of the dedicated hard shoulder and other common characteristics regarding physical elements such as:
Automated systems for VMSL (variable mandatory speed limits) management;
Driver information systems;
Vehicle detection systems.
The ALR design approach is characterized by the conversion of the hard shoulder into an ordinary running lane, where it is possible to eliminate processes of dynamic opening and closing, creating an additional roadway capacity. In the CM design method, interventions aim to keep the hard shoulder, reducing the need for elevated refuge areas and allowing easier traffic management to set out.
Considering that CM and ALR design approaches have different operating ways, there will also be different physical design elements, and such differences are highlighted in
Table 1.
Despite considerations about managed lane advantages, a different perspective must be studied regarding geometric characteristics and traffic control devices [
7,
8]. Permanent or temporary conversion of the hard shoulder into an ordinary running lane in terms of benefits causes a significant capacity increase; however, a disadvantage that must be taken into account is characterized by a safety reduction because of the hard shoulder removal. For these reasons, before the beginning of managed lane realization, several adjustments linked to technical equipment or provision of emergency stops must be fulfilled.
When an HSR is implemented, it is necessary to guarantee functional and geometric interoperability trough tools such as separation techniques of adjacent lanes and traffic control devices [
5].
A lane width of 3.5 m is appropriate to guarantee a safe running, even for heavy vehicles. The main challenge regards the increase of hard shoulder width, which in many cases results to be under 3.5 m. In motorway lane width, at least 3.6 m is usually a standard parameter, while hard shoulder width changes according to standards and construction issues. Ultimately, in many cases, hard shoulders with a lower than 3.6 m width are designed to be available just for non-heavy vehicles, and in such a case a width of 3 m results to be adequate. Vehicles category and roadway geometry are not the only aspects that must be observed, considering that the hard shoulder is positioned at roadway edges, and in such zones, the following artifacts can also be located: drainage elements, retaining walls, or concrete median barriers [
6]. If the roadway is uncurbed or opened, it would be possible to manage drainage element modifications easily, while in case of a closed roadway section, several adjustments must be encountered, especially regarding catch basins. When catch basins are located close to a running lane, such elements create a pavement change level so the consequence is uncomfortable driving. In addition, a load that pavement can tolerate cannot handle high traffic volume caused by conversion into a running lane. Such an issue can be solved through pavement reconstruction or location change of drainage features; if these interventions are not possible, it is necessary to eliminate drainage features, but it is mandatory to implement and realize new drainage techniques. One last consideration regards hard shoulder-width when it is located in a bridge; in this case, the hard shoulder should have a minimum width of 3.5 m to allow for vehicles during maneuvers, facilitating them to keep a position of at least 0.5 m from the bridge guard-rail. Based on the basis of these considerations, it can be stated that the main physical issue related to HSR implementation is the geometric dimension variations of lanes.
One more critical aspect that influences HSR functionality and safety is represented by ramps at interchanges, mainly concerning their typology, distance, and orientation. Considering the usual case of the part-time HSR to be integrated with a one-lane ramp, a dual approach is characterized by the so-called “taper ramps” and “parallel ramps” in motorway ramp interchanges. The first type has a higher collision risk due to the absence of a speed change lane, so that the layout will be characterized by a compelling cross between the ramp and the hard shoulder. The ramp must be modified to reduce such conflict risk, implementing the “parallel” scheme; in this way, vehicles will drive on the speed lane change extended for less than 30 m, creating parallel entrance and exits. These two ramps schemes can also be implemented in roadways with a higher number of lanes [
6]. In
Figure 3, cases of parallel and taper ramps are shown, respectively.
In many cases at interchanges, when the number of disbursed vehicles raises a helpful intervention, consisting of “ramp metering” to control ramp traffic, according to field conditions, it manually optimizes vehicle release. Thanks to ramp metering (especially for metropolitan areas), it is possible to limit vehicle entry at entrance ramps, mitigating congestion phenomena due to merging vehicles, and it can be improved with equipment such as queue warning. This aspect results in use to obtain higher compliance of drivers that would be informed about reasons of ramp meter operations. Ramp metering is mostly used in the USA; however, several European applications, especially in Germany, were introduced as a prevention system for traffic speed dropping and traffic flow harmonization. The ramp metering operation in Germany caused a 55% ordinary accident reduction and a 65% severe accident reduction on highway A40 [
11]. There are several critical situations that characterize ramps, but when an existing ramp was designed for high traffic volumes, whether it is off-ramps or on-ramps, it can be part of a managed lane system thanks to the “junction control” technique. Such a technique is mainly applied at interchanges and consists of a dynamic change of lane allocation to handle the traffic volume difference between roadway parts, especially in light volumes on ramps and high volumes on mainline. From an operational point of view, an application of the junction control technique is for on-ramps, with the help of lane control signs, when the mainline upstream right lane is closed to create free-flow traffic on-ramp for cars directed to the mainline. Nevertheless, in some cases, it can happen that traffic volumes on ramps are higher than on the mainline. In such a scenario, vehicles coming from the on-ramp will need a flow closer on the mainline. In both cases, road signs represent important equipment for a correct junction control operation, and the most commonly used signs are variable traffic signs and dynamic pavement markings.
The junction control system brings different benefits concerning the ramp type it operates on. For the off-ramps, junction control results are convenient if it allows high exiting traffic flow and if there is an available width for an additional exit lane [
12,
13]. In the case of on-ramps, junction control is useful if the roadway is characterized by a mainline with spare capacity. In conclusion, it must be outlined that junction control is a technique that operates in the best way and needs the cooperation of other techniques such as ramp metering (especially for on-ramps to improve the merge condition dividing vehicles from entering ramps) and the “dynamic re-routing”. Such a technique is strongly connected to drivers’ information devices, and it consists of simple destination sign changes directing travelers towards an alternative route. Dynamic re-routing achieves a significant efficiency in combination with junction control systems.
In the mainline, the use of a hard shoulder as a managed lane will cause a continuous vehicle flow with high collision risk in case of stationary broken-down vehicles or other objects in the hard shoulder. A permanent video surveillance would be required, especially for reverse lane use or other temporarily activated systems. Considering such aspects before the activation of a managed lane, there must be a check to ascertain that there is no vehicle stopped on the hard shoulder and if necessary, during the operation of HSR, they must activate a quick process to release the lane.
Fundamental digital equipment to use when a hard shoulder operates as a managed lane is automatic incident detection systems. To handle traffic flows in the best way, monitoring and data collection systems must survey real-time vehicle flow and speed, because on the basis of detected conditions, the dynamic lane could not be activated. Such devices can be double inductive loops, infrared, microwave sensors, or cameras connected with detection systems.
Because of the operational changes, drivers’ information techniques have a key role in safe transitioning; that is why, along the corridor, a device installation of variable signs indicating closure or release of lanes must occur. Regarding the equipment and management of a dynamic lane, it is possible to have a classification indicated in
Table 2 that suggests criteria to describe dynamic lane management’s service level [
9].
When the hard shoulder becomes a managed lane, if a vehicle decides to stop for various reasons and the refuge area is too far, it will stop in an opened lane becoming a dangerous obstruction for other vehicles. To handle this problem safely and rapidly, camera and monitoring system installation is required in order to communicate quickly with drivers, informing them about such events. The most challenging scenario that can occur concerns accidents and vehicle flow deviation management. First of all, it must be analyzed how much width will be required to conduct the interventions to establish how many lanes must be closed, considering that the dynamic lane’s width could not be enough. To ensure a high level of safety, traffic flow deviation management must be as gradual as possible. This situation means that if space occupied by broken vehicles or the one involved in accidents covers more than one lane, traffic flow deviation must be applied gradually for every single lane. In
Figure 4, there is an example of traffic flow deviation when interventions or accidents cover two lanes:
However, there must be enough variable signing in CM roadway sections to ensure that drivers receive adequate guidance. Therefore, in order to reduce as much as possible all risks linked to collision, the strategy to be applied consists of minimizing and removing (where possible) the frequency of maintenance interventions and site visit requirements, utilizing items and assets with low maintenance requirement. Moreover, refuge areas at up to 2.5 km intervals must be realized to provide a safe place for vehicles to stop in an emergency or breakdown, and the number of motorway service areas must be increased [
14].
Acknowledging previous considerations, the activation of dynamic lane management into a hard shoulder must be scheduled and planned rigorously to ensure safe operation. From the analysis of different aspects needed to activate a lane dynamic management, there arises that drivers’ information devices represent a key role. Such instruments are the basis for lane management system efficiency, so they must be handled in the best way both from an economic and operational point of view. The main characteristic to be considered regards their placing according to the roadway’s geometric layout. For a geometric layout characterized by a high number of curves, it is expected to find a higher number of information display devices compared to a roadway whose geometric layout has fewer curves with longer sight distances available. There is no homogeneous criterion; for instance, in the Netherlands and M42 (UK), information devices are placed on average every 500 m. However, after M42 roadway implementation in England, future managed lanes will have to be equipped with information and detection devices spaced by a minimum distance of 800 m and a maximum of 1 km.
A hard shoulder dynamic management operation is shown in
Figure 5 [
15]. First of all, a hard shoulder can be recognized thanks to the existing solid white line, then drivers must pay attention to signals displayed, because the transition in a hard shoulder is allowed only when it is signed as open. Standard signals used for indicating the opening of a hard shoulder are a red “X” when a dynamic lane is not active, while the hard shoulder will result as opened when the display will show the mandatory speed value (established by police) to drive in such lane. In case of a breakdown, the driver must try to reach the closest refuge area. If this is not possible, they must attempt to leave the roadway.
One of the main advantages of the activation of the speed harmonization plan when a hard shoulder is used as a managed lane is user compliance. In fact, according to speed data collected in twelve points for each direction in M42 roadway in Birmingham (England), there was a compliance of 94% for the speed limit range 80–110 km/h, while when the speed limit was reduced to 65 km/h, user’s compliance decreased to 84% [
11] Usually, the speed limit established in a hard shoulder is less than in other lanes. The M42 speed limit is mainly 80 km/h or 65 km/h. Despite the little difference of such speed limit values, a compliance of 97% was recorded for the first limit and a compliance of 93% was recorded for the second one.
Considering the different techniques employed to enhance the use of the hard shoulder as a managed lane, it is possible to classify them, as in
Table 3, indicating the prerequisites, affinities, and complementary aspects, respectively.
3. Considerations and Methods
When any innovation or intervention must be implemented, it requires adequate experimentation with high costs in many cases, then it is useful to use simulation methods using specific software to evaluate and forecast their effects [
12,
13]. In case of interventions, such as the construction of new roadway infrastructures or new configurations, such as the dynamic lane that significantly alters vehicles traffic, depending on the degree of the investigations and inputs details, and on the accuracy of obtained results, simulation can be distinguished generally into two categories: macro-simulation and micro-simulation. Macro-simulation is often used for the evaluation of vehicle traffic flow during critical hours of the day; therefore, a macro-simulator examines and processes parameters and medium quantities based on statistical behavior data and physical laws. The aggregation of vehicles characterizes its effectiveness flows, moving from one point to another, and such a simulation process can be carried out according to vehicle type and peak and soft hours, providing a series of indications such as average speeds, expected hourly and daily traffic flows, or service levels. Micro-simulation models are tools functional for effect evaluation when the survey objective is focused on the entire distribution of target variables and not only on average values [
16]. The micro-simulator allows to analyze and process each vehicle’s movement on networks instant by instant, and it is based on laws related to vehicle motion and driver’s behavior [
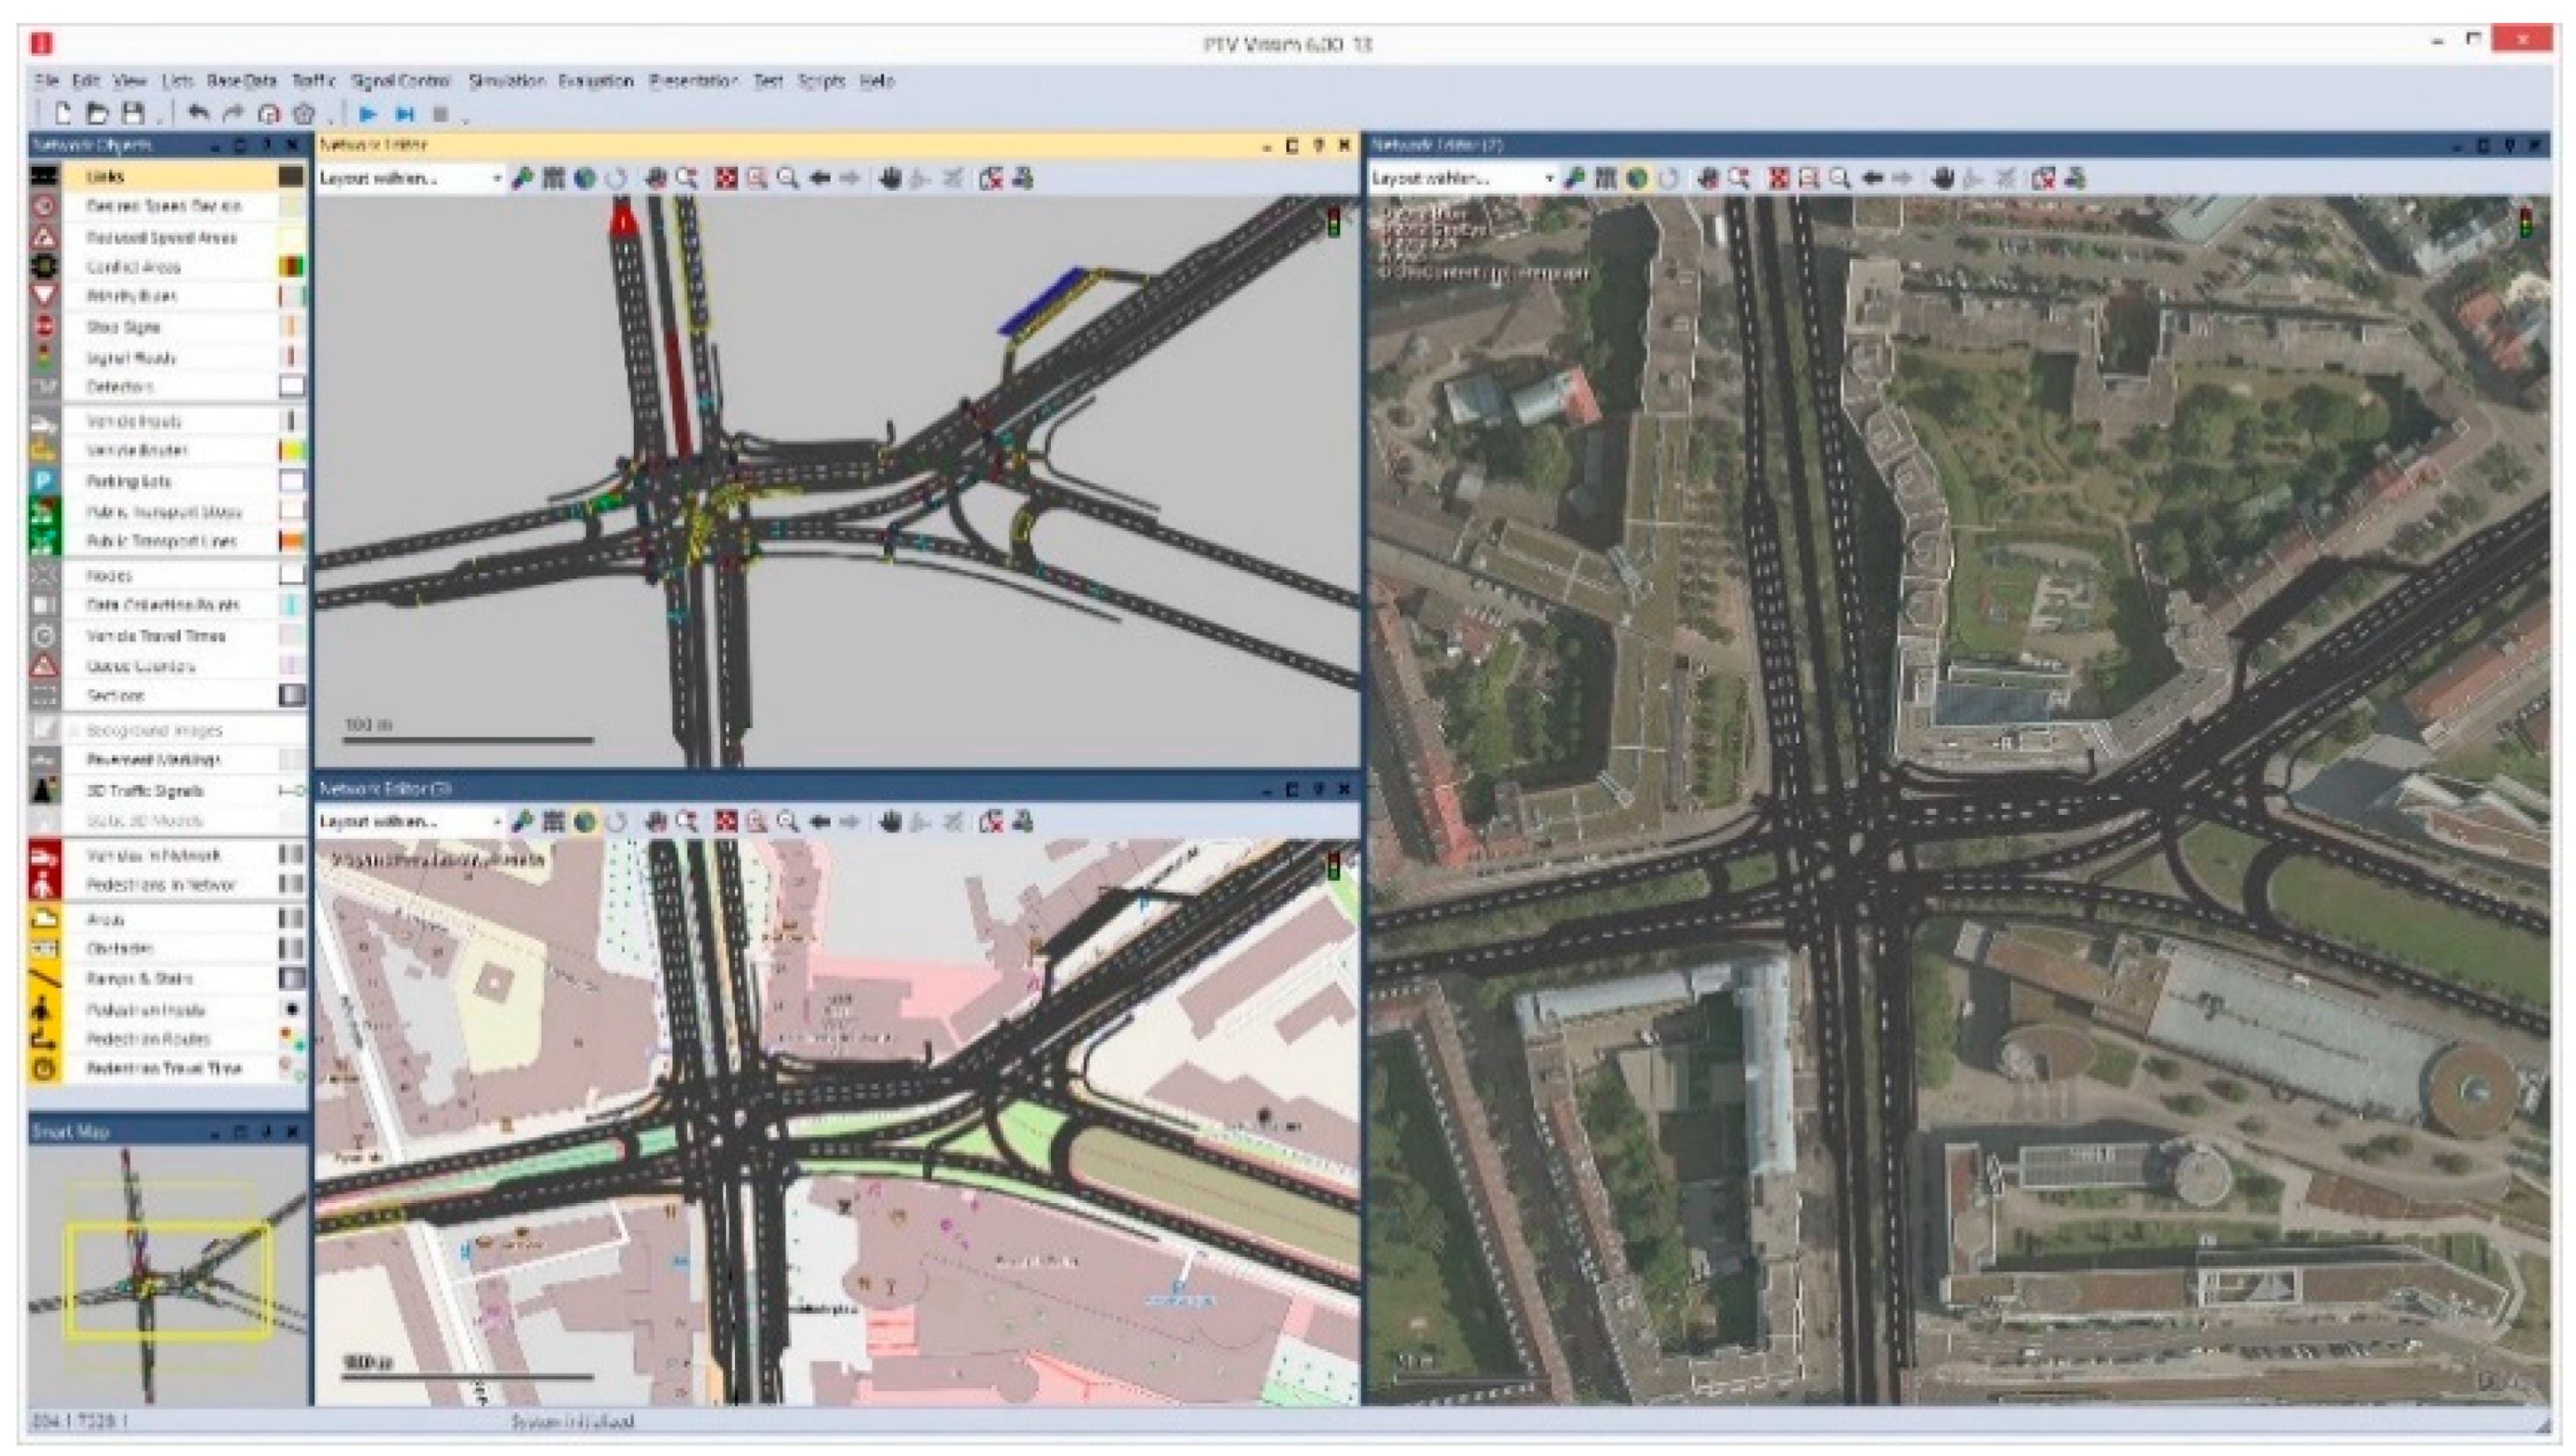
17]. Implementation of an HSR is an intervention applied to a context characterized by many variables related to vehicle movements and geometric features of the road section. The microsimulation software used in the present study is VISSIM (Verkehr In Stadten–SIMulation) (
Figure 6). It can carry out multi-modal microscopic traffic simulations, which means that VISSIM allows multiple traffic types to provide numerous application contexts (highway, freeway, urban). Vehicle interaction is the most critical tool of microsimulation. In order to conduct an accurate analysis, VISSIM models the stochastic movement of each vehicle, and before the simulation begins, the software requires the definition of several parameters. Then, it is recommended to carry out the studies in small range areas to calibrate the models with a high detail level [
18]. In the case of analysis regarding HSR activation, there are different ways of modeling through VISSIM; for instance, considering a scenario where a hard shoulder already exists, lane management configurations are various, so a managed lane can be set as a lane belonging to the base model but closed depending on signal changes [
19].
Vehicles conflict analysis represents the key aspect for the evaluation of traffic safety aspects [
20], and in addition to VISSIM being able to define vehicles’ trajectories, an estimation of the number and type of conflict can be studied with other software. One of the methods applied for conflict analysis is the Surrogate Safety Assessment Model (SSAM), which is able to estimate the conflict number on the basis of multiple vehicles’ trajectories produced by VISSIM [
20]. There are two main parameters that can be obtained from vehicle trajectories identified as conflicts: time to collision (TTC) and post encroachment time (PET). The former represents, in relation to two vehicles speed, position and trajectory successive time instants, the minimum collision time interval that occurs. Reduced TTC values define elevated collision probability, and the highest TTC value is infinite (i.e., no chance of collision) while the minimum is equal to zero (i.e., collision occurrence). The latter defines the time interval that occurs when a vehicle reaches the last position occupied by the first vehicle after the last left it, and when PET is equal to zero a real collision occurs. In conclusion, after previously cited parameters are set, SSAM will provide conflict counts, classifying their type on the basis of conflict angle (α):
rear end; α < 30°: conflict where both vehicles are in the same direction;
crossing; α > 85°: crossing conflict;
lane change; 30° α < 85°: conflicts between vehicles moving from the same direction.
A critical issue related to microsimulation and especially in the case of HSR is the one related to the “driving culture” that must not be confused with “driving behavior”. The latter is characterized by several models in literature that can be implemented in the micro-simulation. In this paper, we used the Wiedemann’s psychophysical perception models for car-following and lane changing. These models are ultimately related to the road typology. However, in order to account for the different driving culture of a specific country, in VISSIM, it is possible to set calibration parameters (i.e., front-to-rear spacing, desired acceleration, etc.) that affect the “aggressiveness” degree of driving maneuvers on the basis of monitoring surveys and data collected for the case study.
Another driving micro-simulation issue relevant to the present study was the compliance to speed limits. The distribution of the desired speed with the standard speed limit of 130 km/h was defined referring to actual data, while the speed distribution when the speed limit is set at 90 km/h was supposedly due to the unavailability of data.
6. Conclusions
The aim of the paper was to present an overview of implementation issues for HSR and to show, with a real case study, how micro-simulation tools can be applied to compare both operational and safety performances in different traffic and speed management scenarios. The urban motorway of the metropolitan area of Catania is a typical example of a large city characterized by elevated traffic flow, where the existing road infrastructure leads to congestion phenomena due to a reduced number of running lanes. In this case, HSR allowed to increase capacity through the use of an existing hard shoulder with limited costs. However, such intervention needs proper analysis to evaluate consequences of traffic safety and operational performance, especially in the most critical phases of HSR closing. A microsimulation was carried out in order to obtain a forecasting estimation of potential conflicts, implementing different conceptual scenarios of operational management and considering different speed management and traffic flow values. Results showed that, beyond capacity rise, due to the increase in the number of lanes, posted speed and selection of traffic conditions for opening and closing of the shoulder plays a critical role for both safety and operational levels of service.
For the activation of the HSR, the speed reduction and opening, near to the maximum capacity, showed the best results in terms of operational and safety effects because the reduced conflict number and severity compensate for the increase in congestion due to the reduced speed.
For the closing of the HSR, 60% of the traffic flow returned the best safety result at 90 km/h for the reduced number and severity of conflicts. Anyway, the operational performance was penalized by the reduced average running speed.
Ultimately, with this study, it was possible to prove how HSR represents not only a strategy for roadway capacity increase, but a valid intervention for traffic conflict reduction, because with three lanes opened, the number of conflicts dropped drastically, as confirmed by the safety improvement in HSR already in operation [
15].
The results presented in the paper cannot be considered conclusive because other intermediate conditions of speed reduction and traffic flow can be analyzed.
The case study has some limitations because the simulation was carried out in a simple uniform section without interchanges and only in normal traffic flow conditions without unexpected events (e.g., accidents and broken-down vehicles).
The Wiedman 74 car following model was preferred, assuming a driver behavior similar to that in urban areas. Application of W99 in freeway conditions and further parameter calibration could be tested, as well. Moreover, it is worthy to note that the speed distribution, when the posted speed is set at 90 km/h (
Figure 9), is hypothetical because of the lack of actual data and assumed high percentage of speeds over the limit, as is usual when active speed enforcement systems are not applied. Indeed, in smart roads, there is the opportunity to monitor the vehicle speeds in order to better enforce the driver behavior to comply with the posted speed limits.


 ,
, 


