Abstract
This paper examines the impact of special tariffs between China and the United States (US) on their indirect trade partners via spillover effects. We applied a Value-Added Real Effective Exchange Rate (VA-REER) index to simulate how an increase in tariffs induces changes in demand for goods from Indonesia and selected Asian partners. We used the Input–Output Database (WIOD) to simulate the spillover effects across partners via the Global Value Chain (GVC) using data from 2000 to 2014. The results suggest that demand is doubly more responsive to prices (tariffs) when value-added (VA-REER) index is used instead of the conventional REER index (gross trade). We found that US tariffs on Chinese goods have a negative spillover impact on Indonesia’s exports. Meanwhile, the Chinese tariffs on American goods lead to small increased demand for Indonesian exports. We also found that US and China become equally crucial for Indonesia under the Value-Added REER scheme, concluding that the conventional REER approach may have underestimated the impact of US tariffs on Chinese goods. Finally, we found that Indonesia would be at risk to trade shocks if the US applies tariffs on China, Asian partners (Japan and South Korea), and the European Union (EU).
1. Introduction
Since 2018, trade tensions between the United States (US) and China have escalated, amidst concerns of currency manipulation [1], state subsidies [2], trade imbalances [3,4], re-launching of export strategies [5], intellectual property issues [6], national security [7], and many others [8]. Increased US tariffs on Chinese imports were straightaway responded with counter tariffs from China on at least three big ‘special tariffs’ waves. As a result, from early 2018 to 2021, the average US tariffs on goods that originated from China went from 3% to nearly 20%, while the average Chinese tariffs on US goods soared from 8% to 21%. As of 2021, US tariffs on Chinese goods covered about USD 350 billion, while Chinese tariffs on US goods covered roughly USD 100 billion [9]. Although attempts to lower tariffs have been made, it is unclear how far tariffs could increase in further rounds.
The US–China trade war suggests negative impacts on trade flows for both countries [10,11,12,13]. Larger adverse effects impact China more than the United States [13,14,15], although US tariffs have been passed on to American firms and consumers [9,16]. However, it remains an empirical question as to what extent the impacts are subsequently transmitted to these countries’ third top trade partners in the form of lower demand for exports. With China as the trade hub of Asia [17,18,19], the spillover impact transmitted through production networks to neighboring countries may be large enough to lead to a slowdown in trade and a loss of trade competitiveness for them.
The literature on transmission of trade shocks is somewhat mixed. While Korea [20] other South East Asian countries [13,21] and Europe [22,23,24] have experienced adverse effects from trade shocks, some Asian cases have reported minor impacts from US–China trade distortion. Aslam [25] concluded that trade tensions could harm indirect exports from Southeast Asian countries (ASEAN) to the US, although identifying a possible scenario where ASEAN countries might send substitute products for the Chinese exports to the US. Caceres et al. [26] and Li et al. [15] found similar results to those of Aslam [25]. Still, Raghavan and Devadason [27], using a Structural VAR model, found that the indirect linkages of ASEAN with China and the US are transmission channels for trade shocks.
In this paper, we examine the role of the Global Value Chain (GVC) in transmitting trade shocks to Indonesia and other Asian partners, arising from trade tensions between China and the United States. We apply the Value-Added REER (VA-REER) framework proposed by Bems and Johnson [28] to estimate demand changes from higher trade tariffs. Trade linkages and a composite set of elasticities of substitution illustrate how changes in prices (due to tariffs) for final products prompt expenditure switching between domestic and foreign value-added. As tariffs are assumed to increase the price of final goods [8,29], relative competitiveness across countries changes [7]. Alterations in demand for final products will then metamorphose into new demand for intermediate goods and input factors across the GVC [1]. The difference in price competitiveness and the elasticity of demand for value-added will ultimately determine how large the switch in expenditure from foreign to domestic value-added is.
The current pattern of trade characterized by flows of slices of value-added rather than gross output suggests that the use of a classical Relative Effective Exchange Rate (REER) framework for the study of export competitiveness is no longer relevant as it misses the fragmented nature of production and trade [28,30]. The standard REER assumes constant elasticity of substitution across output, not allowing for differences in elasticity across final and intermediate goods or input factors. Fragmented GVCs alter the competition that countries experienced as a result of a change in global demand, prices, and tariffs [8,17,21].
This paper will answer the following research questions. First, what are the effects of an increase in tariffs between the US and China on demand for value-added exports? Second, how does Indonesia’s competitiveness based on VA-REER change under a tariff war scenario? We focus on the direct impact of tariffs on value-added exports for the US and China and the indirect effects in some Asian countries. To answer the proposed questions, we applied a value-added REER approach as it provides a framework for understanding how trade tariffs are transmitted across the GVC and how trade tensions weigh on global production and trade for China–US trade partners [22,31]. To simulate the demand changes, we assume a full pass-through of tariffs to consumers, which means the US prices increase by the amount of the duty. The proposed scenario is at 1% and 5%, followed by a counter tariff as shown in [22,23,28]. A global Input–Output (I-O) framework helps to account for value-added in trade under a production sharing structure [32,33], allowing us to capture the distribution of impacts across the GVC. The input–output framework applied in this study uses the World Input–Output Dataset (WIOD). It includes 43 countries and 56 sectors, using the sample period of 2000 and 2014.
Using the VA-REER approach is important as demand for exports may be more responsive to tariffs when employing VA-REER terms, depending on three aspects: (1) countries’ exposure to trade under the GVC, (2) the position countries hold within the GVC, and (3) whether goods exported are intermediate ones or final [23]. The case of Europe [22,28] suggests lower vulnerability to regional trade shocks as the EU is highly integrated, with demand more responsive to prices (tariffs) when using VA-REER than conventional measurements. For the South East Asia (ASEAN) case, Tan et al. [21] illustrated that broader participation in the GVC in the ASEAN region (proxied by foreign content in exports) reduces REER changes. Nevertheless, Tan et al. [21] employed gross export data and the conventional REER index, missing the effects from trade linkages, the composition of trade (intermediate or final goods), and the value-added share in bilateral trade. We illustrate that fragmented networks alter the competitiveness of countries and the impact of tariffs, even when considering equal elasticities across countries and goods.
Regarding the choice of Indonesia, the country shows a deep change in international trade patterns, with intermediate goods accounting for a large share in exports [18,34]. With Indonesia expanding within production networks in Asia and gaining participation in vertical structures [32], its concentration in markets (US–China), specialization in trade, and fragmentation have increased. Indonesia is more exposed to indirect effects from global trade as it has expanded its linkages within the GVC [18,33].
We contribute to the literature in the following ways. First, we contribute to the empirical debate on the impact of the US–China trade tension on Indonesia (and Asian partners) by estimating the spillover effects to demand value-added arising from higher tariffs. Second, we compare the value-added competitiveness (REER) for some Asian countries (Indonesia, India, South Korea, and Japan) and compare it to the conventional REER index. By doing so, we provide new insights into the role of fragmented structures in the transmission of trade shocks, a point missing in the trade literature in Asia. Third, the VA-REER application allows for different substitution elasticities across final, intermediate goods and factors. To the best of our knowledge, this work provides the first-time quantitative estimates of the impact of US–China trade tension on Asia using the VA-REER approach.
2. Literature Review
Liberalization of trade has supported the rapid expansion of Asian countries in the Global Value Chain (GVC) [13,18,21]. In Asia, China is the primary node in production, linking players across the continent and the world as noted in Xiao et al. [17]. However, fragmentation of production and more interconnectedness in trade raises countries’ exposure to positive and negative shocks [19,22,27,29]. Lee [20] noted that South Korean Industries have become increasingly concentrated and globally interconnected, finding that vertical trade linkages are avenues for propagating shocks. In the presence of shocks, links with major trading hubs can lead to swings in the economy and job losses [23].
Other papers have explored the role of fragmented structures in the transmission of trade shock, supporting the notion that higher integration in GVC lowers bilateral head-to-head competition but increases exposure to global shocks [20,31,35]. Increasing trade tensions between the United States (US) and China are likely to be sources of spillover effects in demand and supply, with higher vulnerability in concentrated and interconnected networks [10,17,19].
Magnifying impacts of shocks are relevant in GVC where extensive linkages suggest that trade surprises are not only directly transmitted but spill over in cascade effects as noted by Kee and Tang [36]. Substantial differences in trade shock effects when employing value-added instead of gross exports are evident in the European case [22], particularly for countries highly engaged in GVC.
A growing strand of literature covering trade shocks and propagation of impacts across GVC employs input–output (I-O) frameworks [22]. Employing network analysis, Xiao et al. [17] measured linkages and volumes of trade, finding that after tariffs are imposed, losses are closely linked to value-added exports rather than gross exports. Lau [3] looked at the effects of the Chinese economy’s rebalancing from investment-trade to consumption, identifying negative impacts transmitted to foreign players as Chinese exports fall. Vandenbussche et al. [23] applied an I-O framework to evaluate Brexit’s effects, finding that strong linkages across European countries increase the negative impacts, especially for upstream players. Huidrom et al. [22] estimated that economic shock effects are felt more substantially in highly integrated economies than in less interconnected countries.
Simola [31] looked at the impact of recent US import tariffs levied on Chinese goods, pointing out indirect effects on third-country partners spreading across production networks. A scenario proposed in Huidrom et al. [22] assuming that the US imposes a 25% tariff on EU cars identified that nearly half the impact is transmitted to the sector-country directly, while the rest is spread through supply chains. The value-added approach identifies that trade shocks can be traced in multiple countries, rather than on the direct exporter alone.
As for Indonesia’s case, Esquivias Padilla et al. [32] noted Indonesia’s vital role in the GVC as a supplier of intermediate goods, which account for nearly 60% of its exports, and they locate the country in the initial section of the GVC. Although Indonesian exports have considerably lower participation in vertical structures than those of its ASEAN partners, Indonesia is likely to be affected by indirect shocks from its trade partners [18]. Indonesia holds a forward position in GVC (supplier of intermediates), meaning that shocks in demand from partners could lead to a fall in exports, as noted in other countries [20].
Another issue affecting Indonesia is its strong and increasing dependence on Asian countries in production networks over time [33], and its subsequent less direct relations with North American and European value-chains. A rebalancing of the Chinese economy could create shocks in China’s demand for Indonesian exports [3]. China is Indonesia’s largest trade partner. Indirect effects from trade tensions and a potential global slowdown could trigger adverse effects for the Indonesian economy. The possibility of positive effects from the trade war is open, as expenditure switching (fewer Chinese imports of American goods) may lead to more demand for Indonesian exports to China [18].
3. Materials and Methods
In this section, we present the framework we employed to carry out the analysis, drawing from Bems and Johnson’s [28] Value-Added Real Effective Exchange Rate (VA-REER) model. Scenarios on bilateral tariff impositions between the United States (US) and China equal to 5% are presented, reflecting an increase in final goods’ prices. Changes in prices are derived from competitiveness adjustments across the Global Value Chain (GVC) and captured by the proposed index of value-added REER. Changes in relative prices are then linked to changes in demand for exports.
We first estimate the conventional Real Effective Exchange Rate (REER) index of competitiveness based on gross output and compare it to the value-added REER. Next, we assess how Indonesia’s global links with foreign markets and its trade composition may be channels for transmitting shocks arising from changes in prices.
3.1. Data and Parameters
Data on gross output, value-added by country, and exports of final and intermediate goods between partners are introduced via five matrices {Sx, Sf, Wx, Wf, } (see notation in the next sub-section). Production function shares are obtained from the main matrices . The World Input–Output Dataset (WIOD) covers 2000–2014, including 43 countries and 56 sectors (Table 1). The output and input matrices allow linking the inter-country flow of final and intermediate goods [37]. The WIOD includes 28 European (EU) countries and 15 other major countries. Besides Indonesia, Asian countries included in the WIOD are China, Japan, South Korea, India, and Taiwan. Appendix A presents the basis for using WIOD and the rationale for using the reference period (2010–2014).

Table 1.
Data description.
For the elasticity parameters, we adopt the approach of Bems and Johnson [28] and Huidrom et al. [22] in which production is assumed to follow the Leontief assumption (, while the effective value-added elasticity for final goods, is set to = 3. The parameters only command that inputs have lower rates of substitutability than final goods. and are the main elasticities for pinning down REER weights and value-added elasticities (final goods and intermediate goods, respectively), while the third ( is less crucial (elasticity of substitution for factor inputs).
To construct the price index, we follow the IMF REER index, using the Consumer Price Index (CPI). We replace in Equation (1) for where and are log changes in the nominal exchange rate and the CPI. To build the value-added REER capturing the price of value-added, we employ the GDP deflator, as explained in Bems and Johnson [38]. The price data are extracted from the IMF World Economic Outlook database. GDP deflator and national currencies are converted to USD using nominal exchange rates.
3.2. The Real Effective Exchange Rate (REER)
The real effective exchange rate REER index captures countries’ competitiveness by comparing average changes in bilateral relative prices [39]. The conventional REER takes the Armington-CES form of . Demand is ruled by an elasticity of substitution on final goods (, the real expenditure of country k on output from foreign countries (, the own price Pi, and a price index of . Prices are commonly based on the Consumer Price Index (CPI).
The REER index is expressed in log changes as:
With .
The change in demand for output driven by changes in the REER (prices) is proposed as:
The role of on is governed by the elasticity of substitution (EoS) captured via and the Si index (weights) that aggregate the market share effects across destinations.
3.3. The Value-Added Real Effective Exchange Rate (VA-REER)
Bems and Johnson [28] proposed extending the REER to compute an index of competitiveness based on value-added instead of gross exports and incorporated input linkages, capturing expenditure switching from final demand and intermediate goods. Input linkages influence value-added prices and the demand for value-added across the GVC [14].
In a setting of countries indexed by , each country produces differentiated goods (output, Qi) used as final products or intermediate ones, with price . Gross output is produced by combining domestic real value-added (Vi) and intermediate goods (Xi) at the respective prices and . Intermediate goods are sourced either domestically i or internationally j (Xij). The aggregate production of country i on a nested-CES structure is:
With
where s represents aggregation weights, three underlying elasticity parameters are considered (γ, , and σ), instead of conventional models where only σ ordinarily governs substitutability across varieties of final goods. γ is the Elasticity of Substitution (EoS) for factor inputs, and is the EoS between intermediate goods.
The market-clearing condition for gross output is denoted as , where Fij accounts for final goods produced by i and purchased by j, and Xij are intermediate inputs.
The demand for final goods Fi follows a CES composite of final products as:
Equation (5) is a partial equilibrium model of one sector case, capturing a demand-side approach, with prices and expenditure taken as given [28]. The framework can be extended to multiple sectors by employing the linkages as in Patel et al. [40].
The VA-REER framework is employed to derive the demand for value-added, which is a function of value-added prices and real expenditure Di (pv,F) Vi (piv, piq (pv), Qi(pq (pv), F). Assuming fixed expenditures and applying a log linearization of changes of demand, the first-order condition on final goods and prices is with
The linearized form of real value-added and inputs in I is , , and , with .
The log market-clearing condition of Q employing dimensional vectors in final goods and intermediate goods is expressed in [28] as:
and are matrices that account for the shares of final f and intermediate goods (x) shipped to the different destinations j as a share of gross output from the source country (producer i). With , , , and .
Applying the linearization to the gross output, the change in the price index is stated as
where and .
Gross output is influenced by changes in demand level and expenditure switching due to a variation in prices. The price for gross output (q) is subject to changes in value-added prices:
where is a world input–output matrix of i,j elements, indicating the share of inputs from country i purchased by country j. The change in output prices is a weighted average of changes in value-added prices in all linked countries.
In Equation (12) in Bems and Johnson [28], demand for output changes, due to new levels of expenditure or to substitution effects in final and intermediate goods. Changes in market demand for value-added are expressed as:
In a concise way, changes in demand for value-added from country i are stated as,
where are value-added weights derived from a linear combination of the EoS for final goods , intermediate inputs , and factors . is the total demand for value-added exports from i. For simplicity, we assume to be constant.
The VA-REER is defined by the value of the deflator REERiv where ; and are two arbitrary vectors of prices [28]. Applying the concept to Equation (10) and linearizing the log change in VA-REER for i yields
The VA-REER index has bilateral i,j weight ascribed to the change in value-added prices in i and j. −Tij captures the elasticity of demand for value-added from country i and ultimately consumed by j. The own-price elasticity of demand is . Demand for value-added will then adjust, based on elasticity parameters , the change in VA-REER, and the market share component (linkages, ).
With .
, is one minus the weighted average value-added market share of county i in all destinations k. Siv indicates the average change of value-added price in country i, relative to the expenditure price level of the destination market j. The elasticities of substitution of final goods, intermediate inputs, and factors are captured in a compound parameter that indicates how much the demand will rise with a 1% increase in domestic relative prices.
3.4. Impact of Tariffs
To simulate a change in demand arising from tariffs, we assume that the United States (and China) impose a tariff in gross imports (all countries). Tariffs are considered full pass-through to American consumers, meaning that the US’s price increases by the amount of the duty. Following Huidrom et al. [22], the change in the price of gross output in Equation (8) is linked to a change in price for value-added (Equation (9)). As a consequence of the tariff, the cost of gross exports and value-added exports of partner countries increases. The domestic price in the country imposing the tariff decreases. The changes in demand for value-added in i are captured using Equation (10), allocating the changes based on the underlying elasticities ( and the different value-added weights. A second stage considers retaliation effects from partner countries to respond to the United States, modeled similarly.
4. Results
We split the presentation of results into the following sub-sections. First, we provide some insights into the China–United States (US) trade relations, and a picture of Indonesia’s participation in the GVC. Second, we report on the estimates of the Value-Added Real Effective Exchange Rate (VA-REER) and the conventional REER that illustrate the price competitiveness of countries. Finally, we apply the VA-REER to a scenario of tariffs between the US and China and derive implications on demand for third countries.
Regarding the China–US trade, in 2014, China exported USD 468 billion in goods to the United States, 41% on final goods (FG), and 59% as intermediate parts and components (IPCs). A large share of IPCs is shipped to the US via indirect partners as it is well documented [5,17,18]. The largest exports from China to the US originate from computers, electronic, and electrical equipment, equal to USD 158 billion in 2014. Textile goods contributed to USD 75 billion, while other manufacturing added to nearly USD 40 billion. The domestic value-added (DVA) content of Chinese goods to the US increased from 73% in 2005 to 80% in 2014. The DVA share in final goods in sectors such as computers reached 70% in 2014, a notably larger share than the 2005 level of 59%. In textiles, the DVA of China grasped 90% in 2014. Kee and Tang [36] and Li et al. [5] pointed out the large substitution effects in value-added content in China, as China became more competitive and sophisticated in producing own input goods.
The foreign value added (FVA) embedded in Chinese exports to the US decreased over time as China gained technical complexity and sourcing [5,17]. The share of value-added from East Asian countries in Chinese exports to the US fell from 12% in 2005 to 5.5% in 2014. In sectors such as computers, electronics, and electrical, China substituted foreign content in exports (40% of FVA in 2005) for domestic value-added (30% FVA in 2014). Many Chinese products taxed by the US fall within those sectors, mainly IPCs [2].
In 2014, the United States exported to China USD 226 billion of goods, nearly USD 85 billion in final goods and USD 130 billion in IPCs. The US exported a substantial number of services to China (USD 88 billion in 2014), greater than for manufacturing exports, and a pattern substantially different from China’s. The largest exports of merchandise from the US to China consist of transport equipment, chemicals, agricultural goods, computers, electronics, and electrical goods.
Regarding Indonesia’s trade pattern, from 2000 to 2014, gross exports multiplied from nearly USD 70 billion to USD 210 billion. Larger participation in the Global Value Chain (GVC) have supported trade expansion for Indonesia, similar to countries in other emerging regions [41]. Indonesia employs relatively large shares of domestic value-added (DVA) in exports (82%), compared with countries such as South Korea (73%) or Taiwan (68%). The percentage of intermediate parts and components (IPCs) increased from 65% to 74% of total value-added (VA) exports, a relatively higher share than for Indonesia’s Asian neighbors who, on average, export 60% of VA through IPCs [33]. Nearly 27% of Indonesia exports are value-added and will be re-exported by third countries (forward linkages). On the other hand, Indonesian exports contain 14% of foreign value-added (backward linkages).
Spillover effects from upstream or downstream players can indirectly affect the demand for Indonesian goods. Lower prices in intermediate goods lead to gains in competitiveness for downstream players [35] while a decrease in competitiveness could arise due to higher cost of final goods for upstream players (e.g., tariffs). Large shipments of Indonesian IPCs to Asia imply that in the event of expenditure switching towards Asian goods, Indonesian exports of IPCs may benefit; however, a decrease in global demand for Asian goods (e.g., due to a hike in tariffs imposed by the US) may harm Indonesian exports.
4.1. Value-Added REER
This section computes the impact of changes in prices across countries employing the conventional REER approach and the Value-Added REER approach of Bems and Johnson [28]. Three aspects suggest that value-added REER rather than gross output is a more appropriate measurement when looking at countries’ competitiveness in fragmented trade. First, price competition is weighted in value-added terms, with larger loads allocated to countries where trade in GVC is larger. As nearly 27% of Indonesian value-added exports cross multiple borders, VA-REER will capture the extent of direct and indirect competition in third countries. Second, the VA-REER incorporates trade in intermediate parts and the substitutability of one’s production factors, rather than assumes that trade is in final goods alone. Nearly 75% of value-added exports from Indonesia are intermediate parts and components (IPCs), which often face lower elasticity of substitution compared to final goods. Third, linkages in the value-added approach capture trade’s fragmented nature. As Indonesia is strongly linked to production networks in China, it is likely that impacts on Chinese exports will spillover to Indonesia.
We first look at the role of input linkages and the elasticities in inducing changes in REER weights. Following Bems and Johnson [28], we compute weights employing three different elasticity parameters (Figure 1). First, the low production elasticity case (wijv or VA-weight), second equal elasticities (wijv(ϵ) or IO_weights), and third the conventional weights in the Armington model (GO-weights). Intuitively, a weight indicates how much the REER index depreciates in the producer country i when the price rises in the destination country j by 1%, relative to i’s price level. A larger elasticity leads to a larger change in weights.
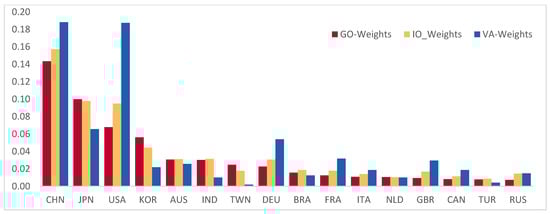
Figure 1.
REER weights for Indonesia versus partners 2014. Note. GO (Gross Output). IO_Weights based on elasticities (σ,ρ,γ) = {1,1,1}, VA-REER weights (σ,ρ,γ) = {3,0,0}. China (CHN), Japan (JPN), United States (USA), S Korea (KOR), Australia (AUS), India (IND), Taiwan (TWN), Germany (DEU), Brazil (BRA), France (FRA), Italy (ITA), Netherlands (NLD), Britain (GBR), Canada (CAN), Turkey (TUR), and Russia (RUS).
Figure 1 compares the weights measured under the different frameworks for Indonesia versus its largest trade partners. The VA-REER framework displays larger weights in trade between Indonesia and partners than conventional REER weights (gross data) does. VA-weights indicate Indonesia’s head-to-head competition is larger with important trade hubs in the world (China, US, and Germany) and other large countries (France, England, and Italy) than to Asian partners. For example, a 1% change in Chinese prices will induce an appreciation of Indonesia’s goods in conventional REER (GO_weight) by 0.14%. Under VA-weights, the appreciation will be 0.19%, a 26% difference in the impact of price changes. In the case of trade with the US, the VA-weight rises more than twice when using the VA approach (from 0.07 to 0.19). As such, changes in prices arising from tariffs imposed by China and the US develop into more substantial variations in competitiveness and greater demand for Indonesian value-added exports than as conventionally shown by the REER index.
On the other hand, Indonesian exports to Asian partners (non-China) face lower head-to-head competition as exports are lower in value-added than in gross terms, similar to the intra-EU case in Huidrom et al. [22]. Most countries in Asia linked with China, Japan, or South Korea to the so-called “Factory Asia” tend to have lower value-added trade exposure than gross trade [42]. However, Indonesia enjoys higher linkages in trade (weights) with China and lower exposure to trade with Japan, S Korea, Taiwan, Australia, and India, in line with previous findings [6,38]. In an eventual scenario of trade diverting from China to other Asian countries (due to US tariffs [7,13,43]), Indonesia can benefit as it holds helpful links with Korea, Japan, and Taiwan that can raise demand for Indonesian inputs. As such, even if Indonesia could not substitute for Chinese goods in the US, it could benefit if Japan, Korea, or other Asian countries within the production network did so.
The IO_Weight parameter accounts for equal elasticity between final, intermediate goods, and input factors, illustrating the change in the measurement of weights when shifting from gross exports to value-added data. Even when considering homogeneous elasticities in products, the presence of fragmented trade (GVC) leads to larger exposure to changes in price competitiveness. Trade between Indonesia and large trade hubs (China, US, and Germany) is more important (larger weights) when accounting for GVC links than when only considering bilateral direct trade (GO_Weights). Effects from tariffs on the US or China will result in larger losses in competitiveness for Indonesia under the GVC optic than under bilateral gross trade.
From 2000 to 2014, Indonesia increased its links with China and decreased its ties with Japan, Korea, and the US (Figure 2). In 2000, the weight indicating Indonesia’s value-added trade with Japan was four times larger than for the Indonesia–China trade. By 2014, the importance of trade with China for Indonesia was three times larger than that with Japan. Similarly, Indonesia lowered its share of value-added exports to the US from 0.29 in 2000 to 0.19 in 2014. The increasing weights in trade with China and the decrease in weights with the US, Japan, and other big partners are in line with Mattoo et al. [35] who found increased global competition (overlap) from China. An increasing integration of Indonesia with China raises the exposure of Indonesia to further tariffs imposed by the US on China. Moreover, after 2005, Indonesian exports to China shifted towards production sharing (integration with the GVC) as the VA weight indicator exceeded the GO_weight.
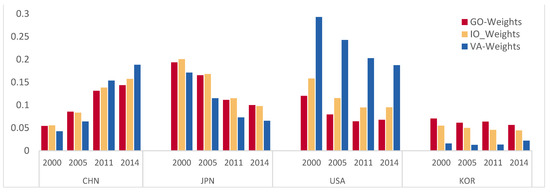
Figure 2.
Trade weights for Indonesia versus key partners 2000, 2005, 2011, 2014. Note. GO (Gross Output/conventional) IO-Weights value-added based on (σ,ρ,γ) = {1,1,1}, VA-REER weights elasticities (σ,ρ,γ) = {3,0,0}. China (CHN), Japan (JPN), United States (USA), and South Korea (KOR).
Although the value-added and conventional weights are positively correlated (see Figure 3) the share of Indonesian exports among trade partners tends to be larger in value-added terms than in gross terms. The strong forward position of Indonesia within GVC is commonly pointed out [33,41]. Exports to China, US, and major partners have larger linkages when computing trade indexes based on value-added rather than gross exports (Figure 3a). Trade linkages may then be channels of transmission of impacts on demand for Indonesian exports, most substantially via China.
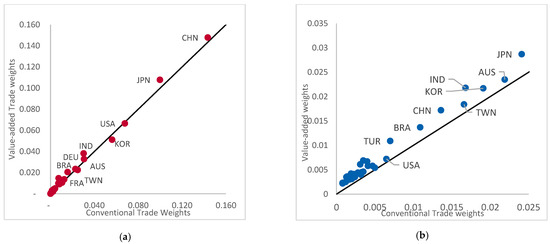
Figure 3.
Value-added weights vs. conventional weights (Indonesia and main trade partners). (a) VA-weights vs. conventional weights for Indonesian exports. (b) VA-weights vs. conventional partner weights for Indonesia.
The same applies when looking at Indonesia’s importance for its trade partners (Figure 3b). China, US, and other trade partners employing Indonesian IPCs to produce exports, are exposed to competitiveness changes met by Indonesia as it raises or lowers the cost of production. In both optics, Indonesia’s importance as a trade partner increases under the GVC perspective (value-added). Still, the relevance of Indonesia as a supplier of inputs for China and the US is rather small, suggesting that a slowdown in trade may result in rather small changes for Indonesia, in line with Ludema et al. [43].
To determine how large the change in indirect demand for Indonesian goods may be, we look into different parameters in elasticity of substitution. Differences in trade elasticities can magnify gains and losses due to price changes [44,45]. There are three factors on the Elasticity of Substitition (EoS) that suggest different degrees of substitutability across sources.
First, the impact from tariffs will depend on whether IPCs face large or low elasticity of substitution. The demand for final goods is commonly assumed to be more price elastic than the demand for parts and components (IPCs). It is commonly held that IPC substitution is more challenging in the short term, taking longer periods of adjustment. The magnitude of the elasticity parameters of IPC vary according to the sophistication (substitutability) of goods [41]. As a comparison, we display the relationship between EoS and the share of IPC in trade (Figure 4) and the relationship between EoS and the percentage of final goods exports.
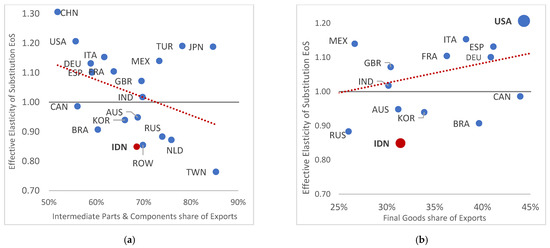
Figure 4.
(a) Intermediate parts and final goods share of exports vs. effective elasticity of substitution EoS. (b) Final goods of exports vs. effective elasticity of substitution EoS.
Second, the share of IPC and final goods in countries’ total trade will determine whether countries are exposed to larger or lower elasticity of prices. Nearly 70% of total exports from Indonesia are IPCs (Figure 4). We estimate an effective elasticity of substitution (EoS) of nearly 0.85 when employing low production elasticity parameters. India displays a similar pattern of exports to Indonesia in trade share of IPCs, although the EoS that India faces is 1.02 (30% more elasticity in demand than Indonesia). In an extreme example, Taiwan exports nearly 85% of value-added in IPCs, thereby facing a lower EoS (0.76). On the other extreme, China exports 52% of value-added in IPCs and faces a higher effective elasticity of substitution (1.31), which is highly elastic demand. The US exports 56% of value-added in IPCs but meets a relatively low EoS (1.21).
A lower EoS as for the Indonesian and Taiwan cases, suggests that exports are more difficult to substitute for, as the inputs they need may be more sophisticated or specialized. Indonesia’s goods are less sophisticated than those of their peers in advanced or even emerging countries [41]. The large ratio of natural resource exports explains the low elasticity of substitution in Indonesia [32]. Nevertheless, the large EoS faced by China suggests that US tariffs can cause a substantial drop in demand, leading to spillovers in countries sourcing to China (e.g., Indonesia), in line with [14,15].
A third aspect relates to the share (importance) of total exports in value-added terms, with larger countries’ openness suggesting more exposure to shock transmission [20,25]. More openness to trade and more extended links translate into greater responsiveness to global changes in prices [27]. Although IPC is considered in the literature as having lower EoS [23], considering that some countries trade highly in IPC, means they are more exposed to changes in global prices under the VA framework than under the gross output framework [46]. Figure 1 illustrates Indonesia’s trade weights versus those of its main partners. China and the United States rank first and second as main trade partners. Asian countries take top positions, meaning that the Asia region weighs more heavily for Indonesian trade. China’s expansion as a trade hub in Asia is particularly large [17,34]. Increases in tensions between the US and Asian countries (e.g., China, Japan, India, and South Korea) can lead to larger losses for Indonesia, as nearly three-quarters of its IPCs are exported to Asia, and nearly a third is re-exported to other regions [33].
4.2. Value-Added REER Index Measurement
Building on the Bems and Johnson’s [28] model, after estimating trade weights, we first compare the conventional REER Index (Equation (1)) and VA-REER index (Equation (11)) for five Asian countries and the United States from 2000 to 2014. The case of low production elasticities is employed as the primary reference. We then assess the extent to which demand responds to changes in prices (competitiveness) in the traditional REER (Equation (2)) and the VA-REER framework (Equation (12)).
We briefly report on REER and VA-REER indexes from 2000 to 2014. Their larger conventional REER than VA-REER suggests that Japan, Indonesia, India, South Korea, and the US were more competitive in value-added terms than was indicated in conventional REER (gross trade). The opposite occurred for China as the traditional REER index indicated gains in competitiveness, although in VA-REER China was appreciating (less competitive after joining the WTO). From 2008 to 2014 China started appreciating in both REER and VA-REER, in line with Patel et al. [40]. The Indonesian case shows a constant fluctuation in both indexes, with a tendency towards a loss in competitiveness in both gross and value-added. After 2009, Indonesia experienced a sharp appreciation in value-added, leading to a decline in competitiveness during the global financial crisis, and a slight recovering process after 2011. By contrast, Japan, S Korea, and to a lesser extent the United States, reported larger gains in value-added competitiveness than in gross REER.
China’s gain in gross competitiveness until 2008, and the improvement of Japan and South Korea in value-added competitiveness, may partly explain the US’s increase in gross imports from Asian countries [2,7,20]. Our findings are in line with Thorbecke [4] and Lee [20], who found that price competitiveness on countries supplying IPCs to China was crucial in explaining China’s exports (i.e., electronics, machinery, and manufacturing). Trade tensions were partly motivated by the disproportionate increase in the trade surplus in China compared to the US [10]. Price competitiveness in China is supported by Asian currencies [4,35] and by gaining technical competitiveness [5]. Still, as noticed in [11] China’s increasing trade competitiveness has not only increased the trade imbalance with the US but also created trade imbalances with other countries.
A more substantial gap between REER and VA-REER measures emerges after 2011, likely related to the “collapse of trade” as reported in Bems et al. [46]. Most countries in the sample provided in Figure 5 gained in VA competitiveness while losing in conventional REER. Huidrom et al. [22] reported that by 2014, gaps (standard deviation) between VA-REER and gross REER expanded substantially (45% standard deviation). Differences in the indexes are attributed to either the composition of weights or the effect of prices. Conventional REER employs CPI as a reference for prices while VA-REER uses GDP deflator.
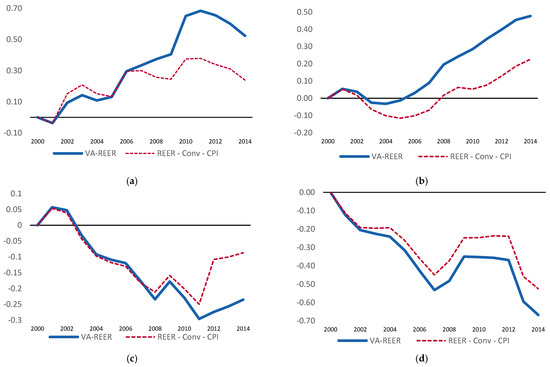
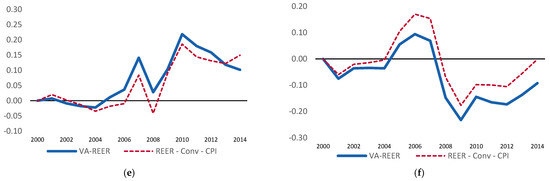
Figure 5.
Value Added REER and conventional REER (2000–2014) selected countries. Note. Value added REER measurements (VA–REER), REER (gross exports REER), REER uses Consumer Price Index (CPI) while VA–REER uses GDP deflator. (a) Indonesia, (b) China, (c) United States, (d) Japan, (e) India, and (f) South Korea.
4.3. Change in Demand for Value-Added
We now move into estimating the new demand for value-added derived from changes in the VA-REER index. Regarding export patterns from China, it is worth noting that as China increases its participation in trade through the Global Value Chain (GVC), it improves its technological capability and Domestic Value-Added (DVA) in line with recent studies [5,17]. The rise in DVA content of Chinese exports and the increase in tariffs also weaken Chinese relations with its suppliers. The impact from US tariffs may harm domestic players in China to a higher degree than the foreign partners [43]. Bown et al. [1] found that increasing the DVA content of exports (i.e., Chinese) decreases the probability of tariff removals. Meanwhile, increasing the share of value-added from partners (i.e., US) raises the probability of tariff removal.
We are particularly interested in the flow of demand changes between Indonesia and the China–US. Regarding Indonesia’s trade patterns, it is worth looking at the two aspects linked to changes. First, Indonesia’s exposure to demand changes due to price variation decreases with traditional trade partners in Europe, the United States, and Japan (Figure 6). In 2014, a 1% change in price would have decreased demand by −0.05% for value-added exports to the US. In the year 2000, a 1% change in price would have resulted in a −0.12% change in demand for VA exports. However, exposure to trade with China has increased over time. A 1% change in price in 2014 decreased demand for Indonesian exports to China by −0.048%, three times more than the 2000 figure. These findings suggest a reorientation of Indonesian trade to China, away from its traditional partners, and higher Indonesian participation in vertical specialization with China. In previous studies, Indonesian exports to China (2004) were mainly reported as one-way trade [38]. By 2011, Indonesia was more integrated with China, yet it lost export competitiveness to other countries [33]. China took over from Indonesia’s foreign markets, in line with findings from Purwono et al. [18].
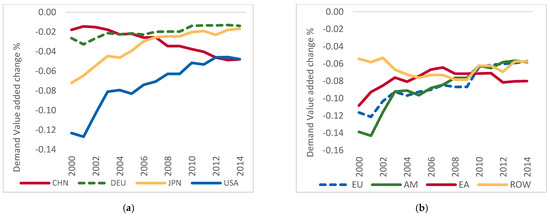
Figure 6.
Demand value added change in Indonesia following a 1% price change in partner country or region (low production elasticity scenario). (a) China (CHN), Germany (DEU), Japan (JPN), and United States (US). (b) European Union (EU), America (AM), East Asia (EA), Rest of the World (ROW).
A second aspect of the changes referred to above, is that the exposure to demand that changes following an increase in prices is nearly twice as large when using the value-added approach than when using the conventional Armington approach (Figure 7). The effect is similar to that observed by Huidrom et al. [22]. For example, the change in demand for Indonesian exports to the United States after a 1% increase in price is 2.5 times larger when considering trade linkages (GVC) and the presence of heterogeneous elasticities. Similarly, the value-added approach suggests that Indonesian exports to China are 45% more responsive to price changes than indicated by conventional REER. As such, it indicates that indirect effects from tariffs imposed in the China–US trade market and by other countries, are more properly captured in a GVC context, as a large share of trade is indirect.
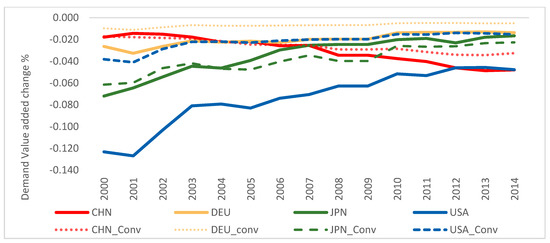
Figure 7.
Demand value added change from Indonesia following a 1% price change in partner country or region (low production elasticity vs. Armington). Note. Solid line (VA REER measures for low production elasticities); dotted lines (conventional REER measures).
Indonesian exports to China, the US, and Europe have large shares of domestic value-added content [33], a substantial share under natural resource-based materials, making them more exposed to trade impacts. Indonesian gains by joining the GVC may be low considering its position in the initial section of the chain and relatively low participation in higher technological and high skill sectors [47].
4.4. Trade Shocks
To estimate the impact deriving from tariffs between the US and China, we propose a scenario of a 5% tariff imposed by the US (and China) on all imported goods and a further retaliation by all countries. Tariffs are introduced as increases in prices for final goods (full pass-through in line with evidence in Fajgelbaum et al. [9]).
The 5% tariffs on Chinese goods exported to the US imply a decrease of −0.359% in value-added exports from China. Following Equation (A7) in Bems and Johnson [28], the indirect effects on demand for Indonesian value-added (via forward linkages) are estimated at −0.038%. The impact via forward linkages for India (−0.043%) and Japan (−0.021%) also indicate a loss. In S Korea, the impact is positive (0.039%), likely as the expenditure switching in favor of US goods demands larger Korean inputs. The 5% tariff on Chinese goods leads to an increase of 1.10% in domestic production in the US, quite likely raising demand for input supplies from S Korea as a complement to US goods. In Japan’s case, the impact is lower than for Indonesia, as most likely there would be additional demand in favor of Japanese goods in the US, in line with findings of Kumagai et al. [13].
For the US, a 5% tariff imposed by China on American goods leads to a decrease in demand for value-added of −0.212%. The US’s drop is lower than that of China mainly due to the value-added share composition, the effective elasticity of substitution (lower for US goods), and the trade linkages that the US has with China. The indirect effects on Asian countries as a result of tariffs on US goods are positive. The point is, that expenditure switching towards Chinese goods leads to 1.75% more Chinese domestic production (as US goods become more expensive in China), leading to an increase in demand for Asian inputs. Demand for value-added increases on ICPs goods exports originating in Indonesia (0.005%), India (0.003%), Japan (0.012%), and S Korea (0.036%).
Our findings support the contention that tariffs imposed by the US against China spill over to Indonesia, causing a decrease in demand for Indonesian inputs. Still, the impact on Indonesia is smaller than indicated theoretically, though in line with previous studies [15,25,26]. The participation of Indonesia in GVC linked to the US is small, suggesting that even in the event of trade diversion, gains for Indonesia may be small [6], requiring substantial extra efforts from Indonesian exporters to benefit from it [25,48]. Trade diversion gains via indirect partners (Korea, Japan, India, or ASEAN) may offer larger gains [11].
Applying the scenario of 5% tariffs from the US on all countries and estimating changes in demand in REER and VA-REER provides some insights. It is noticeable that the impact of such tariffs for Asians and some emerging countries becomes two to three times larger (Figure 8) when employing a value-added REER approach than when using a conventional REER. As for the Indonesian case, the differences in REER indicators arise in three ways. First, nearly 70% of Indonesia’s value-added exports are exported in the form of IPCs, with nearly 26% to be re-processed and re-exported by partners. Second, although IPCs generally have lower elasticity of substitution (0.85), the large share of exports of IPCs leads to larger exposure via different channels (indirect effects). Third, the large concentration of trade via specific partners (e.g., China, US, Japan) increases the impact of tariffs imposed by China and the US on Indonesian exports.
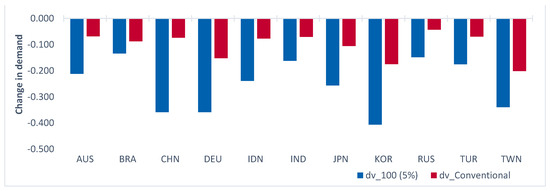
Figure 8.
Change in demand for exports after a 5% US tariff (% change in demand). Note. Australia (AUS), Brazil (BRA), China (CHN), Germany (DEU), Indonesia (IDN), India (IND), Japan (JPN), Korea (KOR), Russia (RUS), Turkey (TUR), Taiwan (TWN). DV_100 (5%) Change in demand for value-added under VA-REER approach, dv_conventional (change in demand for exports in conventional REER.
To illustrate the point, a 5% tariff from the US on all imports will result in a decrease of −0.24% in Indonesian exports when using VA-REER approach. Meanwhile, the traditional REER framework predicts a reduction in exports of −0.07%. Spillovers are amplified for Indonesian trade as a result of indirect trade via the GVC. As a comparison, India, which has lower participation in the value chains linked to the US, faces a decrease in demand of −0.075% based on the REER, while the VA-REER predicts −0.162%. Although both India and Indonesia have similar impacts under conventional REER, the effect of the imposition of 5% tariffs is three times larger for Indonesia under the VA-REER. In comparison, the impact of tariffs on demand for Indian exports increases only by 30% under VA-REER. The differences in the impacts arise from patterns of exports and trade links to the US market.
4.5. Final Discussion and Limitations
Our contribution highlights that it is important to employ value-added data to capture the fragmented structure of trade under GVC. Second, our findings suggest that allowing for heterogenous elasticities is important as demand for exports can widely vary, as indicated for the case of China and US (large elasticity of substitution) and for Indonesia (low elasticity). For instance, the pattern of trade can magnify the impact of trade tensions or it can mitigate the effects. As the VA-REER is a partial equilibrium, it does not capture export diversion which is likely to take place as tariffs are imposed between the US and China as noted in the literature [11]. Still, trade diversion under GVC is unlikely to take place in the short run [1,16]. Furthermore, the elasticities (parameters) suggest substitution of imported goods for local products in search of lower prices. Still, as noted in Fajgelbaum et al. [9] prices of goods with duties in the US did drop, suggesting a full pass-through of taxes to consumers, which resulted in losses for Americans of nearly USD 51 billion in 2018–2019. As noted by Amiti et al. [16], the pass-through of prices (tariffs) on consumers and firms is a byproduct of the tardiness of the value chain reorganization.
Some limitations of our study include, first, the absence of scenarios where trade diversion is possible, although such effects will take time. Second, our data uses the 2000–2014 period to simulate the effects of the trade war (2018–2022), with obvious implications on time lapses (see Appendix A for details on data limitations). Such limitation derives partly from the limited availability of data. Additionally, the World Input–Output Dataset (WIOD) does not have any Southeast Asian (ASEAN) partner apart from Indonesia. Third, parameters of elasticity of substitution are more complex in real life than the assumptions we used for our model. Other studies have analyzed the dynamics of elasticities. Further studies may consider more desegregated data at the industry or product level, and tariff scenarios adjusting to real tariff sanctions.
5. Conclusions
This study examined the indirect impacts of the trade tensions between the United States (US) and China on demand for Asian exports, particularly Indonesia. By applying a Value-Added Real Effective Exchange Rate index (VA-REER) instead of a conventional REER indicator, we obtained a better interpretation of how China–US trade tensions impact Asian partners. The distinction is important as the linkages developed by Indonesia with China are particularly large, suggesting that US–China trade tensions could decrease demand for exports from Indonesia that travel to the US via the China value chain.
To examine how trade tariffs are transmitted across the Global Value Chain (GVC), we simulated a demand change for exports arising from tariffs (scenarios of 1% and 5% tariffs, followed by a retaliation). The VA-REER accommodates different elasticities of substitution between final, input goods, and factors and trade weights are employed using value-added data to capture fragmentation in trade within GVC. The WIOD for the 2000-2014 period was employed.
A simulation of a bilateral tariff of 5% between China and the US implies a decrease of −0.359% in value-added exports from China to the US and a decrease of −0.212% vice versa. The decline in US exports is lower than that of in China mainly as China has large domestic value-added exports, China has a larger effective elasticity of substitution (lower for US goods), and the trade linkages that China has with the US are more extensive. The spillover effects from the 5% tariff (US–China trade tension) indicates a mild effect on Indonesian value-added exports. A 5% tariff levied by the US on Chinese goods will have a spillover effect on demand for Indonesian goods by −0.038%. On the other hand, tariffs imposed by China on US goods raises demand for Indonesian exports, leading to small positive effects for Indonesia.
Our findings highlight the importance of the GVC, the price elasticity of exports, and the concentration in export markets when analyzing spillover impacts (trade shocks). We found that accounting for Global Value Chains (applying the VA-REER) indicates a reaction three times larger than the conventional gross trade (REER approach), suggesting that most of the impacts on tariffs are transmitted via supply chains. Applying conventional REER weights underestimates the importance of bilateral value-added trade with China by 26% and 2.7 times with the US. When using conventional gross terms, China seems a doubly more important partner for Indonesia than the US. However, when applying value-added REER, both countries are equally important.
Additionally, we found a substantial change in Indonesia’s pattern of competitiveness with its two largest trade partners (China and the US). Indonesia lost in price competitiveness with both partners. In 2014, a 1% change in relative prices between Indonesia and the US leads to a change of 0.048% in exports, three times lower than the expected change in early 2000 (0.12%). Similarly, a 1% change in relative prices with China decreases exports by 0.05%, while in early 2000, a change would have resulted in a 0.18% change in exports. China increased its participation in the GVC, increased its domestic value-added content, and improved in price competitiveness. Indonesia lost in value-added competitiveness compared to other Asian partners and experienced large swings, most likely as it was faced with larger increases in prices and exposed to global commodity prices. The period of the global financial crisis resulted in a loss of competitiveness for Asian countries and in large fluctuations in prices.
Author Contributions
R.P. carried out the conceptualization, supervision, and validation; U.H. handled the methodology and formal analysis. M.K.M. focused on the investigation, data curation, and original draft preparation. M.A.E. carried out the writing—review and editing. All authors have read and agreed to the published version of the manuscript.
Funding
This research received funding from the Research Grant program Research Grant Bank Indonesia 2020. The APC was funded by Universitas Airlangga, Indonesia.
Institutional Review Board Statement
Not applicable.
Informed Consent Statement
Not applicable.
Data Availability Statement
The World Input-Output Database project. Available online: http://www.wiod.org/release16 (accessed on 6 December 2021). The IMF World Economic Outlook database. Available online: https://www.imf.org/en/Data (accessed on 6 December 2021).
Acknowledgments
This research was partially supported by the Research Grant Bank Indonesia (RGBI) 2020, Bank of Indonesia. The authors gratefully acknowledge the contributions of Bekti Setyorani and Ari Dwi Jayanti for their support in the methodology used for this article.
Conflicts of Interest
The authors declare no conflict of interest.
Appendix A
There are different international input–output tables available (See Table A1). Considering that our study is grounded in the models developed by Bems and Johnson [28], and Patel et al. [30], which use WIOD data from 2000–2011, our study proposes using the most recent version of WIOD data from 2000–2014. WIOD is one of the most frequently used input–output databases for examining the macroeconomic impacts of international trade. Table A1 shows recent studies that analyze the spillover effects in the context of global value chains using input–output tables. These studies use reference data (benchmarks) from previous periods (data gaps of 5–8 years).
A general limitation in tariff impact studies using global input–output tables is the gap in the data since the tables are updated with extended year intervals. However, looking at the pattern of value-added in exports (Figure A1), the structure of value-added in trade generally requires long periods to change. As such, studies that exemplify the impact on tariffs usually generate scenarios using lagging data because the more up-to-date data is not available. Since the structure of production networks does not present structural changes in the short term, this gap in data does not usually represent a fatal loss in the scenario precision. For example, Figure A1 shows the Share of Exports’ final goods and intermediate goods (selected countries) for 2000, 2005, 2010, and 2014. It can be seen that the percentage of domestic value-added in Indonesian exports in 2000 was 83% and 85% in 2014, which means a change of 2% in 15 years. US domestic value-added exports changed from 84% in 2000 to 88% in 2014. In the same way, the structure of exports in intermediate and final products presents gradual changes that are perceptible only in the long term.

Figure A1.
Share of exports of final goods and intermediate goods (selected countries) 2000, 2005, 2010, and 2014. Note. Exports of Final Goods (EX_Final Goods), Exports of Intermediate Parts and components (P&C), and Value-Added Exports (VAX). Americas, Brazil (BRA), United States (USA), China (CHN), Indonesia (IDN), India (IND), Japan (JPN), Korea (KOR), Taiwan (TWN), Germany (DEU), Russia (RUS), Turkey (TUR), Rest of the World (ROW).

Table A1.
Related empirical studies using global input–output databases.
Table A1.
Related empirical studies using global input–output databases.
| Reference | Year Published/Case Studied | Data Source/Reference Period |
|---|---|---|
| Shi et al. [19] | (2021) Transmission of US tariffs on China to Trade Partners | Reference Period: WIOD 2002–2014 OECD ICIO 1995–2011 |
| Ludema et al. [43] | (2021) Impacts on tariffs under GVC production networks—Effects in demand derived from Tariffs on China | Period: 2000–2006 (Benchmark) China’s General Administration of Customs (CGAC) |
| Purwono et al. [18] | (2021) Network Analysis—Spillover effects from the US-China tension for East Asia | Reference Period: 2005–2015 OECD_WTO-Trade in Value Added (TiVA) |
| Timmer el al. [29] | (2021) GVC fragmentation and international trade shocks; implications from elasticities of demand | Reference Period: 2000–2014 WIOD Database |
| Llano et al. [24] | (2020) Impact of Sino-American Trade War on Europe Car Industry | Period: 2014 WIOD |
| Devarajan et al. [48] | (2020) Developing countries’ response to Sino-US Trade Tensions | Benchmark period: 2011 (base year) Global Trade Analysis Project (GTAP) |
| Fajgelbaum et al. [9] | (2020) Impact of American import duties on US prices | Period: 2016 Bureau of Economic Analysis (BEA), Input–output (I-O) |
| Li et al. [15] | (2020) Welfare impact of US–China tariffs | Benchmark 2017 GTAP10 data |
| Xiaoa et al. [17] | (2020) Regional GVC configuration (China, US, Europe) and network effects | Period: 2000-2017 Multiregional input–output (MRIO) tables (Asian Development Bank) |
| Buckley et al. [42] | (2020) Catching-up in Global value chains. | Period: 2000–2014 WIOD Database |
| Li et al. [5] | (2020) China. Impact of GVC complexity | Period: 2000–2014 WIOD |
| Amiti et al. [8] | (2019) Impact of US import tariffs on consumer prices | Reference: 2007 US input–output table |
| Lee [20] | (2019) Transmission of domestic and external Shock (Trade) on Korean Industries | Period: 2000–2014 WIOD Database |
| Huidrom et al. [22] | (2019) Spillover effects from trade tension in major trade hubs (China, US, and German): effects in European economies | Period:1995–2018 Multi-Regional Input–Output (MRIO) World Input–Output (WIOD) |
| Simola [31] | (2019) Transmission of Trade Shocks from China across countries and sectors | Period: 2000–2014 WIOD Database |
| Patel et al. [30] | (2019) Price shocks (i.e., tariffs) applying REER–GVC REER approaches across countries and World | Reference Period 1995–2011 WIOD database with 40 countries, 35 sectors |
| Ma et al. [47] | (2019) Effects on employment derived from GVC participation–Global | Period: 1995–2011 (WIOD) |
| Bems and Johnson [28] | (2017) Europe. Impact on Demand for Exports using standard REER and the new value-added REER | Reference Period 1995–2011 WIOD database |
| Ma et al. [49] | (2016) Impacts of China’s rebalancing for foreign partners (transmission effects in GVC) | Period: 1995, 2000, 2005, 2008–2011 OECD Inter-Country Input–Output (ICIO) |
Source. Author’s own ellaboration.
References
- Bown, C.P.; Erbahar, A.; Zanardi, M. Global value chains and the removal of trade protection. Eur. Econ. Rev. 2021, 140, 103937. [Google Scholar] [CrossRef]
- Bown, C.P. The 2018 US-China trade conflict after forty years of special protection. China Econ. J. 2019, 12, 109–136. [Google Scholar] [CrossRef]
- Lau, L.J. A Better Alternative to a Trade War. China World 2018, 1, 1850014. [Google Scholar] [CrossRef]
- Thorbecke, W. Rebalancing Trade in East Asia: Evidence from the Electronics Industry. Emerg. Mark. Finance Trade 2017, 53, 2696–2705. [Google Scholar] [CrossRef]
- Li, Y.; Zhang, H.; Liu, Y.; Huang, Q. Impact of Embedded Global Value Chain on Technical Complexity of Industry Export—An Empirical Study Based on China’s Equipment Manufacturing Industry Panel. Sustainability 2020, 12, 2694. [Google Scholar] [CrossRef]
- Pangestu, M. China–US trade War: An Indonesian perspective. China Econ. J. 2019, 12, 208–230. [Google Scholar] [CrossRef]
- Liu, T.; Woo, W.T. Understanding the U.S.-China Trade War. China Econ. J. 2018, 11, 319–340. [Google Scholar] [CrossRef]
- Amiti, M.; Redding, S.J.; Weinstein, D.E. The Impact of the 2018 Tariffs on Prices and Welfare. J. Econ. Perspect. 2019, 33, 187–210. [Google Scholar] [CrossRef]
- Fajgelbaum, P.D.; Goldberg, P.K.; Kennedy, P.J.; Khandelwal, A.K. The Return to Protectionism. Q. J. Econ. 2019, 135, 1–55. [Google Scholar] [CrossRef]
- Chong, T.T.L.; Li, X. Understanding the China–US trade war: Causes, economic impact, and the worst-case scenario. Econ. Politi-Stud. 2019, 7, 185–202. [Google Scholar] [CrossRef]
- Iqbal, B.; Rahman, N.; Elimimian, J. The future of global trade in the presence of the Sino-US trade war. Econ. Politi- Stud. 2019, 7, 217–231. [Google Scholar] [CrossRef]
- Li, C.; He, C.; Lin, C. Economic Impacts of the Possible China–US Trade War. Emerg. Mark. Financ. Trade 2018, 54, 1557–1577. [Google Scholar] [CrossRef]
- Kumagai, S.; Gokan, T.; Tsubota, K.; Isono, I.; Hayakawa, K. Economic Impacts of the US–China Trade War on the Asian Economy: An Applied Analysis of IDE-GSM. J. Asian Econ. Integr. 2021, 3, 127–143. [Google Scholar] [CrossRef]
- Itakura, K. Evaluating the Impact of the US–China Trade War. Asian Econ. Policy Rev. 2019, 15, 77–93. [Google Scholar] [CrossRef]
- Li, M.; Balistreri, E.J.; Zhang, W. The US–China trade war: Tariff data and general equilibrium analysis. J. Asian Econ. 2020, 69, 101216. [Google Scholar] [CrossRef]
- Amiti, M.; Redding, S.J.; Weinstein, D.E. Who’s Paying for the US Tariffs? A Longer-Term Perspective. AEA Pap. Proc. 2020, 110, 541–546. [Google Scholar] [CrossRef]
- Xiao, H.; Meng, B.; Ye, J.; Li, S. Are global value chains truly global? Econ. Syst. Res. 2020, 32, 540–564. [Google Scholar] [CrossRef]
- Purwono, R.; Heriqbaldi, U.; Esquivias, M.A.; Mubin, M.K. The US-China Trade War: Spillover Effects on Indonesia and other Asian Countries. Econ. Bull. 2021, 41, 2370–2385. [Google Scholar]
- Shi, B.; Wang, X.; Gao, B. Transmission and Diffusion Effect of Sino-US Trade Friction along Global Value Chains. Financ. Res. Lett. 2021, 102057. [Google Scholar] [CrossRef]
- Lee, D. Transmission of Domestic and External Shocks through Input-Output Network: Evidence from Korean Industries; IMF Working Paper No. 19/117; IMF: Washington, DC, USA, 2019. [Google Scholar] [CrossRef]
- Tan, K.G.; Duong, L.N.T.; Chuah, H.Y. Impact of exchange rates on ASEAN’s trade in the era of global value chains: An empirical assessment. J. Int. Trade Econ. Dev. 2019, 28, 873–901. [Google Scholar] [CrossRef]
- Huidrom, R.; Jovanovic, N.; Mulas-Granados, C.; Papi, L.; Raei, F.; Stavrev, E.; Wingender, P. Trade Tensions, Global Value Chains, and Spillovers: Insights for Europe; Department Papers/Policy Papers; International Monetary Fund: Washington, DC, USA, 2019; Volume 19. [Google Scholar] [CrossRef]
- Vandenbussche, H.; Connell, W.; Simons, W. Global Value Chains, Trade Shocks and Jobs: An Application to Brexit; CESifo Working Paper, No. 7473; Center for Economic Studies and Ifo Institute (CESifo): Munich, Germany, 2019; Available online: http://hdl.handle.net/10419/198833 (accessed on 6 December 2021).
- Llano, C.; Pérez, J.; El Khatabi, F.; Steinberg, F. Weaponized trade policy: The impact of US tariffs on the European automobile sector. Econ. Syst. Res. 2020, 33, 287–315. [Google Scholar] [CrossRef]
- Aslam, M. US-China trade disputes and its impact on ASEAN. Transnatl. Corp. Rev. 2019, 11, 332–345. [Google Scholar] [CrossRef]
- Carlos, C.; Diego, D.A.; Mano, R. Trade Wars and Trade Deals: Estimated Effects using a Multi-Sector Model; Working Paper No. 19/143; IMF: Washington, DC, USA, 2019. [Google Scholar]
- Raghavan, M.; Devadason, E.S. How Resilient Is ASEAN-5 to Trade Shocks? A Comparison of Regional and Global Shocks. Glob. J. Emerg. Mark. Econ. 2020, 12, 93–115. [Google Scholar] [CrossRef]
- Bems, R.; Johnson, R.C. Demand for Value Added and Value-Added Exchange Rates. Am. Econ. J. Macroecon. 2017, 9, 45–90. [Google Scholar] [CrossRef]
- Timmer, M.P.; Los, B.; Stehrer, R.; de Vries, G.J. Supply Chain Fragmentation and the Global Trade Elasticity: A New Accounting Framework. IMF Econ. Rev. 2021, 69, 656–680. [Google Scholar] [CrossRef]
- Patel, N.; Wang, Z.; Wei, S. Global Value Chains and Effective Exchange Rates at the Country-Sector Level. J. Money Crédit. Bank. 2019, 51, 7–42. [Google Scholar] [CrossRef]
- Simola, H. Evaluating International Impacts of China-Specific Shocks in an Input-Output Framework; BOFIT Discussion Papers 17/2019; BOFIT: Helinski, Finland, 2019. [Google Scholar]
- Padilla, M.A.E.; Sari, D.W.; Handoyo, R.D. Formation of production networks in ASEAN: Measuring the real value-added and identifying the role of ASEAN countries in the world supply chains. Bus. Econ. Horiz. 2017, 13, 237–255. [Google Scholar] [CrossRef]
- Esquivias, M.A.; Purwono, R.; Sugiharti, L.; Heriqbaldi, U.; Handoyo, R.D. Value Chains, Production Networks and Regional Integration: The Case of Indonesia. J. Ѐkon. Malays. 2020, 54, 135–151. [Google Scholar] [CrossRef]
- Padilla, M.A.E.; Handoyo, R.D.; Sugiharti, L.; Muryani, M. Production networks under The ASEAN Plus Six. A good deal or a threat? Entrep. Sustain. Issues 2019, 7, 81–91. [Google Scholar] [CrossRef]
- Mattoo, A.; Mishra, P.; Subramanian, A. Beggar-Thy-Neighbor Effects of Exchange Rates: A Study of the Renminbi. Am. Econ. J. Econ. Policy 2017, 9, 344–366. [Google Scholar] [CrossRef][Green Version]
- Kee, H.L.; Tang, H. Domestic Value Added in Exports: Theory and Firm Evidence from China. Am. Econ. Rev. 2016, 106, 1402–1436. [Google Scholar] [CrossRef]
- Timmer, M.P.; Erumban, A.A.; Los, B.; Stehrer, R.; De Vries, G.J. Slicing Up Global Value Chains. J. Econ. Perspect. 2014, 28, 99–118. [Google Scholar] [CrossRef]
- Bems, R.; Johnson, R. Demand for Value Added and Value-Added Exchange Rates; IMF Working Paper; IMF: Washington, DC, USA, 2015; Volume 15. [Google Scholar] [CrossRef]
- McGuirk, A. Measuring Price Competitiveness for Industrial Country Trade in Manufactures; IMF Working Paper No. 87/34; IMF: Washington, DC, USA, 1986. [Google Scholar]
- Patel, N.; Wang, Z.; Wei, S. Global Value Chains and Effective Exchange Rates at the Country-Sector Level; ADBI Working Paper 799; Asian Development Bank Institute: Tokyo, Japan, 2017; Available online: https://www.adb.org/sites/default/files/publication/390221/adbi-wp799.pdf (accessed on 6 December 2021).
- World Bank World Development Report 2020: Trading for Development in the Age of Global Value Chains; World Bank: Washington, DC, USA, 2019. [CrossRef]
- Buckley, P.J.; Strange, R.; Timmer, M.P.; De Vries, G.J. Catching-up in the global factory: Analysis and policy implications. J. Int. Bus. Policy 2020, 3, 79–106. [Google Scholar] [CrossRef]
- Ludema, R.D.; Mayda, A.M.; Yu, Z.; Yu, M. The political economy of protection in GVCs: Evidence from Chinese micro data. J. Int. Econ. 2021, 131, 103479. [Google Scholar] [CrossRef]
- Feenstra, R.; Luck, P.; Obstfeld, M.; Russ, K. In Search of the Armington Elasticity. Rev. Econ. Stat. 2014, 100, 135–150. [Google Scholar] [CrossRef]
- Ossa, R. Why trade matters after all. J. Int. Econ. 2015, 97, 266–277. [Google Scholar] [CrossRef]
- Bems, R.; Johnson, R.C.; Yi, K.-M. Vertical Linkages and the Collapse of Global Trade. Am. Econ. Rev. 2011, 101, 308–312. [Google Scholar] [CrossRef]
- Ma, S.; Liang, Y.; Zhang, H. The Employment Effects of Global Value Chains. Emerg. Mark. Finance Trade 2019, 55, 2230–2253. [Google Scholar] [CrossRef]
- Devarajan, S.; Go, D.S.; Lakatos, C.; Robinson, S.; Thierfelder, K. Traders’ dilemma: Developing countries’ response to trade wars. World Econ. 2020, 44, 856–878. [Google Scholar] [CrossRef]
- Ma, G.; Roberts, I.; Kelly, G. A Rebalancing Chinese Economy: Challenges and International Implications. In Proceedings of the Reserve Bank of Australia Conference ‘Structural Change in China: Implications for Australia and the World’, Sydney, Australia, 17–18 March 2016. [Google Scholar]


Publisher’s Note: MDPI stays neutral with regard to jurisdictional claims in published maps and institutional affiliations. |
© 2022 by the authors. Licensee MDPI, Basel, Switzerland. This article is an open access article distributed under the terms and conditions of the Creative Commons Attribution (CC BY) license (https://creativecommons.org/licenses/by/4.0/).