Abstract
The developments in urban rail transit (URT) construction are associated with the benefits of moving people efficiently and the negative impacts of noise and vibrations caused to surroundings. Despite a proliferation of studies conducted throughout the world, very few studies employed the field measurement approach due to various limitations. Using a metropolitan city, Tianjin (China), as an example, field measurement was set up to monitor the indoor vibration and noise spectrum in buildings near urban rapid transit lines to establish a baseline as well as the effectiveness of corresponding mitigation measures, namely wheel-rail polishing and train speed reduction. While our study suggests a maximum 6 dB reduction in indoor vibration, the effectiveness of noise and vibration reduction measures depends on the attenuation of the main frequency corresponding to the secondary radiation noise of the indoor vibration excitation in the building. In our field test, the peaks of the frequency spectrum were found to be 40, 50, 63 and 80 Hz. The secondary radiation noise attenuation and vibration were invariant to the change in frequency spectrum. Mitigation measures such as polishing may cause vibration frequency to peak in non-main frequency spectrums. URT speed reduction will lead to vibration and noise attenuation energy being concentrated at around 50 Hz. Given the presently inconsistent and widely varying industrial and international standards, this study can provide important field measurement data supporting future development in standards, regulation and legislation with respect to URT development, especially in mature townships.
1. Introduction
The rapid development of urban rail transit (URT) has become a twin-blade sword bringing the benefits of efficient and low carbon public transport and the negative health impacts associated with noise and vibration. If unmanaged, excessive noise emission from the construction and operation of URT can pose serious risks of increased hearing loss, increased mental stress and poor sleep quality, as well as causing cardiovascular disease [1]. The operation of URT further causes vibration leading to structure-borne noise in the surrounding built environment [2]. In more severe cases, such vibration can lead to safety implications for the buildings, as reported in the literature [3].
The negative impacts of noise hazards and associated social issues from URT have been well documented in the literature [4]. The commuter rail service in Kuala Lumpur, Malaysia, has a carrying capacity of about 70,000 passengers and serves 40 stations with 213 daily trips from Monday to Friday. The operation of the commuter rail has become a source of multiple noise hazards, such as wheel-rail vibration noise, aerodynamic noise, and engine and auxiliary machinery noise in the surroundings [5]. Due to the severe noise hazards caused by one of the subway lines in Moscow, some of most affected residents in the area, in more than 500 residential buildings, have to be relocated [6]. Vibrations from the operation of the Czech Republic’s rail transit system have caused cracked bricks in some of the historical brick buildings near rail station, and even a collapsed old church due to such cracks [6].
A survey in Japan showed that 45% of the survey participants agreed that vibrations caused by rail transit can negatively impact the quality of sleep [6]. In Beijing, residents of a five-story building about 150 meters from the railway near Xizhimen complained about strong vibrations of the building, caused by the passing trains, occurring to the extent that the vibration sometimes caused the self-movement of loose furniture inside the room [7]. Residents of Yitian village, near Yitian station on Shenzhen Metro’s Longgang Line, complained about low-frequency noise pollution from friction between tracks and wheels [6]. The same study [6] further found that residents of Gangxi Home even took the developer and the railway company to court as a result of the intolerable noise caused by rail operations.
The negative health impacts from URT noise pollution have attracted a rich pool of studies in the literature, especially in the areas of simulation, prediction and field measurement. Lyu et al. [8] proposed a noise prediction model for URT to explore measures for reducing noise from subway line construction and operation. On the basis of the existing model, the parameters were modified and improved, and the influence of environmental factors on noise and its prediction method were verified. At the same time, the authors also made some recommendations on how to reduce traffic noise at different times. The results show that it is suitable to use shock-absorbing rails and install sound-absorbing panels, and the noise reduction rate can reach more than 10%. He et al. [9] conducted a field measurement of vibrations generated by rail transit under three different track structures and noise generated under the influence of different track structures. Their results suggest that the noise barrier is more effective for the near-field wheel-rail rolling noise than for the far-field noise.
Zhang et al. [10] studied the measurement status and evaluation method of secondary radiated noise generated by URT, and compared the result with the current standard value. The results show that the current national standards can meet the actual measurement data, but there is also some deviation. The applicability, accuracy and rationality of the evaluation criteria need to be reanalyzed according to the measured data. At the same time, according to the current social needs of noise management, the analysis methods and standard suggestions for improving low-frequency noise monitoring in our country were put forward. Yao et al. [11] studied the rules of building and ground vibration caused by running trains, and established the dynamic spatial analysis model of the train-track–subgrade–soil–building system. In this model, the interaction between foundation soil and building foundation is divided into three situations: coordinated contact distortion, elastic contact distortion and nonlinear contact. The results show that energy is consumed with soil mass and buildings in nonlinear contact, so building vibrations induced by running trains are smaller than those in coordinated contact distortion and elastic contact distortion.
Yang et al. [12] proposed a two-step time–frequency prediction method for train-induced vibrations of a superstructure to examine measures for mitigating such vibrations. On this basis, the train-induced vibration of large buildings under different train operating conditions was predicted, and two related standards were used to evaluate the building vibration. The results show that the interaction of the underground train with the track can cause the vibration of the building to exceed the limit. The higher the speed of the train, the worse the vibration level of the track, which leads to the more serious the vibration level of the large building. The foundation isolation measures can effectively reduce the excessive vibration of the building. Liu et al. [13] predicted the vibration noise generated by subway operation. The study shows that the indoor vibrations along the buildings along the underground section of urban rail transit have low-frequency characteristics. The main frequency of vibration is concentrated below 80 Hz, which can cause resonance of human organs, leading to potential damage to human health [14]. Liang et al. [15] proposed a prediction model for URT-induced vibrations based on a neural network. The model was shown to have improved accuracy against data in the literature and was capable of performing uncertainty analysis. In addition to providing the mean of the forecast, the model was also able to provide a probability distribution to describe the uncertainty in the forecast. Compared to previously published measurements, the model proposed in this paper performed well in terms of prediction accuracy and uncertainty estimation. Based on the test data, Yuan et al. [16] studied the propagation rules in the time and frequency domains of ground vibration acceleration caused by subway trains passing through curved sections. Their results show that in the range of 100 m from the tunnel’s center line, the time history peak value of ground vibration acceleration induced by metro operation was mainly in the 10−2 m·s−2 order of magnitude, which is much larger than the 10−4 m·s−2 order of magnitude under background vibration. The horizontal vibration was 2 to 4 times that of the vertical vibration in the range of 50 m from the tunnel center line. It was suggested that both the vertical and horizontal vibration should be simultaneously taken into account in environmental assessments related to the curved sections of metro lines.
Vogiatzis et al. [17] showed that train types and the contact conditions at the wheel–track interface can influence the generation of vibrations. The study used a noise-map-based approach to provide an efficient method for the evaluation of multiple mitigation measures for noise exposure generated by dense urban railways. Mouzakis et al. [18] used finite element analysis software to study the structural vibrations caused by subway operation, and developed a two-dimensional finite element model of the tunnel–soil–building structure. Hammad et al. [19] proposed a new mathematical formula based on a binary and adopted integer programming model to optimize the location of a typical railway station construction project. Lopes et al. [20] proposed a numerical method to predict the vibration of buildings caused by railway traffic in tunnels. Based on the comparison between isolated and non-isolated cases, it was concluded that mat stiffness is the key parameter affecting the efficiency of floating slab systems. Peplow et al. [21] conducted numerical experiments on ground vibration using the semi-analytical finite element method and boundary element method. The parametric analysis of the vibration and noise reduction effects of different types of foundation vibration isolation walls and sound insulation walls was carried out, respectively. The result shows that a single structural-element can target a combined reduction in the probability of annoyance due to vibration levels of around 15% combined with 12 dB insertion loss, which amounts to a 30% reduction in the probability of annoyance due to railway traffic intrusive noise. He et al. [22] proposed an effective underground railway vibration prediction model. The model is based on the analytical method of horizontally layered half-space tunnels and has high computational efficiency and accuracy. The predicted results for the double-beam track model with uniform support and the continuum track model exhibited a good agreement with the site measurements.
Beyond engineering simulation and measurement studies, there are studies focusing on the perspective of regulatory development and urban planning. A study in Los Angeles tested the noise of each station and assessed the difference between the freeway and arterial platforms in order to identify and address the impact of noise from rail transit operations to nearby residents [23]. The findings of their study uncovered important factors for transport planners to consider when locating and designing in-roadway LRT platforms, such as vibration and noise. The United States and Singapore both emphasize a “people-oriented” approach in road traffic noise management. Noise management mostly originates from feedback by the residents and focuses on establishing regulations and standards to ensure the residents’ quality of living and protection against noise pollution [24]. The study by Chen et al. [6] focused on legal and technical analysis to realize the reduction in subway vibration and noise. The findings from their study suggest further studies should be carried out on vibration and noise reduction measures in order to ensure the physical and mental health of surrounding residents and the orderly development of subway traffic.
Data availability is a common daunting factor impeding the rapid advancement of noise pollution studies. As reflected in the literature review, a major proportion of the existing studies rely on simulation and modelling analysis. The lack of field-measured data pose significant challenges for the verification and validation of the mathematical models proposed in the literature. This issue of field data availability is most prominent in developing countries, such as China. In addition, developing countries tend to suffer from greater impacts from noise pollution due to a lack of sufficient regulations and standards, caused by insufficient field studies among other factors. Even fewer studies can be found on the field measurement of noises sources for mature townships, which has been proven to be the most challenging issue to regulators.
As a contribution to the literature, this study was carried out to provide additional references through the field measurement of URT noise sources from a mature town in China. Such references can help provide the needed field data for current and future studies to validate simulation models and modelling results. The findings from this study can also contribute to providing guidance for the future development of technical and operational measures and standards to reduce noise pollution from URT. The findings from this study can also be applied to the development of new lines, as well as the reconstruction of existing lines in mature townships.
The rest of the paper is organized as follows. Section 2 presents the methods for noise and vibration testing and data processing. Section 3 presents the results and interpretation. Section 4 presents further discussions based on the findings from the field measurement results. Section 5 concludes the paper with recommendations for future research.
2. Methodology
2.1. Test Setup
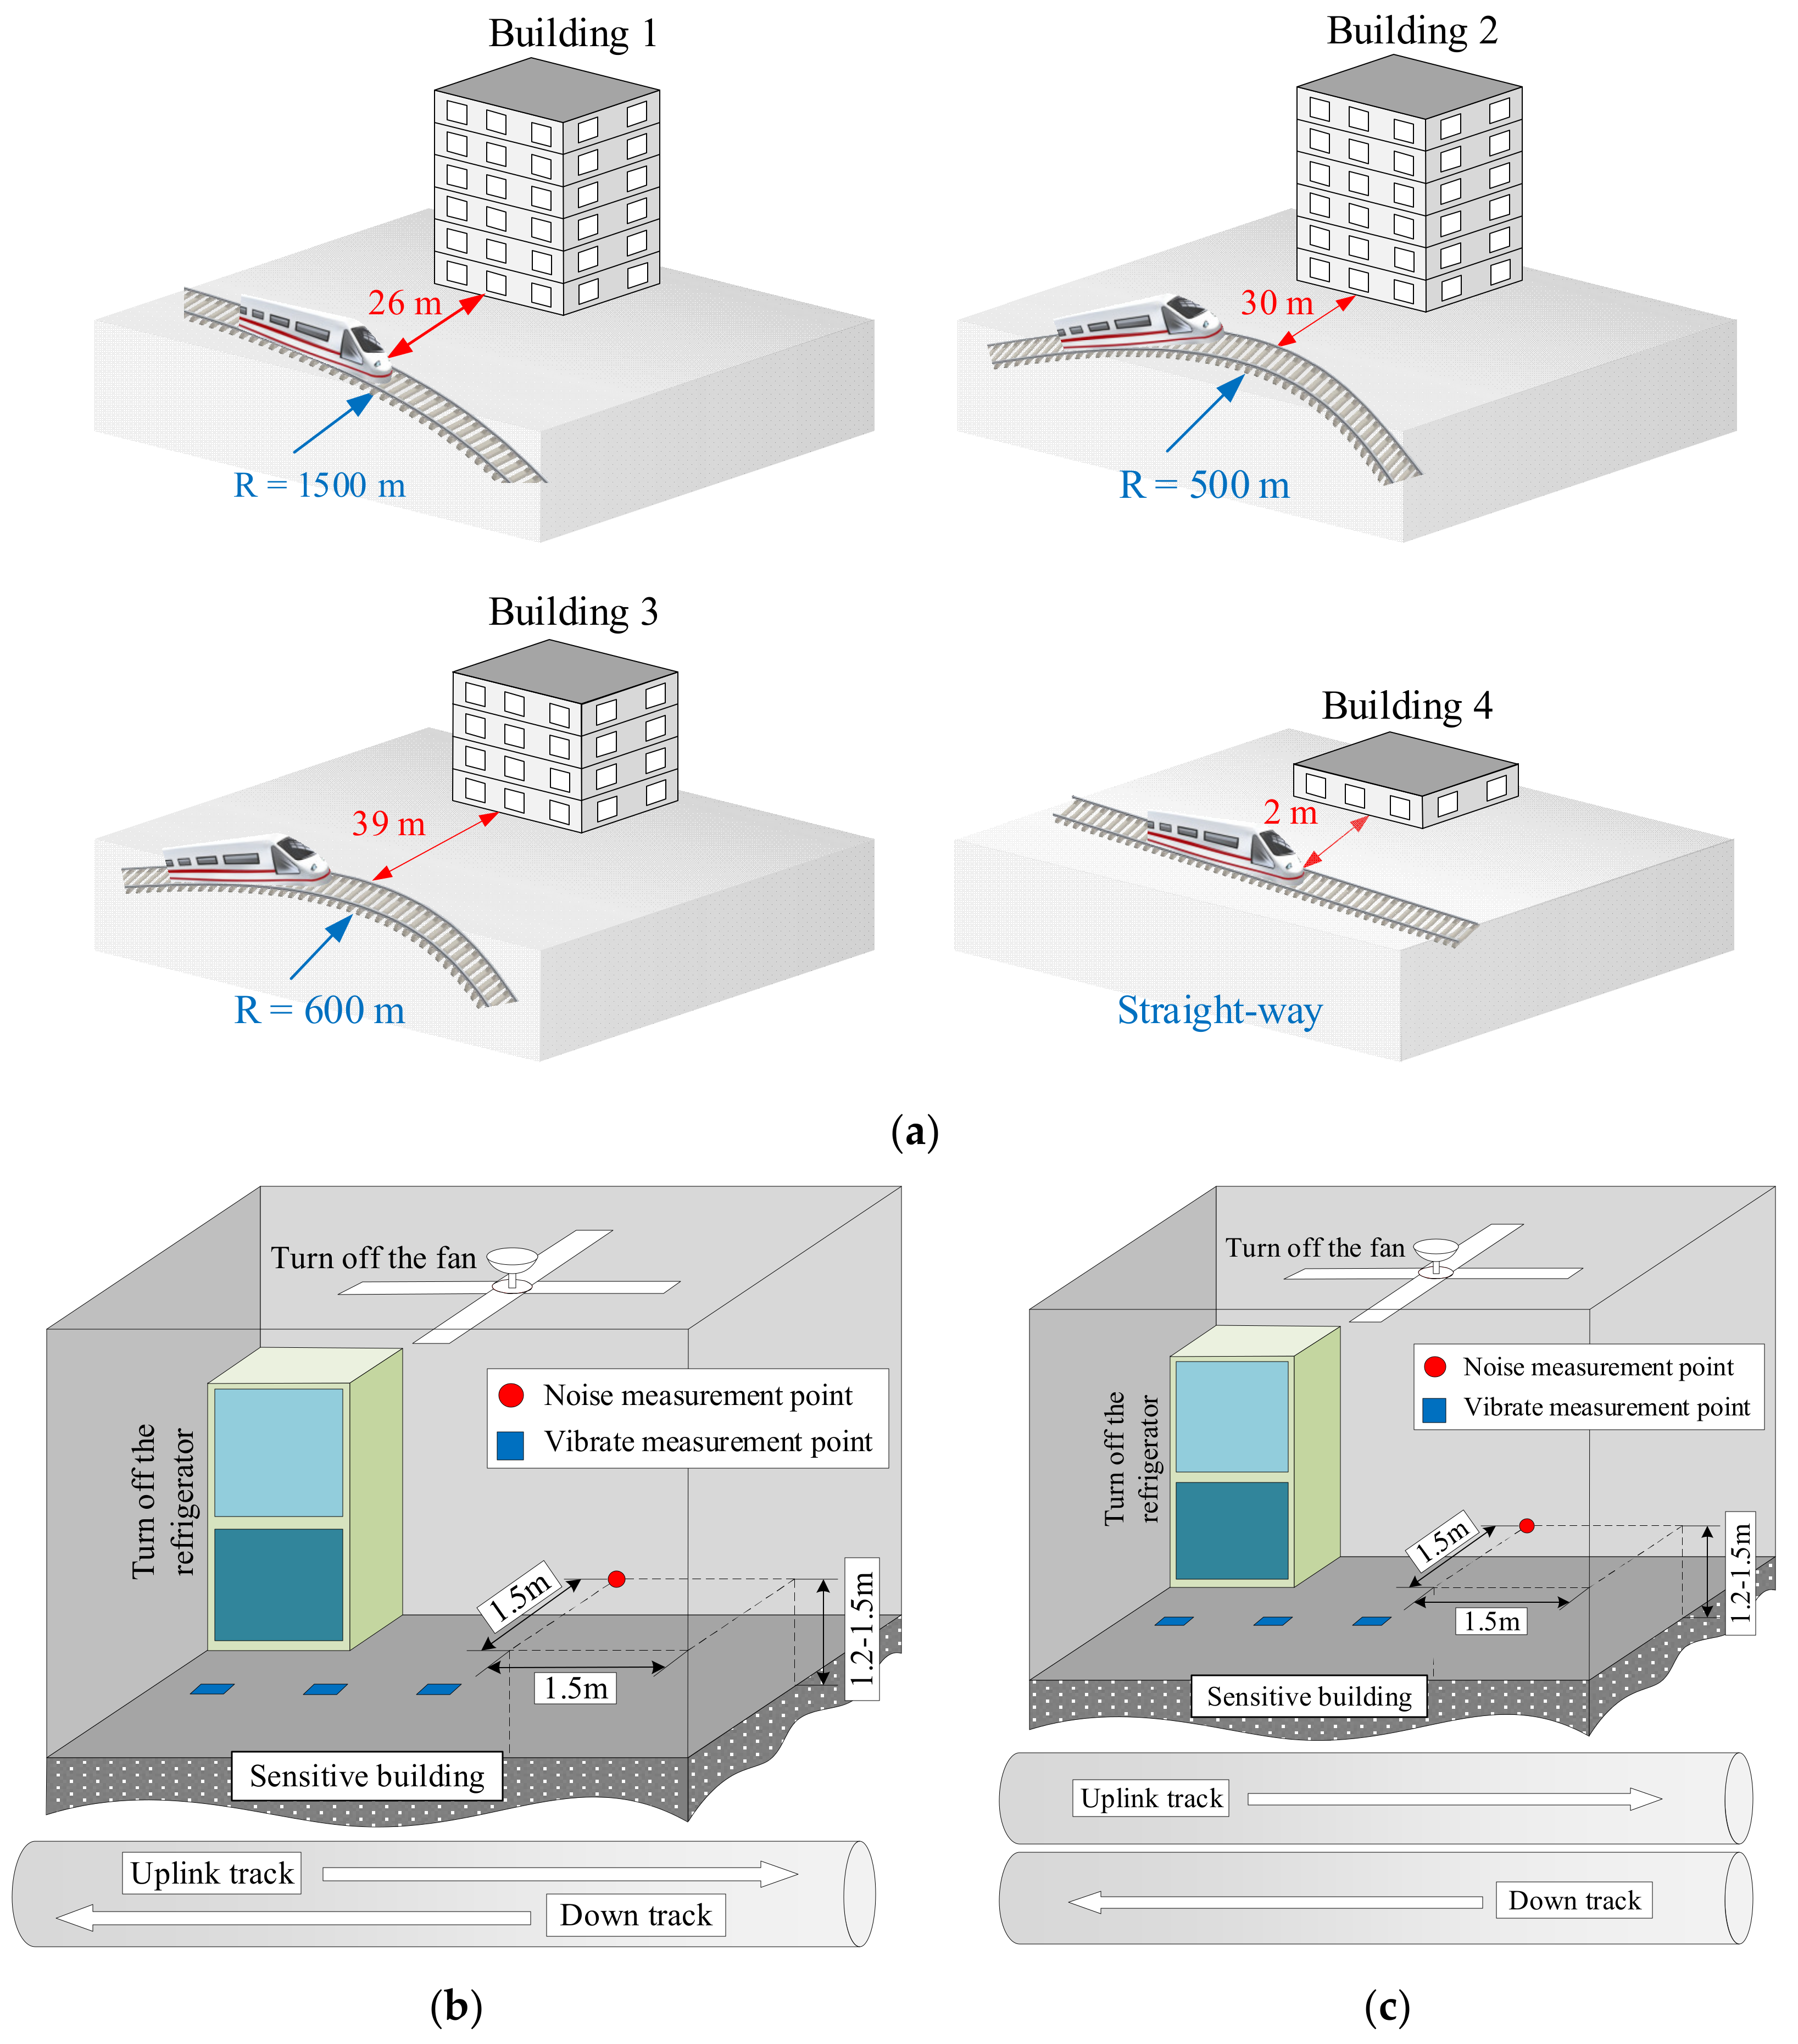
The measurements were carried out in Tianjin, China [25]. In order to study the indoor vibration and noise characteristics of buildings along the subway, four buildings located near three subway lines were selected for testing. As shown in Table 1, Buildings 2 and 3 are located near the same subway line. Buildings 1 and 2 have similar structures but are located near different subway lines. All selected subway lines have the following characteristics: full road bed, seamless rail, DTVI2 fasteners and 6 group-B stainless steel trains. The line speed is automatically controlled by the central system at 70 km/h and 45 km/h. The underground lines of Buildings 1, 2 and 4 are horizontal parallel lines of up and down tracks. Furthermore, the underground lines of Building 3 are vertical parallel lines of up and down tracks.

Table 1.
Test conditions of selected buildings.
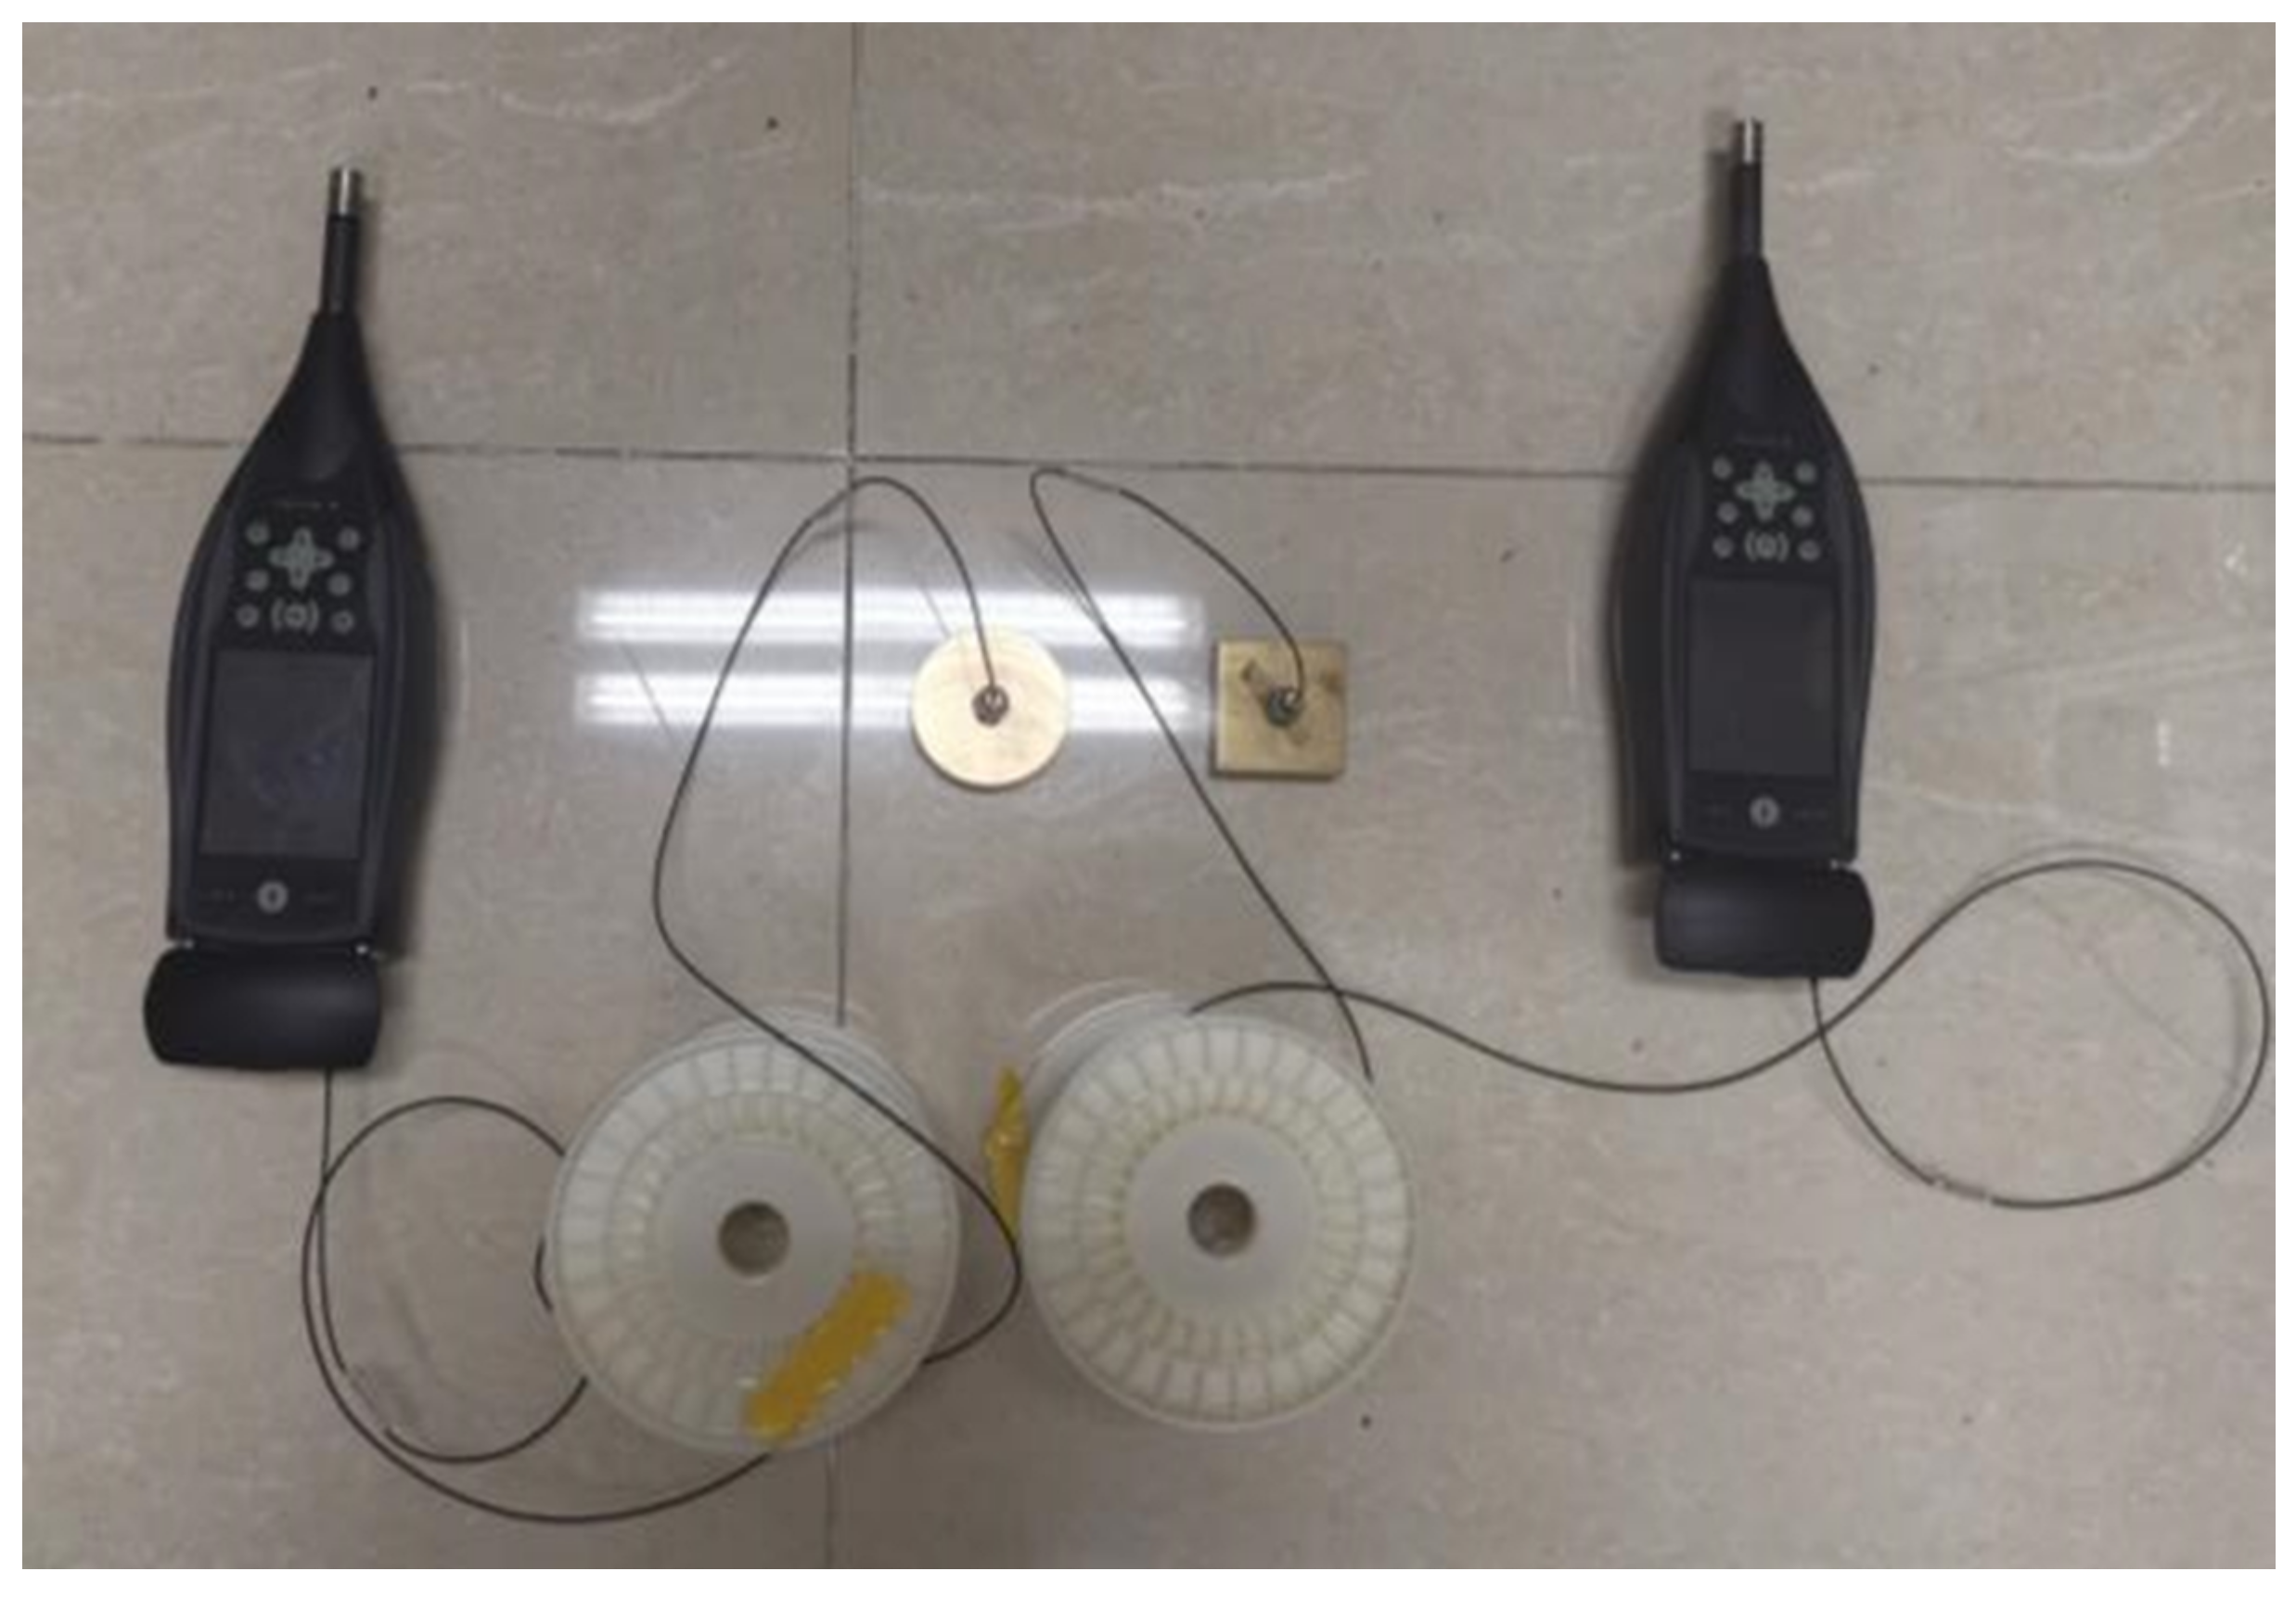
The main differences in the selected buildings lie in the curvature of the subway line at their locations, the building structures, and the horizontal distances between the building and the tunnel boundary. The subway line radius is 1500 m, 500 m and 600 m, (straight section). Buildings 1 and 2 are 6-layer brick mixed residential buildings, Building 3 is 4-storey brick residential building and Building 4 is 1-layer brick and concrete residential building. The horizontal distance between the location of the buildings and the corresponding subway tunnel border is 26 m, 30 m, 39 m and 2 m for Buildings 1, 2, 3 and 4, respectively. A BK2270 two-channel noise and vibration analyzer was used to measure indoor noise and building vibration levels (Figure 1). The equipment can measure noise and vibration data at the same time. For each building, the use of indoor measurement on the first floor, where residents responded most strongly, was selected. Three vibration pickups were arranged in the measuring room. On flat ground, a microphone was also installed to measure the total sound level (A–weighted) and the unweighted 1/3–octave sound pressure level. In order to ensure the accuracy of the measurement results, the AWA 6256 vibrometer produced by Hangzhou Aihua Company and the multi-channel digital analyzer produced by China Dongfang were selected for comparative measurement.

Figure 1.
BK2270 two-channel noise and vibration analyzer (16.7–140 dB, 6.3–20,000 Hz).
In this article, the buildings were located on lines 1, 3, and 6 of the Tianjin Metro, and have been lived in for approximately 35 years. At the same time, railway tracks have been completed and opened to traffic for 50, 10 and 5 years, respectively. In the experimental test, an average of 25 trains ran per hour during the day, while the number of subway runs at night was relatively small, and an average of 13 subway trains ran each hour at night.
Each building was equipped with one noise measurement point and three vibration measurement points. In order to avoid the influence of indoor first-order standing waves on the measurement signal, the measurement position was selected to be about 1.5 m away from the walls and 1.2–1.5 m from the floor. During the measurement period, all other noise sources from household appliances such as refrigerators and fans were turned off. Specific test settings are shown in Figure 2.
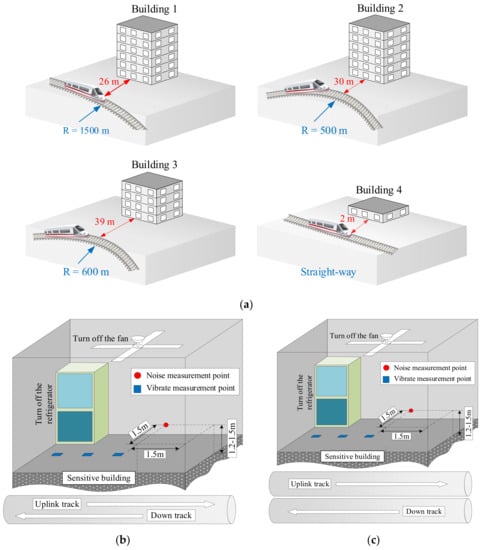
Figure 2.
Schematic diagram of experiment layout. (a) Distribution of buildings and subway lines. (b) Horizontal operation of the line. (c) Vertical operation of the line.
2.2. Key Assumptions
The following assumptions were made in this study:
- Meteorological conditions, imperceptible noise in the room and sources of vibration have no effect on the measurement results.
- For the track lines of the same type and the same material, slight differences in the material batches can be ignored in the measurement results.
- The acoustic characteristics of sound waves will not change significantly during the propagation process.
2.3. Data Processing Method
This study involved the use of data based on the evaluation calculation method of vibration acceleration. The acceleration evaluation system includes the weighted root mean square evaluation method, the running root mean square evaluation method, and the fourth power vibration dose evaluation method. In order to better reflect the vibration of the human body, this study adopted the weighted root mean square acceleration evaluation method, which is the most widely used and the most fundamental evaluation method [26].
The frequencies that the human body can perceive are continuously distributed, but not all frequencies are evaluated during analysis. In this study, the frequency range was divided into several frequency bands of limited width. When the upper and lower limit ratio of the frequency band was 21/3, the continuous frequency range composed of all frequency bands was 1/3 octaves.
The center frequency can be expressed as [26]:
where fmid is the center frequency; fupper and flower are the upper and lower limit frequencies of the band, respectively.
The calculated acceleration value was weighted according to the frequency to solve the vibration level evaluation value of the vibration direction. It can be determined by [27]:
where ai is the frequency division acceleration value of each center frequency; wi is the accelerometer weight factor of each center frequency in the desired vibration direction; aw is the acceleration value after considering frequency weighting and the average energy; a0 is the reference acceleration and its value is 10−6 m/s2 [26].
The evaluation quantity of spectrum evaluation was a set of unweighted root–mean–square acceleration values of the central frequency or unweighted vibration stage. The evaluation method involved calculating the corresponding vertical unweighted frequency division vibration level according to formula (3) after obtaining the unweighted root mean square acceleration, and then comparing it with the limit curve. It was considered that the environmental vibration met the standard requirements only when the frequency division vibration levels in all frequency bands met the limit requirements.
In addition, the evaluation value could be transformed into the total vibration level evaluation value with weight; the conversion formula is as follows [28]:
3. Results
3.1. Indoor Vibration and Noise Spectrum Analysis
Vibration and noise were evaluated according to HJ 453, and the results could only characterize the total emissions. However, it was not clear which spectrum had a significant effect on indoor vibration and noise. In order to obtain a deep understanding of the indoor vibration and noise characteristics, this study used a B&K2270 dual-channel vibration and noise analyzer for data acquisition. The instrument synchronously collected the noise and vibration signals of the train passing by for 1 h, recorded the maximum value of the one-third octave frequency spectrum of the noise and vibration, and analyzed the changes of each frequency band. Figure 3 shows the variation of noise and vibration in the buildings.
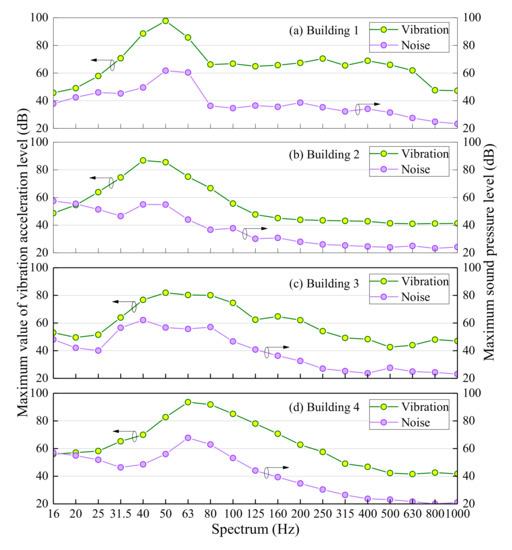
Figure 3.
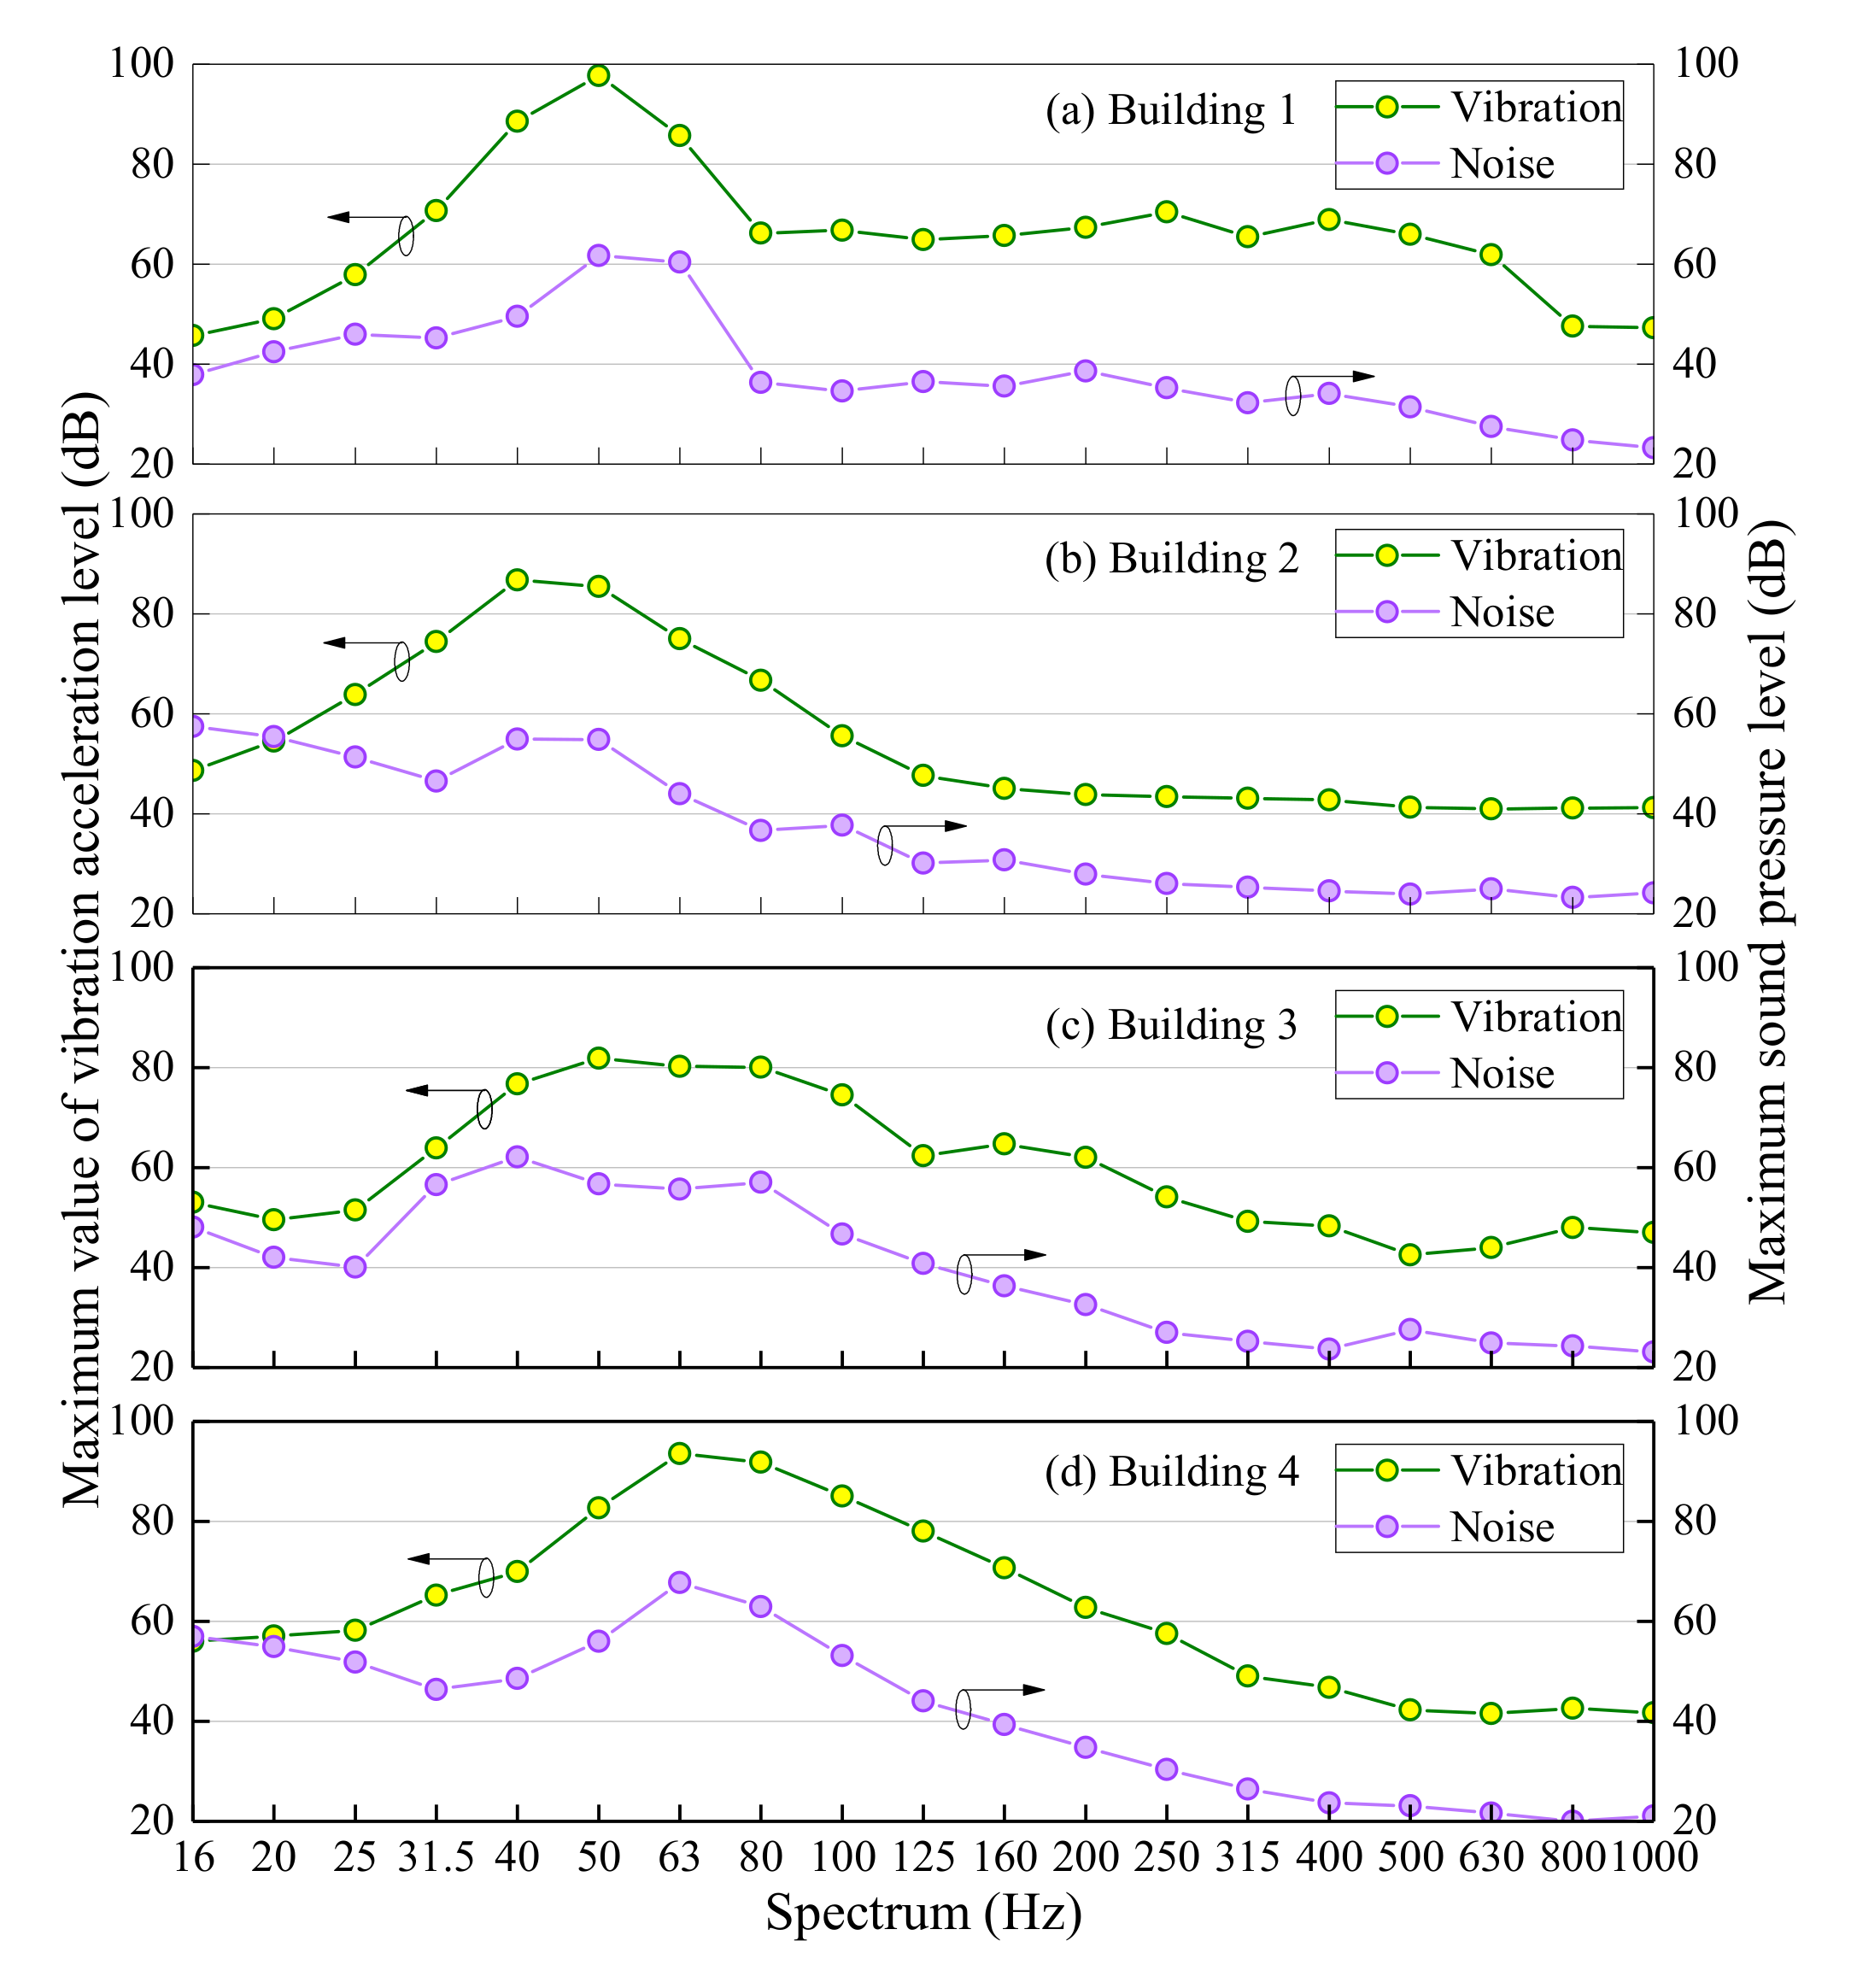
Indoor noise and vibration of selected buildings.
As shown in Figure 3, the indoor vibration and noise spectrum of the buildings peaked in the low-frequency fraction. The peak vibration frequency of Building 1 corresponded to a frequency of 50 Hz, the noise split peak corresponded to two frequency points of 50 Hz and 63 Hz, and the vibrations had higher vibration levels in the 31.5–80 Hz frequency range, above 70 dB. Furthermore, noise had a higher sound level in the 16–500 Hz frequency range, above 30 dB.
Then, the vibration and noise separation peaks of Building 2 had a corresponding frequency of 40 Hz, the vibrations had higher vibration levels in the 31.5–80 Hz frequency range, above 70 dB, and noise had a higher sound level in the 16–250 Hz frequency range, above 30 dB. The peak vibration frequency of Building 3 corresponded to a frequency of 50 Hz. The noise split frequency peak corresponded to 40 Hz, the vibrations had higher vibration levels in the 31.5–100 Hz frequency range, above 70 dB, and noise had a higher sound level in the 16–200 Hz frequency range, above 30 dB. The peak vibration and noise separation frequencies of Building 4 were 63 Hz. Then, the vibration level was higher in the range of 40–160 Hz frequency, above 70 dB, and noise had a higher sound level in the 16–250 Hz frequency range, above 30 dB.
It was inferred that the peak frequency of subway vibration and noise is frequently found in frequency bands of less than 80 Hz, such as 40 Hz, 50 Hz and 63 Hz. The higher vibration level frequency range (greater than 70 dB) was found to be between 31.5 and 160 Hz. Furthermore, outside the range of higher vibration levels, the decay curve of vibration with frequency differed for each building due to the differences in the underground soil structure. The higher range of noise frequency (greater than 30 dB) was between 16 Hz and 500 Hz. Outside the loud level range, the decay curve of noise with frequency varied slightly due to the indoor structure, the self-vibration frequency of buildings and the surrounding environmental characteristics of each selected building.
The noise curves of Buildings 2 and 3 showed wide slowing in the louder level range, namely peaks between 40 and 80 Hz, while Building 1 showed peaks between 50 and 63 Hz; the peaks of Building 2 were closer to a single value of 63 Hz, which may have been due to a different turning radius, as it is known that the larger the turning radius, the more likely the vibration band characteristic peak is to be single value, and more data are expected to prove this inference.
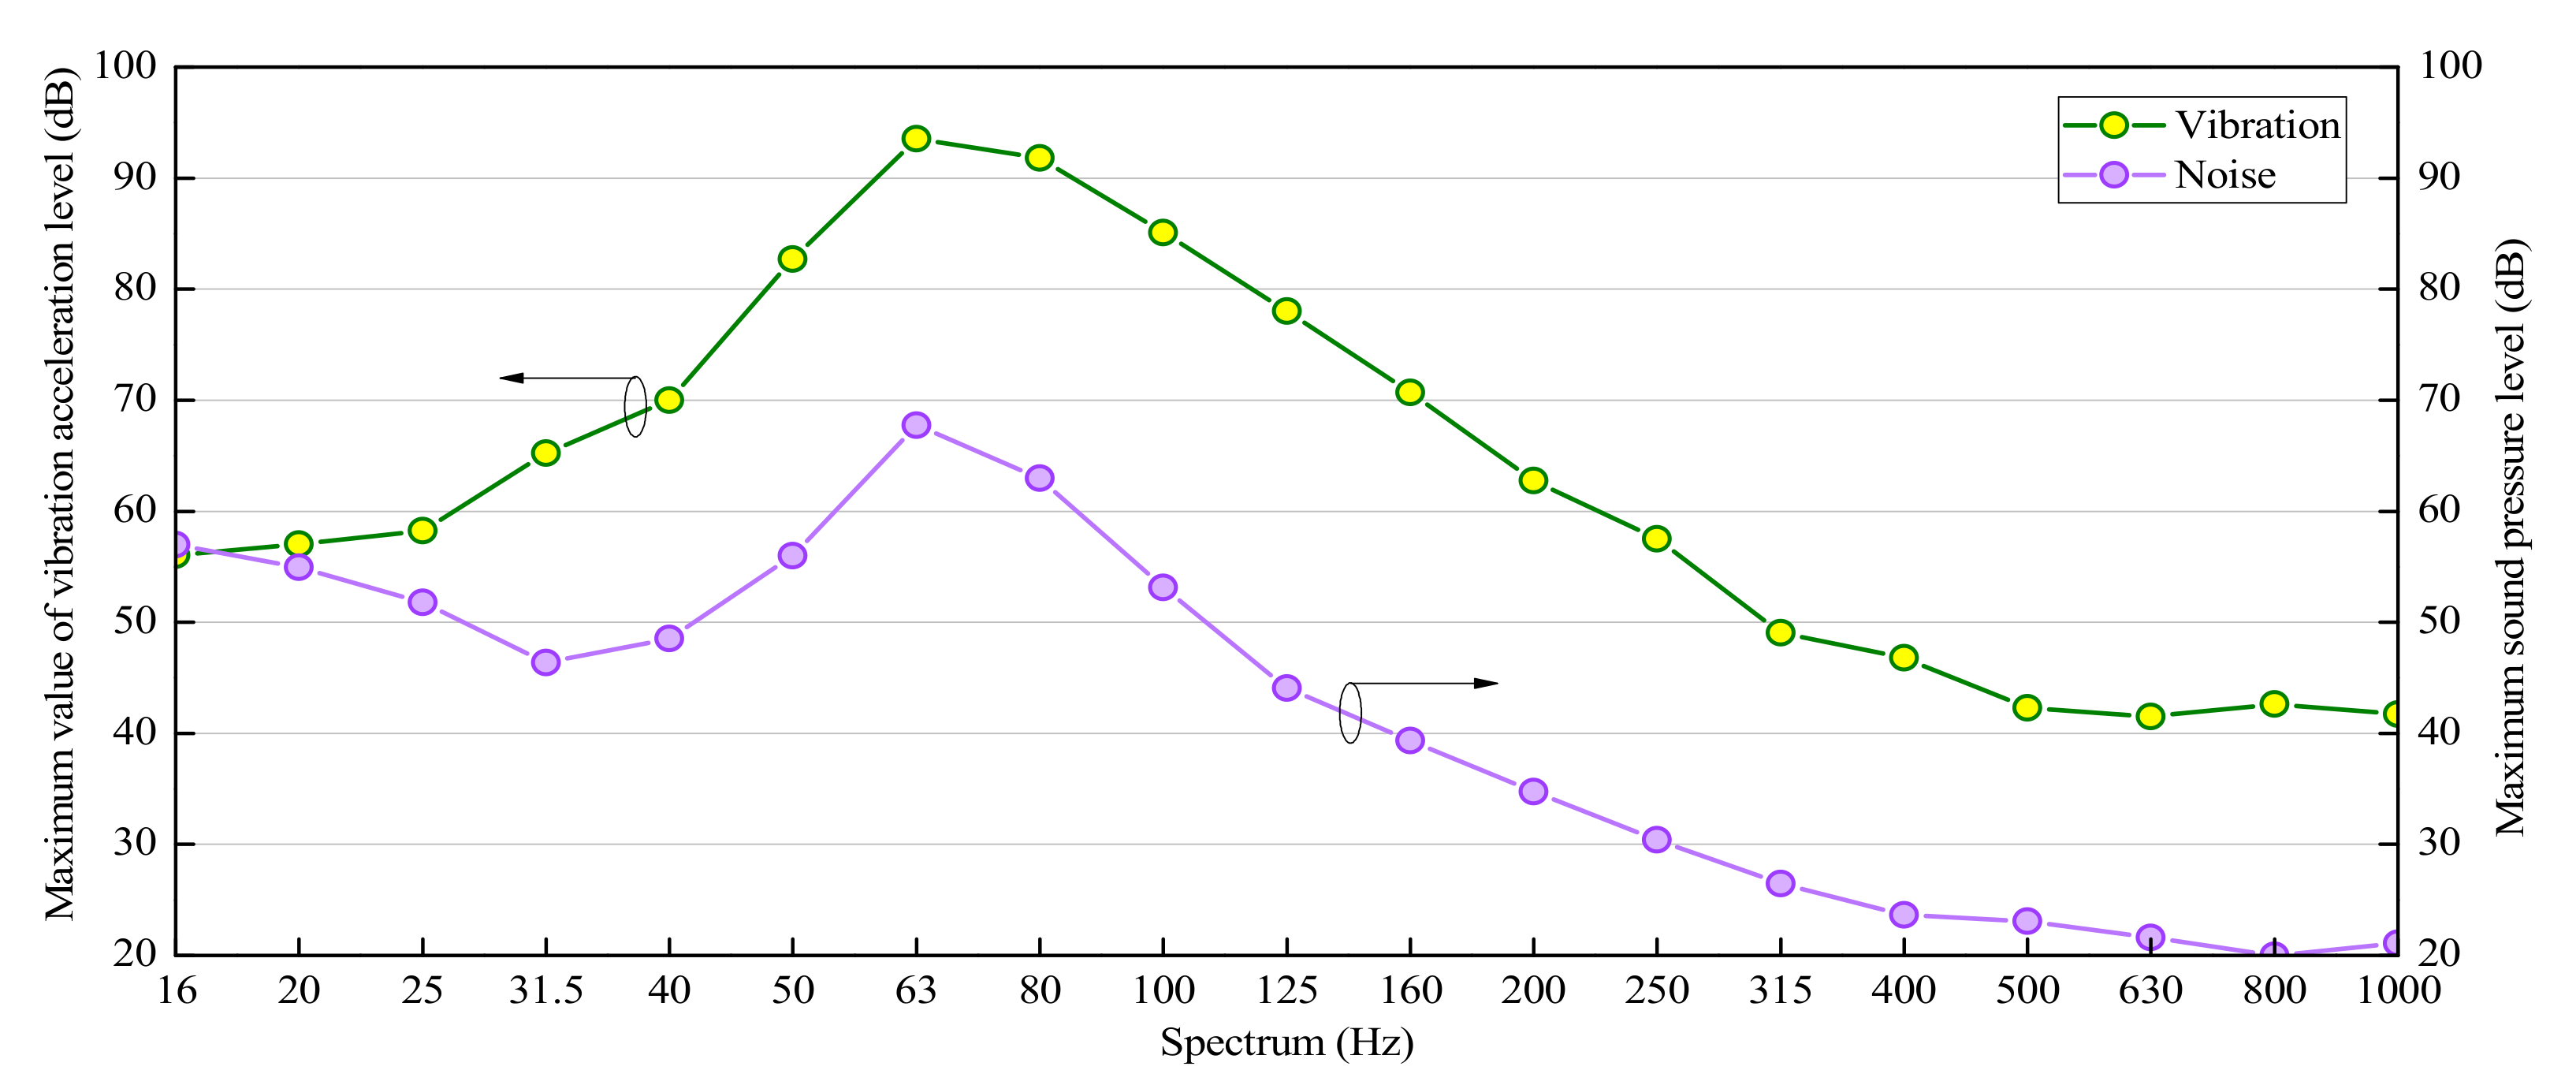
Figure 4 shows the typical frequency spectrum of each measurement point. The acquisition method was as follows: statistical data on the vibration and noise spectrum were collected when each train passed, within a timeframe of 1 h. Each measurement point was averaged based on the central frequency of the corresponding third of the frequency range, that is, the typical vibration and noise frequency spectrum of each measurement point were obtained.
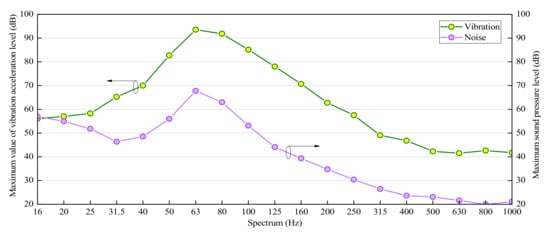
Figure 4.
Typical spectrum of indoor noise and vibration.
Figure 4 shows that the spectral change rules regarding the indoor vibration and noise caused by Buildings 1–4 had good consistency, that is, the vibration increased, the noise increased, the vibration and noise changed from 31.5 Hz to 1000 Hz and the low-frequency rules below 31.5 Hz were not obvious, which may have been caused by the high low-frequency band of background noise and the interference this could have caused in terms of the measurement results. It can be seen from Figure 4 that with the increasing of the frequency spectrum, the vibration acceleration and the sound pressure level showed a trend of increasing first and then decreasing, reaching their maximum values at around 63 Hz, which were 93.531 and 67.7185 dB, respectively. As the frequency spectrum increased (>63 Hz), the vibration acceleration and sound pressure level decreased more slowly. Compared with 63 Hz, the vibration acceleration and sound pressure level decrease rate at 1000 Hz was 55.39% and 68.86%, respectively. Following analysis of covariance on the vibration and noise spectrum values at each measurement point, the covariance results were positive, positive, negative and zero, indicating no correlation, as shown in Table 2. The results showed that all the ANOVA results were positive, namely, the vibration and noise data for each measurement point were highly correlated, and they had a certain relationship curve.
Table 2.
Covariance analysis results for the noise and vibration spectrum values of each line.
3.2. Analysis of Noise Reduction Measures
3.2.1. Noise Reduction Measure 1: Wheel and Rail Polishing
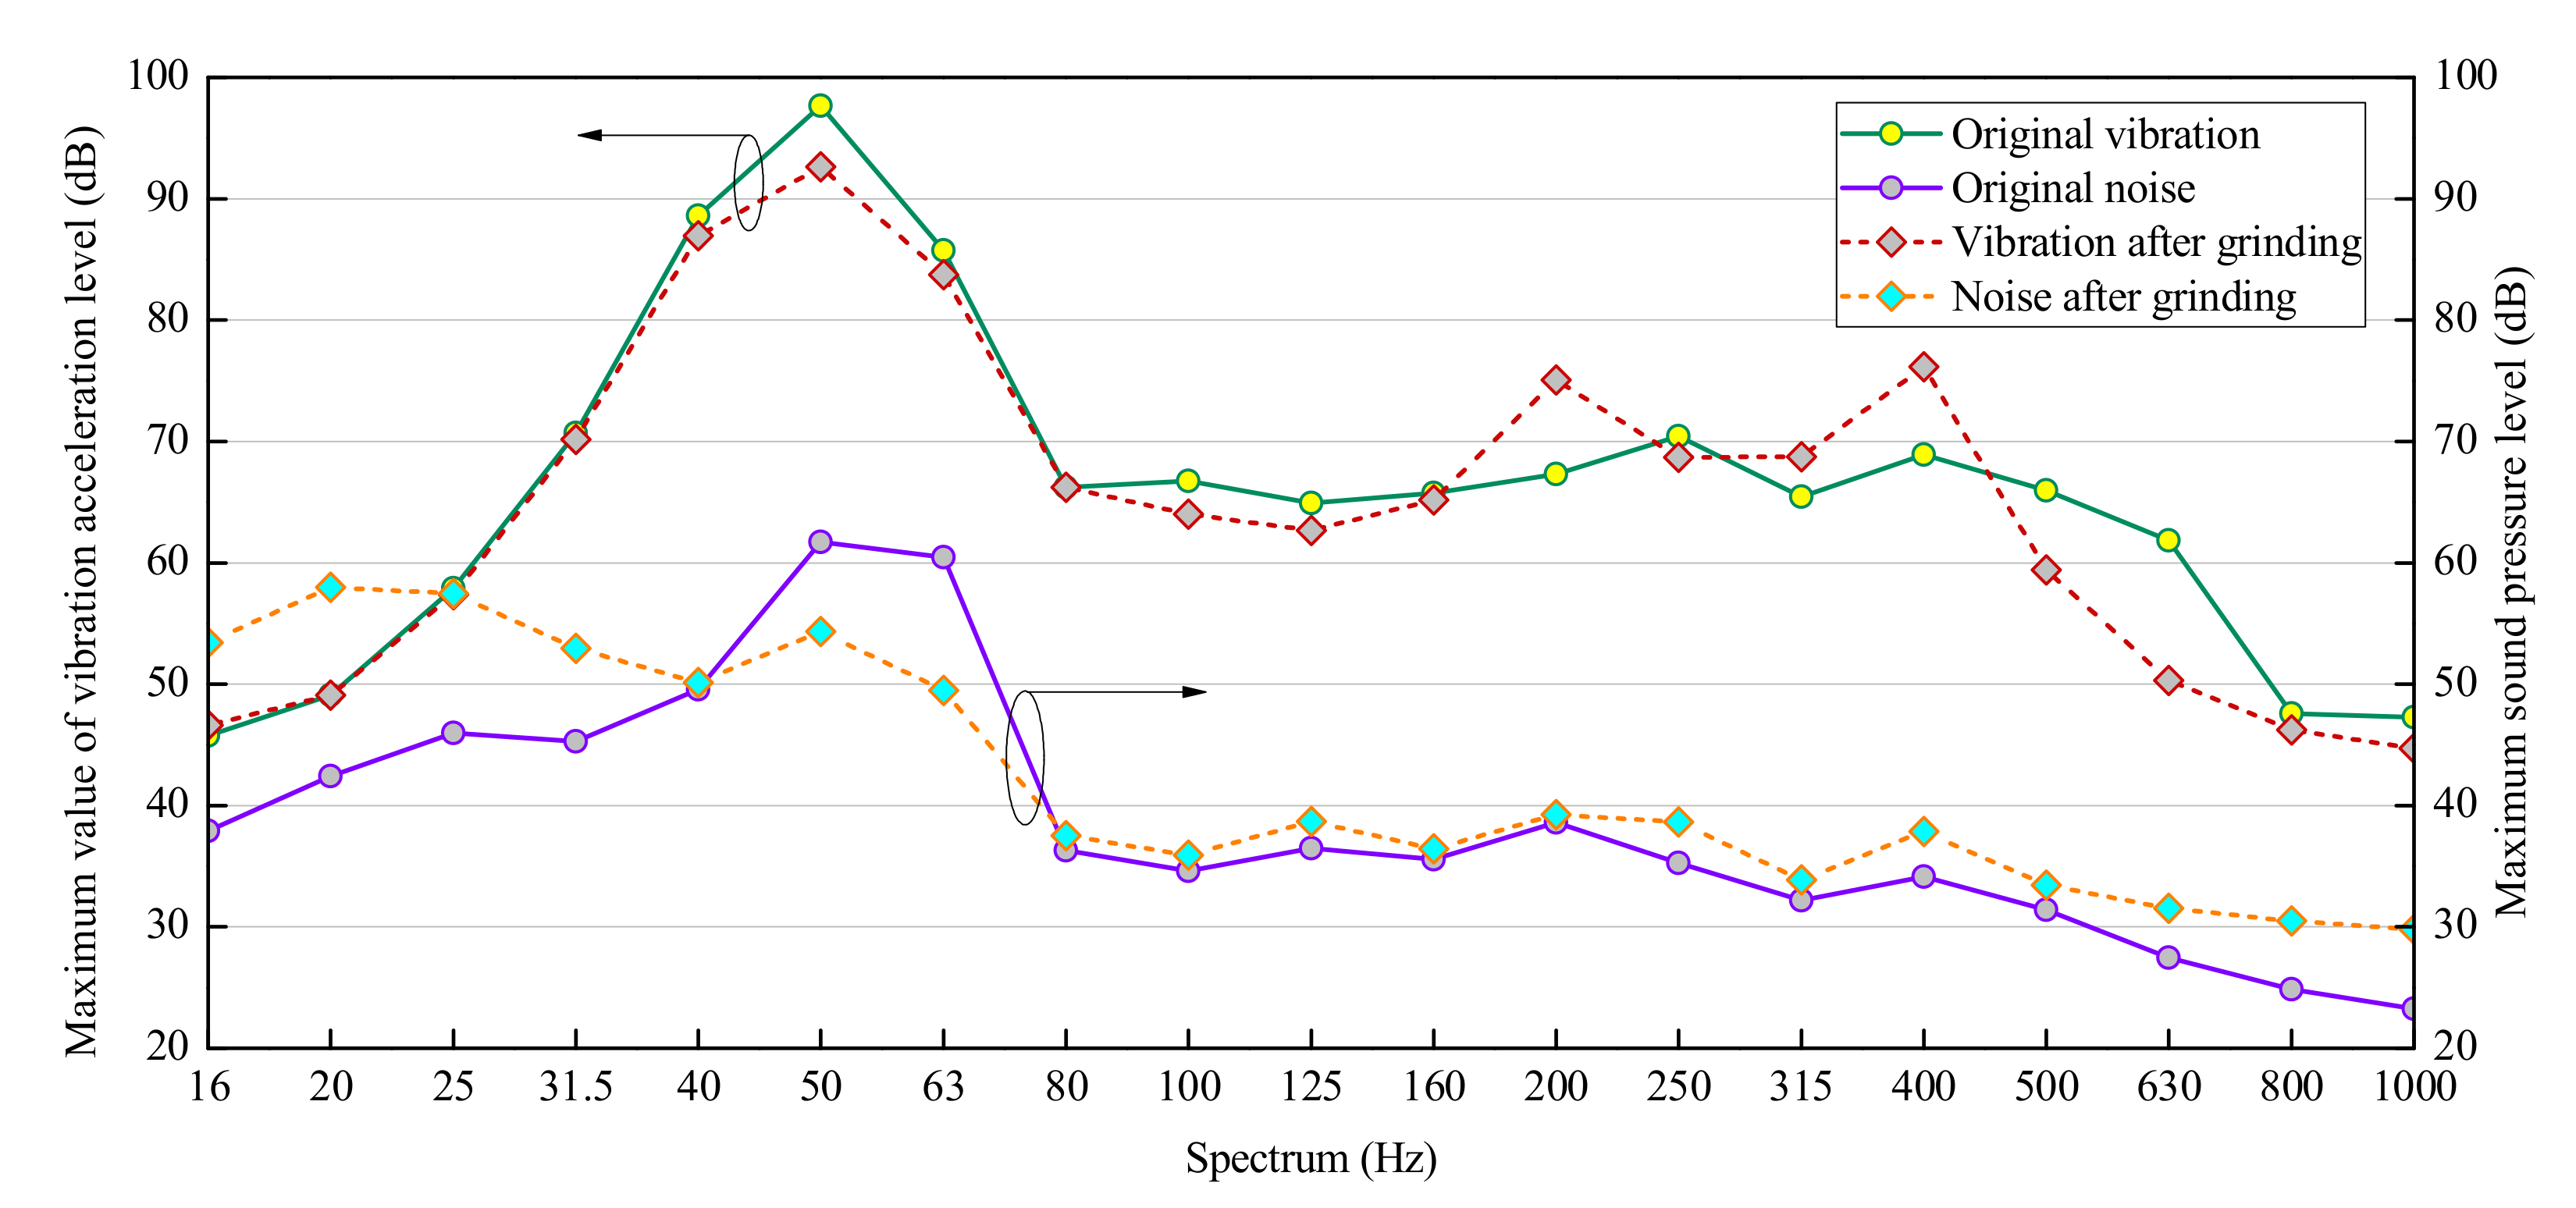
Figure 3 shows the subway noise and vibration spectrum, which is the one-third octave frequency spectrum of indoor vibration and noise obtained when the train passed by during peak hours. Due to the obvious indoor vibration and noise in Building 1, the subway operator took certain measures to reduce vibration and noise, polished the wheel and rail, and measured its indoor vibration and noise spectrum during similar peak hours after polishing, as shown in Figure 5. Compared with before grinding, indoor vibration in the 40–63 Hz frequency band and the 80–125 Hz frequency band dropped; two small peak points in 160–500 Hz, after rail grinding, would have reduced the indoor vibrations of the buildings, but due to the imperfect grinding process, these would also have caused other frequency band vibration measurement amounts to increase, or even small peak points to occur. After polishing, the indoor noise spectrum increased at 16–31.5 Hz, decreased at 40–80 Hz and slightly above 80 Hz; There was also a vibration decay of 5 dB at a frequency 50 Hz, and the largest decay of 11 dB, as well as the largest amount of noise, occurred at a frequency of 63 Hz (see Table 3). This was mainly due to the fact that grinding could eliminate surface defects (such as rail burrs, rust, tiny stress cracks, etc.), making the ground track appear smooth and improving the contact between the wheel and the rail. Therefore, grinding the track also reduced the dissatisfaction of the nearby residents, caused by the train operation, to a certain extent.
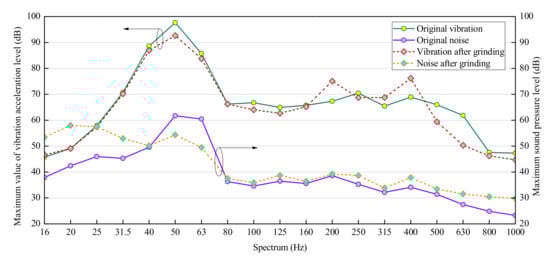
Figure 5.
Building vibration and noise changes after wheel and rail grinding.
Table 3.
Vibration and noise monitoring results after grinding of Building 1 (unit: dB).
According to the above analysis, it was found that wheel rail grinding measures can achieve vibration reduction and noise reduction effects, but the corresponding vibration and noise attenuation peak spectra may differ; in this study, this may have been due to the buildings’ inherent vibration frequencies, as the subway’s vibration frequency resonance, vibration, resonance attenuation, and secondary radiation noise reduction effect were also obvious. Therefore, it is suggested that when vibration isolation and noise reduction treatments are applied for subways, in addition to paying attention to the vibration magnitude of wheel-rail grinding and the implementation of speed reduction measures, attention should also be paid to whether the self-vibration frequency of the building can lead to room resonance. If the subway vibration leads to building resonance and obvious secondary radiation noise effects, attention should not only be paid to the attenuation of the main vibration frequency, but also to the attenuation of the house resonance frequency, so as to better mitigate the impacts of vibration and noise in the subway’s underground section.
3.2.2. Noise Reduction Measure 2: Subway Speed Reduction
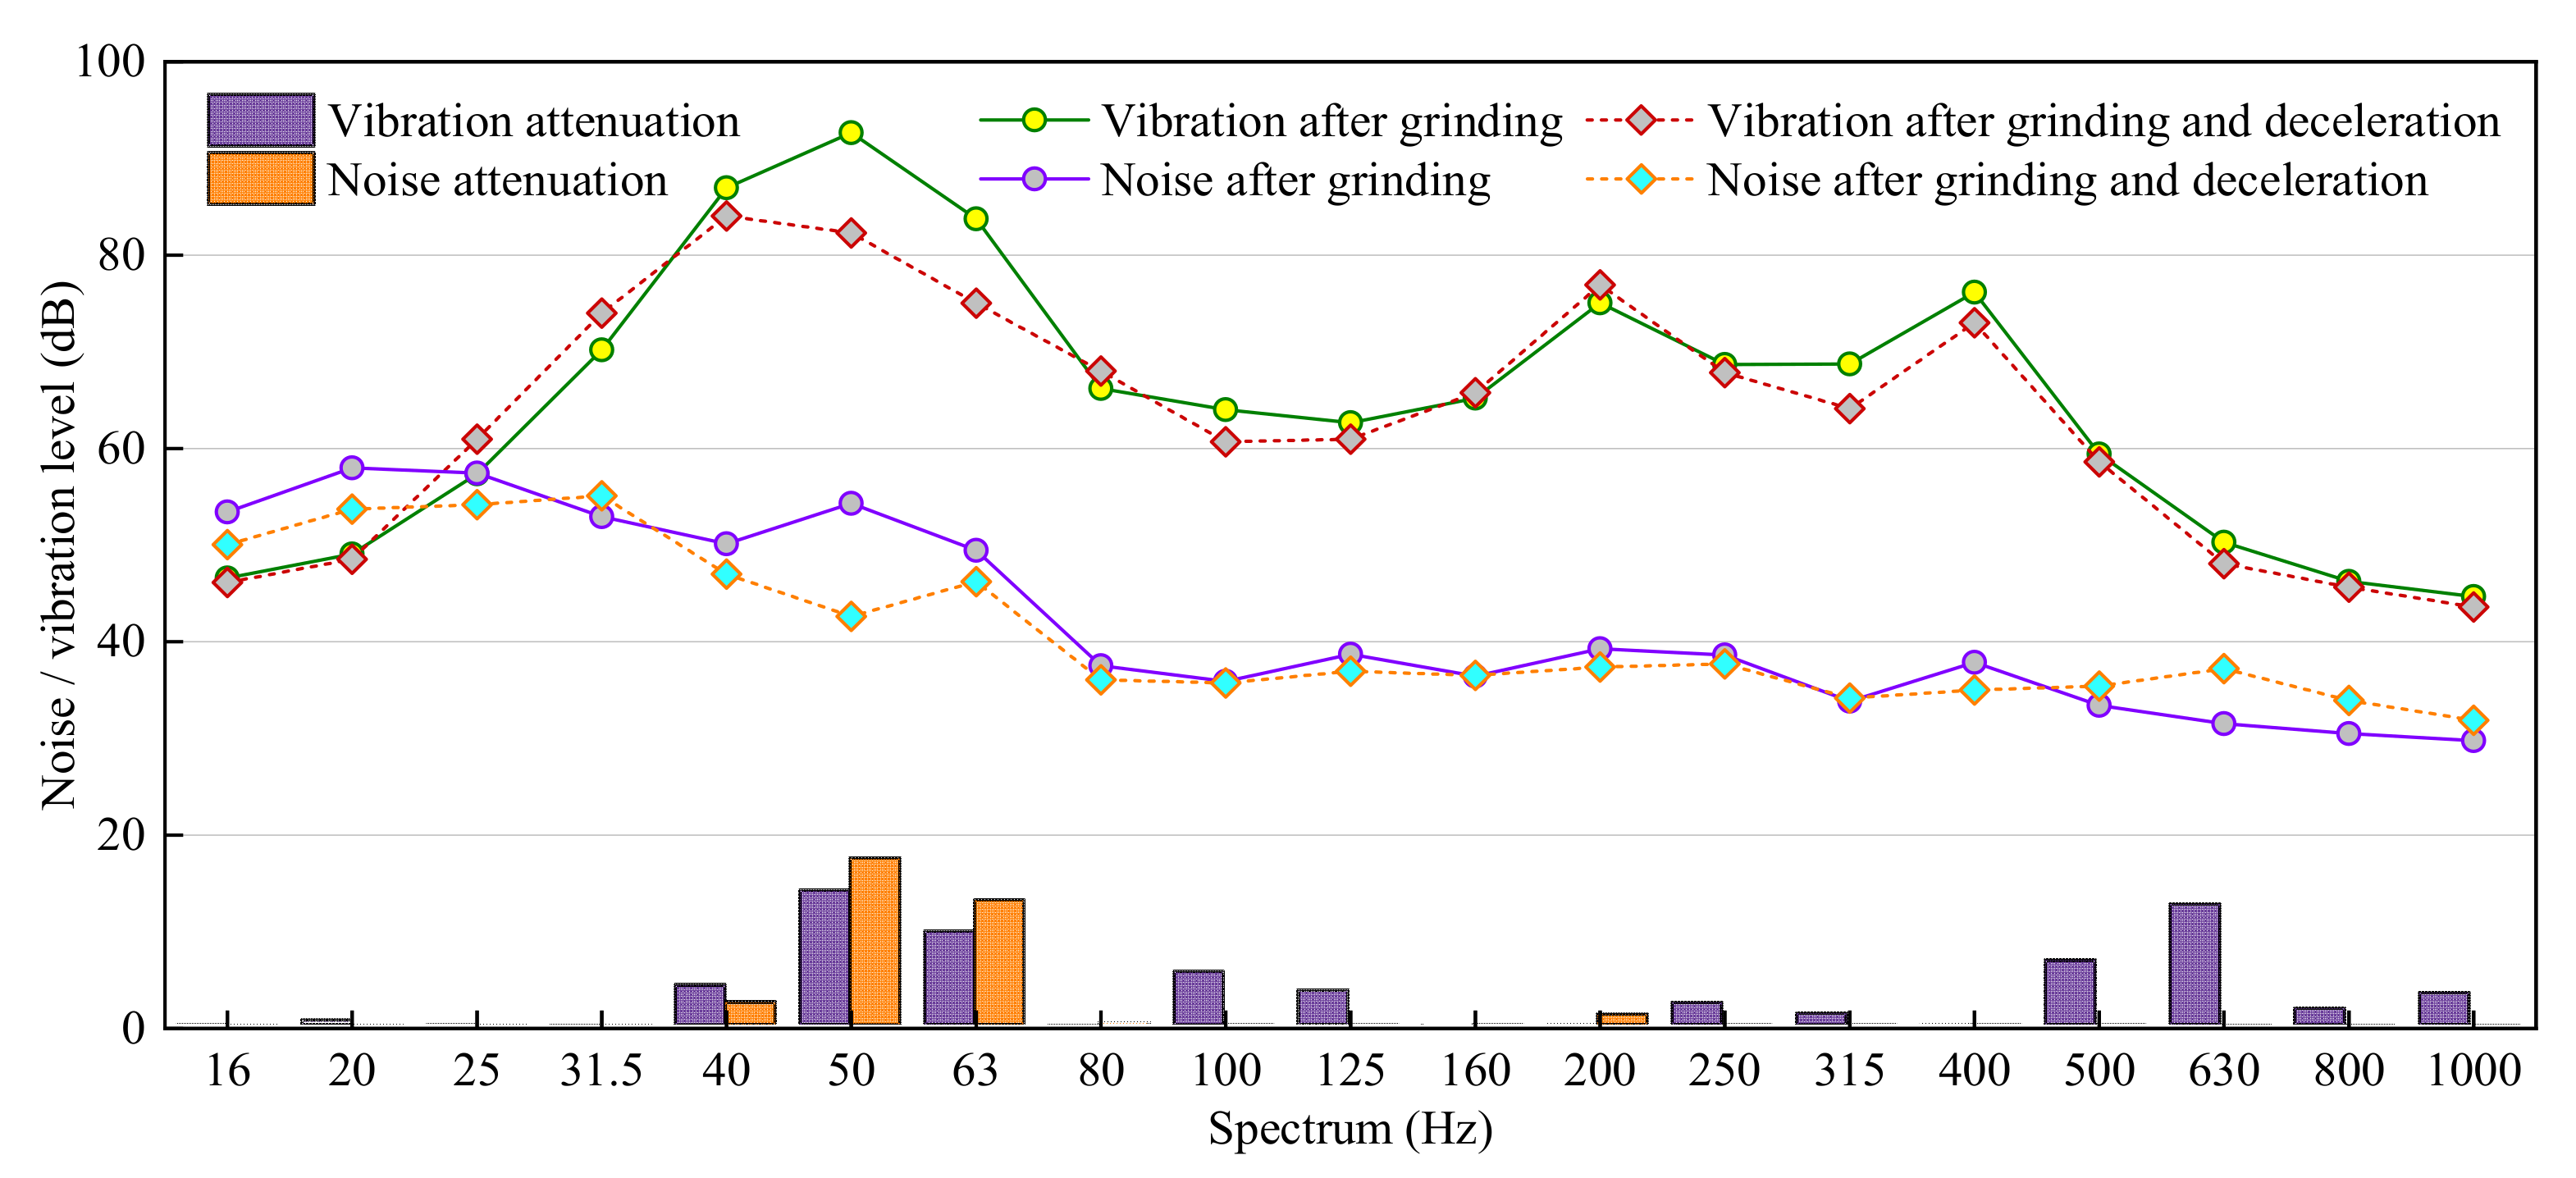
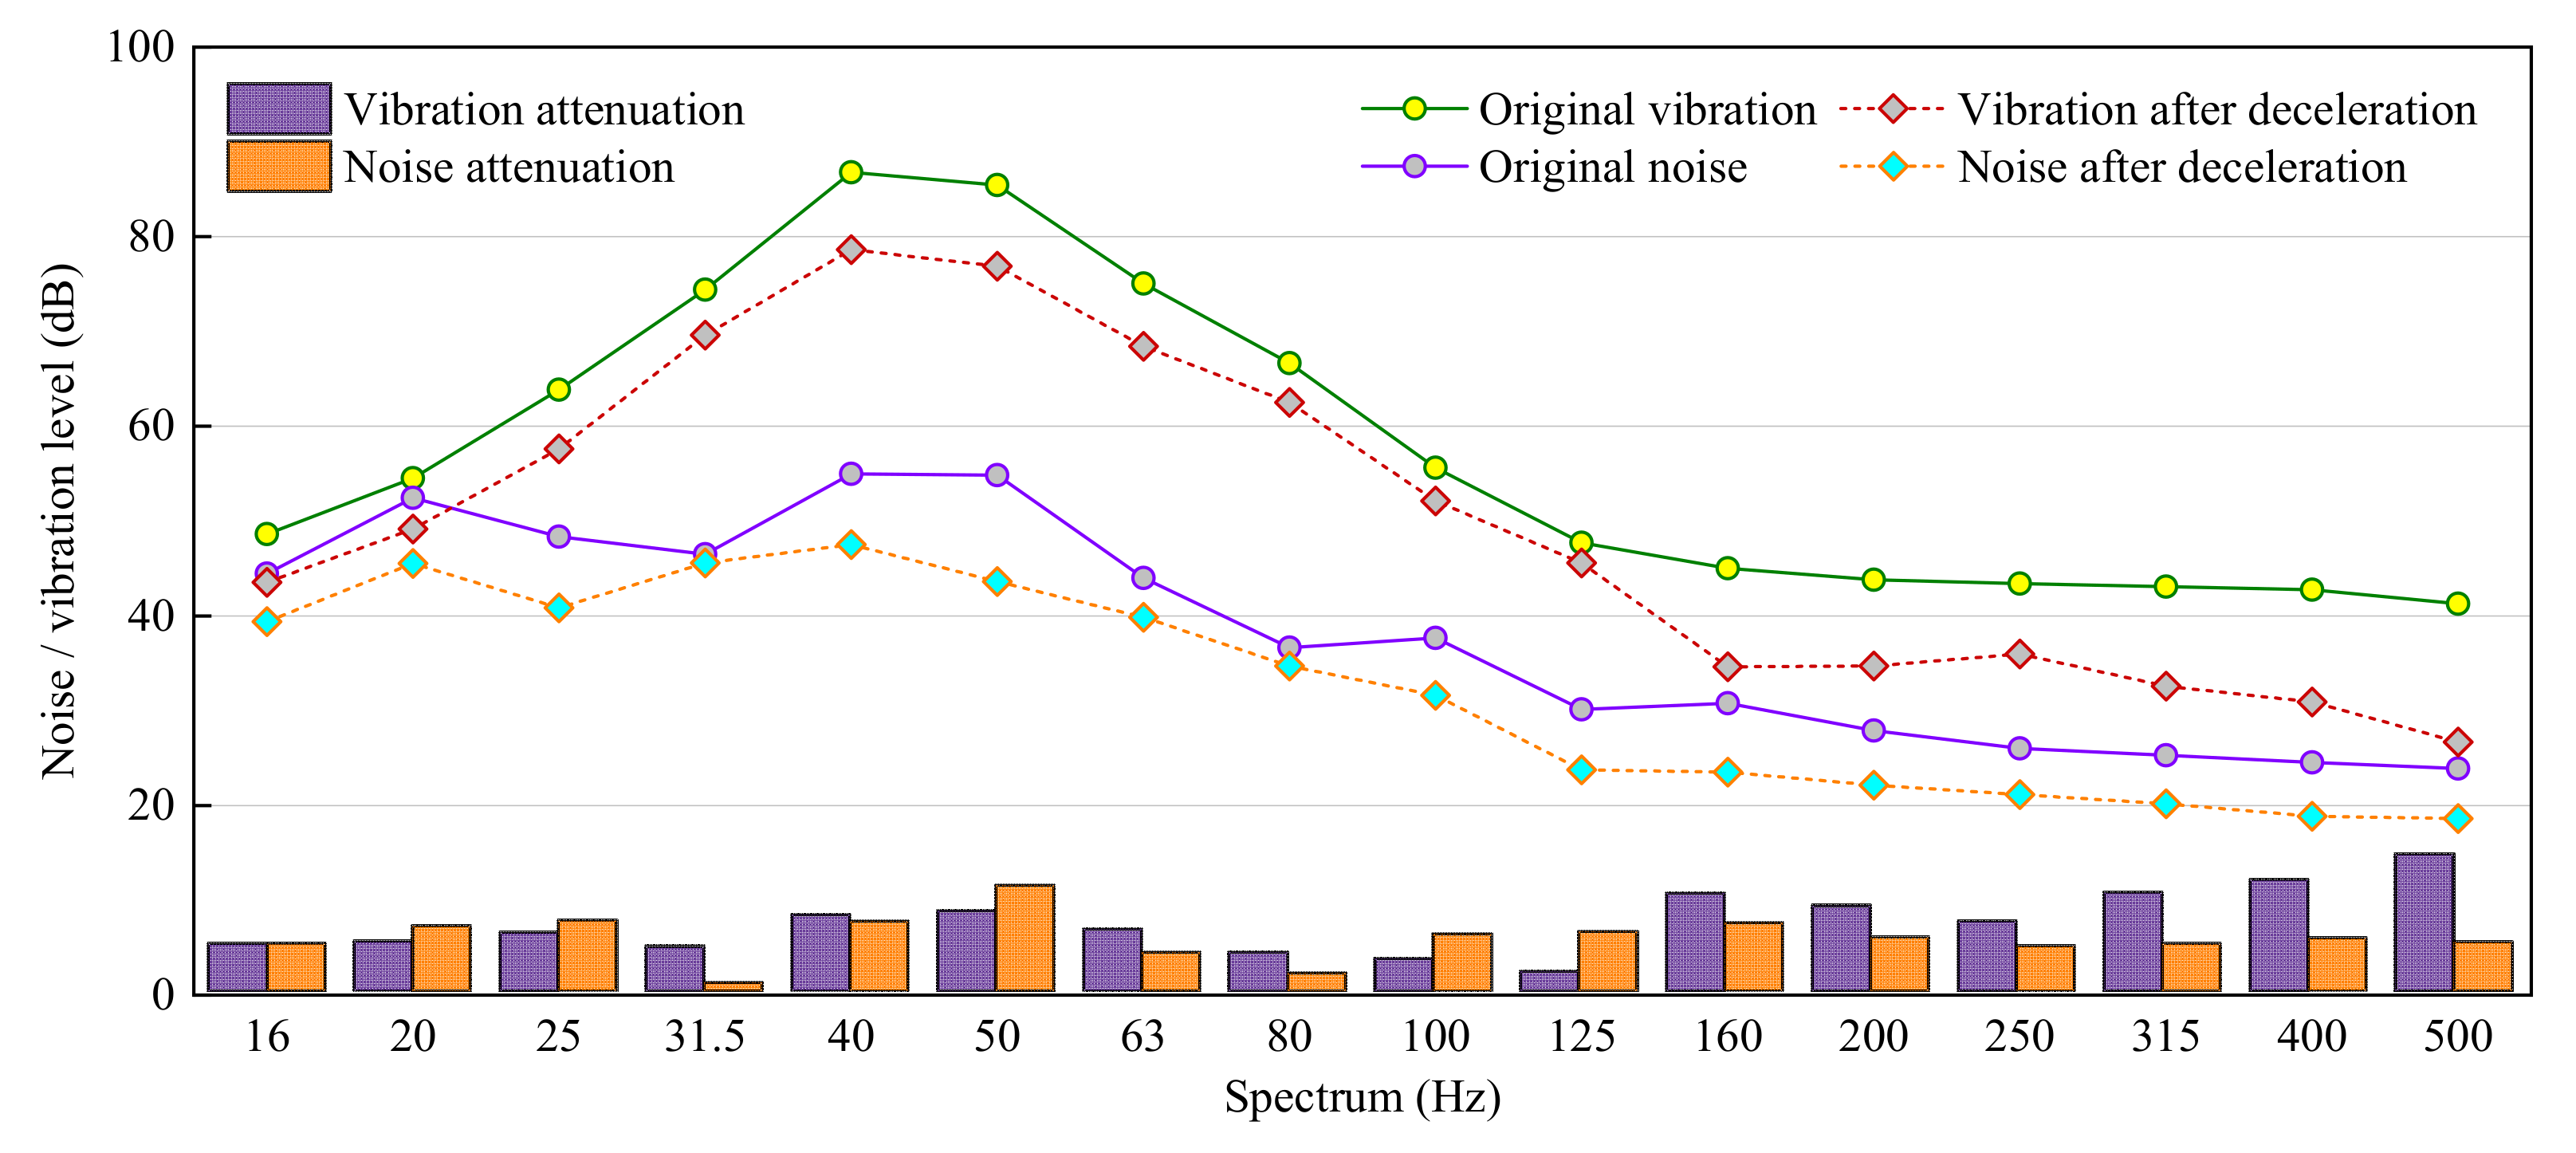
After grinding of the subway wheel and rail, because the vibration and noise impacts perceived by the residents of Building 1 were still strong, and a strong impression of vibration could also be felt in the on-site test process, the subway operator applied further vibration reduction and noise reduction measures in the subway’s operation, and reduced the speed. It is hoped that the impact of indoor vibration and noise will be reduced by speed reduction. The indoor vibration and noise were measured at similar peak hours. The normal operating speed of the interval before the test point was 60–70 km/h, and the speed of the interval was 40–45 km/h. The spectral analysis results are shown in Figure 6 and Table 2. After the deceleration, comparing the indoor vibration to the deceleration after grinding, the attenuation was evident in the 50 Hz and 63 Hz bands, with decreases of 11 dB and 9 dB, respectively, Other frequency bands did not change much. After grinding, two small peak points appeared in the high-frequency band. The peak point remained after the deceleration. The corresponding frequencies were 200 Hz and 400 Hz. Figure 6 shows that the effects of subway’s speed reduction were more obvious in terms of vibration insulation than wheel-rail grinding; in particular, the attenuation was evident at around 50 Hz. Other frequency bands did not change much. Furthermore, the vibration and noise levels decreased by 11.2 and 21.5%, respectively. It is also worth noting that due to the physical contact of surface changes between the wheels and rails after grinding, peak points occurring above 100 Hz did not decay due to deceleration.
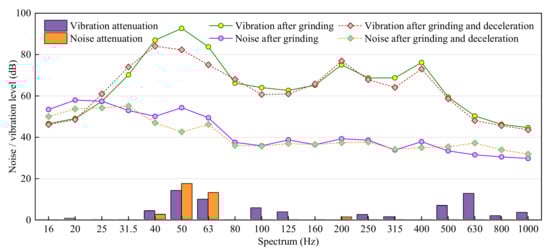
Figure 6.
Variation law of indoor vibration and noise in Building 1 caused by subway operation after wheel-rail grinding and speed reduction.
Therefore, it is suggested that the subway operator should measure and evaluate the vibration and noise spectrum after grinding, further investigate the growth rate of the special frequency band brought about by the imperfect polishing process, and take better measures to optimize the vibration isolation measures. Compared with the deceleration after grinding, the indoor noise dropped significantly in the 50 Hz frequency band, with an attenuation of 11 dB, and the other frequency bands did not change greatly. This further validates the hypothesis that at certain special vibration frequencies (e.g., 63 Hz frequency points), subway vibrations cause building resonance, resulting in an increase in the indoor secondary noise, and ultimately resulting in an increase in the sound level of the special frequency band. This is also related to the building structure and track radius.
In order to further clarify the impact of the subway deceleration on the indoor vibration and noise of the buildings along the line, the same deceleration measures were taken for the subway interval corresponding to Building 2, and the monitoring results are shown in Figure 7. Buildings 1 and 2 are located on the same line; the residential buildings are 6-story brick and concrete structures. The subway train’s speed was 60–70 km/h before deceleration, and the operation speed of this section was 40–45 km/h. After deceleration, the indoor vibration of Building 2 was attenuated in the full frequency band, the attenuation peak below 80 Hz was 50 Hz, and the attenuation was 8 dB; for the full frequency band of indoor noise, the attenuation peak below 80 Hz was also 50 Hz, with an attenuation of 11 dB. Combined, the measurement results of Buildings 1 and 2 showed that the vibration and noise attenuation energy after speed reduction were mainly concentrated at around 50 Hz, and the attenuation amount was above 8 dB. Through speed reduction, the vibration and noise impact of the subway operation on the buildings along the line could be significantly reduced. The noise of the wheel and rail mainly came from the contact movement between the wheel and the rail. During the operation of the subway, the contact between the wheel and the rail produced the wheel-rail force, which caused relative vibration and self-vibration between the wheel and the rail. The vibration and noise of subways and rails were transmitted through the air to surrounding buildings. When the running speed of the subway was reduced, the friction and collision between the wheels and the rails were reduced, the relative vibration was reduced, and the noise and vibration were further alleviated at the turning and interface positions of the rails.
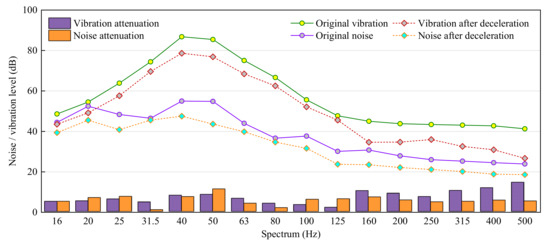
Figure 7.
Vibration and noise changes of Building 2 after the reduction in subway speed.
3.3. Overall Indoor Vibration and Noise Levels
3.3.1. Analysis of Vibration and Noise Reduction Measurement Results under Different Standards
According to the Environmental Impact Assessment Technical Guidelines, Urban Rail Transit (HJ453) [29], the vibration and noise of Chinese urban rail transit are evaluated according to the Urban Regional Environmental Vibration Standard (GB10070) [30] and the Standard for Building Vibration and Secondary Radiation Noise Caused by Urban Rail Transit and its Measurement Methods (JGJ/T 170) [31]. However, in this study, the Code for Sound Isolation Design of Civil Buildings (GB 50118) was also used for indoor noise testing and evaluation, and JGJ/T 170 was used for indoor vibration tests. In order to comprehensively analyze the overall noise and vibration impact of the subway on buildings along the line, vibration tests were conducted based on GB10070 and JGJ/T 170 to analyze the vibration impact, and noise testing was performed based on JGJ/T170 and GB 5118 to analyze the noise impact, respectively.
The vibration test was conducted based on the railway vibration measurement method of GB/T 10071, and involved the measurement of 20 trains per test point, measuring the average of the 20 readings, and obtaining a vibration acceleration level of 4–200 Hz when each train passed; the results were evaluated after Z counting data processing in JGJ/T 170. Noise tests and evaluation were performed based on a sound level equivalent to the 16–200 Hz band of the JGJ/T 170 statistics and the full band was based on a sound level equivalent to that of the GB/T 50118 statistics. The vibration and noise measurements are listed in Table 4 and Table 5, respectively.
Table 4.
Vibration measurement results of each test point corresponding to different evaluation criteria.
Table 5.
The noise measurement results of each test point corresponding to different evaluation criteria.
Different standards and norms vary in their scope of application and dependence due to differences in footholds and environmental conditions. In order to limit the results of this paper to the China region, we compared domestic standards with those of the International Organization for Standardization (ISO) [32]. The ISO 2631-2 standard frequency measurement range is 1–80 Hz. It is suitable for all kinds of environments in which the human body may be exposed to vibration (such as near traffic arteries, beside factory assembly lines, inside indoor buildings, etc.), and sets vibration levels for different feeling degrees (human health, human perception and motion sickness) and different postures (standing posture, sitting posture, lying posture, etc.). Most of the domestic standards are based on ISO standards. It can be seen from Table 4 that there was little difference between the vibration measurement results analyzed according to these two standards, and the maximum deviation was 1.49%. This was because domestic standards are revised based on the ISO standards. Therefore, the results of the analysis in this paper, obtained through domestic standards, can be applied to analyses based on ISO standards.
Furthermore, it can be seen from Table 4 that the vibration was analyzed according to JGJ/T 170. When the wheels and rails were not polished and the speed was not reduced, the maximum vibration level of the train passing through the vibration measuring point of Building 1 was 85 dB. The average of the maximum frequency division vibration level after grinding was 81 dB and the maximum vibration level average after grinding and deceleration was 74 dB. After grinding the wheel and rail and slowing down, the vibration level was reduced by 11 dB compared to nothing. There was no change in the maximum frequency band of vibration before and after grinding, and they were all concentrated at 50 Hz. The maximum vibration level of grinding and deceleration was reduced by 7 dB compared to the maximum vibration level without deceleration, and the peak frequency band was changed from 50 Hz to 40 Hz after polishing. For Building 2, in the unpolished and slowed down condition, the maximum vibration level was reduced by 8 dB. According to the GB 10070 analysis, when the average for the maximum vibration of 1–80 Hz is 84 dB, the maximum numbers are 80 dB, 73 dB and 11 dB after grinding and deceleration, and the maximum vibration level is 7 dB compared with the grinding and grinding and deceleration conditions. For Building 2, the average maximum for polished and polished and slowed conditions was reduced by 8 dB. It can be seen that for the vibration reduction results obtained according to the JGJ/T 170 and GB 10070 standards, the results were basically the same, and the indoor vibration of the subway was significantly weakened. Both evaluation methods can represent the effects of the subway speed reduction measures, while JGJ/T 170 can find the maximum corresponding frequency level; thus, the results are more clearly characterized.
According to Table 5, when noise was analyzed according to JGJ/T 170, the equivalent values at 16–200 Hz for Building 1 were 33 dB (A), 31 dB (A) and 32 dB (A) after grinding and deceleration, and noise was decreased by 1 dB (A) compared to the original condition without any measures. In Building 2, the equivalent A sound levels at 16–200 Hz were 28 dB (A) and 22 dB (A) when grinding and decreasing. Furthermore, the noise was reduced by 6 dB (A) between grinding without speed reduction and grinding with speed reduction. According to the analysis of GB 50118, when the wheels and rails were not polished and the speed was not reduced, the full-band equivalent A sound level of the noise of the Building 1 when the train passed by was 39 dB (A), the sound level when the wheels and rails were polished and the speed was not reduced was 38 dB (A), and the sound level was 36 dB (A) when the wheels were polished and the speed was reduced. Compared with grinding and decelerating, the noise was reduced by 3 dB (A). Furthermore, the noise was reduced by 2 dB (A) between the grinding without speed reduction and the grinding with speed reduction conditions. Compared with the grinding and slowing down condition, the noise of Building 2 was reduced by 6 dB. In order to give more significance to the measurement results, noise analysis was carried out according to ISO 717-1. As can be seen from Table 5, the equivalent A sound level of Building 1 was 42 dB (A) according to the ISO 717-1 analysis, which was 3 dB higher than the GB 50118 standard. Compared with ISO 717-1, the GB 50118 standard measurement results were slightly lower, but the maximum deviation was less than 5 dB. Through the comparison of standards, it is possible to improve the relevant standards to improve the comfort of residents. Additionally, the analysis showed that the vibration and noise decreased simultaneously, the vibration in Building 1 decreased significantly, and the noise was not obvious, which made it clear that the effect of the transmission of vibration in terms of reducing the building’s indoor vibration was enhanced, and the noise reduction effect depended on the main frequency of the secondary radiation noise of the building’s vibration excitation. There is no doubt that the building’s self-vibration frequency and the building layout determine the noise reduction effect.
3.3.2. Evaluation and Analysis According to Standards
Before any measures were taken, the vibration data shown in Table 4 were evaluated according to the JGJ/T 170 Class 1 night standard, and all measurement points exceeded the standard. After the measures were taken, the vibration data were evaluated according to the GB 10070 Class 1 night standard. Only Building 2 reached the standard after grinding and deceleration of the subway track, and the rest exceeded the standard. Before any measures were taken, the noise data shown in Table 5 were evaluated the according to the JGJ/T 170 Class 1 night standard. The noise of Buildings 1 and 2 reached the standard limit of 35 dB (A) in the Class 1 area, and the remaining measurements exceeded the standard. According to the 37 dB (A) limit for bedrooms in the GB/T 50118 standard, Building 1 met the standard after the subway speed was reduced, the rest exceeded the standard, and the noise of Building 2 reached the standard. Both Buildings 3 and 4 exceeded the standard. Some scholars point out that people in indoor space express concern about equivalent A sound levels of 31 dB (A) during the day, and about levels of 28.4 dB (A) at night [33]. The above measurement results showed that only the residents of Building 2 were less annoyed after the wheel and rail were polished and the speed was reduced. However, this result was a statistical average, and some trains also produced an equivalent A sound level of more than 28.4 dB (A). Therefore, residents’ troubles still existed after the wheel-rail grinding and noise reduction. This result was consistent with the field test. It can be seen that even if the strict Class 1 night standards of JGJ/T 170 and GB 50118 are adopted, the impact of noise cannot be effectively contained. Therefore, taking the reduction in the levels of annoyance caused by noise as the starting point, the secondary radiation noise and subjective feelings of urban rail and residents should be assessed to promote the revision of relevant noise standards as soon as possible.
4. Discussion
In China, the use of experimental methods to evaluate the influence of the underground line operations of urban rail transit on the indoor vibration and noise of buildings is relatively rare. Through the monitoring of actual cases, this study analyzed the indoor vibration and noise spectrum characteristics of selected buildings along the line caused by urban rail transit, and the law of the impact of wheel/rail polishing and speed reduction measures on the indoor vibration and noise of residents along the line. Our study found that after wheel/rail grinding and deceleration to 45 km/h, the indoor vibration reduction effect was the most obvious, with a reduction of 11 dB. However, the noise reduction effect depended on the degree of attenuation of the main frequency corresponding to the secondary radiated noise excited by the indoor vibration of the building. In order to alleviate the annoyance of the residents, it is suggested that the railway department can carry out the grinding of the wheel and rail, and the train should slow down properly and the speed can be reduced to about 50 km/h. The factors related to the grinding of the wheel and rail mainly include: the grinding depth, grinding surface roughness, grinding profile and surface hardness. The main requirement of grinding is to make the surface of the rail smooth, avoid spots and eliminate rust. At the same time, the vibration and noise attenuation energies were mainly concentrated at about 50 Hz after speed reduction. After implementing the proposed measures, a satisfaction survey of the residents suggested 83.6% improvements in terms of reduced complaints about noise pollution.
Based on the conditions of the test sites, field measurement data and noise reduction measures as examined in this study, it is practically possible for mature townships to legislate a maximum noise limit for URT. If the township’s condition is similar to those described in this study in Tianjin, China, a proposed maximum noise level for URT is 75 dB. For comparison, Japan legislates a maximum noise level of 70 dB for residential and mixed development areas [34]. Similarly, the same or a tighter limit can be tested for new URT development projects through field measurement. This requires close collaboration between regulators and URT developers and operators to ensure that new regulatory standards legislate effectively against noise pollution.
The same experimental setup can be swiftly replicated in other cities in China and around the world. The replication of the test method as described in this study can lead to a proliferation of field-measured noise data. With a global database of measured noise data, future studies on vibration index conversion can be carried out to establish international standards for benchmarking across different cities and townships. Those standards could also lead to the harmonization of regulatory and legal frameworks regarding noise control for URT developments and operations.
5. Conclusions
In this study, a field measurement of noise and vibration caused by the operation of urban rapid transit was carried out. The study established a baseline of noise pollution to surrounding neighborhoods of railway lines and provided an evaluation of noise reduction measures. A total of four buildings located near three railway lines were selected in the city of Tianjin, China. Subway lines 1, 3 and 6 were tested in the field. Furthermore, 396 sets of experimental data were collected and analyzed. The following conclusions were reached:
- Wheel-rail grinding and train speed reduction could reduce the indoor noise levels of buildings by up to 11 dB. After wheel and rail grinding, the vibration level could be reduced by at least 5 dB when the frequency spectrum was 50 Hz. After the subway speed was reduced, the vibration level of the noise could be reduced by 10 dB.
- The noise reduction effect depended on the decay of the magnitude of vibration transmitted into the room and the degree of frequency decay in the resonance of the building. Based on the actual measurement data in this study, after wheel and rail grinding, the noise level could be reduced by more than 8 dB when the frequency spectrum of the noise was 50 Hz. At the same time, after the speed of the subway was reduced, the noise level could be reduced by more than 10 dB.
- The indoor vibration of the measured city and the peak frequency of the noise were near 40 Hz, 50 Hz and 63 Hz. The vibration and noise data of each measured point were highly correlated. As the frequency increased, the secondary radiation noise-decay trend and vibration caused by the subway vibration remained the same.
- After grinding, it was found that the vibration peak points of other non-main peak frequency bands could occur due to the physical contact surface changes between the wheels and rails. The vibration and noise attenuation energy after speed reduction were mainly concentrated near 50 Hz. Through speed reduction, the noise and vibration in the buildings along the subway operation section could be significantly reduced.
- Based on evaluations against the most stringent limits in the ISO 717-1 and GB 50118 standards, the findings of this study suggest that the national current standards need to be tightened to ensure compliance by URT developers and operators.
Based on the findings of this study, the following developments in regulation and standards are recommended: Firstly, subway operators should measure the wheel and noise spectrum of vibration after grinding, and further investigate the special frequency band growth to ensure the noise level is within the satisfactory range for residents near the subway. In addition to the subway vibration isolation, noise reduction control and vibration reduction measures, we should also pay attention to the vibration frequency leading to room resonance. Only by paying attention to the main vibration frequency decay and the housing resonance frequency attenuation, can the impact of vibration and noise in the underground sections of subways be better solved. Finally, a threshold at which residents are likely to complain about noise pollution can be identified and new legislative standards can be established based on that threshold with support from the field measurement data in this study.
Author Contributions
Conceptualization, Y.H.; methodology, Y.H.; software, H.Q. and Z.Z.; validation, Y.H.; investigation, Y.H. and H.Q.; resources, V.N.; writing—original draft preparation, Y.H.; writing—review and editing, H.Q., S.L., V.N. and Z.Z.; visualization, H.Q. and Z.Z.; supervision, S.L.; funding acquisition, Y.H. All authors have read and agreed to the published version of the manuscript.
Funding
This research was funded by National Ecological Environment Standard Project of China, grant number 2020-31 and the National Natural Science Foundation of China, grant number 51806151; the Innovation Team of Cold Chain Units, Energy Saving and Cold Storage, College and University Municipality of Tianjin, grant number TD13-5088.
Data Availability Statement
Not applicable.
Acknowledgments
Not applicable.
Conflicts of Interest
The authors declare that they have no known competing financial interests or personal relationships that could have appeared to influence the work reported in this paper.
References
- Swinburn, T.K.; Hammer, M.S.; Neitzel, R.L. Valuing Quiet: An Economic Assessment of U.S. Environmental Noise as a Cardiovascular Health Hazard. Am. J. Prev. Med. 2015, 49, 345–353. [Google Scholar] [CrossRef] [PubMed] [Green Version]
- Liu, J.; Lian, S. Vibration and noise of the urban rail transit. J. Traffic Transp. Eng. 2002, 2, 29–33. [Google Scholar]
- He, P.; Cui, Z. Dynamic response of a thawing soil around the tunnel under the vibration load of subway. Environ. Earth Sci. 2015, 73, 2473–2482. [Google Scholar] [CrossRef]
- Ding, Z.; Li, D. Dynamic response analysis on vibration of ground and track system induced by metro operation. Eng. Comput. 2019, 36, 958–970. [Google Scholar] [CrossRef]
- Lowtan, D.M. Rail System in Malaysia. Mass. Inst. Technol. 2004, 1–16. Available online: https://www.mendeley.com/catalogue/bd53967e-6dda-3134-a56d-69e23c1f1ae0/ (accessed on 6 January 2022).
- Chen, C.H.; Peng, L.Y. The Laws and Measurements Analysis about Urban Rail Transit Noise and Vibration Reduction. Appl. Mech. Mater. 2014, 548, 1839–1843. [Google Scholar] [CrossRef]
- Xia, H.; Cao, Y. Problem of railway traffic induced vibrations of environments. J. Railw. Sci. Eng. 2004, 1, 44–51. [Google Scholar]
- Lyu, J. A Prediction Model of Urban Rail Transit Noise. In Proceedings of the 2020 International Conference on Communications, Information System and Computer Engineering (CISCE), Kuala Lumpur, Malaysia, 3–5 July 2020; pp. 137–142. [Google Scholar]
- He, W.; He, K.; Zou, C.; Yu, Y. Experimental noise and vibration characteristics of elevated urban rail transit considering the effect of track structures and noise barriers. Environ. Sci. Pollut. Res. 2021, 28, 45903–45919. [Google Scholar] [CrossRef] [PubMed]
- Zhang, P.; Hao, Y.; Zhang, L.; Sun, H.; Zhang, J.; Xu, Y. Study on the Applicable Standard of Secondary Radiation Noise Caused by Metro Train Vibration. Environ. Monit. China 2020, 36, 154–159. [Google Scholar]
- Yao, J.; Xia, H.; Zhang, N. Numerical Analysis on Building and Soil Vibrations Induced by Moving Trains Considering Dynamic Soil-structure Interaction. J. China Railw. Soc. 2014, 36, 93–98. [Google Scholar]
- Yang, J.; Zhu, S.; Zhai, W.; Kouroussis, G.; Wang, Y.; Wang, K.; Lan, K.; Xu, F. Prediction and mitigation of train-induced vibrations of large-scale building constructed on subway tunnel. Sci. Total Environ. 2019, 668, 485–499. [Google Scholar] [CrossRef]
- Liu, W.; Ma, M.; Wang, W. Prediction Method for Subway Train-Induced Environmental Vibration Responses. China Railw. Sci. 2013, 34, 110–117. [Google Scholar]
- Xie, W.; Zhao, N.; He, W.; Peng, Y. Analysis on vibration serviceability of over-track buildings. China Civil Eng. J. 2013, 46, 90–96. [Google Scholar]
- Liang, R.; Liu, W.; Ma, M.; Liu, W. An efficient model for predicting the train-induced ground-borne vibration and uncertainty quantification based on Bayesian neural network. J. Sound Vib. 2021, 495, 115908. [Google Scholar] [CrossRef]
- Yang, Y.; Weining, L.; Weifeng, L. Propagation Law of Ground Vibration in the Curve Section of Metro Based on In-Situ Measurement. China Railw. Sci. 2012, 33, 133–138. [Google Scholar]
- Vogiatzis, K.; Kouroussis, G. Airborne and Ground-Borne Noise and Vibration from Urban Rail Transit Systems. In Urban Transport Systems; IntechOpen: London, UK, 2017; pp. 61–87. [Google Scholar] [CrossRef] [Green Version]
- Mouzakis, C.; Vogiatzis, K.; Zafiropoulou, V. Assessing subway network ground borne noise and vibration using transfer function from tunnel wall to soil surface measured by muck train operation. Sci. Total Environ. 2018, 650, 2888–2896. [Google Scholar] [CrossRef] [PubMed]
- Hammad, A.; Wu, P.; Hammad, M.; Haddad, A.; Wang, X. Mathematical Optimisation of Rail Station Location and Route Design in Urban Regions through Minimising Noise Pollution. In Proceedings of the 35th International Symposium on Automation and Robotics in Construction, Waterloo, ON, Canada, 20–25 July 2018; Volume 35, pp. 1–6. Available online: http://www.iaarc.org/publications/fulltext/ISARC2018-Paper244.pdf (accessed on 6 January 2022).
- Lopes, P.; Costa, P.A.; Ferraz, M.; Calçada, R.; Cardoso, A.S. Numerical modeling of vibrations induced by railway traffic in tunnels: From the source to the nearby buildings. Soil Dyn. Earthq. Eng. 2014, 61, 269–285. [Google Scholar] [CrossRef]
- Andrew, P.; Peter, P.; Lars, V.A. Evaluating annoyance mitigation in the screening of train-induced noise and ground vibrations using a single-leaf traffic barrier. Sci. Total Environ. 2021, 790, 147877. [Google Scholar]
- He, C.; Zhou, S.; Di, H.; Zhang, X. An efficient prediction model for vibrations induced by underground railway traffic and experimental validation. Transp. Geotech. 2021, 31, 100646. [Google Scholar] [CrossRef]
- Houston, D.; Dang, A.; Wu, J.; Chowdhury, Z.; Edwards, R. The cost of convenience; Air pollution and noise on freeway and arterial light rail station platforms in Los Angeles. Transp. Res. Part D Transp. Environ. 2016, 49, 127–137. [Google Scholar] [CrossRef]
- Zhang, S.; Wei, J.; Liu, Y. Analysis of Traffic Noise Management and Monitoring about America, Australia and Singapore. Environ. Monit. China 2012, 28, 133–135. [Google Scholar]
- Tianjin Bureau of Statistics—Census Data Bulletin. Available online: http://stats.tj.gov.cn/tjsj_52032/tjgb/202105/t20210521_5457330.html (accessed on 16 November 2021).
- Hu, H.; Yang, J.; Pan, P. Comparative research on urban rail transit-induced building vibrations related specifications. Build. Struct. 2017, 47, 5–13. [Google Scholar]
- Zou, C.; Wang, Y.; Wang, P.; Guo, J. Measurement of ground and nearby building vibration and noise induced by trains in a metro depot. Sci. Total Environ. 2015, 536, 761–773. [Google Scholar] [CrossRef] [PubMed]
- Gong, P. Study on assessment standards and indexes of environmental vibrations in subways. Urban Rapid Rail Transit 2019, 32, 74–78. [Google Scholar]
- HJ 453-2018; Technical Guidelines for Environmental Impact Assessment—Urban Rail Transit. China Environmental Science Press: Beijing, China, 2018.
- GB10070-1988; Urban Regional Environmental Vibration Standard. National Environmental Protection Agency, 1998. Available online: https://max.book118.com/html/2019/0128/6234145111002004.shtm (accessed on 7 June 2021).
- JGJ/T 170-2009; Building Vibration and Secondary Radiation Noise Limit Caused by Urban Rail Transit and Its Measurement Method Standard. China Building Industry Press: Beijing, China, 2009.
- ISO 2631-2-2003; Mechanical Vibration and Shock—Evaluation of Human Exposure to Wholebody Vibration (Part 2: Vibration in Buildings). International Organization for Standardization: Geneva, Switzerland, 2003.
- Zhai, G. Low-Frequency Noise; Zhejiang University Press: Hangzhou, China, 2013; pp. 96–99. [Google Scholar]
- Hu, X. Research and Application of Vibration and Noise Reduction Technology for High-Speed Railway; China Railway Press: Beijing, China, 2018. [Google Scholar]
Publisher’s Note: MDPI stays neutral with regard to jurisdictional claims in published maps and institutional affiliations. |
© 2022 by the authors. Licensee MDPI, Basel, Switzerland. This article is an open access article distributed under the terms and conditions of the Creative Commons Attribution (CC BY) license (https://creativecommons.org/licenses/by/4.0/).