Abstract
Synchromodality is the key to finding sustainable solutions for logistics, especially across larger networks. The era of the COVID-19 pandemic has brought special attention to the disruptions in demand and supply across the world and has accentuated the need for sustainable transportation networks to handle such anomalies in supply chains. The proposed research develops a mathematical model for an intermodal transportation network and investigates the model on one of the largest and most widely discussed supply chain projects of the One-Belt-One-Road (OBOR) initiative. The proposed bi-objective model focuses on time and cost functions with rail, roads, and ships as modes of transportation. A detailed analysis was performed on various mode alternatives and links to evaluate their performance. The study provides an insightful understanding of the network with several suggestions. In contrast to roads and trains, container ships depict a fourfold increase in fuel consumption for an average ship weighing 4500 TEUs with the increase in shipping speed. It was concluded that increasing port capacity and reducing custom clearance time can have a major impact on lead times, and this is directly influenced by a country’s ease of doing business. Moreover, with its several branches, the OBOR initiative can provide a robust supply chain with increased logistical capacity.
1. Introduction
Globalization made a significant impact on market dynamics and trading over the last decade. Integrated markets around the globe increased trading dependencies among countries and led to the development of concepts such as Industry 4.0. In the current scenario, industries face an ever-increasing demand for reduced lead times and costs in order to remain competitive in the global market [1]. Logistics and transportation play a vital role in this area and contribute to the determination of the financial position of an enterprise [2]. Logistics and distribution costs account for 8–10% of the total costs. Even a small reduction in these costs can prove to be a decisive factor in defining the competitive position of an industry [3].
Massive investments in infrastructure are made by the world’s biggest economies to facilitate logistics, supply chains, and mobility. During the COVID-19 pandemic, global markets had to face massive disruptions in supply chain networks, and lockdowns across borders enforced the exploration of alternative routes. The world trade volume grew by 3.6%, while container traffic (measured in TEUs) increased by 4.8% in 2017–2018, which was double the rate in the previous year in 2016 [4]. According to EUROSTAT 2017 [5], Germany spends EUR 17 billion while Turkey spends EUR 4 billion on inland freight transportation. As the trade volume increases, the problem of congestion starts to increase as well. According to European statistics, more than three-quarters of the total inland freight transportation is being carried by road, making safety and the environment major concerns [6]. The major port of Europe in Rotterdam currently carries 55% of the freight via trucks for inland transportation [7], and it is aimed to reduce this percentage to 35% by 2030 and to reduce carbon emissions by more than 50% by 2050 [8]. Apart from environmental issues, burdening a single mode of transportation with freight where the same route is also being used for public transportation poses serious risks of congestion in peak hours, such as for ambulances. For a sustainable supply chain network defined by robustness and flexibility, a detailed network analysis for alternatives needs to be discussed. Moreover, the load needs to be distributed among other modes of transportation, such as rail and sea. The current study explores a case study of the OBOR initiative in a wider network that is spread across continents. The case study discusses all significant transshipment nodes in the network that have not been discussed so far in the literature. The purpose is to explore all possible routes and linkages, including train, road, and port networks.
2. Literature Review
To overcome the problems that especially come across with larger logistics networks and to provide sustainable solutions, synchromodal transportation networks are recognized as a promising alternative. Synchromodality is defined as an optimal solution for deploying various transportation modes (e.g., rail, road, and sea) in order to provide flexibility and sustainability [9]. The focus of this research is to provide a more sustainable and environmentally friendly solution and to shift road freight traffic to rail and maritime transportation. Hayuth [10] proposed a theoretical model for structural changes in network planning and compared various aspects of transportation modes, such as maintenance, reliability, and safety. Several research works have stressed the significance of this area and investigated operational, political, and structural complexities [11,12].
The main challenge for synchromodal transportation networks is synchronization and the distribution of various modes in the network for the continuous flow of goods. The coupling of various transportation hubs in a network design is beneficial for economies of scale [13]. Transportation models mainly aim to optimize the total costs incurred during the distribution of goods. Extended cost models include various cost factors, such as operational and maintenance costs. A few studies proposed full cost models by incorporating social and environmental costs as well [14,15]. Such models considered carbon taxes and included them in the cost models. However, it cannot be considered sufficient anymore to use only the cost functions to meet customers’ expectations; factors such as reliability, lead times, and efficiency also need to be considered in order to remain competitive in the market [16,17]. Various parameters that were focused on time consumption in network models have been considered in the literature. The main time parameter is taken to be travel time between the demand and supply stations, and is divided into two main types, i.e., active and non-active, depending upon the travel routes [18]. As the travel time is directly associated with travel distance and, in turn, fuel consumption costs, this parameter is considered as the most effective, and this has been solved as the vehicle routing problem (VRP) in the literature. Lin et al. [19] provided a detailed review on this topic for cost and time objectives. They observed that minimizing distance in the VRP is also energy efficient and sustainable.
Moreover, time windows are of significance when routing for large intermodal networks. Chang, T. [20] proposed a non-linear model with multiple commodities and time windows with concave costs. The model defined cost parameters in relation with time windows. However, the literature considering time windows and inventory costs for intermodal transportation networks is lacking.
Another important factor when considering time functions is traffic congestion. The demand and supply between the most efficient routes lead to traffic congestion. Traffic congestion not only increases the travel time between routes, but it also leads to higher fuel consumption. Studies have argued for the extension of the VPR model and the inclusion of carbon taxes in the total cost model [21] for sustainable transport services [22]. With the same distance between routes, traffic congestion causes an increase in time and fuel consumption. Therefore, a linear relation is not adequate for finding travel time, and the literature utilizes the BPR equation to relate time and speed as per the state of the road, i.e., traffic congestion [23]. Other considerations that are incorporated into the equation are the volume and capacity of the road.
In addition to the non-linearity in the travel time of a road, the speed of freight ships is also a significant parameter that needs to be monitored. For larger intermodal transportation networks containing hubs and ports, time windows are of significance. For instance, a 24 h delay in an average freight ship with 4500 TEUs can cost 57,000 euros [24]. The speed of freight ships varies from 10 to 24 knots, which can cause a variation of 50% in the travel time. Moreover, unlike that of road transportation, the fuel consumption of container ships varies significantly with their speed. In state-of-the-art research in logistics, this issue has been discussed separately, and the literature has proposed various simulation and regression models to accurately measure the optimized speed of a ship and its relation with fuel consumption [25,26]. However, the issue has not been addressed in intermodal transportation models. We aim to propose a model that considers the effect of shipping speed on cost and time.
The highlights of the current work are as follows: (i) the study and analysis of the transportation network along the new Silk Road spread across Asia and Europe, (ii) the proposal of a mixed-integer non-linear model for the analysis of a synchromodal transportation network considering time windows and inventory, (iii) the consideration of the non-linear effect of ship speed and fuel consumption in relation to the transportation time in the model, (iv) the performance of a sensitivity analysis of the capacities of various links and the provision of Pareto solutions using cost and time as objective functions, and (v) the analysis of the roles of various ports, road links, synchromodal transfer options, and customs operations in the performance of the OBOR initiative.
3. Materials and Methods
3.1. Mathematical Model
We propose a non-linear intermodal transportation network. The model is developed as a bi-objective problem for the optimization of cost and time. As compared to the single optimization problem, the bi-objective problem simultaneously tries to minimize the total travel time and cost by keeping the travel time, transfers, and inventory at the minimum level. To find the best compromise between these two objectives of time and cost, Pareto optimal results are produced based on time and cost factors. As the model is developed for large transportation networks that involve international borders, customs costs and time are also included in the transportation network. The inventory retained at each node is calculated and charged with a per-unit cost. The capacities of different transportation modes are important in such models. Each truck is considered to have a fixed capacity of one 20-foot container, i.e., one TEU, while trains have a capacity of around 90 containers. In general, the weight limit of the cargo trains used in Europe is set to be 8 tons per meter. As the maximum weight for the train to carry is considered to be around 2250 tons, while a single 20 feet container can carry up to 24 tons, cargo trains without passengers are limited to 90 containers. The limit is set by considering the load-bearing capacity of standard European couplers and axle design [27]. Due to these design limitations, unlike in North America, double-stacked containers are not popular in China or Europe. The capacity of the ship is limited to 4500 TEUs.
The model was applied to a case study of the One-Belt-One-Road (OBOR) initiative. This particular case study was adopted due to its significance in global supply chains. The OBOR initiative is considered to play a leading role in a sustainable, flexible, and secure supply chain by providing increased logistical capacity and strengthening cross-border routing alternatives for oil and goods [28]. The project is considered one of the most ambitious projects of the century, with investment of USD 4–8 trillion, and it affects 62% of the world’s population [29]. China, the initiator and main beneficiary of the project, has become an industrial state with a huge demand for energy, and 77% of its oil imports are carried through the Strait of Malacca [30]. Several geopolitical issues and congestion on the route have made this strait less attractive for China and have motivated them to develop infrastructure for efficient logistics. The project will not only promote trade among the partner countries, but will also help in the development of infrastructure across the region. Major cities and ports along this route were identified for data collection. For the transportation network, nodes i and j were used to describe shipment points, while the links represent transportation routes between these nodes, which can be rail, ship, or road links. The transfer times of the model were limited by the speed and distance of the nodes. As this study comprised logistics across borders, customs time and costs were included in the model. However, due to data limitations, actual costs and time could not be calculated.
| Indices | |
| i,j | Set of nodes (i,j = 1, … I) |
| k,l | Set of transportation modes (k,l = 1, … K) |
| T | Time interval 1, … T |
| M | Set of regions for speed limits of mode k |
| Parameters | |
| Unit transportation cost per km for node i to j via mode k | |
| Unit transfer cost per container for transportation mode k to l | |
| Unit customs cost per container for node i to j via mode k | |
| Unit customs clearance time per container for node i to j via mode k | |
| Holding cost per unit | |
| Unit transfer time from mode k to l | |
| Demand of node i at time t | |
| Capacity of node i with mode k | |
| k = train | |
| Variables | |
| Total number of carried goods for node i to j via mode k at period t | |
| Total inventory for node i with mode k at period t | |
| Total travel time from i to j via mode k at period t | |
| Departure time for node i to j via mode k at period t | |
| Arrival time for node i to j via mode k at period t | |
| Unit transfer time from mode k to l | |
Subjected to:
Equation (1) represents the primary objective function of the model for minimizing cost. For the intermodal transportation network, the costs, including shipping costs, transfer costs between various modes of transportation, customs costs between nodes involving borders, and inventory costs, were included. The secondary objective function requires the minimization of the time for delivery. This includes the travel time, border-crossing time, transfer time, and waiting time for the containers. Equation (3) represents the time windows and ensures that the departure of any vehicle takes place after the arrival in case there is a transfer at the node. Equations (4) and (5) describe the continuity of a network where a link is joined with at least one of the transportation modes. Equation (6) ensures the capacity constraints at any node for keeping the inventory. Equations (7) and (8) are used to fortify transportation at the link with minimal cost and/or time. Equation (8) assures that, in case there is no transfer between transportation modes, the transportation mode arriving at node j is the same as the transportation mode leaving node j. Equation (9) defines the conservation of mass among the nodes. Equations (10)–(12) are used to update the arrival times at the nodes, while time is modeled as a step function. Equation (13) is used to calculate the travel time between the links for rail and sea and is a linear function. Equation (14) is used to calculate the travel time for road links where b = 4, which makes it a non-linear function. This BPR equation is used to consider traffic congestion of a link at period ‘t’ while taking the volume and capacity of the link into account. Equations (15)–(17) define the total travel costs of the transportation modes. Here, Equation (16) is used to calculate the fuel consumption cost of ships, which is non-linearly dependent on their speed. In logistics, freight ships are considered to be the most economical mode for the delivery of goods. However, they are also the most time consuming. The models proposed in the literature do not consider the varying relationship of speed and time for container ships. For instance, an average freight ship with a capacity of 4500 TEUs travelling at a slow steaming speed of 10 knots from the port of Shanghai to the port of Rotterdam will take up to 52 days. However, the travel time can be reduced to 21 days at a speed of 24 knots. The increase in speed, however, will have an impact on fuel consumption and, hence, travel cost. We propose a model in order to analyze this relation in order to find the optimal parameters for freight ships. Instead of a classical distance–cost relationship, the variation of fuel consumption with the speed of the container ship is considered.
Regarding train speed, two regions were selected in the model. This was considered to compensate for traffic congestion in the European part of the case study. Due to traffic congestion on rail networks, the speeds of the trains in the European region are lower. The average speed was considered in order to calculate the travel time of trucks; however, it could also be specified with regions. For instance, a lower speed than average could be assigned to road links in hilly or rural areas. The rest of the constraints are non-negativity constraints.
3.2. Methodology
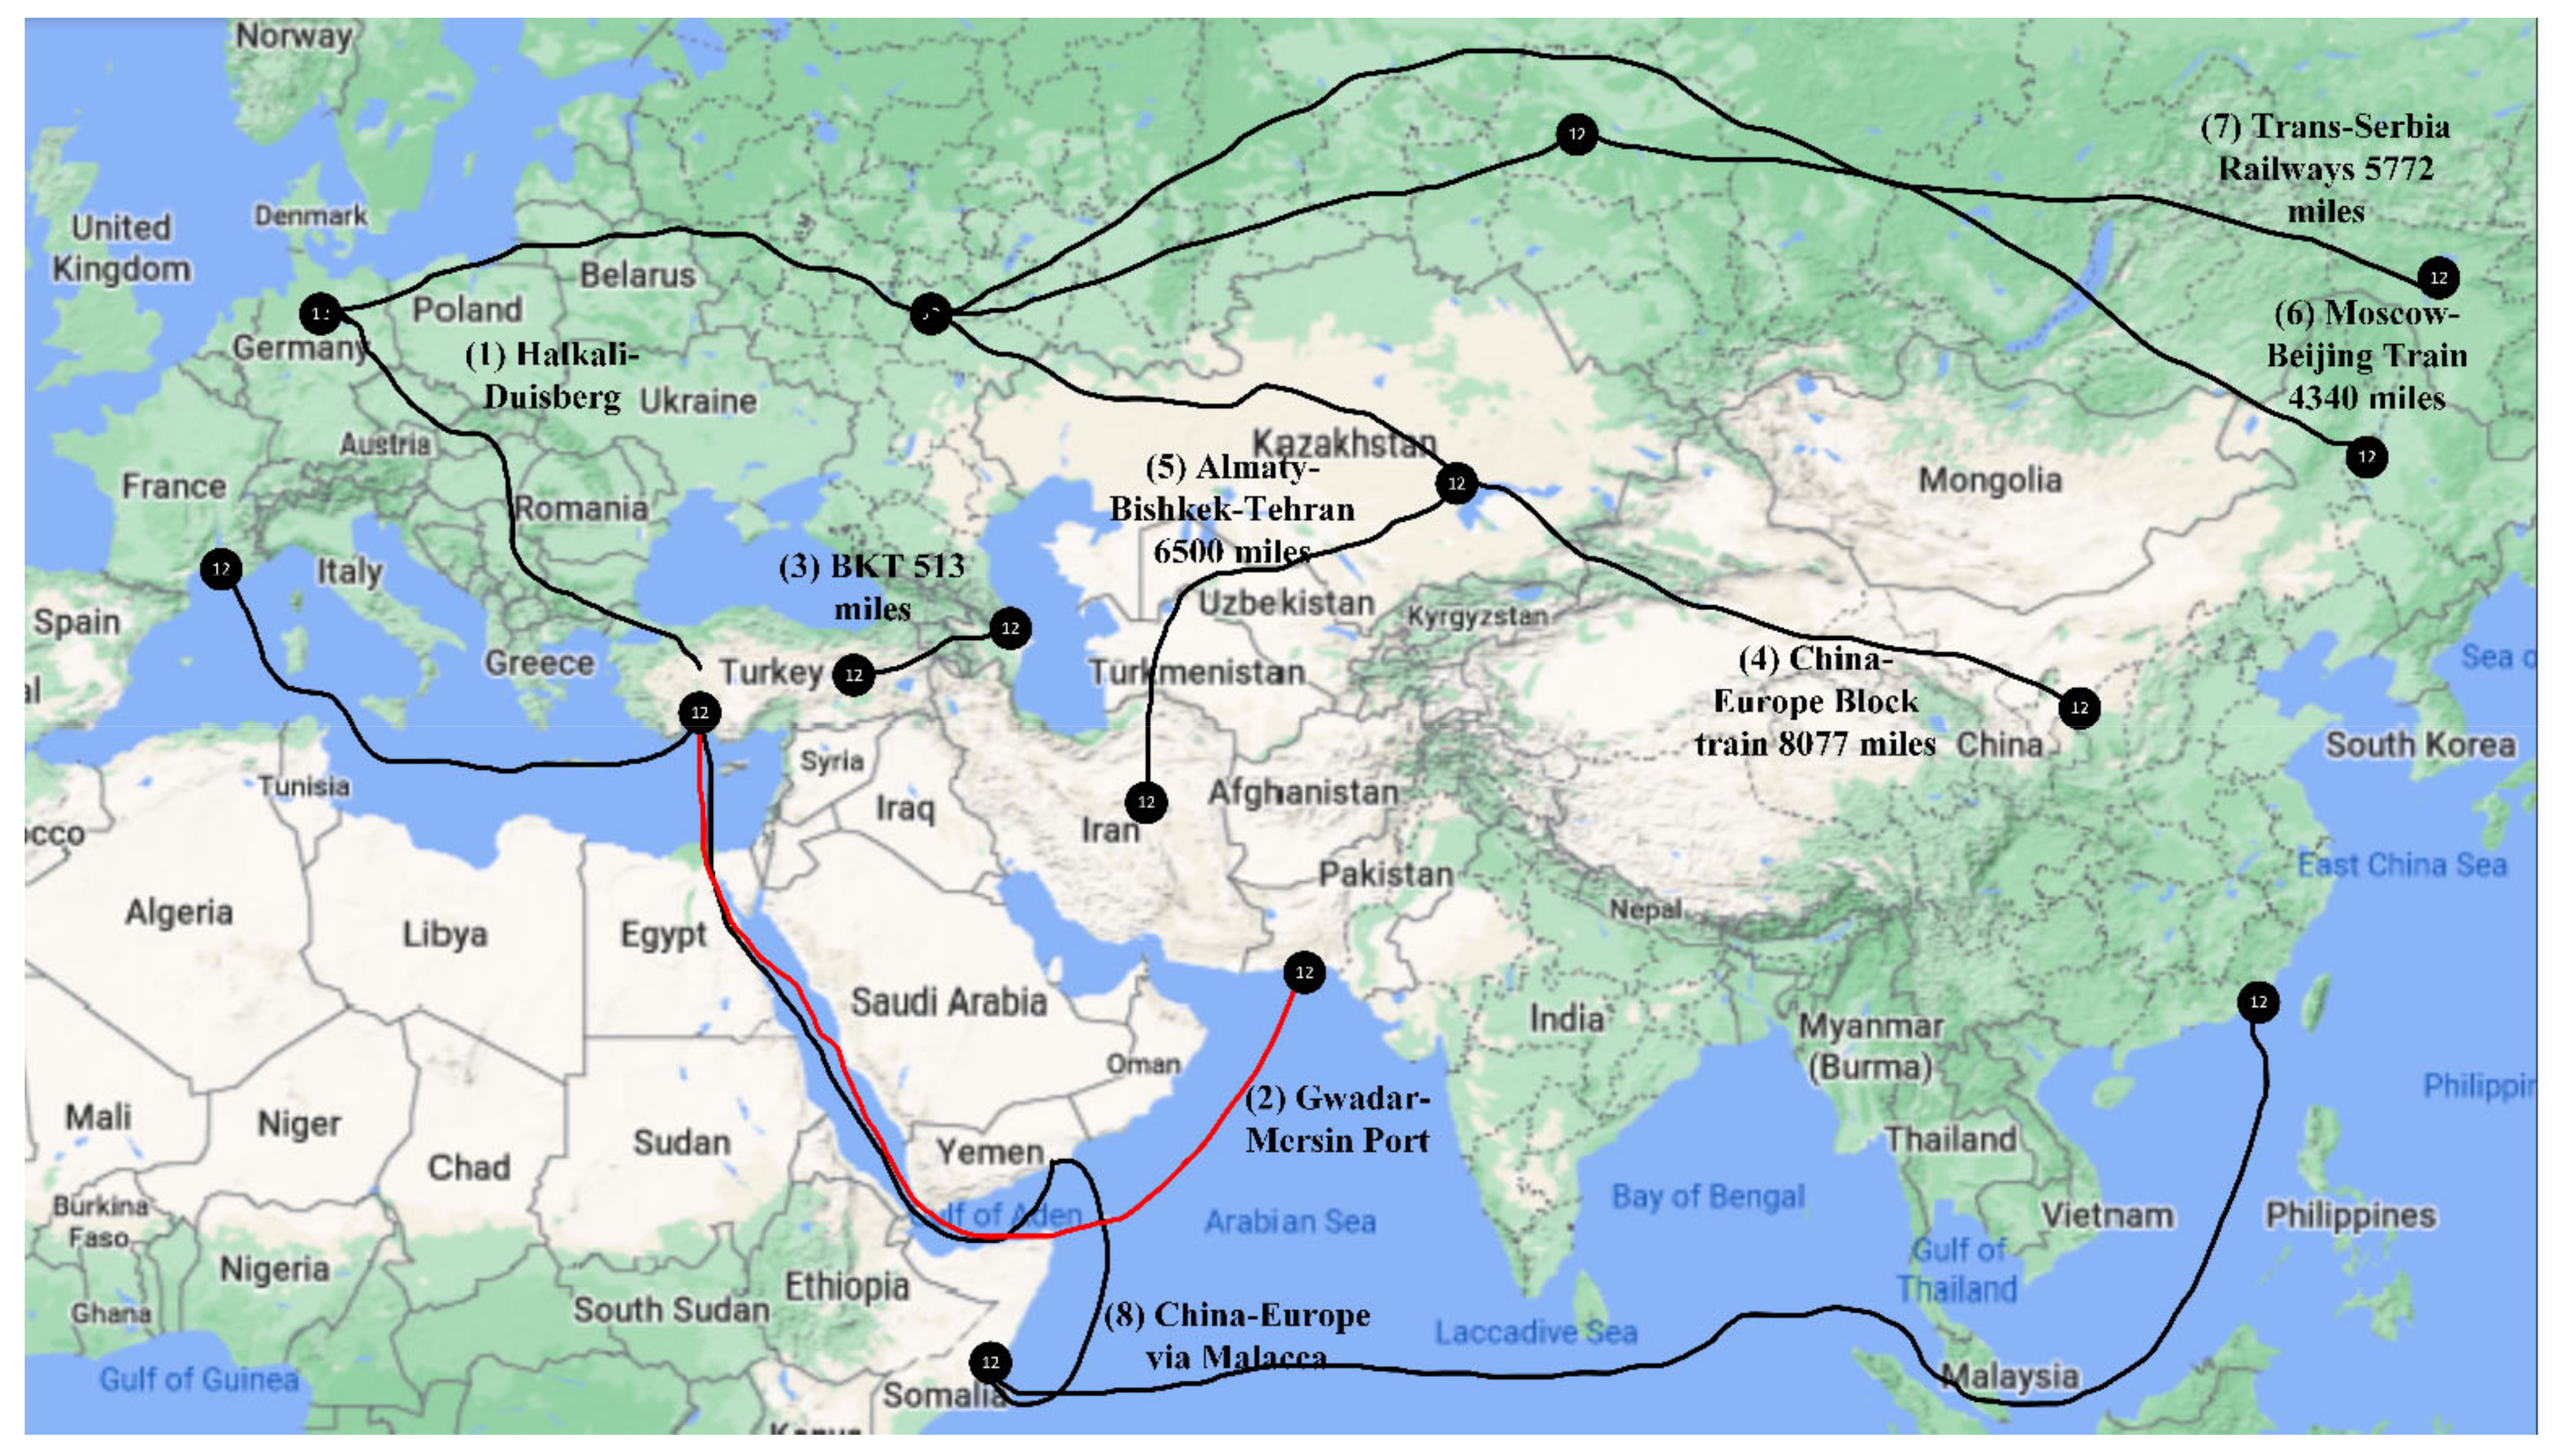
In this section, an overview of the data used for the implementation of the model is discussed. The new Silk Road is considered one of the most important logistics projects involving international borders across continents. The main route connects Asia and Europe, starting from China. In addition to the main route, economic belts have also been planned to further strengthen trade across borders. Among the projects, the China–Pakistan Economic Corridor (CPEC) is the fastest growing project and connects China with major ports of the Arabian Sea. The social impact of this corridor is also of significance, since the region comprises densely populated areas that accommodate more than half of the Earth’s population. We considered major ports and shipment centers along the route. Figure 1 represents the selected network modes along the route. Rail, roads, and ships were considered for the transportation of cargo. For imports and exports of goods from China to Europe, various routes could be adopted. As the locations of this larger network are important, major ports and transshipment centers were included in the entire region. The various locations and links are shown in Figure 1, along with their distance information. The major cities and ports of China that are involved in manufacturing were included in the network. The major manufacturing and logistical hubs located in western China include Shanghai, Guangzhou, and Tianjin. These ports are open for international ships and have access to the ocean, and Shanghai is the world’s busiest port. The ports of Guangzhou and Tianjin were considered in this case study, as these are the largest ports in southern and northern China, respectively [31,32]. With the development of the new Silk Road and the CPEC, China aims to develop southern and northern China to address poverty in these regions. For the case study, only the existing connections between nodes were considered, and planned logistics infrastructure was not taken into account. The distances between these nodes were taken from existing highway information and are shown in Table 1.
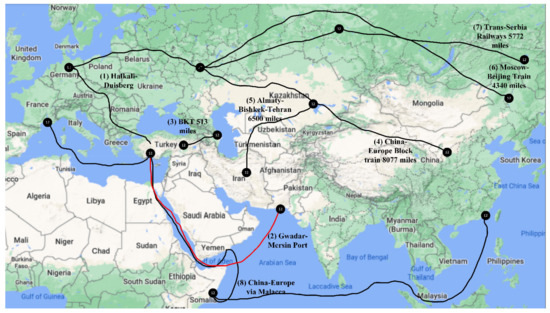
Figure 1.
Transportation routes on the maritime Silk Road and the OBOR initiative. Route (1): Halkali–Wien–Duisberg; route (2): Gwadar–Mersin Port; route (3): Baku–Tbilisi–Kars; route (4): China–Europe Train; route (5): Almaty–Bishkek–Tehran; route (6): Moscow–Beijing Train; route (7): Trans-Serbian Railway; route (8): China–Malacca Strait–Rotterdam.

Table 1.
Highway links in China.
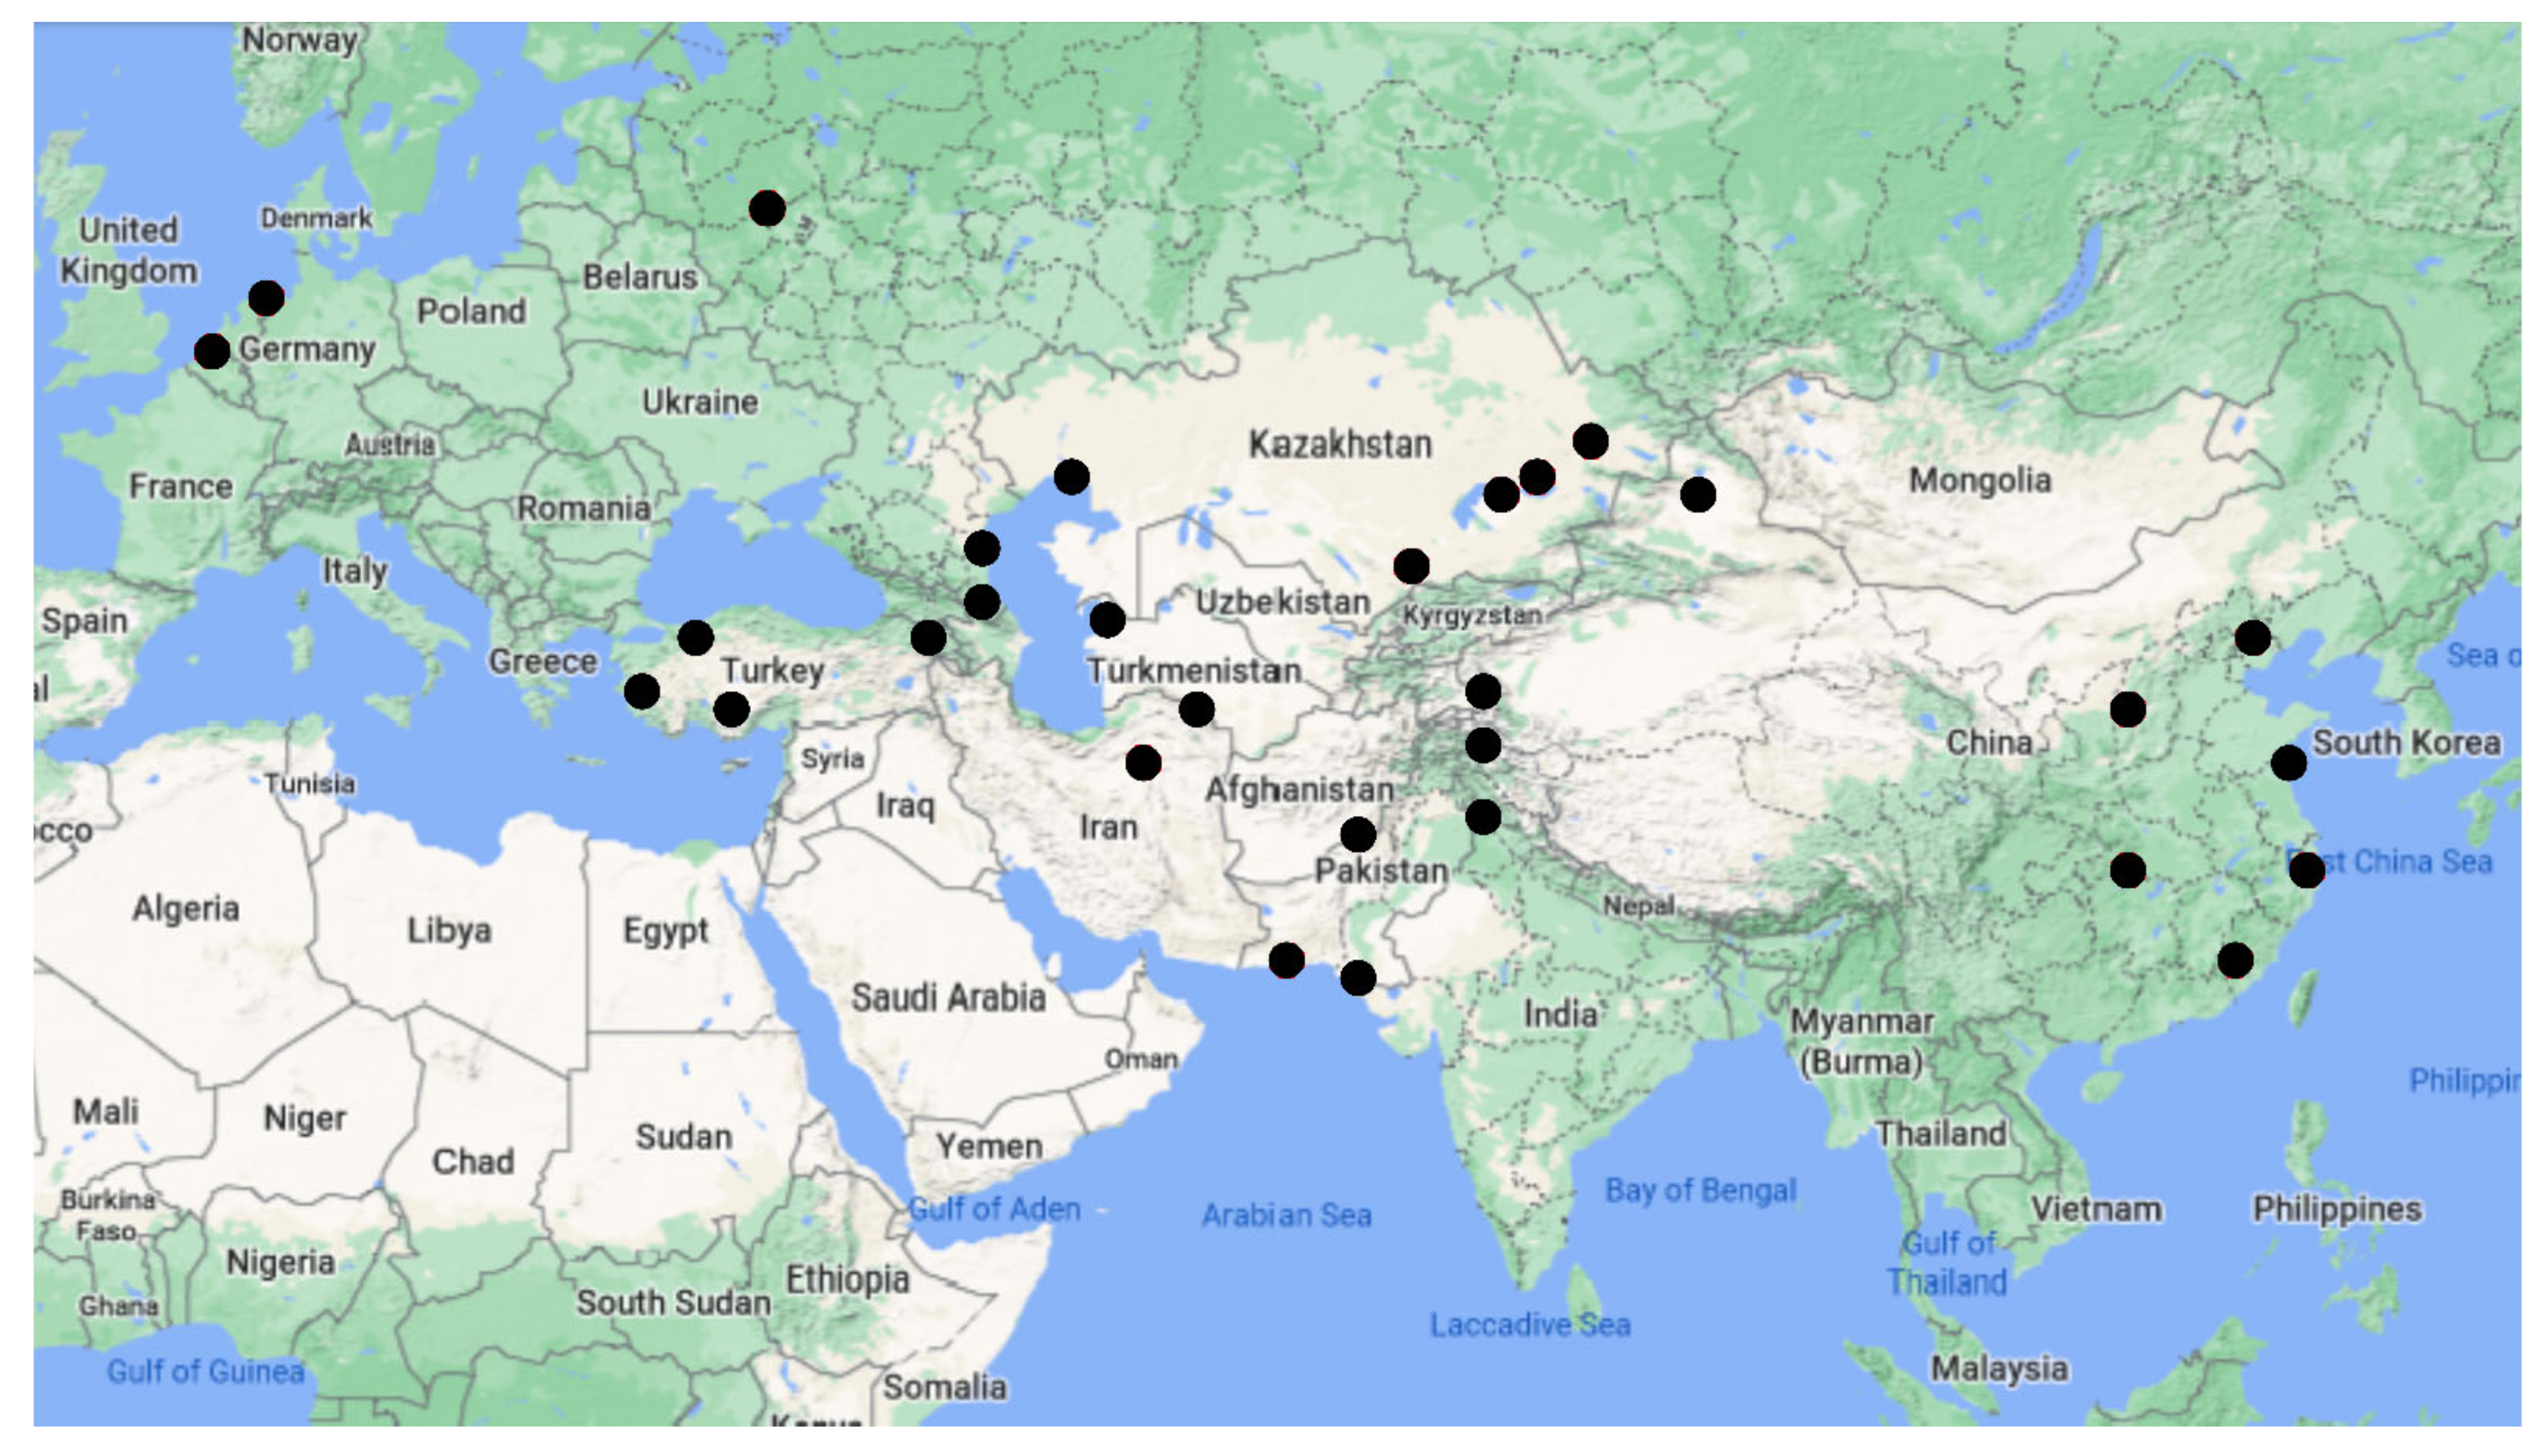
In this case study, China was considered as the starting point from Asia, and in Europe, the important logistical hubs of Rotterdam and Cologne were considered. Rotterdam is the largest port in Europe, and it is linked with Germany and the rest of Europe through Cologne. Shipments between Asia and Europe can be made with a block train between China and Germany by crossing through Kazakhstan. The ports of Almaty and Khorgos in Kazakhstan play a significant role in the network. From the point of Tole-Bi in Almaty, the goods can be delivered via Russia or Asia. Khorgos is located at the border of China and Kazakhstan and connects landlocked Kazakhstan to the rest of the world. It is expected to be the world’s largest dry port with a capacity to handle 30 million tons of freight per year. Figure 2 depicts all nodes considered in the present study for synchromodal transportation. All of these nodes are shown in Table 2. In the next subsection, we will discuss the transportation processes in detail, along with the parameters and constraints considered in the model.

Figure 2.
Intermodal transportation nodes of the OBOR initiative.
Table 2.
Transportation nodes for the case study.
3.3. Experiments
As air logistics contribute only 1% of the volume of the total trade, we considered ship, rail, and road as modes of transportation in the network. The tests were performed by implementing the mathematical model in Matlab R2015a with an integer solver. One of the main objectives was to minimize the total travel time between the demand and supply nodes. In addition to the actual travel time, other elements that contribute towards the total time are customs clearance time, holding time at the node, and transfer time from one to another mode of transportation at the node. The average customs clearance time used for the model was based on customs reports [33]. For the transfer times, a binary decision was used in the model. As transfer times are not considered mode-specific [34], average transfer times per container were utilized [35]. The actual travel time is limited by the speed of the selected transportation mode. For the cargo trucks, the average speed of 80 km/h was considered for the shipments. However, to consider the effects of the capacity of the roads and volumes on node links, the BPR equation was used, which made the model non-linear. Analyses of constants a and b in the BPR equation were conducted in the literature. The equation was first developed for freeway flow speed by using the mean speeds and capacities of vehicles. A new modified equation proposed by Spiess [36] was able to generate traffic flow equilibrium results that were more reliable. Dowling et al. [37] performed a comparative analysis of various models proposed in the literature and suggested a value of 4 for parameter b, thus making the BPR a 4th-degree equation. Many researchers have tried to linearize the problem by using relaxation methods. In a study by Resat and Turkay [35], both values of the constant b were used for the intermodal transportation problem for a case study inside the Marmara region. The error was found to be less than 5% for the linear and non-linear cases.
To calculate the travel times by train, two speeds were used for the case study. It was observed that in the Asian zone, the average speed of trains was higher compared to the average speed in the European region. Across China and Russia, the average speed was taken to be 60 km/h, while for Europe, the speed limit was reduced to 30 km/h [38]. The train network is more congested in Europe, and thus, traffic congestion causes the average speed to be slow. Transfer costs are only accrued when a transfer from one to another mode of transportation happens, with some exceptions. A block train is used to transfer shipments between China and Russia through Kazakhstan, but a transfer takes place between China and Kazakhstan at the point of Almaty. This is because of the difference in train track gauges. Chinese trains use a standard gauge of 1435 mm, which is the most widely used gauge in the world, including Europe [39]. On the other hand, Russian gauges are 1524 mm, making this transfer necessary.
Container ships are considered the most economical way of delivering goods. The fuel costs of a ship constitute the most significant cost of voyages [40]. The fuel consumption of a ship depends on various factors, such as the type of fuel, engine type, ship size, etc. However, vehicle speed plays the most important role in determining the fuel consumption of a ship [41]. The speed is generally measured in knots (1 knot = 1.8 km/h) and ranges from 10 to 25 knots. Container ships, on average, travel at a slow steaming speed range of 15–20 knots, while minimal cost can be obtained in the speed range of 10–12 knots. However, even a slight change in the ship’s speed can affect fuel consumption. For example, changing ship speed from 24 to 21 knots can reduce fuel consumption to 33% [42]. Researchers have made various efforts to predict the optimal speed of a container ship by taking various factors, such as ship size and engine power, into account [43]. In another study [44], it was observed that static analysis is not sufficient to determine the optimal ship speed, and a dynamic analysis that also accounts for weather changes along the route should be performed. However, none of the studies discussed the relation of a vessel’s speed with fuel consumption in intermodal transportation models. Classical formulas used to calculate the fuel consumption of the ships did not consider the weight of the ship. For the present case, a modified form of classical formula was used, which considered the effects of dynamic weather changes and the weight of the ship [45]. The fuel consumption was calculated against an input vessel speed and was multiplied by the total travel time to obtain the total fuel consumption. For the calculation of the cost, cost parameters were obtained from a UAPS report in the form of unit cost for fuel, maintenance, and other considerations. In the next section, the results of the experiments performed will be discussed in detail.
4. Results and Discussion
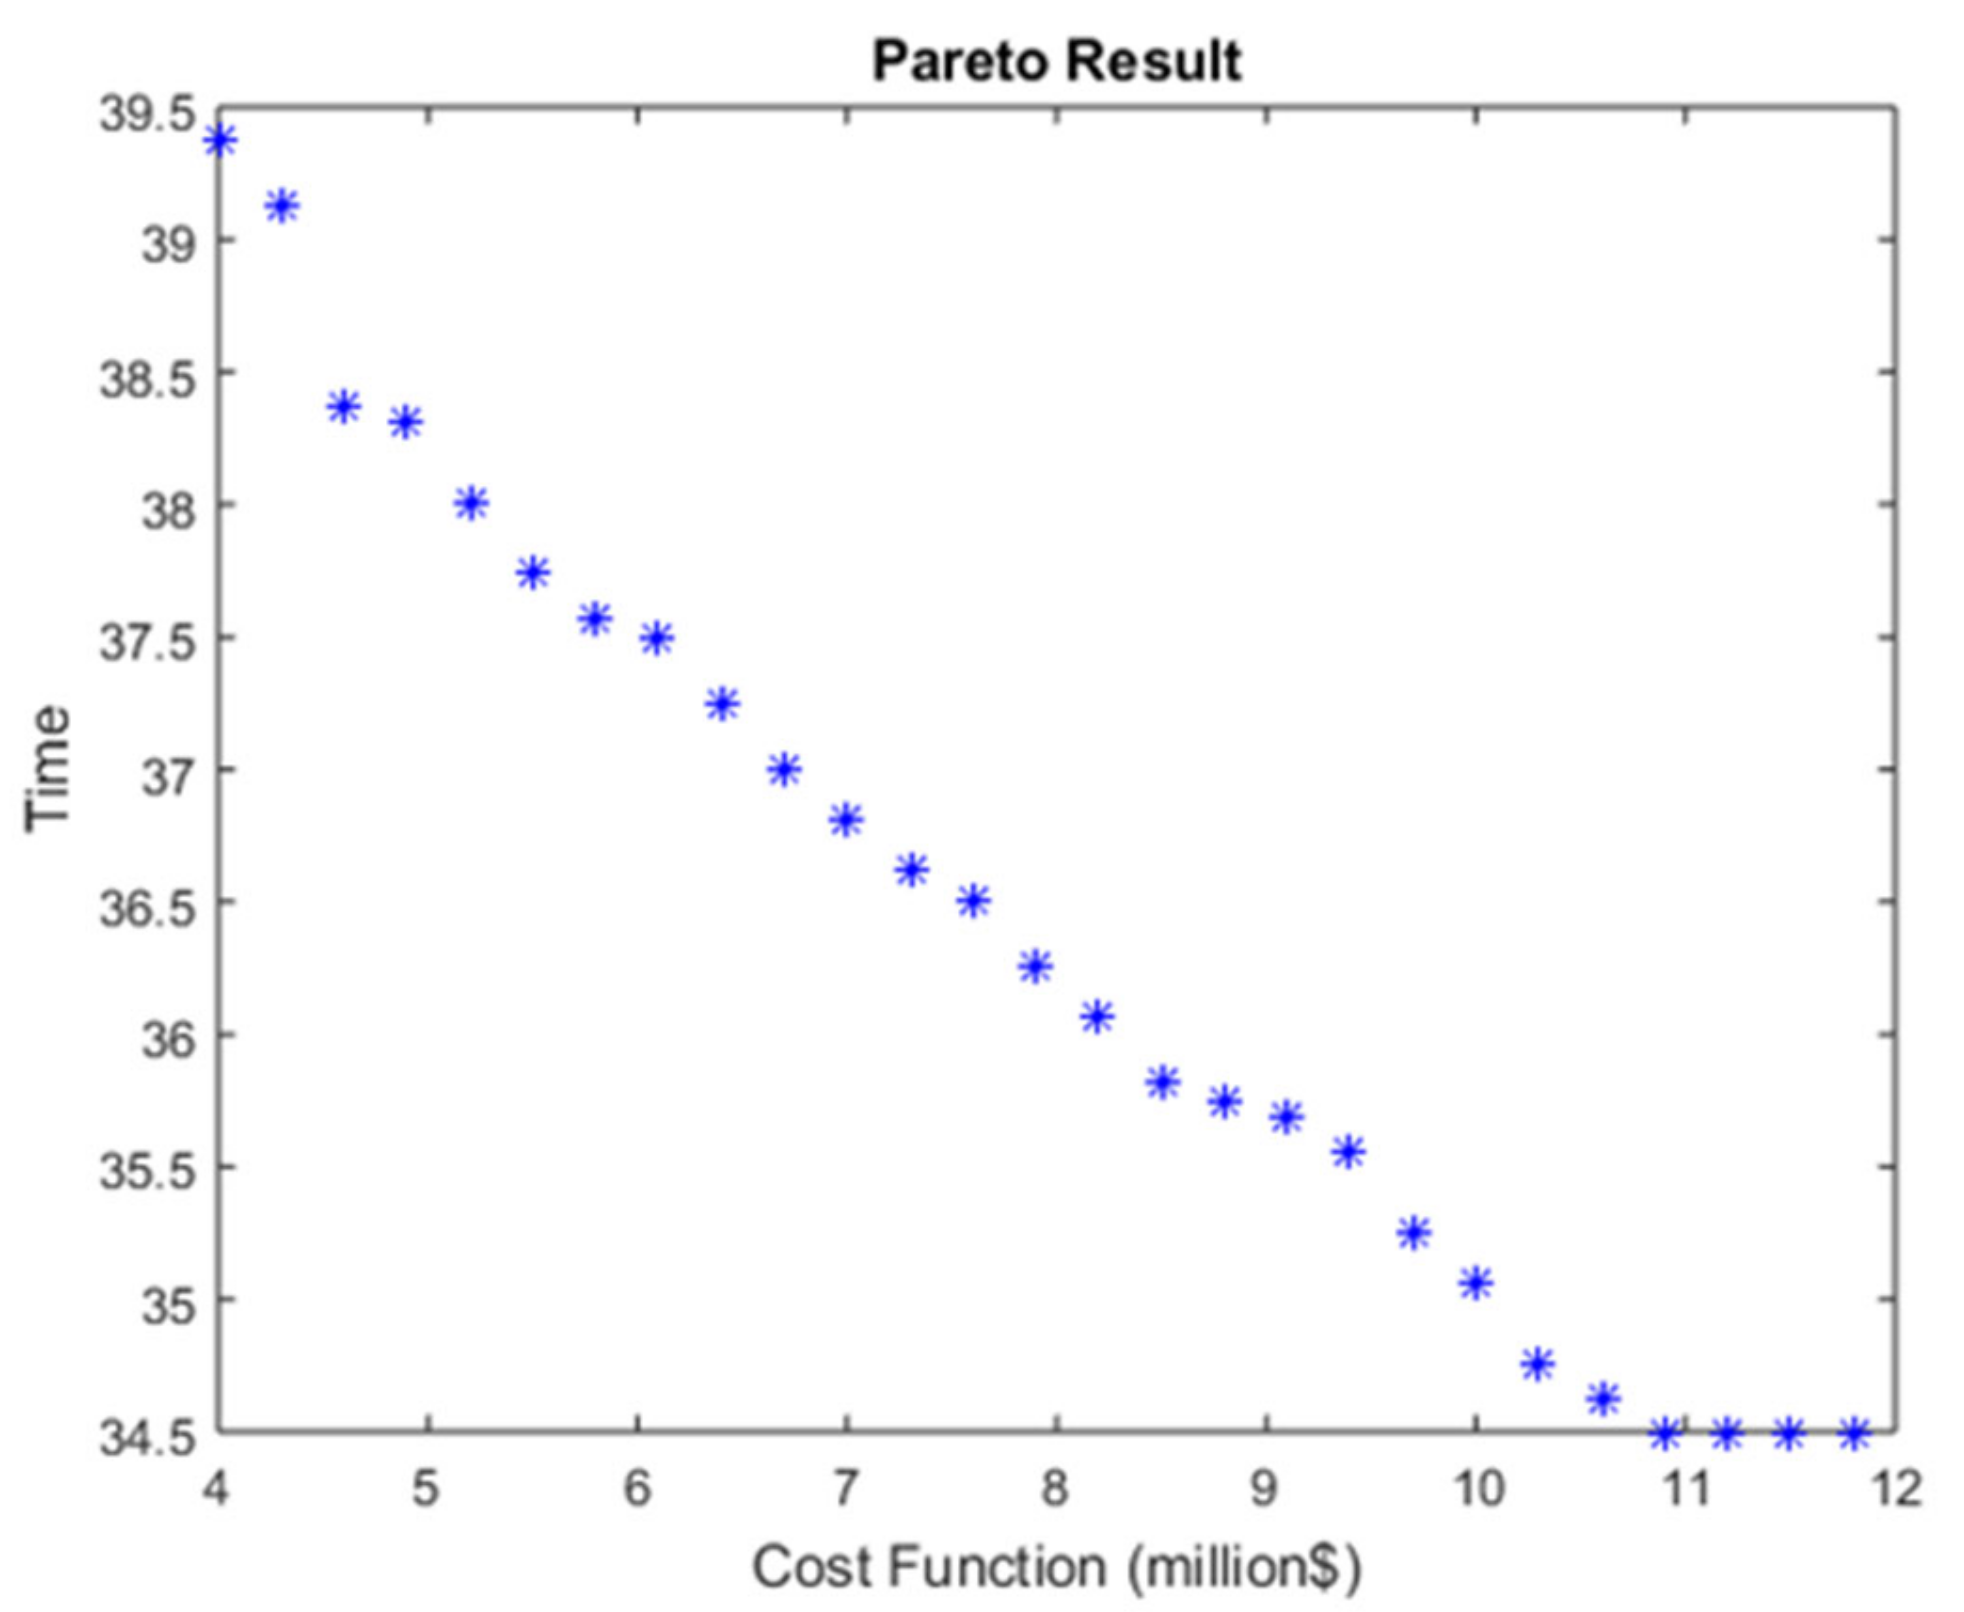
We ran tests to obtain Pareto solutions for the time–cost trade-off problem. The ε-constraint method [46] was used to obtain the solutions for the linear and non-linear cases. Figure 3 represents the Pareto extreme solution obtained for the linear case. In previous cases of intermodal transportation [35], the error was found to be less than 5%; hence, our approach uses the linear case to obtain these non-dominated solutions. The existing case study is spread across a larger network. The main focus was the OBOR corridor and the transfer link from China to Europe. In particular, Germany was selected as the final destination, since it shares the largest import costs with China [47]. In order to explain this, we explain some of the solutions obtained in the non-dominated Pareto front.
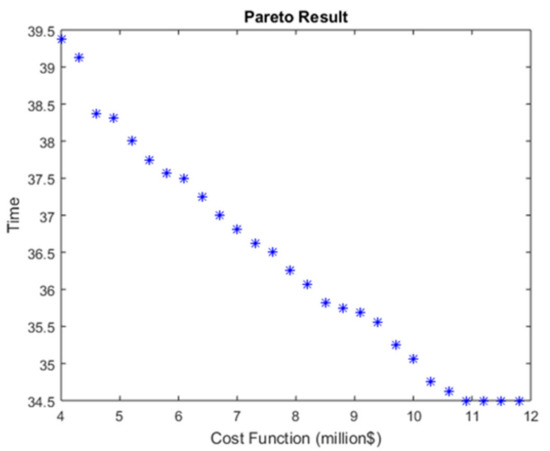
Figure 3.
Pareto results with the linear model.
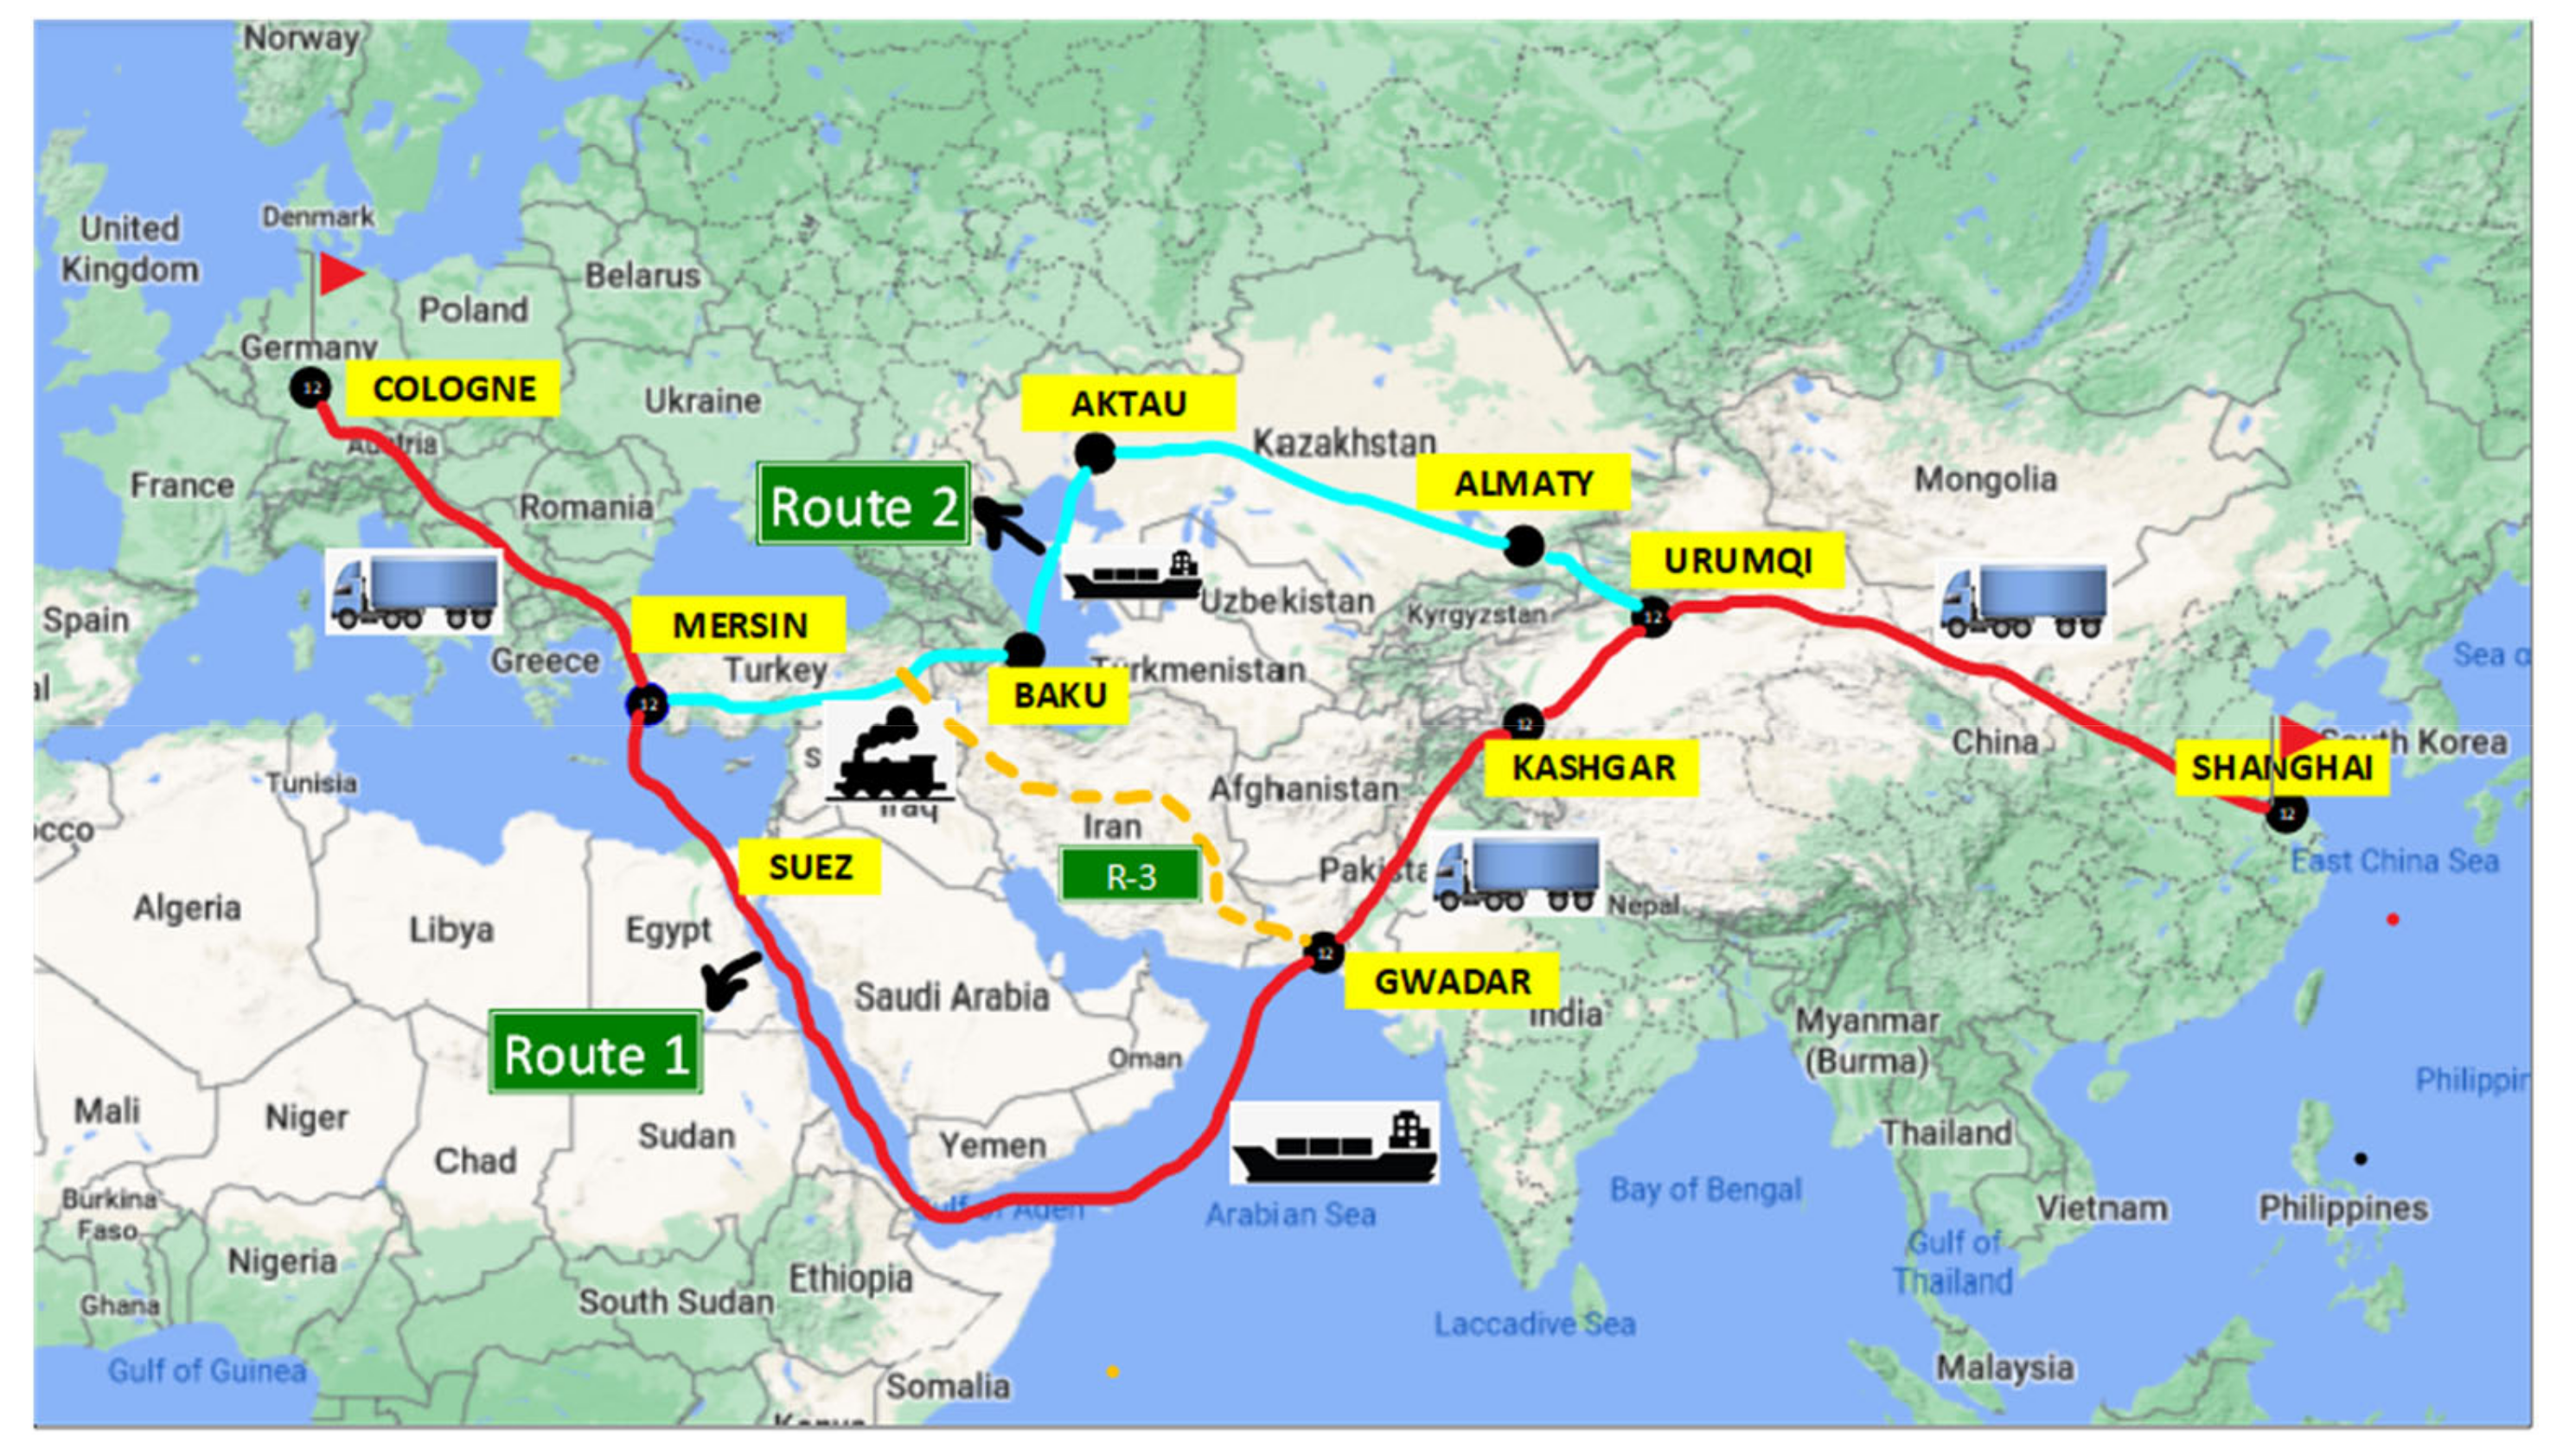
The traditional maritime Silk Road from China to Europe takes 38–40 days with a shipping speed of 12 nautical miles and appears to be the most cost effective. However, in addition to passing through the Strait of Malacca, this route also faces the challenge of passing through the 193 km Suez Canal, where the speed limit is reduced to 8 knots. Moreover, the canal also imposes limits on the sizes of ships. The results were obtained by using an average ship with 4500 TEUs. Another solution provides the shortest travel time with the use of a block train from China to Europe via Kazakhstan and Russia, but the transfer time to account for the different gauges used for the train tracks and the customs clearance time make this option less attractive. Moreover, due to poor infrastructure and security reasons, the average waiting time of 3–15 h at the Almaty dry port needs to be considered. The travel time in this case is reduced to 37 days. One interesting solution is the use of the CPEC between Pakistan and China. The port of Gwadar is used to transfer shipments to Mersin and Istanbul, from which they are then transported to Europe via trucks and freight trains. Among all these options, it is assumed that there would be no ship delays, as a 24 h delay in transshipment via container ships is said cost EUR 57,000. Figure 4 depicts the most interesting alternative routes, while details on the routes are provided in Table 3. It should be noticed that the total travel time does not include the customs clearance time or transfer time between modes. The best solution seems to use the Baku–Tbilisi–Kars (BTK) train network, which is another megaproject of the OBOR initiative. The shipment is received at Baku from the dry port at Aktau via the Caspian Sea. However, it should be pointed out that these routes were investigated by considering a shipment of 1 TEU, which can be carried by an individual truck. However, in the case of larger amounts of cargo, multiple trucks would be required to carry the cargo, thus resulting in higher costs. For such deliveries, the maritime Silk Road or the block train seems to be a more feasible option. Another rail link from Gwadar to Tehran and Istanbul via the point of Gulburaq is proposed, as it can provide minimal travel time.
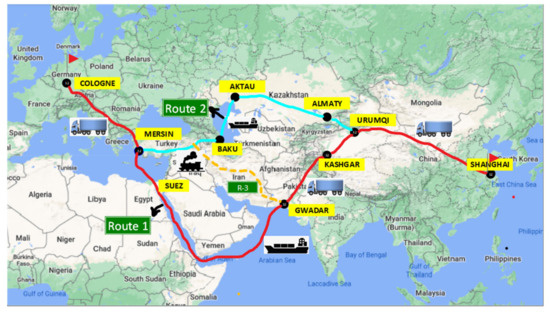
Figure 4.
Synchromodal routing options.
Table 3.
Time/cost analysis for routing options.
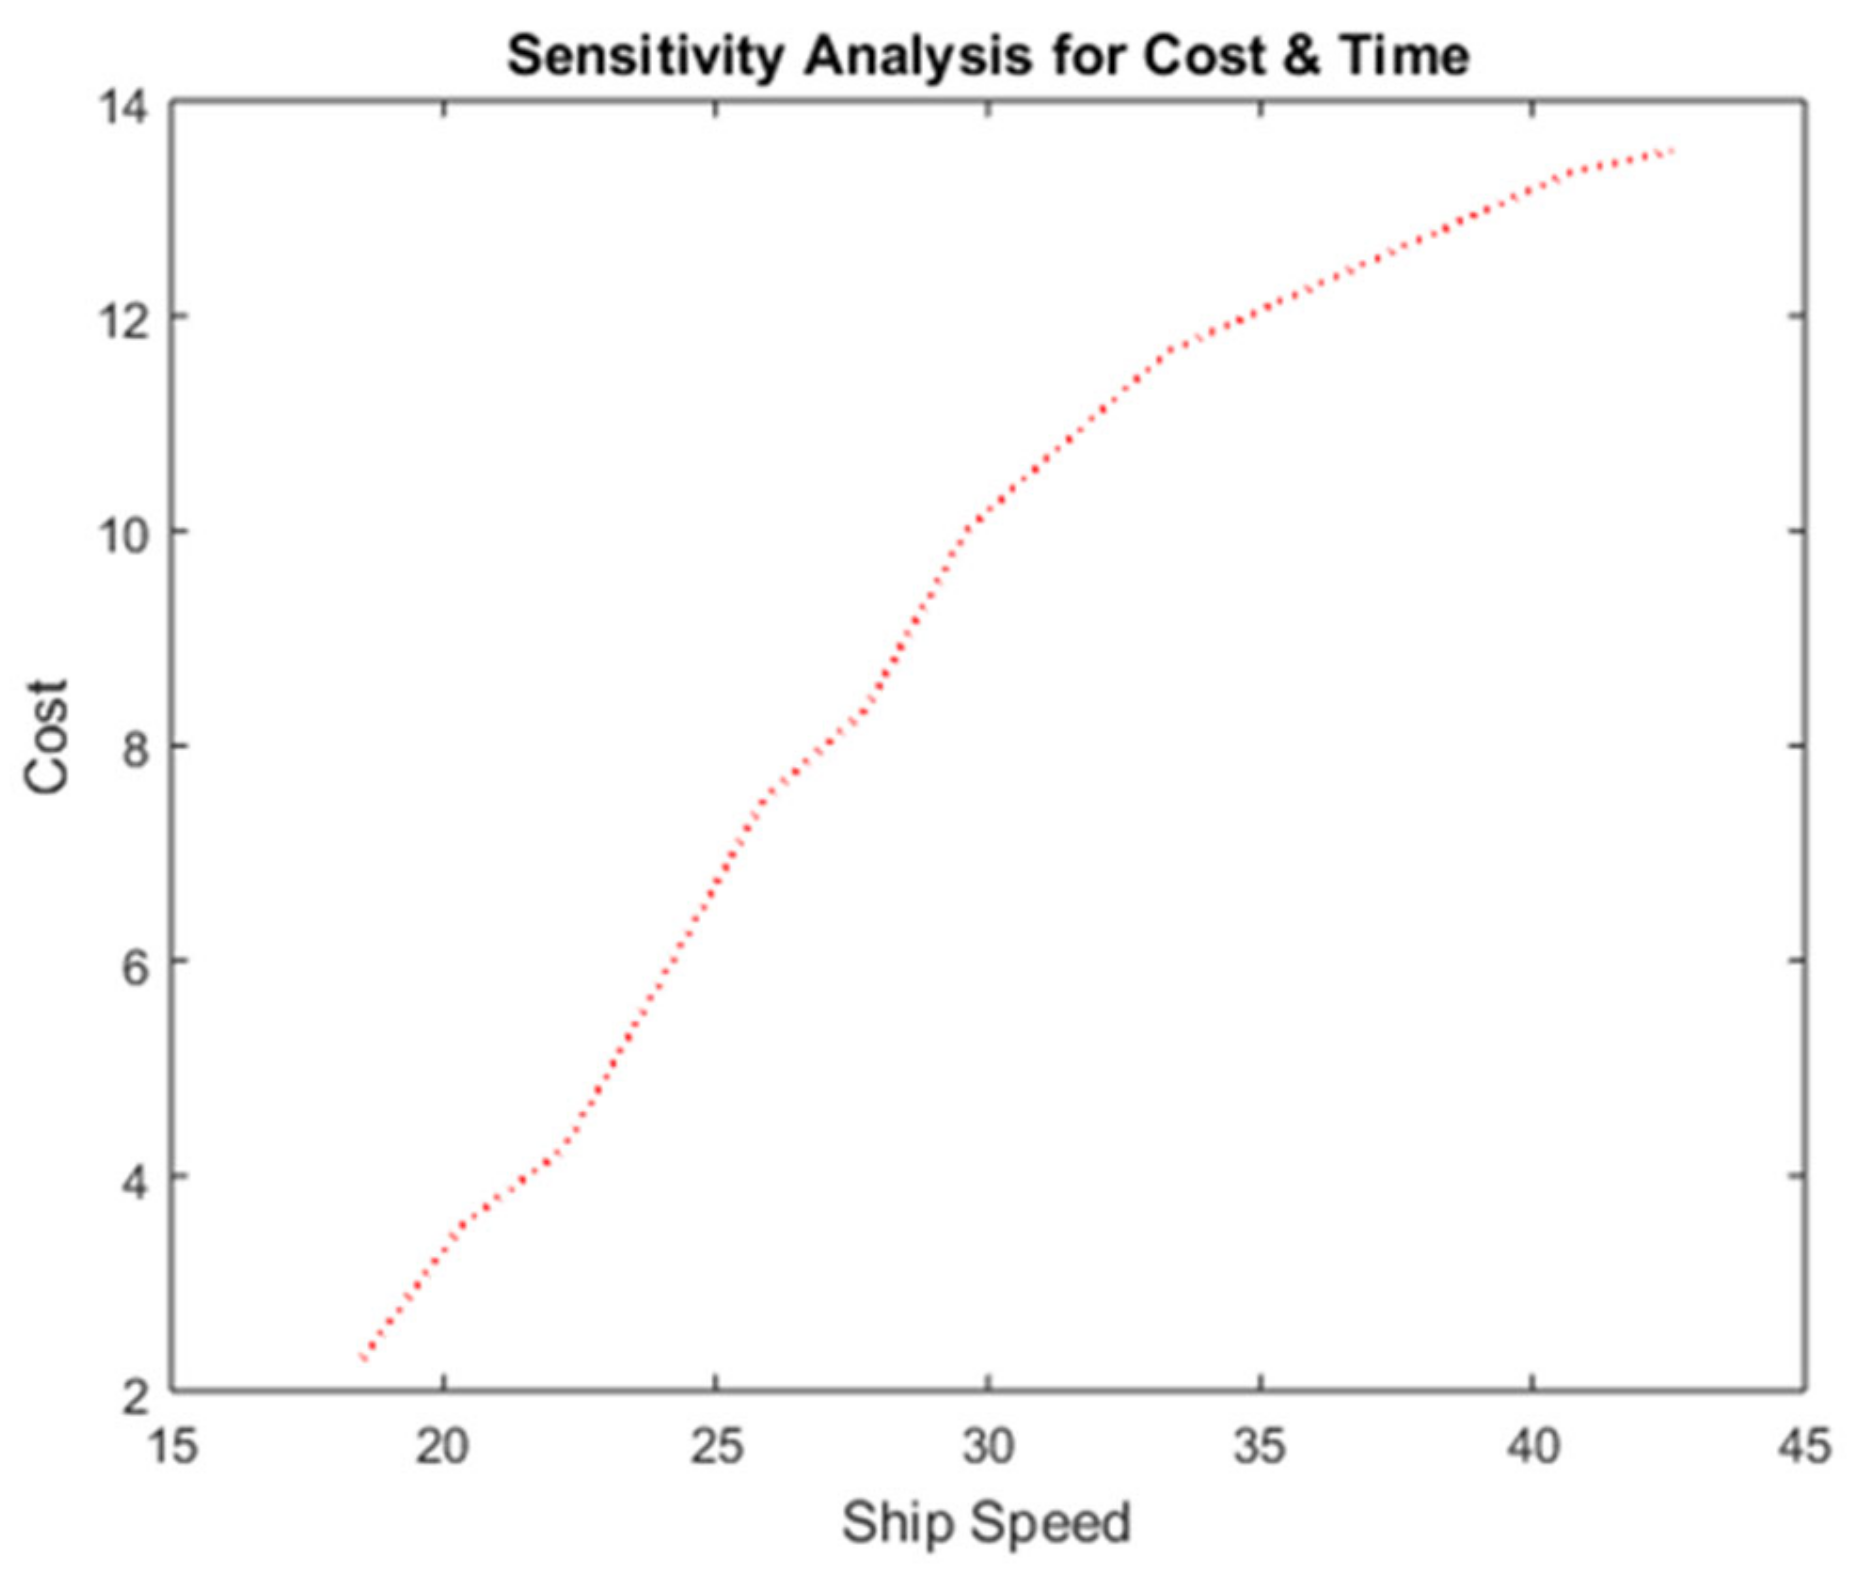
Another experiment was carried out to perform a sensitivity analysis of the effect of a change in the speed of a ship on the total cost. Figure 5 presents the results obtained from the experiment. As discussed, in contrast to trucks, cargo ships have a major influence on cost with the change in speed. This is also because the weather and the weight of a ship vary significantly on the route and influence the fuel consumption. The speed of the ship was varied from slow steaming at 10 knots (18 km/h) to a normal speed of 24 knots (45 km/h). The speed of the ship was observed to have a non-linear relation with the cost function, with a fourfold increase in costs.
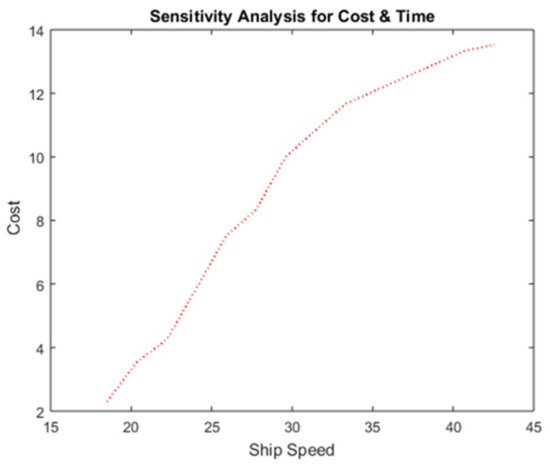
Figure 5.
Ship speed vs. fuel consumption.
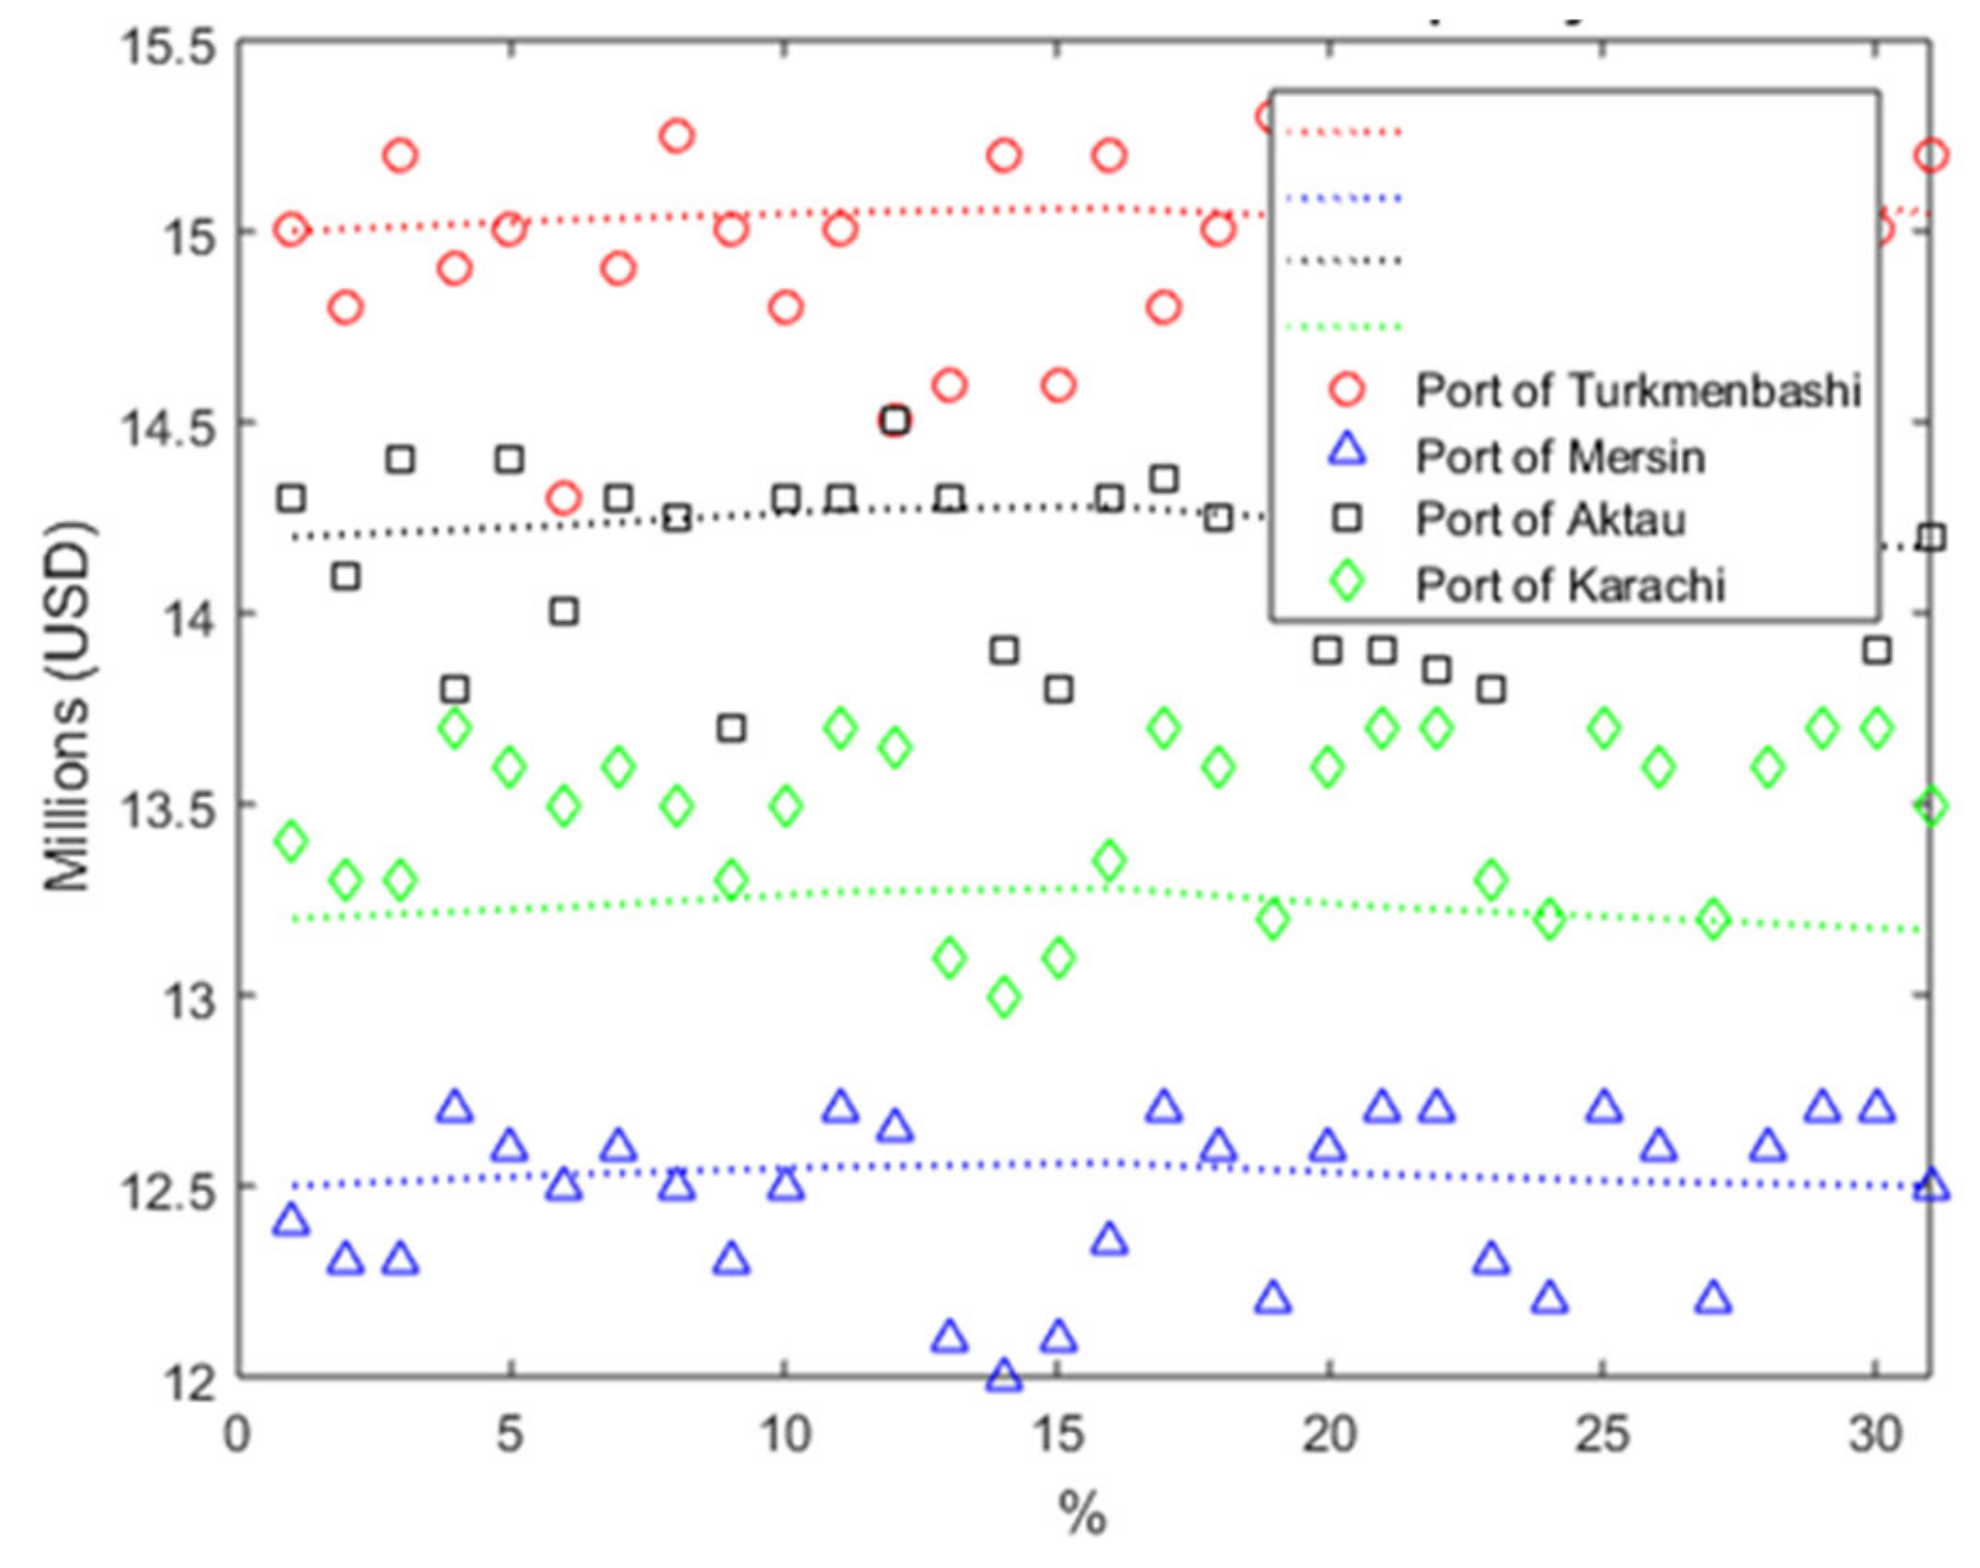
Figure 6 presents the results obtained from the experimental analysis conducted to investigate the impact of increased capacities of selected major ports on the cost function. The literature suggests that there is a significant impact of port capacity and performance on logistical costs [48]. The purpose was to perform a sensitivity analysis of the effects of possible increases or extensions in existing ports on the total costs, including inventory costs. The capacity of the selected ports was increased by up to 30 percent, and it was observed that the port of Karachi seemed to be affected the most by the increased capacity. However, it must be kept in mind that the increase in capacity of every port included in the analysis is not possible due to the geographical situation and the urban populations near the ports. However, the port of Gwadar, which is in partial operation after the developmental work on the CPEC, has major potential for capacity increase.

Figure 6.
Selected port capacity vs. cost.
5. Conclusions
The current study proposes a multi-integer bi-objective mathematical model in order to gain a deep understanding of the OBOR network and to investigate the potential of a synchromodal transportation network in a supply chain network that spreads across continents. The motivation for the adopted case study was its potential impact on efforts for creating a sustainable supply chain network that is robust and flexible. The traditional Silk Road through the Malacca Strait and the Suez Canal imposes limitations on trade between China and Europe. Moreover, this detailed network analysis provides alternatives for fulfilling demand in peak hours, thus providing a risk mitigation strategy. For a sustainable supply chain, intermodal transportation needs to be considered for various shipment sizes. In addition to the new Silk Road, the CPEC and other economic zones were included in the investigation. The suggested routes depict shorter distances and lower costs. However, customs clearance and transfer times cause a huge negative impact on the lead times. A suggested rail link between Pakistan and Turkey via Iran can reduce travel time to 9 days from China to Germany. Another major advantage in this proposition is that this route passes through the most densely populated countries of Asia, thus providing potential for creating economic zones and expanding markets for traders. The current investigation, however, is limited, as it does not consider the actual customs clearance times at each border, as they vary with the ease of doing business. For future work, consideration of carbon emissions should be included in the objective function. Moreover, the effect of the size of the cargo in TEUs should be analyzed in order to evaluate appropriate routes with various shipment sizes and real time data.
Author Contributions
Conceptualization, T.Z. and U.G.; methodology, M.R.B.; software, F.G.; validation, U.G. and T.Z.; formal analysis, T.Z.; investigation, F.G.; resources, M.R.B.; data curation, T.Z.; writing—original draft preparation, T.Z.; writing—review and editing, F.G. and U.G.; visualization, M.R.B.; funding acquisition, M.R.B. All authors have read and agreed to the published version of the manuscript.
Funding
This work was supported by the National Research Foundation (NRF) of Korea through the auspices of the Ministry of Science and ICT, Republic of Korea, under Grant NRF-2020R1G1A1012741.
Institutional Review Board Statement
Not applicable.
Informed Consent Statement
Not applicable.
Data Availability Statement
To support the findings of this study, the proposed models’ MATLAB codes are available from the corresponding authors upon reasonable request.
Conflicts of Interest
The authors declare no conflict of interest.
References
- Crainic, T.G. Service network design in freight transportation. Eur. J. Oper. Res. 2000, 122, 272–288. [Google Scholar] [CrossRef]
- Stepien, M.; Swiacik, S.; Skibinska, W.; Turek, I. Identification and measurement of logistics cost parameters in the company. In Proceedings of the 2nd International Conference: Green cities for Greener Cities, Transportation Research Procedia, Szczecin, Poland, 2–3 March 2016; pp. 490–497. [Google Scholar]
- Osińska, M. Na Logistyce Można Zarobić; Logistyka: Warsaw, Poland, 2013; Volume 2. [Google Scholar]
- Janstrup, K.H. Road Safety Annual Report 2017, Technical University of Denmark: Lyngby, Denmark. 2017. Available online: https://read.oecd-ilibrary.org/transport/road-safety-annual-report-2016_irtad-2016-en (accessed on 15 March 2021).
- Eurostat: Freight Transportation Stats 2017. Available online: https://ec.europa.eu/eurostat/statisticsexplained/index.php?title=Road_freight_transport_statistics&oldid=515835 (accessed on 15 March 2021).
- Beškovnik, B.; Golnar, M. Eliminating barriers for sustainable transport systems on maritime silk road and baltic-adriatic corridor under BRI. Sustainability 2020, 12, 7412. [Google Scholar] [CrossRef]
- Riessen, B.; Negenborn, R.E.; Dekker, R. Synchromodal transportation: Overview of current topics and research opportunities. In Proceedings of the International Conference on Computational Logistics, Delft, The Netherlands, 23–25 September 2015; pp. 386–397. [Google Scholar] [CrossRef]
- Russo, F.; Rindone, C.; Amodeo, L.; Lamari, D.; Placido, V.; Pratico, M. Freight transportation in European Logistics: A comparison of northern and southern range gateways. In Proceedings of the 13th International Industrial Simulation Conference, IISC, Valencia, Spain, 1–3 June 2015; pp. 55–62. [Google Scholar]
- Perboli, G.; Musso, S.; Rosano, M.; Tadei, R.; Godel, M. Synchro-modality and slow steaming: New business perspectives in freight transportation. Sustainability 2017, 9, 1843. [Google Scholar] [CrossRef] [Green Version]
- Hayuth, Y. Intermodality Concept and Practice: Structural Changes in the Ocean Freight Transport Industry, 1st ed.; Lloyd’s of London Press Limited: London, UK, 1987. [Google Scholar]
- Berg, R.; Langen, P.W. An exploratory analysis of the effects of modal split obligations in terminal concession contracts. Int. J. Shipp. Transp. Logist. 2014, 6, 571–592. [Google Scholar] [CrossRef]
- Langen, P.W.; Horst, M. Coordination in hinterland transport chains: A major challenge for the seaport community. Marit. Econ. Logist. 2008, 10, 108–129. [Google Scholar]
- Ishfaq, R.; Sox, C.R. Design of intermodal logistics networks with hub delays. Eur. J. Oper. Res. 2012, 220, 629–641. [Google Scholar] [CrossRef]
- Janic, M. Modelling the full costs of an intermodal land road freight transport network. Transp. Res. Part D Transp. Environ. 2007, 12, 33–44. [Google Scholar] [CrossRef]
- Sadegheih, A.; Drake, P.R.; Li, D.; Sribenjachot, S. Global supply chain management under the carbon emission trading program using mixed integer programming and genetic algorithm. Int. J. Eng. 2011, 24, 37–53. [Google Scholar]
- Crainic, T.G.; Laporte, G. Planning models for freight transportation. Eur. J. Oper. Res. 1997, 97, 409–438. [Google Scholar] [CrossRef]
- Veenstra, A.; Zuidwijk, R.; van Asperen, E. The extended gate concept for container terminals: Expanding the notion of dry ports. Marit. Econ. Logist. 2012, 14, 14–32. [Google Scholar] [CrossRef]
- Nikolic, I. Total time minimizing transportation problem. Yugosl. J. Oper. Res. 2007, 17, 125–133. [Google Scholar] [CrossRef]
- Lin, C.; Choy, K.L.; Ho, G.T.; Chung, S.H.; Lam, H.Y. Survey of green vehicle routing problem: Past and future trends. Expert Syst. Appl. 2014, 41, 1118–1138. [Google Scholar] [CrossRef]
- Chang, T.S. Best routes selection in international intermodal networks. Comput. Oper. Res. 2008, 35, 2877–2891. [Google Scholar] [CrossRef]
- Bektas, T.; Laporte, G. The pollution-routing problem. Transp. Res. Part B Methodol. 2011, 45, 1232–1250. [Google Scholar] [CrossRef]
- Croce, A.I.; Musolino, G.; Rindone, C.; Vitetta, A. Sustainable mobility and energy resources: A quantitative assessment of transport services with electrical vehicles. Renew. Sustain. Energy Rev. 2019, 113, 109236. [Google Scholar] [CrossRef]
- National Academy of Sciences. “Special Report 87 Highway Research Board” in Highway Capacity Manual, USA, National Research Council. 1965. Available online: https://onlinepubs.trb.org/Onlinepubs/sr/sr87.pdf (accessed on 25 October 2021).
- Notteboom, T.; Cariou, P. Slow steaming in container liner shipping: Is there any impact on fuel surcharge practices? Int. J. Logist. Manag. 2013, 24, 73–86. [Google Scholar] [CrossRef]
- Wang, S.; Meng, Q. Sailing speed optimization for container ships in a liner shipping network. Transp. Res. Part E: Logist. Transp. Rev. 2012, 48, 701–714. [Google Scholar] [CrossRef]
- De, A.; Choudhry, A.; Turkay, M.; Tiwari, M. Bunkering policies for a fuel management problem for linear shipping networks. Eur. J. Oper. Res. 2019, 289, 927–939. [Google Scholar] [CrossRef]
- Wikipedia. Available online: https://en.wikipedia.org/wiki/Double-stack_rail_transport (accessed on 1 May 2021).
- Wang, X.; Wang, Y.D.; Li, K.X.; Yuen, K.F. Transport Research under belt and road initiative: Current trends and future research agenda. Taylor Fr. Transpormetrica A Transp. Sci. 2020, 17, 357–379. [Google Scholar] [CrossRef]
- Menhas, R.; Mahmood, S.; Tanchangya, P.; Safdar, M.N.; Hussain, S. Sustainable development under belt and road initiative: A case study of China-Pakistan economic corridor’s socio-economic impact on Pakistan. Sustainability 2019, 11, 6143. [Google Scholar] [CrossRef] [Green Version]
- Statistical View of World Energy, 69th ed. 2020. Available online: https://www.bp.com/content/dam/bp/business-sites/en/global/corporate/pdfs/energy-economics/statistical-review/bp-stats-review-2020-full-report.pdf (accessed on 20 October 2021).
- Adnavem. Available online: https://www.adnavem.com/china-top-exporter-in-the-world (accessed on 10 April 2021).
- Yu, H.; Fang, Z.; Peng, G.; Feng, M. Revealing the linkage network dynamic structures of Chinese maritime ports through automatic information system data. Sustainability 2017, 9, 1913. [Google Scholar] [CrossRef] [Green Version]
- World Bank Group Report. Available online: https://data.worldbank.org/indicator/IC.CUS.DURS.EX?end=2020&start=2020&view=map (accessed on 15 January 2021).
- Li, Z.; Rossetti, M.D.; Nachtmann, H. “WebshipCost-An Intermodal Transportation Linkage Cost Assessment” Report University of Arkansas, USA. 2004. Available online: https://cpb-us-e1.wpmucdn.com/wordpressua.uark.edu/dist/7/795/files/2016/08/ierc2003c_li.pdf (accessed on 20 October 2021).
- Resat, G.; Turkay, M.M. Design and operation of intermodal transportation network in the Marmara region of Turkey. Transp. Res. Part E Logist. Transp. Rev. 2015, 83, 16–33. [Google Scholar] [CrossRef]
- Spiess, H.; Florian, M. Optimal strategies: A new assignment model for transit networks. Transp. Res. Part B Methodol. 1989, 23, 83–102. [Google Scholar] [CrossRef]
- Dowling, R.G.; Singh, R.; Cheng, W. Accuracy and performance of improved speed-flow curves. Transp. Res. Rec. 1998, 1646, 9–17. [Google Scholar] [CrossRef]
- Journal of Commerce. Available online: https://www.joc.com/rail-intermodal/international-rail/how-europes-rail-freight-can-connect-ports-hinterlands_20180226.html (accessed on 10 April 2021).
- Forbes. 2017. Available online: https://www.forbes.com/sites/wadeshepard/2017/02/20/khorgos-the-new-silk-roads-central-station-comes-to-life/?sh=879c5e2c22ee (accessed on 20 October 2021).
- Chrzanowski, I. An Introduction to Shipping Economics, 1st ed.; Fairplay Publications: London, UK, 1985. [Google Scholar]
- Yildiz, M. Layner Ulaştirma Sistemlerinde Optimum Filo Planlamasi Modeli. Ph.D. Thesis, Istanbul University, Istanbul, Turkey, 2008. [Google Scholar]
- Notteboom, T.; Cariou, P. Fuel surcharge practices of container shipping lines: Is it about cost recovery or revenue-making. In Proceedings of the 2009 International Association of Maritime Economists (IAME) Conference, Copenhagen, Denmark, 24–26 June 2009; pp. 24–26. [Google Scholar]
- Barras, C.B. Useful Design and Performance Formulae. In Ship Design and Performance for Masters and Mates, 1st ed.; Elsevier: Amsterdam, The Netherlands, 2004; pp. 228–234. [Google Scholar]
- Sheng, X.; Lee, L.H.; Chew, E.P. Dynamic determination of vessel speed and selection of bunkering ports for liner shipping under stochastic environment. OR Spectr. 2014, 36, 455–480. [Google Scholar] [CrossRef]
- Bialystocki, N.; Konovessis, D. On the estimation of ship fuel consumption and vessel’s speed. J. Ocean. Eng. Sci. 2016, 1, 157–166. [Google Scholar] [CrossRef] [Green Version]
- Mavrotas, G. Efficient implementation of the Ꜫ-constraint method in multi-objective mathematical programming problems. Appl. Math. Comput. 2009, 213, 455–465. [Google Scholar]
- Alam, K.; Li, X.; Baig, S. Impact of transport cost and travel time under China-Pakistan economic corridor (CPEC). J. Adv. Transp. 2019, 2, 1–16. [Google Scholar] [CrossRef] [Green Version]
- Russo, F.; Rindone, C. Structural factors for a third-generation port: Planning interventions for research and development in Gioia Tauro, Italy, Ten-T node. WIT Trans. Build Environ. 2021, 204, 67–78. [Google Scholar]
Publisher’s Note: MDPI stays neutral with regard to jurisdictional claims in published maps and institutional affiliations. |
© 2022 by the authors. Licensee MDPI, Basel, Switzerland. This article is an open access article distributed under the terms and conditions of the Creative Commons Attribution (CC BY) license (https://creativecommons.org/licenses/by/4.0/).