Abstract
Innovation is the first driving force for development, and green innovation efficiency (GIE) plays a very important role in regional sustainable development. Data from 31 provinces and cities in China from 2011 to 2020 were used to select the proportion of energy saving and environmental protection costs in GDP as the green financial value, and the proportion of industrial pollution control input in GDP as the environmental regulation index. Green innovation efficiency is measured from two aspects of input and output by DEA method, and carried out for 31 provinces and cities in three regions. Using the DEA-Malmquist index to measure regional green innovation efficiency, the results show that the green innovation efficiency in three regions basically presents an upward trend, but the upward trend of green innovation efficiency is different between the three regions. A Tobit regression model is constructed to explore the impact of green finance and environmental regulations on the green innovation efficiency in these three regions. Research indicates that environmental regulations, the proportion of output value of tertiary industry in GDP, industrial structure, and foreign direct investment have significant impacts on the green innovation efficiency in all regions. Green finance, industrial structure, and power consumption have a significant impact on the green innovation efficiency in eastern China. Industrial structure has a significant impact on green innovation efficiency in central China, while power consumption and industrial structure have a significant impact on green innovation efficiency in western China. Therefore, each region needs to improve the standard of environmental regulation innovation, and introduce and use foreign investment in a scientific and reasonable way so as to promote the improvement of industrial infrastructure.
1. Introduction
On 11 November 2021, the latest important meeting of the Sixth Plenary Session of the 19th Central Committee pointed out the coordinated promotion of the “four comprehensive” strategy. However, early rapid economic development around the world that ignored the environment and resource development has introduced a series of serious resource and environmental problems in many counties [1,2]. The energy structure of consumption dominated by coal has caused serious air pollution, water pollution, and other forms of pollution. More than 70% of the cities in China have been plagued by smog for a long time, and the ambient air quality is not up to standard. At an important meeting on finance and economics on 15 March 2021, General Secretary Xi once again pointed out that carbon peaking and carbon neutrality should be highly valued, demonstrating the strategy of adhering to low-carbon development [3,4,5]. As a development country, China actively responds to climate change and environmental protection. Innovation is the key to high-quality development. Therefore, regional green innovation has also become the focus of development [6,7]. Green innovation has received widespread attention in recent years and has become a mainstream concept in environmental management. Blättel-Mink [8] first put forward the concept of green innovation, emphasizing the ecological dimensions that enterprises take into account in production, operation, market development, and other related strategies. Scholars have discussed the green innovation influencing factors from different perspectives, such as the perspective of institutional environment; the perspective of resource capabilities; the perspective of organizational factors, enterprises, or industries; the urban perspective; the regional perspective; etc. [9,10,11,12,13,14,15,16,17].
Scholars have conducted in-depth analysis from different perspectives on green innovation efficiency (GIE), such as the measurement of green innovation performance [18,19], the characteristics of green innovation performance [20,21,22,23], environmental regulations [24,25,26,27,28,29], manufacturing [30,31,32,33], foreign direct investment [34,35,36,37,38,39,40], and so on [41,42,43]. As an effective means to promote the renewal of economic development modes and green development, green finance solves some problems in financing and transformation and upgrading urgently needed by the country to achieve high-quality economic development through green investment. Therefore, exploring the mechanisms and effects of GF on high-quality economic development will support us fundamentally in achieving high-quality development goals. With the opening of trade and the introduction of foreign investment, energy consumption is increasing, environmental pollution is increasingly serious, pollution control is arduous, and the environmental situation is becoming increasingly severe, prompting the government to continuously improve control standards. How do environmental regulations and green finance affect GIE in China? These issues need to be explored.
It can be seen that most scholars have studied regional or industrial green innovation and influencing factors of GIE. There are few studies that truly combine environmental regulations, green finance, and green innovation performance to study the collaboration of regional green innovation. Based on the existing studies, this paper discusses some interaction mechanisms of green finance, environmental regulations, and green innovation performance. The DEA-CCR model and Malmquist index model are used to analyze the green innovation performance in three regions in China. In order to improve the performance of green innovation and promote the balanced development of GIE in the three regions, the fixed effects panel model is used to empirically analyze the regional GIE.
The subsequent structure of this paper is as follows: Section 2 introduces the literature review. Section 3 proposes material and methods, including research processing and data sources, research methodology, model construction, and descriptive statistics. Section 4 details the results and discussion. Section 5 proposes conclusions and implications.
2. Literature Review
2.1. Related Studies of Green Innovation Efficiency Measurement
According to related studies, data envelopment analysis (DEA) is mostly used to measure green innovation performance. Huang et al. [44] used the super-efficient EBM model and the entropy method to calculate the GIE value of the manufacturing industry from 2008 to 2019. Yang [45] took 26 cities in China as the research subjects and used the DEA model to measure the GIE of each city from 2010 to 2017. Li et al. [46] separately measured the traditional and innovative green development efficiency and green total factor productivity in different regions of China (2001–2017) with the DEA-SBM model. Li et al. [47] took pollution-intensive industries as an example, incorporated energy input and environmental pollution into the accounting framework of industrial innovation efficiency, and constructed the SBM directional distance function and Luenberger index. In this paper, the author also conducted dynamic calculation of GIE from 2002 to 2015. Based on the following logarithm and output distance function, Xiao, et al. [48] measured the GIE in China (2001–2015) with the help of an improved stochastic frontier model (SFA). Gao et al. [49] measured the GIE of energy-intensive industries in the Beijing–Tianjin–Hebei region from 2006 to 2015 by using the unexpected Super-MinDS model. Liu [50] deeply analyzed the spatial distribution characteristics of the GIE of the regional innovation system and tested its convergence by using an efficiency evaluation method and ESDA method. Sun et al. [51] examined the energy efficiency performance of a sample of 71 developed and developing countries between 1990 and 2014. Regarding energy efficiency levels of the individual countries, the USA, Japan, Germany, and Australia lead the chart while Belize, Panama, Singapore, Malta, Sierra Leone, Iceland, Jamaica, Bahrain, and Ghana are the least energy efficient countries. This article intends to use the CCR index model and the Malmquist index model to analyze the GIE in the three major regions in China on the basis of previous studies.
2.2. Green Finance and GIE
Generally speaking, green finance is a financial innovation to solve environmental protection industry and project financing problems. It is essentially a credit rationing based on environmental constraints. Green finance can establish an incentive mechanism for green investment and financing and turn environmental pollution into environmentally friendly enterprises. Financing can promote the flow of capital from high-pollution industries to low-polluting industries, reducing the investment yield and capital availability of polluting industries, increasing the investment yield and capital availability of green industries, and strengthening financial support for environmental protection companies so as to pursue economic green development. Gao et al. [52] used the systematic GMM model to conduct empirical research and found that while green finance has a significant effect on polluting industries, it also has a significant role in promoting environmental protection industries. Li et al. [53] used the ISM model and comparative analysis to explore the mechanism of GF on the improvement of agricultural innovation performance. Li et al. [54] selected the green finance policy in 2017 as a quasi-natural experiment, explored whether green finance is significant for corporate green innovation influence and its mechanism of action by using the green patent quantities of China’s companies from 2012 to 2019. Liu et al. [55] proved that green finance development could curb the development of polluting industries by increasing production costs and promoting a green transformation.
2.3. Environmental Regulations and GIE
Neoclassical economic theory believes that implementing environmental regulations will increase the production costs of enterprises and affect enterprise research and development (R&D) investments, which would consequently affect the improvement of enterprise performance and production capacity. The well-known Porter hypothesis holds that environmental regulations will encourage relevant enterprises to carry out R&D. Enterprises have an incentive to innovate. Thereby, these innovations will enhance their competitiveness. At present, the existing research mainly believes that environmental regulations have offsetting effects, compensation effects, and uncertainties in relation to technological innovation. Haselip et al. [56] believes that it is more difficult for most companies in developing countries to directly promote technological innovation through strict environmental regulations. Most of them are purchasing advanced equipment or implementing technology transfer from developed countries. These actions will not promote technological innovation. Bai et al. [57] proposed that environmental regulations have a significant positive effect on dual-link research and development innovation activities. Li et al. [58,59] found that relationships among environmental regulations, circular economy performance, and other factors. Yuan et al. [60] and Wang et al. [61] respectively confirmed the relationship between environmental regulations and industrial structure. The former thinks that they are nonlinear relationship, while the latter thinks that they are linearly increasing relationship. Zhu et al. [62] found that the green transition of industry and the intensity of environmental regulations presents a ‘U’-shaped relationship. Environmental regulations can guide foreign investment toward cleaner industrial activity. In view of the fact that circular economics is also a green development method, Li et al. [63] considered that environmental regulations have a positive effect on the GIE, but Wang et al. [64] believed that environmental regulations have a negative effect on agricultural technology innovation in China. Kraus et al. [65] found that green innovation enhanced environmental performance in Malaysia.
2.4. Foreign Direct Investment and GIE
As we all know, innovation is the first driving force for economic development. Many countries, developing countries in particular, do not have strong innovation capacities and their economic well-being needs to be improved. This requires enterprises to strengthen green innovation in production and development, and green innovation in enterprises requires a lot of funds to support. The lack of capital accumulation capacity restricts the improvement of green innovation capabilities. As we all know, foreign direct investment (FDI) can provide a large amount of funding for China’s green innovation, which can solve the short-term problem of insufficient funding for green innovation. At the same time, enterprises not only need independent innovation in green innovation, but they also need to accelerate the pace of green innovation. FDI not only brings in capital, but it also brings advanced technology and management experience. Therefore, the technology spillover effect of foreign direct investment can be used to enhance the country’s capacity for green innovation and thereby improve the GIE. Ji et al. [66] thought that FDI had a significant threshold effect on technological innovation. The spillover effect of FDI on technological innovation has significant regional differences. Unreasonable environmental regulation intensity, low levels of economic development, and human capital are the main restricting factors of FDI and the positive technology spillover effect of environmental regulation in some regions of China. Liu et al. [67] and Huang et al. [68] proposed that FDI is more inclined to enter regions with strong environmental regulations through joint ventures and enter regions with weaker environmental regulations through wholly owned means. It hinders the improvement of the GIE in areas with strong environmental regulations, while the entry of sole proprietorship greatly improves the GIE in areas with weak environmental regulations. Therefore, while making up for China’s capital shortage, FDI also brings environmental pollution.
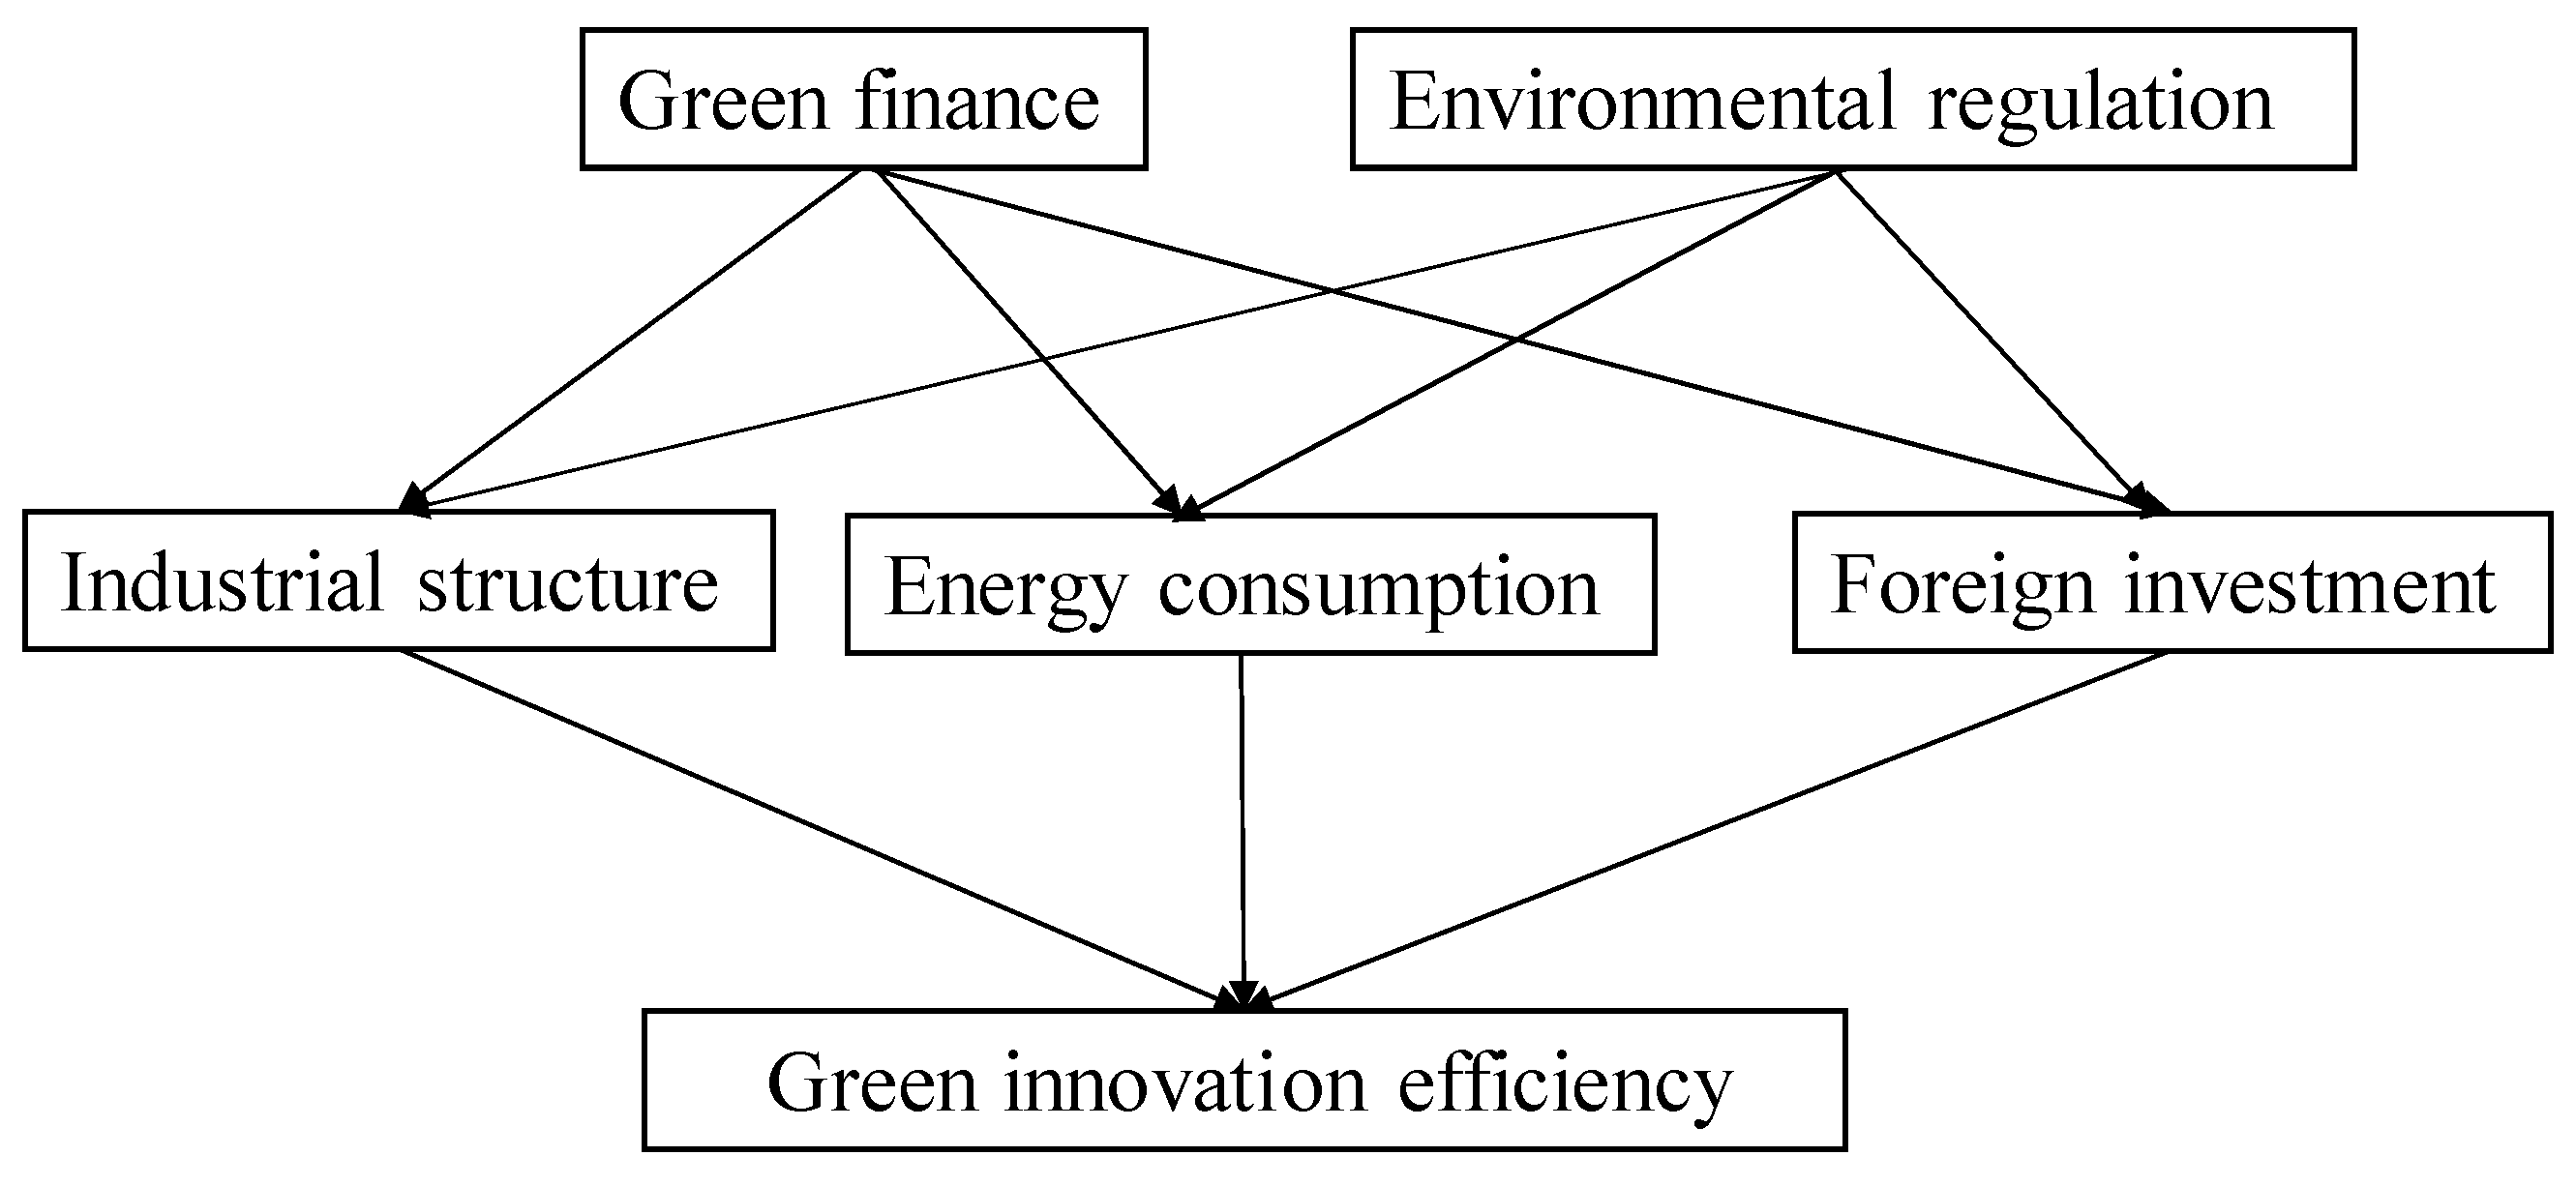
Therefore, this article needs to study the impact of green finance, environmental regulation, foreign direct investment, energy consumption, and industrial structure on the green innovation efficiency. Figure 1 shows the relationship between these variables.

Figure 1.
Impact of green finance, environmental regulations, and foreign direct investment on green innovation efficiency.
3. Material and Methods
3.1. Research Processing and Data Source
This paper focuses on the relationships between green finance, environmental regulations, and the green innovation efficiency in eastern, central, and western China. The DEA method was adopted to select input–output indicators to calculate GIE. Then, the TOBIT regression model was established to determine the impact of green finance, environmental regulations, FDI, industrial structure, and energy consumption on GIE. The data are from the 10-year datasets of each province from 2011 to 2020 in the China Statistical Yearbook. China has a total of 34 provincial-level administrative regions, including 23 provinces, 5 autonomous regions, 4 municipalities directly under the Central Government, and 2 special administrative regions. The 23 provinces are: Hebei Province, Shanxi Province, Liaoning Province, Jilin Province, Heilongjiang Province, Jiangsu Province, Zhejiang Province, Anhui Province, Fujian Province, Jiangxi Province, Shandong Province, Henan Province, Hubei Province, Hunan Province, Guangdong Province, Hainan Province, Sichuan Province, Guizhou Province, Yunnan Province, Shaanxi Province, Gansu Province, Qinghai Province, and Taiwan Province. The five autonomous regions are: Inner Mongolia Autonomous Region, Guangxi Zhuang Autonomous Region, Tibet Autonomous Region, Ningxia Hui Autonomous Region, and Xinjiang Uygur Autonomous Region. The four municipalities directly under the Central Government are: Beijing, Tianjin, Shanghai, and Chongqing. The two special administrative regions are: Hong Kong Special Administrative Region and Macau Special Administrative Region. There are no statistics for Hong Kong, Macau, and Taiwan in the China Statistical Yearbook. Therefore, the other 31 provinces were selected. Data, including the DEA method and TOBIT regression model, are introduced below.
3.2. Research Methodology
This paper mainly uses the CCR model and the Malmquist index model in DEA to measure green innovation efficiency.
3.2.1. Comprehensive Technical Efficiency (CCR)
The comprehensive technical efficiency (CCR) model is proposed under the assumptions of constant return to scale (CRS) and variable return to scale (VRS) [69]. The model is used to evaluate the overall efficiency of resource utilization of each decision-making unit. The scale efficiency here reflects the impact of industrial structure on output units through optimized allocation under certain input conditions.
Comprehensive technical efficiency (CCR) indicates the ability to obtain the maximum output from inputs under the fixed remuneration model or indicates the level of minimum input cost required for a fixed output. Suppose there are n decision-making units—denoted as —and they are comparable, each DMU has m types of input and s types of output. Use to represent the m-th input of ; Use represent the s-th output of , Then all the input can be expressed as . The goal is to have as little input as possible and as much output as possible.
Let the weight vector of the input index be , The weight vector of the output index is The efficiency evaluation index of can be expressed as
and represent the weight vector of input and output respectively. Selecting the appropriate weight for ur and vi can yield .
Construct the DEA model (CCR model) as follows:
The above planning model is a fractional model. Using let , the fractional planning problem is reduced to
If the result of the model is , the result of DEA is valid. Otherwise, it is invalid.
CCR is mainly measured by the decision-making unit on the basis of its existing scale level, whether the input elements have been used most effectively, that is whether the output results meet the frontier of effective production value. The range is between 0–1. The larger the value of comprehensive technical efficiency is, the more effectively the decision-making unit is affected.
3.2.2. Malmquist Total Factor Productivity Index Model
Now researchers generally use the DEA method based on Malmquist index constructed by Fare et al. [70,71]. The Malmquist total factor production model dynamically measures the change in total factor productivity from period t to period t + 1. When the index value of the model is greater than 1, it means the productivity growth from period t to period t + 1 is changed. When it is less than 1, it means that the total factor productivity of period t to period t + 1 is negative growth. The Malmquist index method uses the ratio of distance functions in different periods to express input–output efficiency, which is specifically measured by total factor productivity (TFP). The Malmquist index method can measure five indicators. In the time-period studied in this article from 2011 to 2020, when the total factor productivity change index (tfpch) is greater than 1, it means that TFP is on the rise; when it is less than 1, it means that TFP is on the decline.
Taking the technology in the period as a reference, the Malmquist index can be expressed as
In the same way, taking the technology in the t + 1 period as a reference, the Malmquist index can be expressed as
In order to avoid the difference caused by the arbitrariness of period selection, the Malmquist index is sued to measure the productivity change from period t to period t + 1
According to the above processing, the Malmquist index has good properties. It can be decomposed into an efficiency change index (effch) and technology efficiency change index (techch) under the assumption of constant return to scale. The decomposition process is
Among them, the efficiency change index (effch) can be further decomposed into pure efficiency change (pech) and scale efficiency change (sech). Then, the above formula is transformed into
3.3. Model Setting
Using the DEA-CCR model to calculate the GIE belongs to the stage data and is distributed between 0–1, so the Tobit regression method is used for simulation. In the regression model, the dependent variable is green innovation efficiency and the independent variables are the influencing factors. The efficiency value calculated by DEA will have at least one DMU falling on the efficiency boundary of DEA. Tobit regression using maximum likelihood estimation can avoid this situation. The basic form is
Based on the above analysis of the mechanism of the impact of green finance, a measurement model of the interaction is constructed between green finance, environmental regulations, industrial structure, electricity consumption, and foreign direct investment.
where Y represents green innovation efficiency or DEA-Malmquist index; GF represents the proportion of public expenditure on environmental protection in GDP, as a measure of green finance; and IPI represents the proportion of completed industrial pollution investment in GDP, as a measure of environmental regulations. TI represents the ratio of tertiary industry output value to GDP, EC represents the ratio of electricity consumption to GDP, FDI represents foreign direct investment, and ε represents the random error term.
3.4. Data Entry and Variable Determination
In the Tobit regression model, Y represents green innovation efficiency. Input and output indicators must be constructed. DEA is selected to calculate the efficiency. In this paper, full-time equivalent of research and development personnel, research and development internal expenditure, product development expenditure, and electricity consumption are taken as input indicators. Total wastewater discharge, total industrial waste gas discharge, total industrial solid waste discharge, new product sales revenue, and the number of effective invention patents are used as output indicators. Among these output indicators, the total discharge of wastewater, the total discharge of industrial waste gas, and the total discharge of industrial solid waste are the undesired output. Taking 2010 as a fixed period, the Malmquist index model with a fixed reference is used to calculate CCR index and the Malmquist total factor productivity index.
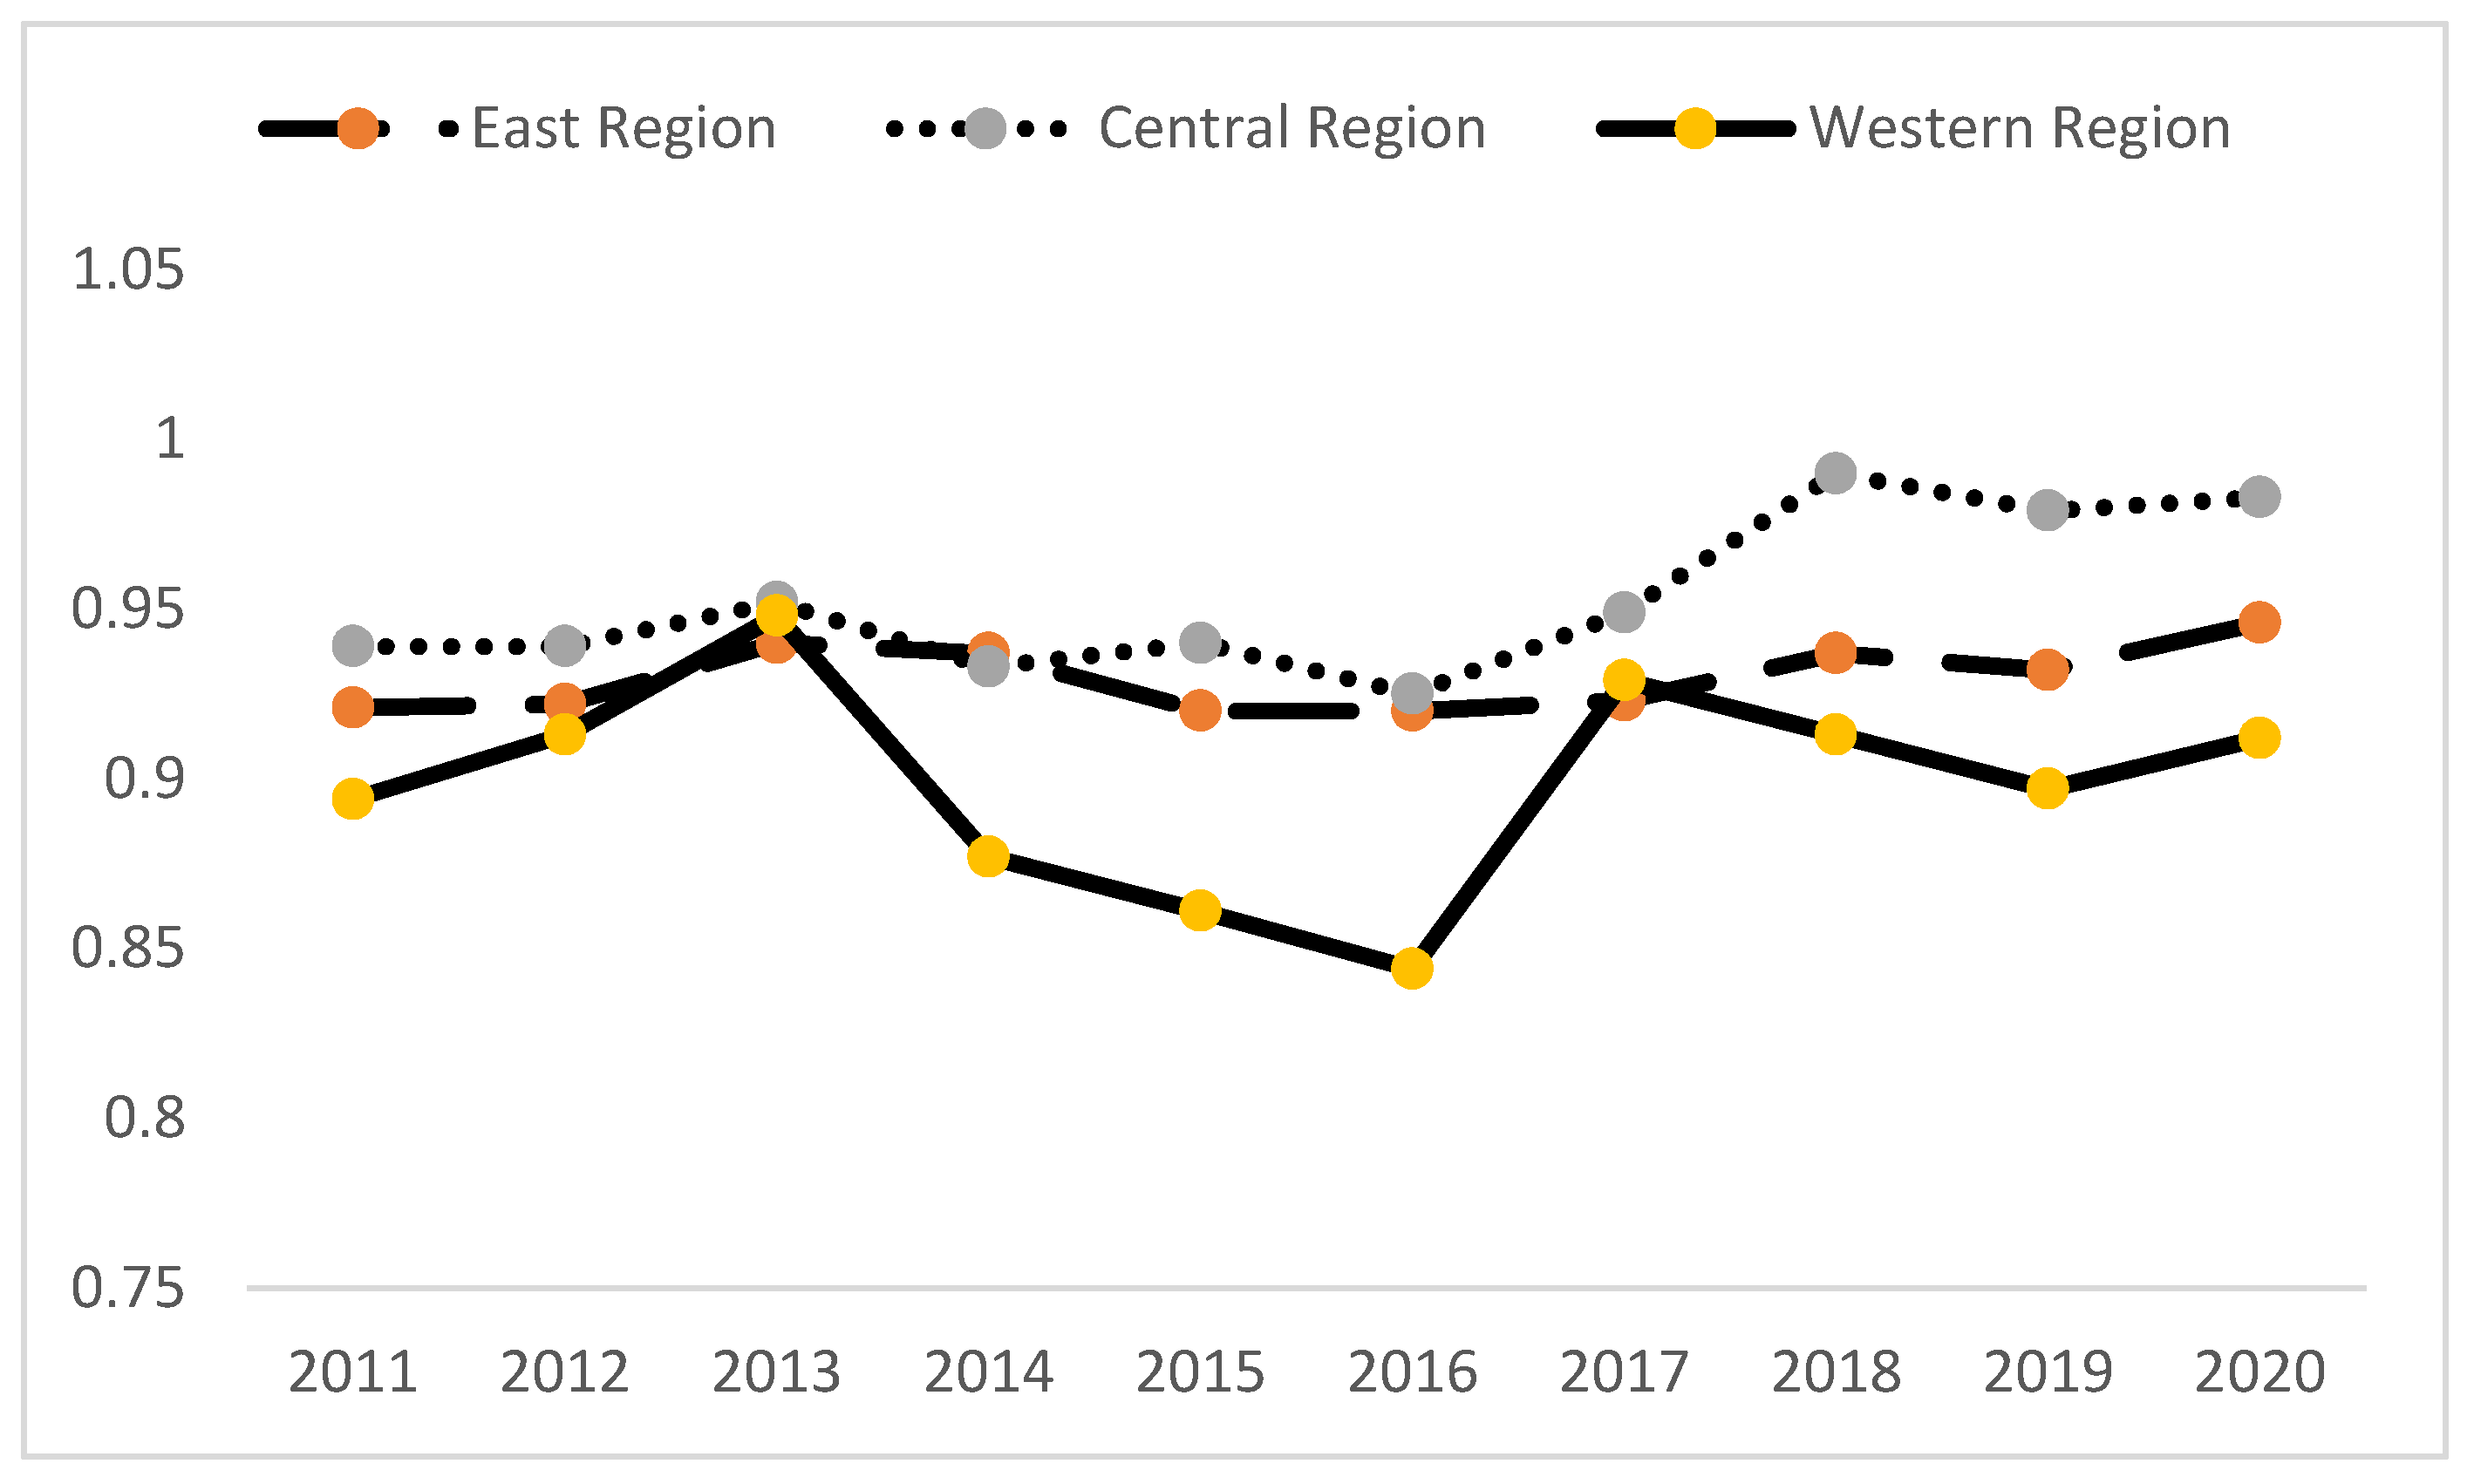
Figure 2 and Table 1 show the green innovation efficiency from 2011 to 2020 in China. The green innovation efficiency is expressed by calculating the comprehensive technical efficiency value of each unit, which mainly measures whether the input element indicators of the decision-making unit have achieved the most effective use based on its current scale level. That means whether or not the output results meet the effective production value frontier. The value range of comprehensive technical efficiency is between 0–1. The larger the value is, the more effective the decision-making unit is. If the comprehensive performance value is 1, it means that all regions of the country have reached the frontier of effective production value. This indicates that green innovation in all regions is at the forefront of production, thus indicating that resource inputs are being used rationally and effectively. Then a relatively optimal state has been achieved between cost input and output. However, if the comprehensive technical efficiency value is below 0.7, the investment capacity and utilization efficiency of these regions are relatively weak. From a vertical perspective, the green innovation efficiency in all regions in 2020 is basically on the rise compared to 2011. Among them, the central and eastern regions have changed relatively smoothly over the past 10 years, while the green innovation efficiency of the western region fluctuates more obviously. The green innovation efficiency of the western region rebounded after the decline in 2014–2016, from 0.948 in 2013 to 0.877 of 2014, then it rose to 0.929 in 2017 showing a ‘U’-shaped change trend. From a horizontal perspective, the green innovation efficiency of the three regions in the most recent order is that the central region is greater than the eastern region, and the eastern region is greater than the western region.
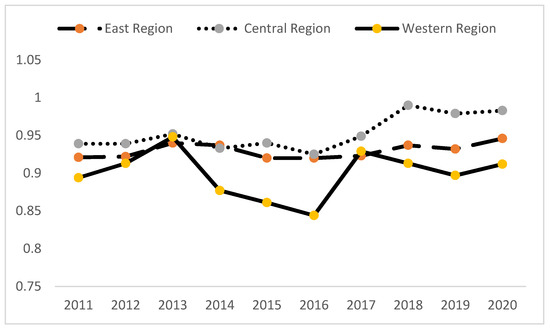
Figure 2.
Green innovation efficiency in China from 2011 to 2020.

Table 1.
GIE in China from 2011 to 2020.
Table 2 shows five indicators—tfpch, effch, techch, pech, and sech—for all provinces in China from 2011 to 2020. It can be seen that the green innovation efficiency value in the eastern region is the highest and greater than 1, indicating that the eastern region’s green innovation efficiency is higher than that of the other regions.
Table 2.
2011–2020 Malmquist Index of GIE in China’s three regions.
4. Results and Discussion
Using Eviews9.0 software to analyze the data including descriptive statistical analysis and regression analysis. The analysis results are as follows:
4.1. Descriptive Statistical Analysis
Table 3 lists the maximum, minimum, mean, standard deviation, and variance of these variables. These variables include GF, IPI, TI, EC, and FDI. There are variable interpretations in Table 3.
Table 3.
Descriptive statistics table of variables.
4.2. Tobit Regression Analysis
First, the Hausman test is performed on the data through Eviews 9.0. The output value of the statistic is 9.058, and the corresponding adjoint probability is 0.0367. The null hypothesis of mixed and random effects is rejected, and a fixed effects model is established. Secondly, using SPSS 22.0 software to test the multicollinearity of the panel data, the tolerance data and the variance expansion factor VIF indicated that the selected data does not demonstrate obvious multicollinearity. By using software of Eviews 9.0 with the left merging point being 0 and the right merging point being infinity, the Tobit regression model established above is analyzed, and the final Tobit regression results are shown in Table 4, Table 5, Table 6 and Table 7.
Table 4.
Tobit regression analysis results in China.
Table 5.
Regression analysis results of the Tobit model in the eastern region.
Table 6.
Regression analysis results of the Tobit model in the central region.
Table 7.
Regression analysis results of the Tobit model in the western region.
In Table 4, it can be seen from the regression results that IPI, TI, EC, and FDI have significant impacts on the green innovation efficiency of all regions. IPI passed the 10% significance test, TI and EC passed the 1% significance test, and FDI passed 5% significance test, but the effect of GF on the efficiency of green innovation is not significant. The effect of FDI is negative, and the other factors—IPI, TI, and EC—are all positive. These research conclusions are consistent with existing studies. The effect of GF on the green innovation efficiency is not significant. It may be that this article uses energy-saving and environmental protection expenditures to measure this variable and needs to be further revised.
It can be seen from the regression results in Table 5 that GF, TI, and EC have a significant impact on the green innovation efficiency in the eastern region. In the table, GF passed the 10% significance test, TI and EC passed the 1% significance test, but GF has a negative significance impact on green innovation efficiency while the others are positive.
From the regression results in Table 6, it can be seen that the impact of TI on the green innovation efficiency in the central region is significant, and the 1% significance test is passed. The impact of the other variables is not significant. Except for IPI, the impact of these variables on the efficiency of green innovation is positive.
From the regression results in Table 7, it can be seen that the impact of EC and TI on green innovation efficiency in western region is significant. TI passed the 1% significance test and EC passed the 5% significance test. The impact of the other variables is not significant. Except for IPI, all effects of these variables on green innovation efficiency are positive.
4.3. Discussion
Based on the data of 31 provinces in China from 2011 to 2020, green innovation efficiency is measured by the DEA-Malmquist index. The influence of green innovation efficiency is further analyzed. Results are as follows.
First, according to the green innovation efficiency of three regions in China from 2011–2020, the central and eastern regions demonstrate relatively stable change over the past 10 years, while the western region has a more obvious fluctuation of green innovation efficiency. The main reason for this phenomenon is asynchronous economic development. Economic development in east China occurred earlier, followed by central China, and western China is relatively underdeveloped. Therefore, in the process of improving the efficiency of green innovation, the western region is slower than the central and eastern regions. While the western region is still vigorously developing its economy, the central and eastern regions have realized that economic development cannot be at the expense of the environment, but to improve green innovation capabilities.
Secondly, according to the theoretical assumptions put forward in the Section 3, the influencing factors of green innovation efficiency (GIE) include: green finance (GF), tertiary industry (TI), environmental regulations (IPI), electricity consumption (EC), and foreign direct investment (FDI). The empirical research results show that IPI, TI, EC, and FDI have significant impacts on the green innovation efficiency of in different regions of China, GF has no significant impact on the green innovation efficiency. With the enhancement of environmental regulation, the production sector must quickly accomplish technical upgrades to achieve environmental compliance, which requires the production sector to enter the technology market to seek external technical support. Therefore, IPI has a significant impact on the GIE. Theoretically, FDI will promote the optimal allocation of market resources, thereby improving the GIE. On the contrary, the effect of Table 4 is significant. FDI is more inclined to enter the field with strict environmental regulation through joint ventures and the field with weak environmental regulations through sole proprietorship; FDI, through joint ventures, will hinder the improvement of green technology innovation efficiency in areas with stricter environmental regulations. FDI in China has a positive impact on the efficiency of green technology innovation in areas with weak environmental regulations [67]. The larger the TI ratio is, the lower the industry ratio is, which has a positive effect on energy conservation, emissions reductions, and green innovation. That is why TI has significant impacts on the GIE.
Thirdly, in the eastern region, the marketization process is the main way to promote the above effect. Due to the developed economy in the eastern region, the marketization process is deeper than that in other regions. Therefore, market forces play a decisive role in the resource allocation in the eastern region, so as to realize the agglomeration of R&D resources and profits. However, economic development of the western region lags behind that of the eastern region and its development is mainly realized through the process of urbanization, which has realized the agglomeration of regional innovation resources and the improvement of profitability. The central region, with its development level between the east and the west, has completed urbanization and enjoyed the development brought by urbanization. At the same time, due to a lag in market-oriented construction, the region does not have the ability to optimize the allocation of resources, so the technology spillover effect and innovation effect of GF are not obvious in the central region and the western region.
5. Conclusions and Implications
5.1. Conclusions
Using the panel data from 2011 to 2020 in China, the ratio of environmental protection expenditure to GDP is selected as the green financial value, and the ratio of industrial pollution prevention and control input in GDP is selected as the environmental regulation indicator. Among the related indicators, the GIE is measured by the DEA method. A Tobit regression model is constructed to explore the impact of green finance and environmental regulations on the GIE in each region. Research indicates that IPI, TI, EC, and FDI have significant impacts on the green innovation efficiency in all regions. GF, TI, and EC have significant influence on the GIE in the eastern region. TI has significant influence on GIE in the central region; EC and TI have significant influence on green innovation efficiency in the western region. Therefore, each region needs to improve their respective levels of environmental supervision, introduce and utilize foreign investment in a scientific and reasonable way, and promote the upgrading of industrial structure.
Green finance policy is a new approach to environmental governance. It presents significant financing penalties and investment restraints upon pollution investment. By suppressing polluting industries and encouraging clean industries via investment and financing to achieve environmental protection, it helps some regions break the old development model and promote industrial transformation.
The impact of environmental regulations on GIE varies from region to region, and the degree of impact is decreasing in these three regions. The eastern region is facing greater pressure for transformation and upgrading, and the supervision of environmental regulations is also strengthening, thereby promoting GIE. There is a stronger need to develop local economy and attract more investment, accept industrial transfer from the eastern coastal areas, and relax environmental regulations. Although technological progress is on the rise, there is still a certain gap compared with the eastern region. From another perspective, it is not advisable to allow the development of environmental pollution in order to develop the economy, because the economic development gap is a comprehensive issue, not just determined by environmental regulations.
Similarly, the influence of FDI on GIE decreases from east to west. From the regional structure of FDI inflows, coastal areas are the main areas attracting foreign investment. For example, by the end of 2021, there were 527,242 foreign direct investment enterprises in the eastern region, accounting for 83.00% of the total, and investment in the service sector accounted for more than 76.6%. The spillover effect and structure effect are more significant. Therefore, the influence of unbalanced development of regional influence on GIE is strengthened through FDI.
5.2. Policy Suggestions
According to the above empirical analysis, this paper intends to explore suggestions for improving the efficiency of regional green innovation through the following recommendations:
- (1)
- Strengthen Regional Environmental Protection Systems
All regions should strive to establish and improve their own environmental protection systems, and vigorously promote the prosperity of low-carbon and low-pollution industries.
While formulating strict environmental regulation policies, considering the different carrying capacities of enterprises in various regions and industries, we should formulate corresponding environmental regulation policies to stimulate the green innovation of enterprises and enhance their technological innovation capabilities. At the same time, combined with the green subsidy soft policy, enterprises will be provided with policy and innovation financial support to subsidize the losses caused by environmental regulations, thereby promoting enterprises to actively improve the level of technological innovation. For example, we can formulate preferential tax policies and directly grant green subsidies. In the form of direct green subsidies or tax incentives, we can indirectly provide financial support to innovative, resource-saving, and environmentally friendly enterprises to promote their R&D and innovation.
- (2)
- Improve the Level of Environmental Regulation
We will increase investment in pollution control, formulate reasonable environmental monitoring policies, and improve the level of environmental monitoring. The implementation of environmental regulation policies has a positive moderating effect on the relationship between FDI and regional green innovation efficiency. Therefore, government departments, as policy executors, should actively improve the formulation of relevant laws and regulations, as well as establish and improve environmental protection standards. We will increase investment in environmental pollution control and improve the level of environmental supervision. We will increase investment in pollution control, formulate reasonable environmental regulation policies, and improve the level of environmental regulation. The implementation of environmental regulation policies has a positive regulating effect on the relationship between FDI and regional green innovation efficiency. Therefore, government departments—as policy implementers—should actively improve the formulation of relevant laws and regulations, and establish and improve environmental protection standards. We will increase investment in environmental pollution control and improve the level of environmental supervision.
- (3)
- Improve Corporate Social Responsibility Awareness
No matter what kind of environmental regulation policy the government formulates, its goal is to alleviate the environmental problems caused by the operation of businesses. If we want to fundamentally solve the environmental pollution problem, we must start from the source, strengthen corporate social responsibility awareness, actively improve technologies, enhance production efficiency, strictly control each link of the production chain, carry out green innovation, and control the generation of pollutants. As the core element of production in today’s society, enterprises are in pursuit of interests. At the same time, we must make environmental protection our top priority, enhance our sense of social responsibility, and refrain from pursuing profits at the expense of the environment.
- (4)
- Improve the Utilization Efficiency of FDI
We should seize the development opportunity of the “Belt and Road” to improve the utilization efficiency of FDI, and promote the development of green economy in the region. We will formulate scientific and reasonable foreign investment policies, pay attention to the quality of foreign investment, and give full play to the technological spillover effect of foreign capital. In the process of green innovation in China, with the continuous expansion of the degree of opening to the outside world, it is unscientific to blindly pursue the inflow of FDI and ignore the improvement of the quality of FDI. While actively introducing FDI, we should introduce high-quality foreign investment projects such as green, clean, and economical production, and optimize the industrial structure of FDI so as to maximize the technological spillover effect of FDI, drive the improvement of the efficiency of regional green innovation in China, and promote the construction of ecological civilization and the green development of economy in China. For some provinces in the western region of our country, due to their own development conditions, the development level of green economy needs to be further improved compared with the eastern and central regions. The “Belt and Road” initiative is a major development opportunity for the development of China’s western region. The western region should improve the utilization efficiency of FDI under the guidance of policies in light of its own conditions, give full play to its own resource advantages, and speed up the regional development.
- (5)
- Improve the Development Level of Green Finance
Green finance plays an obvious role in promoting the ecologicalization of the industrial structure. Therefore, various regions can promote the ecologicalization of the industrial structure by improving the development level of green finance. To be specific: first, the innovation of green credit should be strengthened, introducing the green environmental protection concepts into the credit policy and actively developing new products—such as formulas, business process management, and product design—so as to provide intellectual property pledges, export tax rebate pledges, carbon emission rights pledges, etc. The second step is to vigorously promote green securities, green funds, and other businesses, setting up environmental and energy-saving assessments when reviewing companies’ listing applications, and moderately relaxing restrictions on issuance qualifications in the primary market for environmentally friendly and resource-saving projects. The third step is to strengthen the innovation of green financial derivatives and improve the green financial derivatives market and green intermediary service market. Due to the differences in the development level and industrial structure of green finance in different regions, the impact of green finance on the ecologicalization of the industrial structure will vary. Local governments can improve the green financial market, promote the circulation of factors and promote the ecological development of the industrial structure. To be specific: First, the regional green financial market will need to be coordinated and circulation channels of green funds between regions will need to be unblocked. Second, the governments of the central and western regions should increase their support for green finance, especially encouraging non-bank financial institutions to actively develop green finance businesses. Third, the central and western regions should improve the business environment and attract investment, strictly observing the environmental bottom line, and preventing the transfer of heavily polluting industries to the region.
- (6)
- Promote the Development of Green Finance in Different Regions
This study finds that the foundation of the financial industry and policy incentives are the keys to promoting green finance innovation. Due to the different foundations of financial industries across regions, the intensity of green finance policies should also be different. For the eastern region, we should give full play to the background advantages of the financial industry and actively rely on market forces to carry out innovations in green financial products and services. For the central and western regions, we should draw on the development experience of the eastern region to introduce more preferential and supportive policies and establish a more attractive green financial system [72]. In line with the current environmental regulations, we should give full play to the environmental effect of green finance. The lack of motivation to implement green finance in heavily polluted areas may lead to equity issues in environmental governance. To this end, green financial policies should be adapted to current environmental regulations and environmental governance should be promoted. On the one hand, the heavily polluted areas can moderately increase the green finance interest rate reduction, discount rate, and the ratio of loan discounts to enhance the degree of benefit; on the other hand, investment and financing restrictions and penalties will be imposed on violations of environmental standards. The environmental effects of green finance can be realized by squeezing the investment returns of polluting industries and increasing the income of green industries.
- (7)
- Establish a Regional Cooperation Mechanism to Enhance the Inclusiveness of Green Finance
There are significant differences in the development potential for green finance in different regions of China, which may lead to geographical exclusion [73]. The interest demands of cities should be coordinated, and a green financial cooperation mechanism should be established at a higher level. We will establish channels for green financial resources in advantageous cities—such as Beijing, Shanghai, Hong Kong, Guangzhou, and Shenzhen—to serve green projects across the country, and fill the gap in the green industry markets in the central and western regions, alleviating the financial pressure on environmental governance, and improving the inclusiveness of green finance.
This paper studies the measurement of GIE and influencing factors of GF, IPI, TI, EC, and FDI. There are two major contributions. A highlight of this paper is the establishment of an input–output index to measure GIE by DEA method, because a single variable cannot represent green innovation efficiency. The application of the multi-index data envelopment method is relatively scientific. Secondly, GIE in different regions of China is analyzed, which is more in-depth and targeted because different regions have different economic development models.
This paper also has some limitations. First of all, it is not scientific to measure GF by the proportion of public spending on environmental protection in GDP. Secondly, mediating and moderating effects of individual variables are not considered. Future work will move closer to these two aspects.
Author Contributions
Conceptualization, H.Z. and T.Z.; Methodology, T.Z.; Software, J.J.; Validation, W.Y.; Formal analysis, H.Z.; Investigation, T.Z.; Resources, H.Z.; Data curation, W.Y.; Writing—original draft preparation, H.Z.; Writing—review and editing, J.J.; Visualization, H.Z.; Supervision, H.Z.; Project administration, W.Y.; Funding acquisition, H.Z. All authors have read and agreed to the published version of the manuscript.
Funding
This work was supported in part by the Social Science Foundation of Jiangsu Province under grant 19TQB005. The funder is Haihua Zhou and the funding number is 19TQB005.
Data Availability Statement
The data used to support the findings of this study are available from the corresponding author upon request.
Conflicts of Interest
The authors declare no conflict of interest.
References
- Wang, R.; Tan, J. Exploring the coupling and forecasting of financial development, technological innovation, and economic growth. Technol. Forecast. Soc. Chang. 2021, 163, 120466. [Google Scholar] [CrossRef]
- Minelgaitė, A.; Liobikienė, G. Waste problem in European Union and its influence on waste management behaviours. Sci. Total Environ. 2019, 667, 86–93. [Google Scholar] [CrossRef] [PubMed]
- Geels, F.W.; Berkhout, F.; Van Vuuren, D.P. Bridging analytical approaches for low-carbon transitions. Nat. Clim. Chang. 2016, 6, 576–583. [Google Scholar] [CrossRef] [Green Version]
- Price, L.; Zhou, N.; Fridley, D. Development of a low-carbon indicator system for China. Habitat Int. 2013, 37, 4–21. [Google Scholar] [CrossRef] [Green Version]
- Yasmeen, H.; Tan, Q.; Zameer, H. Exploring the impact of technological innovation, environmental regulations and urbanization on ecological efficiency of China in the context of COP21. J. Environ. Manag. 2020, 274, 111210. [Google Scholar] [CrossRef] [PubMed]
- Chapple, K.; Kroll, C.; Lester, T.W. Innovation in the green economy: An extension of the regional innovation system model? Econ. Dev. Q. 2011, 25, 5–25. [Google Scholar] [CrossRef]
- Cooke, P. Transversality and transition: Green innovation and new regional path creation. Eur. Plan. Stud. 2012, 20, 817–834. [Google Scholar] [CrossRef]
- Blättel-Mink, B. Innovation towards sustainable economy-the integration of economy and ecology in companies. Sustain. Dev. 1998, 6, 49–58. [Google Scholar] [CrossRef]
- Borsatto, J.M.L.S.; Amui, L.B.L. Green innovation: Unfolding the relation with environmental regulations and competitiveness. Resour. Conserv. Recycl. 2019, 149, 445–454. [Google Scholar] [CrossRef]
- Hall, J.; Matos, S.; Bachor, V. From green technology development to green innovation: Inducing regulatory adoption of pathogen detection technology for sustainable forestry. Small Bus. Econ. 2019, 52, 877–889. [Google Scholar] [CrossRef] [Green Version]
- Roh, T.; Lee, K.; Yang, J.Y. How do intellectual property rights and government support drive a firm’s green innovation? The mediating role of open innovation. J. Clean. Prod. 2021, 317, 128422. [Google Scholar] [CrossRef]
- Albort-Morant, G.; Leal-Rodríguez, A.L.; De Marchi, V. Absorptive capacity and relationship learning mechanisms as complementary drivers of green innovation performance. J. Knowl. Manag. 2018, 22, 432–452. [Google Scholar] [CrossRef]
- Singh, S.K.; Del Giudice, M.; Chiappetta Jabbour, C.J. Stakeholder pressure, green innovation, and performance in small and medium-sized enterprises: The role of green dynamic capabilities. Bus. Strategy Environ. 2022, 31, 500–514. [Google Scholar] [CrossRef]
- Gupta, H.; Barua, M.K. A grey DEMATEL-based approach for modeling enablers of green innovation in manufacturing organizations. Environ. Sci. Pollut. Res. 2018, 25, 9556–9578. [Google Scholar] [CrossRef] [PubMed]
- Arfi, W.B.; Hikkerova, L.; Sahut, J.M. External knowledge sources, green innovation and performance. Technol. Forecast. Soc. Chang. 2018, 129, 210–220. [Google Scholar] [CrossRef]
- El-Kassar, A.N.; Singh, S.K. Green innovation and organizational performance: The influence of big data and the moderating role of management commitment and HR practices. Technol. Forecast. Soc. Chang. 2019, 144, 483–498. [Google Scholar] [CrossRef]
- Huong, P.T.; Cherian, J.; Hien, N.T. Environmental Management, Green Innovation, and Social–Open Innovation. J. Open Innov. Technol. Mark. Complex. 2021, 7, 89. [Google Scholar] [CrossRef]
- Seman, N.A.A.; Govindan, K.; Mardani, A. The mediating effect of green innovation on the relationship between green supply chain management and environmental performance. J. Clean. Prod. 2019, 229, 115–127. [Google Scholar] [CrossRef]
- García-Granero, E.M.; Piedra-Muñoz, L.; Galdeano-Gómez, E. Eco-innovation measurement: A review of firm performance indicators. J. Clean. Prod. 2018, 191, 304–317. [Google Scholar] [CrossRef]
- Iqbal, S.; Akhtar, S.; Anwar, F. Linking green innovation performance and green innovative human resource practices in SMEs; a moderation and mediation analysis using PLS-SEM. Curr. Psychol. 2021, 1, 1–18. [Google Scholar] [CrossRef]
- Nuryakin, N.; Maryati, T. Green product competitiveness and green product success. Why and how does mediating affect green innovation performance? Entrep. Sustain. Issues 2020, 7, 3061. [Google Scholar] [CrossRef]
- Sobaih, A.E.E.; Hasanein, A.; Elshaer, I. Influences of green human resources management on environmental performance in small lodging enterprises: The role of green innovation. Sustainability 2020, 12, 10371. [Google Scholar] [CrossRef]
- Rehman, S.U.; Kraus, S.; Shah, S.A. Analyzing the relationship between green innovation and environmental performance in large manufacturing firms. Technol. Forecast. Soc. Chang. 2021, 163, 120481. [Google Scholar] [CrossRef]
- Leal-Rodríguez, A.L.; Ariza-Montes, A.J.; Morales-Fernández, E. Green innovation, indeed a cornerstone in linking market requests and business performance. Evidence from the Spanish automotive components industry. Technol. Forecast. Soc. Chang. 2018, 129, 185–193. [Google Scholar] [CrossRef]
- Nathaniel, S.P.; Murshed, M.; Bassim, M. The nexus between economic growth, energy use, international trade and ecological footprints: The role of environmental regulations in N11 countries. Energy Ecol. Environ. 2021, 6, 496–512. [Google Scholar] [CrossRef]
- Elmagrhi, M.H.; Ntim, C.G.; Elamer, A.A. A study of environmental policies and regulations, governance structures, and environmental performance: The role of female directors. Bus. Strategy Environ. 2019, 28, 206–220. [Google Scholar] [CrossRef]
- Li, R.; Ramanathan, R. Exploring the relationships between different types of environmental regulations and environmental performance: Evidence from China. J. Clean. Prod. 2018, 196, 1329–1340. [Google Scholar] [CrossRef]
- Khan, Z.; Sisi, Z.; Siqun, Y. Environmental regulations an option: Asymmetry effect of environmental regulations on carbon emissions using non-linear ARDL. Energy Sources Part A Recovery Util. Environ. Eff. 2019, 41, 137–155. [Google Scholar] [CrossRef]
- Trevlopoulos, N.S.; Tsalis, T.A.; Evangelinos, K.I. The influence of environmental regulations on business innovation, intellectual capital, environmental and economic performance. Environ. Syst. Decis. 2021, 41, 163–178. [Google Scholar] [CrossRef]
- Essandoh, O.K.; Islam, M.; Kakinaka, M. Linking international trade and foreign direct investment to CO2 emissions: Any differences between developed and developing countries? Sci. Total Environ. 2020, 712, 136437. [Google Scholar] [CrossRef]
- Shahzad, M.; Qu, Y.; Javed, S.A. Relation of environment sustainability to CSR and green innovation: A case of Pakistani manufacturing industry. J. Clean. Prod. 2020, 253, 119938. [Google Scholar] [CrossRef]
- Dhrifi, A.; Jaziri, R.; Alnahdi, S. Does foreign direct investment and environmental degradation matter for poverty? Evidence from developing countries. Struct. Chang. Econ. Dyn. 2020, 52, 13–21. [Google Scholar] [CrossRef]
- Abbas, J.; Sağsan, M. Impact of knowledge management practices on green innovation and corporate sustainable development: A structural analysis. J. Clean. Prod. 2019, 229, 611–620. [Google Scholar] [CrossRef]
- Opoku, E.E.O.; Boachie, M.K. The environmental impact of industrialization and foreign direct investment. Energy Policy 2020, 137, 111178. [Google Scholar] [CrossRef]
- Solarin, S.A.; Al-Mulali, U. Influence of foreign direct investment on indicators of environmental degradation. Environ. Sci. Pollut. Res. 2018, 25, 24845–24859. [Google Scholar] [CrossRef]
- Paul, J.; Feliciano-Cestero, M.M. Five decades of research on foreign direct investment by MNEs: An overview and research agenda. J. Bus. Res. 2021, 124, 800–812. [Google Scholar] [CrossRef]
- Zafar, M.W.; Zaidi, S.A.H.; Khan, N.R. The impact of natural resources, human capital, and foreign direct investment on the ecological footprint: The case of the United States. Resour. Policy 2019, 63, 101428. [Google Scholar] [CrossRef]
- Contractor, F.J.; Dangol, R.; Nuruzzaman, N. How do country regulations and business environment impact foreign direct investment (FDI) inflows? Int. Bus. Rev. 2020, 29, 101640. [Google Scholar] [CrossRef]
- Khan, M.A.; Ozturk, I. Examining foreign direct investment and environmental pollution linkage in Asia. Environ. Sci. Pollut. Res. 2020, 27, 7244–7255. [Google Scholar] [CrossRef]
- Asongu, S.A.; Odhiambo, N.M. Foreign direct investment, information technology and economic growth dynamics in Sub-Saharan Africa. Telecommun. Policy 2020, 44, 101838. [Google Scholar] [CrossRef]
- Islam, M.A.; Khan, M.A.; Popp, J. Financial development and foreign direct investment-The moderating role of quality institutions. Sustainability 2020, 12, 3556. [Google Scholar] [CrossRef]
- Dinh, T.T.H.; Vo, D.H.; Nguyen, T.C. Foreign direct investment and economic growth in the short run and long run: Empirical evidence from developing countries. J. Risk Financ. Manag. 2019, 12, 176. [Google Scholar] [CrossRef] [Green Version]
- Aust, V.; Morais, A.I.; Pinto, I. How does foreign direct investment contribute to Sustainable Development Goals? Evidence from African countries. J. Clean. Prod. 2020, 245, 118823. [Google Scholar] [CrossRef]
- Huang, W.H.; Wang, M.D. The measurement of green technology innovation efficiency in the manufacturing industry in the Yangtze River Economic Belt. Stat. Decis. 2021, 37, 61–63. [Google Scholar]
- Yang, J. The measurement of green innovation efficiency of cities in the Yangtze River Delta and analysis of influencing factors. Econ. Res. Guide 2020, 25, 63–65. [Google Scholar]
- Li, X.S.; Zeng, Y.H. Measurement of China’s regional innovative green development efficiency and its influencing factors. Sci. Technol. Prog. Policy 2020, 37, 33–42. [Google Scholar]
- Li, L.; Xia, X.H. Research on the efficiency and influencing factors of green innovation in pollution-intensive industries. Res. Soc. Chin. Charact. 2018, 1, 83–88. [Google Scholar]
- Xiao, L.M.; Gao, J.F.; Han, B. Spatial spillover effects of China’s inter-provincial green innovation efficiency: A test of homogeneity and heterogeneity. J. Ind. Technol. Econ. 2018, 37, 30–38. [Google Scholar]
- Gao, G.K.; Wang, Y.Q. Green Innovation Efficiency and Its Influencing Factors of Energy-intensive Industry in Beijing-Tianjin-Hebei Metropolitan region—Empirical research Based on Spatial Perspective. J. Ind. Technol. Econ. 2018, 37, 137–144. [Google Scholar]
- Liu, M.G. Research on the spatial distribution and convergence of green innovation efficiency of regional innovation systems. J. Ind. Technol. Econ. 2017, 36, 10–18. [Google Scholar]
- Sun, H.; Edziah, B.K.; Sun, C. Institutional quality, green innovation and energy efficiency. Energy Policy 2019, 135, 111002. [Google Scholar] [CrossRef]
- Gao, J.J.; Zhang, W.W. Research on the Impact of Green Finance on the Ecologicalization of China’s Industrial Structure—Empirical Test Based on System GMM Model. Econ. Rev. J. 2021, 2, 105–115. [Google Scholar]
- Li, Y.T.; Wang, Q. Research on the improvement mechanism of agricultural innovation efficiency by green finance. Rural Pract. Technol. 2021, 8, 37–38. [Google Scholar]
- Li, R.; Liu, L. Green Finance and Enterprise Green Innovation. J. Wuhan Univ. (Philos. Soc. Sci. Ed.) 2021, 74, 126–140. [Google Scholar]
- Liu, X.; He, P. Research on the impact of green finance in the economic development of the central region. J. Ind. Technol. Econ. 2019, 38, 76–84. [Google Scholar]
- Haselip, J.; Nygaard, I.; Hansen, U.; Ackom, E. Diffusion of Renewable Energy Technologies: Case Studies of Enabling Frameworks in Developing Countries, 1st ed.; UNEP Risø Centre: Roskilde, Denmark, 2011; pp. 1–158. [Google Scholar]
- Bai, J.; Han, X.F.; Song, W.F. FDI Spillover Effects, Environmental Regulations and Two-Link R&D Innovation: Based on the Empirical Research of Industrial Sub-industry. Sci. Sci. Manag. Sci. Technol. 2013, 34, 56–66. [Google Scholar]
- Li, B.; Cao, W.L. Research on the Impact of Environmental Regulation on my country’s Circular Economy Performance: Based on the Perspective of Ecological Innovation. China Soft Sci. 2017, 6, 140–154. [Google Scholar]
- Li, B.; Peng, X.; Chen, Z.H. Environmental Regulation, FDI and China’s Pollution Control Technology Innovation: Based on the Analysis of Inter-provincial Dynamic Panel Data. J. Financ. Econ. 2011, 37, 92–102. [Google Scholar]
- Yuan, Y.J.; Xie, R.H. FDI, environmental regulations and China’s industrial green total factor productivity growth: An empirical study based on Luenberger index. J. Int. Trade 2015, 8, 84–93. [Google Scholar]
- Wang, S.Y.; Wei, X.P.; Zhao, L.Y. Foreign direct investment, environmental regulation and advanced industrial structure. J. Cap. Univ. Econ. Bus. 2016, 18, 26–32. [Google Scholar]
- Zhu, D.B.; Ren, L. Environmental Regulation, Foreign Direct Investment and China’s Industrial Green Transformation. J. Int. Trade 2017, 11, 70–81. [Google Scholar]
- Li, W.H.; Cao, W.L. FDI, environmental regulation and regional green innovation efficiency. Stat. Decis. 2020, 36, 118–122. [Google Scholar]
- Wang, X.Y. The Impact of Environmental Regulations and FDI on Agricultural Technology Innovation. Master’s Thesis, Shandong Normal University, Jinan, China, 2021. [Google Scholar]
- Kraus, S.; Rehman, S.U.; García, F.J.S. Corporate social responsibility and environmental performance: The mediating role of environmental strategy and green innovation. Technol. Forecast. Soc. Chang. 2020, 160, 120262. [Google Scholar] [CrossRef]
- Ji, X.H.; Wei, C. The impact of FDI and environmental regulations on technological innovation: Based on the analysis of China’s inter-provincial panel data. Sci. Technol. Manag. Res. 2017, 37, 35–41. [Google Scholar]
- Liu, B.B.; Huang, J.Y. Research on the Impact of FDI Entry Mode on Regional Green Technology Innovation Efficiency: Based on the Perspective of the Difference in Environmental Regulation Intensity. Contemp. Financ. Econ. 2017, 4, 89–98. [Google Scholar]
- Huang, X.Y.; Liu, B.B. The choice of FDI methods and its impact on China’s green technology innovation: An empirical analysis based on extractive industry data. Macroeconomics 2020, 7, 114–123. [Google Scholar]
- Charnes, A.; Cooper, W.W.; Rhodes, E. Measuring the efficiency of decision making units. Eur. J. Oper. Res. 1978, 2, 429–444. [Google Scholar] [CrossRef]
- Fare, R.; Grosskopf, S.; Norris, M.; Zhang, Z.Y. Productivity growth, technical progress, and efficiency change in industrialized countries. Am. Econ. Rev. 1994, 84, 66–83. [Google Scholar]
- Malmquist, S. Index numbers and indifference surfaces. Trab. Estad. 1953, 4, 209–242. [Google Scholar] [CrossRef]
- Wang, R.; Wang, Q.Z.; Yao, S.L. Evaluation and difference analysis of regional energy efficiency in China under the carbon neutrality targets: Insights from DEA and Theil models. J. Environ. Manag. 2021, 293, 112958. [Google Scholar] [CrossRef] [PubMed]
- Zhang, W.; Li, G.X.; Uddin, M.K.; Guo, S. Environmental regulation, foreign investment behavior, and carbon emissions for 30 provinces in China. J. Clean. Prod. 2020, 248, 119208. [Google Scholar] [CrossRef]
Publisher’s Note: MDPI stays neutral with regard to jurisdictional claims in published maps and institutional affiliations. |
© 2022 by the authors. Licensee MDPI, Basel, Switzerland. This article is an open access article distributed under the terms and conditions of the Creative Commons Attribution (CC BY) license (https://creativecommons.org/licenses/by/4.0/).