Abstract
Salt stress in soils impacts grain crop yield. Soil amendment with biochar and arbuscular mycorrhizal alone has been analyzed to improve the growth of several crops under salinity stress. However, the combined application of biochar and arbuscular mycorrhizal fungi for the remediation of salinity and improvement of crop productivity in wheat are rarely discussed and have remained unclear. Therefore, this experiment was performed to investigate the effect with biochar (150 g biochar per each treated pot containing 3 kg soil) and/or arbuscular mycorrhizal fungi (20 g AMF inoculum containing 80% mycorrhizal roots, 100–160 spores, and extraradical hyphae per each treated pot) on the productivity of wheat (Triticum aestivum L.) under four salt stress gradients; 0, 50, 100, and 150 mM NaCl. The results show salinity significantly reduced plant height (9.9% to 22.9%), shoot fresh weight (35.6% to 64.4%), enzymatic activities (34.1% to 39.3%), and photosynthetic pigments—i.e., total chlorophyll contents (75.0%) and carotenoids contents (56.2%) of plants—as compared with control. Under exclusive biochar application, the plants were moderately tolerant to salinity stress, which was evident in their growth, moderately reduced fatty acid content, partially impaired enzymatic activity, and photosynthetic pigments, while under the exclusive AMF application, the wheat plants were relatively sensitive to salinity stress, resulting in impaired growth rate, decreased unsaturated fatty acid composition, enzymatic activity, and photosynthetic pigments. Conversely, under the co-application of biochar and AMF, wheat plants partially increased plant height (14.1%), shoot fresh biomass (75.7%), root fresh biomass (24.9%), partially increased enzymatic activity (49.5%), and unimpaired photosynthetic pigments (30.2% to 54.8%) of wheat under salinity stress. Current findings concluded that exclusive incorporation of biochar, and the synergistic application of AMF and biochar, could be utilized as a promising way to reduce the deleterious effects of salinity stress in wheat production.
1. Introduction
Wheat is widely grown in the tropics and sub-tropics and is the third-highest cultivated cereal after rice and maize [1,2]. Similar to all grains, wheat is enriched with proteins and carbohydrates, which are classified as chief sources of energy in the human diet [3]. Wheat contains the highest concentration of protein as compared with any cereal grain, as well as lipids, minerals, vitamins, fiber, and other bioactive substances that are employed as medication [4]. Moreover, it is also enriched with total antioxidant content and plays a significant contribution in maintaining the health of consumers [5]. Industrially, wheat grain is processed into starch, paste, alcohol, oil, gluten, ethanol, and biofuels [6].
In coastal regions, higher salinity stress is a significant restriction for sustainable crop production, including cereals like wheat [7]. The negative influence of salinity on plant physiology, growth, and productivity has prompted research attention on mitigation strategies to counter its long-term effect on grain production [8]. Grain crop tolerance to salt stress is a complicated biological process influenced by various genetic and physiological characteristics, as evidenced by the effect of salinity and the level of sensitivity exhibited by grain crops [9]. Furthermore, the severity of salt stress damage to crops is documented to be dependent on salt toxicity levels as well as growing conditions [10].
Under extreme salt stress, cell membranes can sense osmotic pressure and initiate a protective response by altering the stress rigidity and perception of the cell structure [11]. The content of fatty acids is required for the maintenance of membrane lipids as an energy reserve [12]. The composition of fatty acid concentration and lipids of plants has a significant impact on membrane stability, function, and fluidity. Unsaturated fatty acids have a critical role in cell membrane protection and membrane protein activity [13]. On the other hand, one of the defensive mechanisms against abiotic stress in grain production is the antioxidative enzyme system [14]. Antioxidants have the functionality to significantly reduce the harmful impacts of abiotic stresses [15]. Superoxide dismutase (SOD) is located in a variety of cell compartments, and it catalyzes the disproportion of two oxygen (O2) radicals to hydrogen peroxide (H2O2) and O−. Additionally, H2O2 is eliminated by various antioxidants enzymes, such as peroxidase (POD), which converts H2O2 to water [16].
Even though grain crops have established numerous defensive mechanisms to eradicate or reduce stress-induced deterioration at different levels, arbuscular mycorrhizal fungi (AMF) and biochar utilization are recognized as two of the most efficient soil amendment materials for alleviating the impact of abiotic stress on grain crops [17].
AMF is a rhizosphere microflora component that can be utilized as an amendment to boost nutrient uptake and crop development in salt-stressed situations [18]. Similarly, the use of biochar, a carbon-rich substance produced by the combustion of biomass with no or low oxygen supply, can alleviate the damaging impacts of salinity stress on grain crops [19]. Under salt stress, biochar decreases sodium ion (Na+) uptake, while potassium ion (K+) uptake by plants is increased. Biochar application reduces oxidative stress in grain crops by modifying the antioxidant enzyme activities [20]. Previous studies indicate that crops under biochar and AMF amendments develop sophisticated mechanisms for minimizing stress damage or re-establishing growth by modifying the fatty acids content and the activities of antioxidant enzymes [21]. Nevertheless, research on the impact of using AMF and biochar together on salt stress in wheat production is sparse. Therefore, the study’s objectives were to examine the impact of salt stress on key growth parameters, antioxidant enzyme activities, fatty acids content, and photosynthetic pigments of wheat and to assess the probability of co-application of AMF and biochar to alleviate the detrimental impacts of salinity stress on wheat production. The study assumed that the integrated application of AMF inoculation and biochar synergistically impact nutrients uptake, antioxidant activity, and plant growth in wheat by reducing Na uptake in plants cultivated in saline soil.
2. Materials and Methods
2.1. Experimental Site
For this study, a pot experiment was conducted under greenhouse conditions (relative humidity 50%; air temperature 30 °C) from April to July 2020 at the Dingxi experimental station (Tangjiao Town, Dingxi city, 35°350′ N, 104°360′ E, 1970 m a.s.l), Gansu, China.
The average yearly rainfall of the study site was 415 mm, and the temperature was nearly 32 °C. Pots having dimension (diameter 21 cm, height 16 cm) were used in the experiment and were obtained from the local market of Anning District, Lanzhou, China. Each pot was filled with 3 kg of sterilized soil.
The soil type in the research area is loess-like loam. The analysis in 20 cm topsoil indicated that total organic carbon (TOC) content was 9.08 g kg−1, soil pH (in solution) was 8.25, total nitrogen was 1.74 g kg−1, a soil bulk density of 1.25 g cm−3, and available phosphorus 25.3 mg kg−1, as determined in our previous experiment [22].
2.2. Soil Analysis
For soil analysis, three soil samples were collected, air-dried, and sieved with a 2 mm mesh sieve properly mixed to make a representative composite soil sample. TOC was estimated by the wet oxidation method [23]. Total nitrogen and available phosphorus were observed by the Kjeldahl method [24] and Olsen method [25], respectively. The exchangeable K was evaluated by the ammonium acetate extraction method [24]. After equilibration in distilled water, the pH of the soil was determined using a METTLER TOLEDO Desktop pH meter (1:5). The soil test was performed in the laboratory of the College of Resources and Environmental Sciences at Gansu Agricultural University, Lanzhou, China.
2.3. Plant Nutrient Uptake Analysis
The 12-week-old wheat nutrient uptake was estimated following Hashem et al. [15]. To observe the contents of K and N in wheat shoot, dried and ground samples were digested with H2SO4–H2O2 at 260–270 °C. N content was observed by an Auto-analyzer 3 digital colorimeter (AA3, Bran + Luebbe, Hamburg, Germany), and K content was estimated using flame photometry (FP6400, Shanghai Precision Scientific Instrument, Shanghai, China). P content was determined using the Vanado-molybdophosphoric colorimetric method after nitric–perchloric acid digestion. As a reference, each mineral’s standard curve (10–100 µg−1 mL) was applied.
2.4. Experimental Plant Materials
Seeds of wheat were collected from Gansu Provincial Key Laboratory of Arid Land Crop Science. The seeds were of uniform size and were kept at 4 °C for 24 h, and later in running water for 30 min. Eight imbibed seeds of wheat were sown in each pot. Germinations were observed for three days; four uniform seedlings were chosen from each pot.
2.5. Biochar’s Production, Chemical Properties, and Soil Amendment
For the preparation of the biochar amendment, corn straws were collected from the cornfields in Tangjiao Town and transported to the College of Resources and Environmental Sciences, Gansu Agricultural University, Lanzhou, China. Biochar was produced following the method of Mia et al. [26]. An oven-electric furnace (Heraeus MR 170, Meinerzhagen, Germany) was used to produce the experimental biochar under oxygen-deficient conditions at temperatures ranging from 350 to 500 °C. Produced biochar was sampled, ground, and sieved with a 250 µm mesh. Total organic carbon (TOC) was determined after oxidization with potassium dichromate following Nelson and Sommers [27]. The total K was measured with a Jenway Flame Photometer, Bibby Scientific Ltd-Stone-Staffs-St15 0SA–UK. P was estimated by a spectrophotometer as described by Sparks [28], and TN by the micro-Kjeldahl method [29]. The biochar had 0.43% total N, 0.17% P, 0.46% exchangeable K, and 41.2% TOC [22]. Before sowing, 150 g biochar was applied in 3 kg soil in each treated pot.
2.6. Arbuscular Mycorrhizal Fungi Source and Inoculum
The AMF strain used was a single genus of Glomus mosseae provided by Gansu Provincial Key Laboratory of Arid Land Crop Science, Lanzhou, China. It was multiplied with Zea mays (L.) as the host plant for four months in sterilized soil in the greenhouse of the College of Resources and Environmental Sciences of Gansu Agricultural University, Lanzhou, China. The methods previously described by Gerdemann and Nicolson [30] and Giovanetti and Mosse [31] were used to determine AMF inoculum characteristics. Root mycorrhizal colonization, soil spores content, arbuscules, and extraradical hyphae in the roots samples were observed accordingly. Mycorrhizal roots (80% root mycorrhizal colonization) and soil containing spores (50–80 per 10 g inoculum) and extraradical hyphae (2.5 m per 1 g soil) were mixed with soil in the AMF inoculum. An amount of 20 g AMF inoculum was applied and mixed with soil in each treated pot [22].
2.7. Experimental Design and Treatments
The study used a completely randomized design with five replications and 16 treatments (Table 1). The seeds of wheat were sown in the pots and grown under greenhouse conditions for 12 weeks. The concentration of NaCl in the pots was gradually increased from 50 to 150 mM at the rate of 50 mM per 24 h to avoid osmotic shock and damage to root until the maximum concentration was achieved for the respective treatment threshold [32]. The pots were fully irrigated (thrice a week) with an equivalent volume of various saline solution to prevent water stress and to permit the salt concentrations in the pots to be maintained at a constant level [22]. A total of 80 pots were used for this greenhouse experiment.

Table 1.
Treatment description.
2.8. Measurement of Plant Growth Parameters
Wheat plant height, shoot fresh weight (SFW), and root fresh weight (RFW) of 12-week-old wheat were determined [22]. Plant height was measured using a tape meter rule from the ground level to the base of the highest fully expanded leaf. Plants were carefully removed from the soil and washed with running tap water, followed by distilled water. After absorbing residual water using tissue paper, plants were manually separated into the root and shoot. An electronic balance was used to determined SFW and RFW.
2.9. Determination of Free Fatty Acid Lipid Extraction and Analysis
An amount of 3 g 12-week-old wheat leaves were collected from different plants grown on salt-affected soils and placed into 1.5 mL polypropylene reaction tubes. Fresh leaves were flash-frozen in liquid nitrogen and stored at −80 °C. To each sample, 300 μL extraction solvent composed of methanol, chloroform, and formic acid (20:10:1, v/v/v) was used. The mixture was then vigorously shaken (using a paint shaker) for 5 min. Briefly, 150 μL of 0.2 M phosphoric acid and 1 M potassium chloride were added, and samples were centrifuged at 13,000× g at room temperature for 1 min [22].
Fatty acids were extracted following procedures of [33], followed by separation using two-dimensional thin-layer chromatography (TLC) on silica gel plates (pre-coated silica gel plates, Merck 5626). The first developing solvent was acetone/toluene/H2O (91:30:8), and the second was chloroform/methanol/25% NH3/H2O (65:35:3:2). The plates were briefly air-dried before being finely sprayed with 0.01% primuline and interpreted under ultraviolet light.
The transesterification of individual lipids previously separated by TLC was performed with 5% H2SO4 in MeOH at 85 °C for 1 h. A Hewlett-Packard 5890 gas chromatography system equipped with a hydrogen flame ionization detector and a FFAP capillary column (30 m; i.d. 0.53 mm) was used to separate the fatty acid methyl esters. The column was run isothermally at 190 °C, while the detector was kept at 230 °C. The internal standard was heptadecanoic acid, provided by Sigma-Aldrich Chemical Co. (St. Louis, MO, USA). All other used chemicals were purchased from Merck (Darmstadt, Germany).
2.10. Antioxidant Enzyme Activities
Young fresh leaves of 12-week-old wheat plants were collected for protein extracts. The leaves (1 g) were immediately frozen in liquid nitrogen, lyophilized, and homogenized in 2 mL of 0.1 mM potassium phosphate (pH 7.8). Samples were centrifuged for 15 min at 4 °C at 12,000× g. The supernatants were collected into tubes and stored at −20 °C until needed for enzymatic activity assays.
The SOD activity was measured spectrophotometrically by determining the inhibition of blue diformazan formation in the presence of riboflavin/nitroblue tetrazolium (NBT) and light. The modified assay solution was prepared with 1 mL of 50 mM sodium phosphate (pH 7.8), 0.1 mM EDTA, 0.3 mM riboflavin, and 30 L of leaf extract. After 5 min at room temperature, the solution was mixed with NBT to obtain a final concentration of 0.03 mM NBT. The reaction mixture was then illuminated for 3 min with a fluorescent light (75 W, 20 cm above the mixture), and absorption was determined at 560 nm. The reaction mixture without extract was used to calculate the control rate. The NBT absorption was insignificant. The SOD activity is expressed as min−1 mg−1 protein; one unit is described as 50% inhibition of blue diformazan formation [34].
The POD activity was determined by measuring the increasing rate in absorbance at 470 nm with o-dianisidine as the substrate [35]. The assay solution was 1 mL of 0.01 M sodium phosphate (pH 6.0) containing 1.3 mM H2O2, 1 mM o-dianisidine, and 5 µL of extract. The POD activity is expressed as min−1 mg−1 protein.
2.11. Photosynthetic Pigments
The determination of photosynthetic pigments was accomplished following the method of [36,37]. Fresh leaves from the middle of 12-week-old wheat were sampled for photosynthetic pigments assessment. Leaves were finely cut into small sections (−0.1 g) and ground to a powder in 80% acetone (10 mL) and then was centrifuged for 5 min at 5000–10,000× g rpm. After collecting the supernatant, the procedure was repeated until the residue was colorless. The absorbance of the solution sample became red at 480, 645 nm, and 663 nm when compared with a solvent (acetone) blank.
The photosynthetic pigments content in wheat leaves was estimated by (Equations (1)–(4)):
Chlorophyll a (mg g−1 FW) = (0.0127 ∗ A663) − (0.00269 ∗ A645)
Chlorophyll b (mg g−1 FW) = (0.0229 ∗ A645) − (0.00468 ∗ A663)
Total Chlorophylls (mg g−1 FW) = (0.0202 ∗ A645) + (0.00802 ∗ A663)
Carotenoids (µg g−1 FW) = [A480 + (0.114 (A663) − (0.638 − A645)) × V/1000 × W
2.12. AMF Colonization
Root staining was performed according to the method of Philips and Hayman [38] to assess AMF colonization. The fresh roots of wheat were thoroughly rinsed with tap water to remove soil particles. They were then placed in test tubes in a 10% w/v KOH solution to discolor the roots and to empty the cytoplasmic contents. The tubes containing the roots and KOH were heated in a water bath at 90 °C for 1 h. After heating, the roots were then rinsed to remove KOH and placed in a 0.05% w/v Trypan blue solution. The tubes containing the roots soaked in Trypan blue were placed again in a water bath at 90 °C and heated for 30 min. For each sample, 20 root fragments of approximately 1 cm were mounted between slides and coverslip; four slides were made for each sample. The roots were crushed in glycerol and observed under the microscope. The presence of hyphae, vesicles, or arbuscles in the root confirmed mycorrhizal colonization of the root sample. The estimation of root colonization by arbuscular mycorrhizal fungi was carried out using the method by Trouvelot et al. [39], while the AMF colonization was estimated according to Equation (5).
where;
AMF colonization = (95n5 + 70n4 + 30n3 + 5n2 + n1)/total number of fragments observed
- n5 = number of fragments noted 5
- n4 = number of fragments noted 4
- n3 = number of fragments noted 3
- n2 = number of fragments noted 2
- n1 = number of fragments noted 1
2.13. Statistical Analysis
Data were analyzed by one-way analysis of variance (ANOVA) using Genstat statistical software (ver.12). Significant differences among treatments were computed by Duncan’s multiple range tests (p = 0.05).
3. Results
3.1. Treatment Impact on Some Growth Parameters
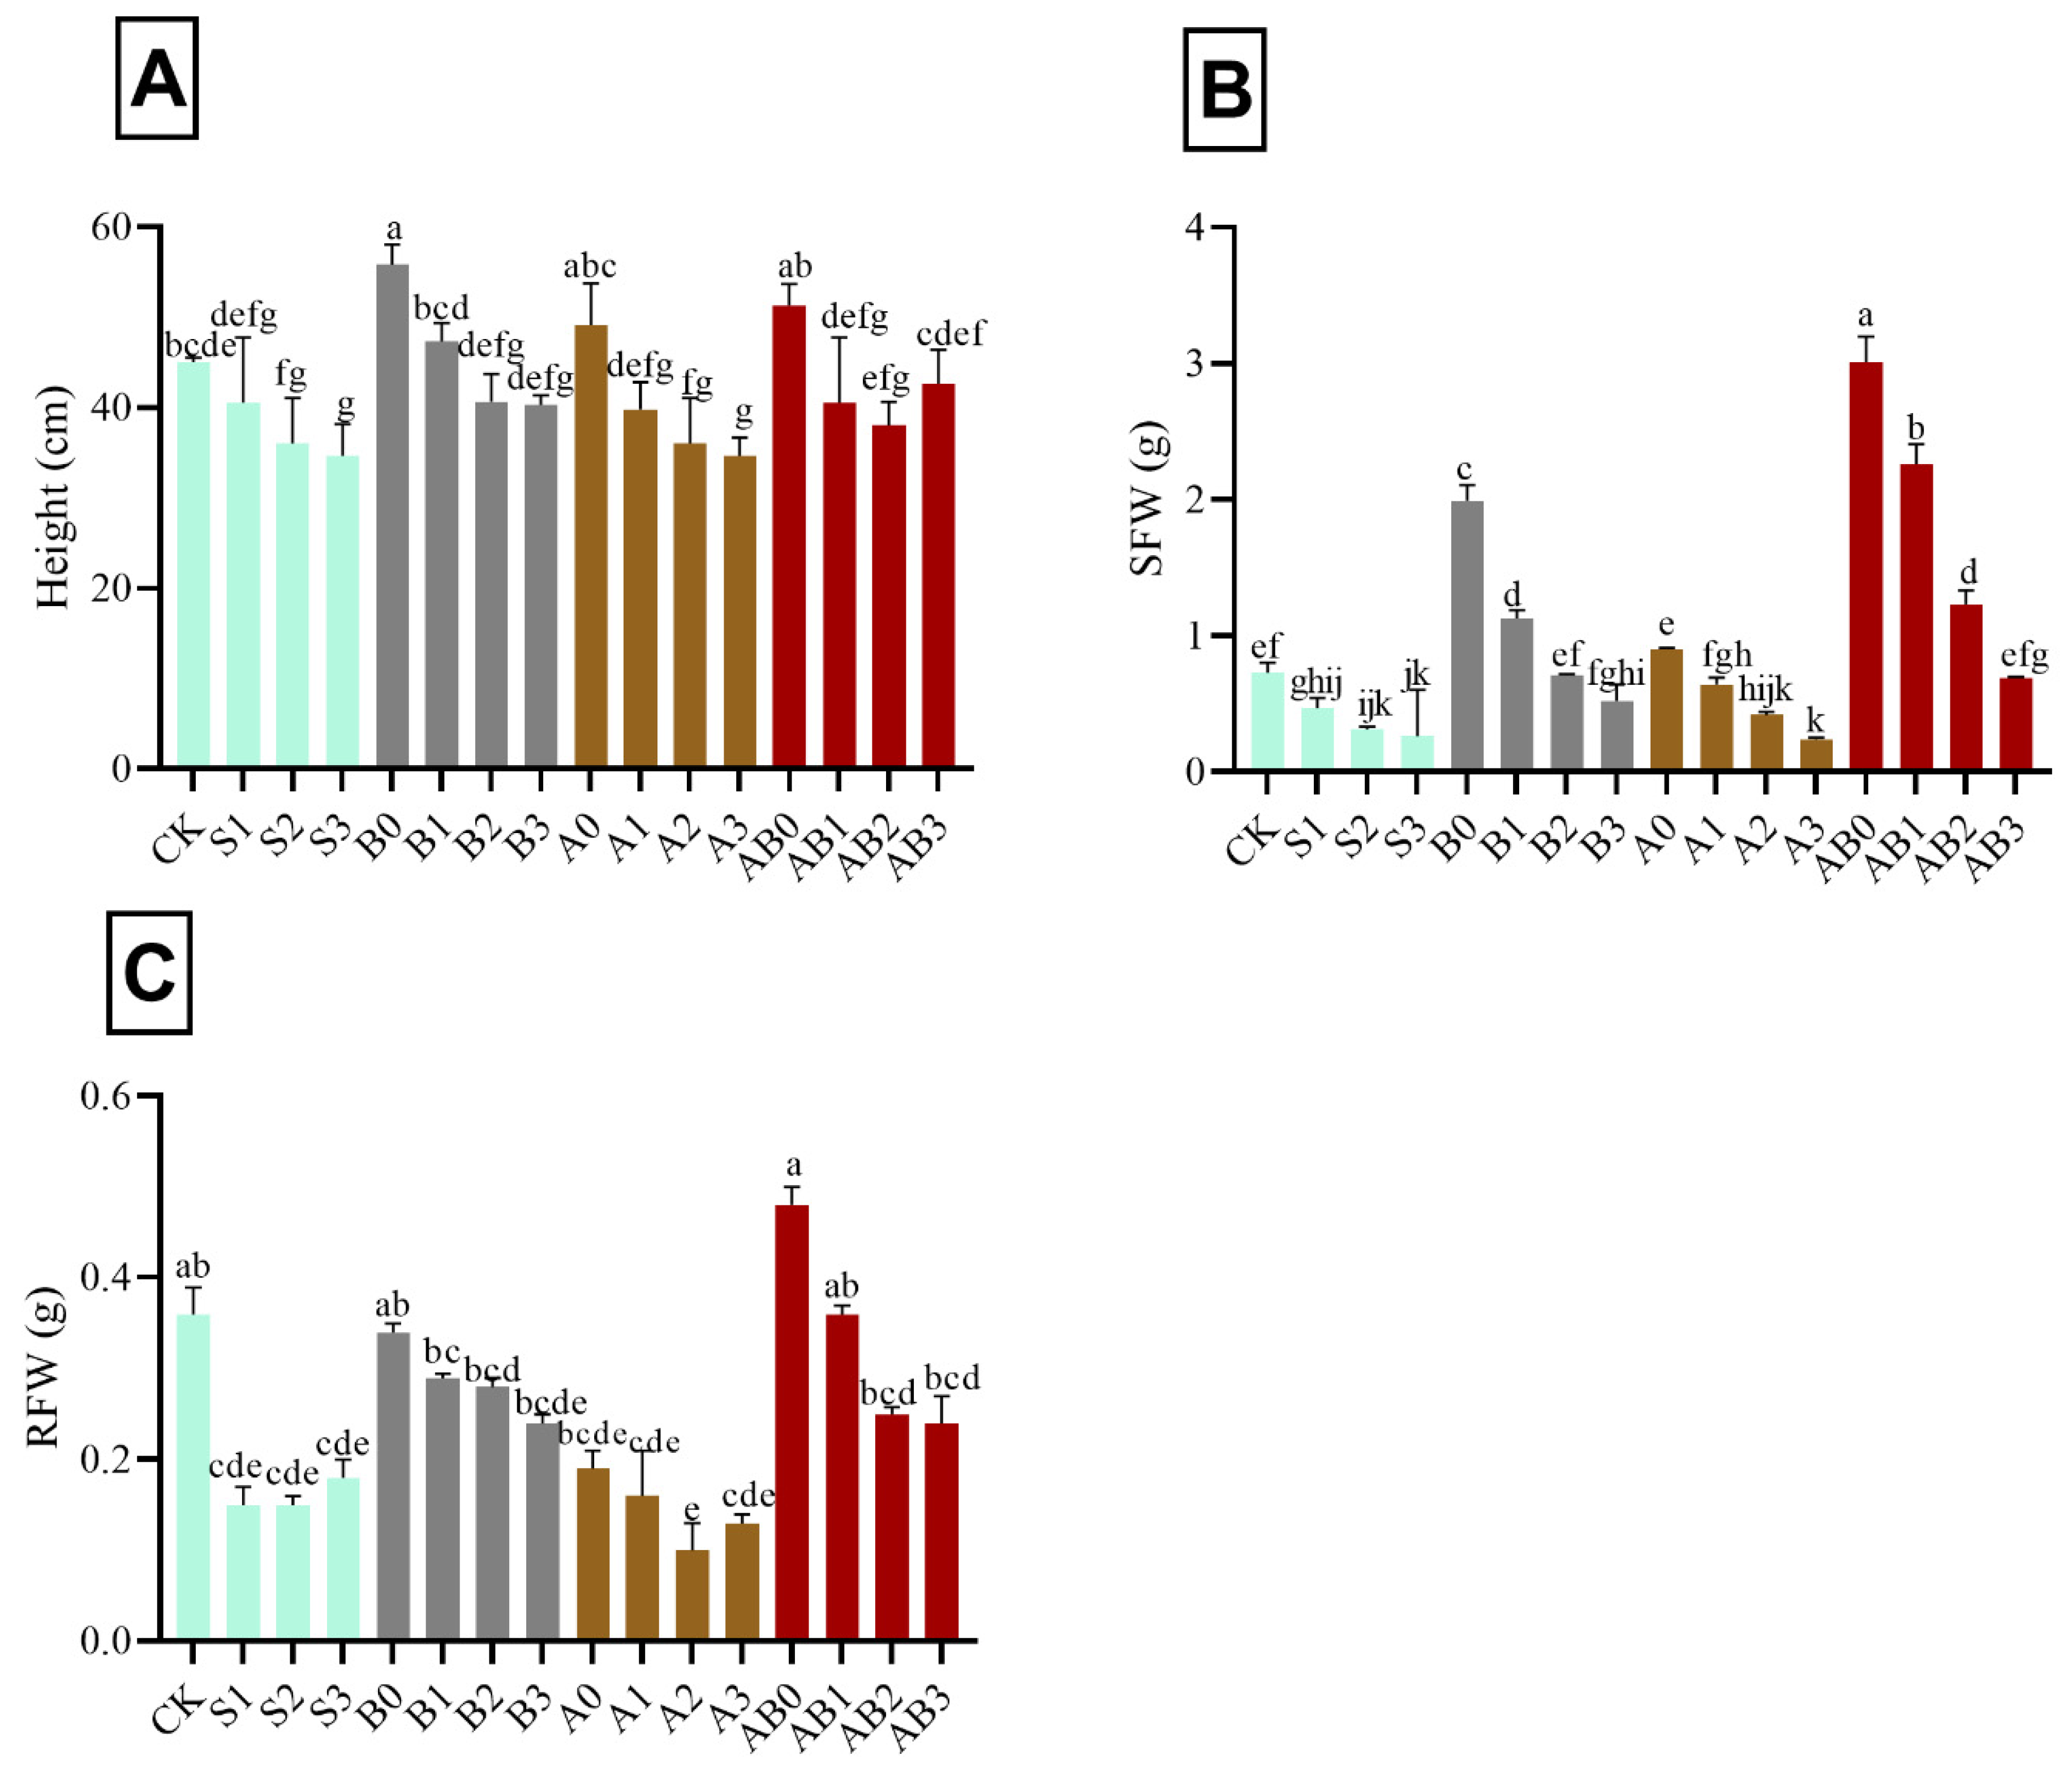
The impact of AMF and biochar on plant height, SFW, and RFW of wheat under different levels of salinity amended with biochar and/or AMF is shown in Figure 1. The results show a progressive decrease in plant height with increase in salt concentration (50 mM (S1), 100 mM (S2), and 150 mM (S3), respectively—i.e., 9.9%, 19.9%, and 22.9%, respectively lower as compared to control) (Figure 1A). Under the application of biochar without NaCl and AMF (B0), plant height significantly increased by 14.1%, as compared with plants treated with NaCl. However, there was no significant effect in height in plants treated with 100 mM and 150 mM NaCl amended with biochar. Plants treated with AMF alone showed a similar trend with biochar. However, under combined application of AMF and biochar with different NaCl concentrations, the height in AB1 and AB2 were comparable with B2 and S1, while AB3 was similar to CK and S1 (Figure 1A). Depending on the increase in concentration of NaCl, SFW decreased from 50 to 150 mM, respectively—i.e., 35.6%, 57.5%, and 64.4% respectively lower as compared with control. The application of biochar and AMF showed significant increase in SFW and RFW, i.e., 75.7% and 24.9% respectively higher as compared with control (Figure 1B,C). However, no significant difference was observed in S2, S3, A2, and A3. Regarding SFW, there was no significant difference between AB2 and B1, while AB3 was similar to CK, B2, and A1 (Figure 1B). The plant treated with AB3 had significant reduction in RFW when compared with S1 and B3 (Figure 1C).
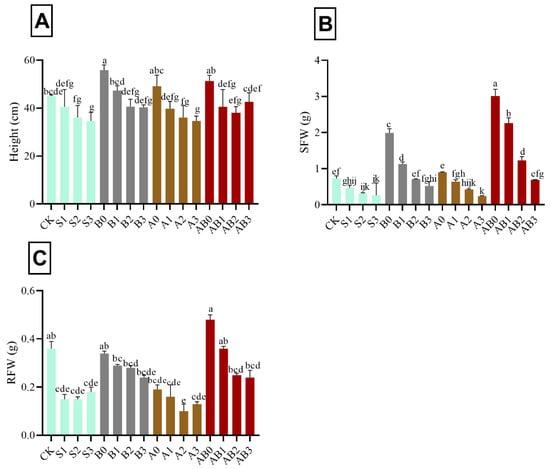
Figure 1.
Impact of AMF and biochar on plant height (A), SFW (B), and RFW (C) of wheat under different concentrations of salinity. Data are displayed as means ± standard deviation (n = 3). Different letters above bars indicate significant differences (p < 0.05) among treatments by Duncan multiple range test. The description of acronyms is mentioned in Table 1.
3.2. Effect of AMF and Biochar on Fatty Acid Composition
The effect of biochar and AMF amendment on fatty acid composition in salt tolerance of wheat plants is shown in Table 2. The recorded concentration of saturated fatty acids C14:0, C16:0, C18:0, C20:0, and C22:0 increased with salinity levels. However, C14:0 and C18:0 contents were stable in the wheat plants treated with B0, B1, B2, B3, A0, A1, A2, AB0, AB1, AB2, and AB3. Under A3 treatment, the quantity of C18:0 remained stable, while C14:0 increased compared with CK. The content of C16:0 also increased under B1, B2, B3, A1, A2, A3, AB2, and AB3 but was stable under B0, A0, AB0, and AB1 compared with CK. Furthermore, the content of C20:0 was stable when plants were subjected to B0, B2, B3, A0, and AB0 treatments compared with CK, but its content was significantly greater in B1, A1, A2, A3, AB1, AB2, and AB3 treatments than CK. The application of B0, B1, B2, A0, AB0, AB1, AB2, and AB3 treatments did not significantly affect the quantity of C22:0; however, the application of B3, A1, A2, and A3 treatments were effective. Consistent with these results, the unsaturated fatty acids C16:1, C18:1, C18:2, and C18:3 contents exhibited a gradual decrease with increasing levels of salinity. Similarly, C16:1 decreased under B1, B2, B3, A1, A2, A3, AB1, AB2, and AB3 treatments compared with CK. The concentration of C18:1, C18:2, and C18:3 was increased in a stable manner under B1, B2, B3, A1, AB1, and AB2. However, under A2 and A3 treatments, the composition of C18:2 and C18:3 decreased. The content of C18:3 increased significantly under AB3, whereas there was no significant difference between the composition of C18:1 and C18:2 compared with that of control.
Table 2.
Fatty acid composition in lipids of the wheat plant.
3.3. Impact of AMF and Biochar on Antioxidant Enzyme Activities
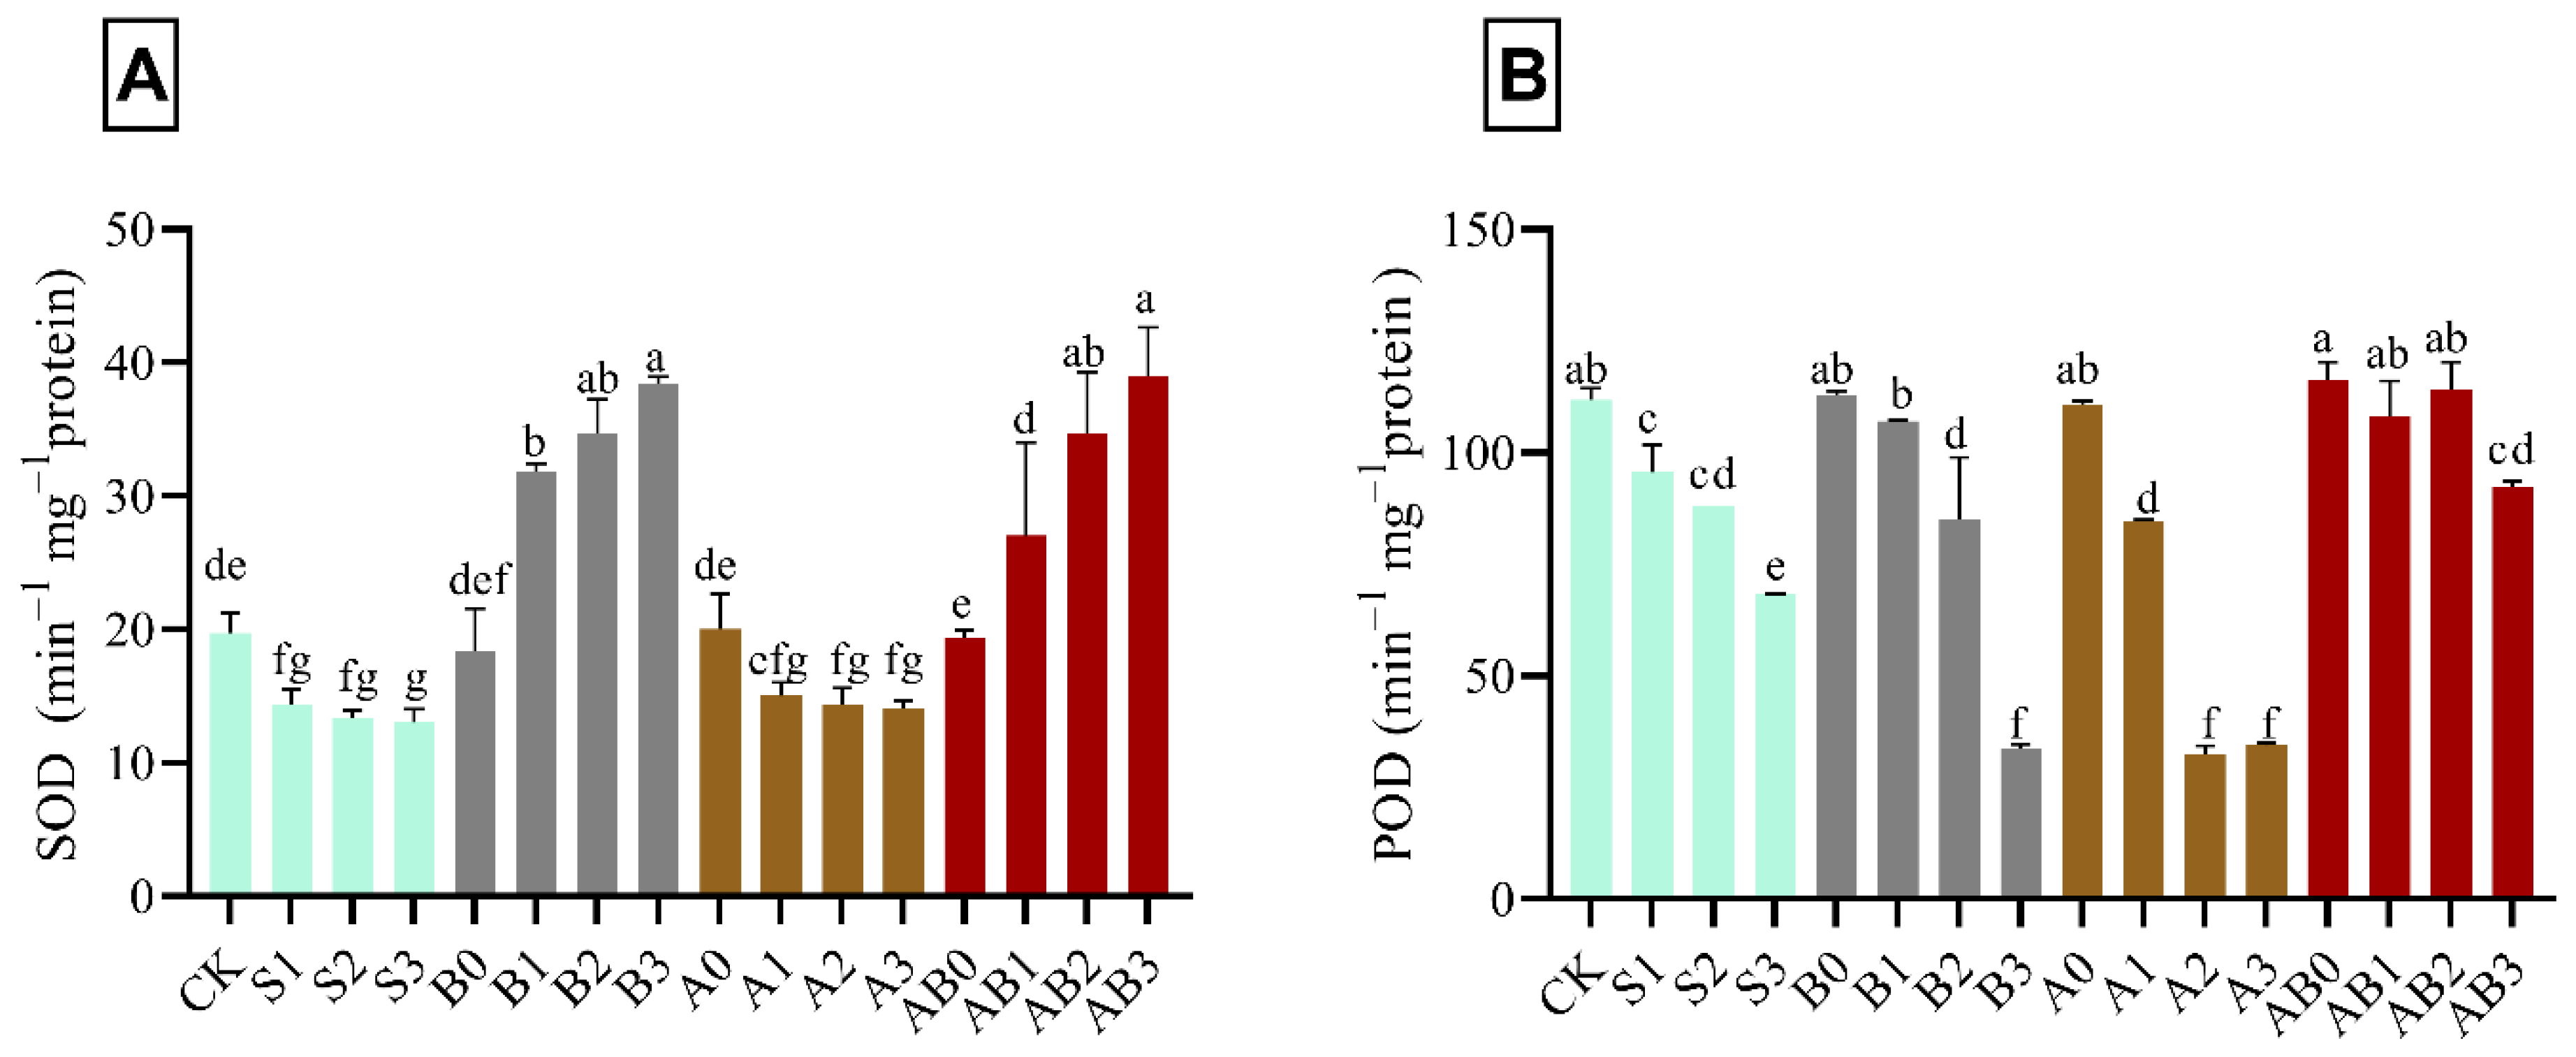
In salinity-stressed wheat plant, SOD activity decreased by 34.1% compared with CK. However, there was no significant effect with increase in NaCl concentration from 50–150 mM (S1–S3). The application of biochar to salt stress plant increased the activities of SOD in different concentrations of NaCl. Biochar application at 150 mM NaCl (B3) had the highest significant concentration of SOD—i.e., 48.6% higher as compared with CK, B1, and B2. The amendment of salt stress plant with AMF (A1, A2, and A3) showed no significant difference with S1, S2, and S3. Combined application of AMF and biochar (AB0, AB1, AB2, and AB3 respectively) on salt-stressed wheat plant, significantly increased the activities of SOD by 1.7%, 27.1%, 43.2%, and 49.5% respectively higher as compared with control (Figure 2A). AB3 had the highest concentration of SOD when compared with AB2, AB1, and AB0. S3 had the lowest significant concentration of POD—i.e., 39.3% as compared with control in Figure 2B. The combined application of AMF and biochar significantly ameliorated the effect of NaCl in various concentrations on wheat plants compared with B1, B2, B3, A1, A2, and A3, which had no effect on POD activity. AB0 had the highest effect on POD activity on wheat plant; however, no significant difference was observed in AB1- and AB2-treated plants.
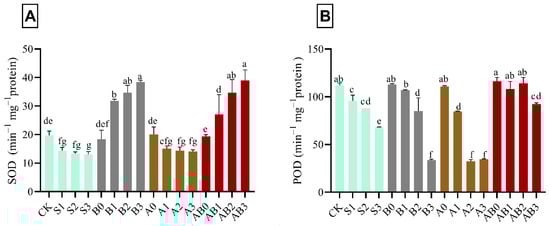
Figure 2.
Impact of AMF and biochar on the activity of SOD (A) and POD (B) in wheat under different levels of salinity. Data are displayed as means ± standard deviation (n = 3). Different letters above bars indicate significant differences (p < 0.05) among treatments by Duncan multiple range test. The description of acronyms is mentioned in Table 1.
3.4. Influence of AMF and Biochar on Photosynthetic Pigments
The results in Figure 3 shows the effect of the individual and synergistic effects of biochar, AMF, and NaCl stress on chlorophyll a, chlorophyll b, total chlorophyll, and carotenoid content in wheat plant. The pigments tested were reduced with the increase in the level of NaCl stress. However, biochar and AMF significantly increased the chlorophyll a, chlorophyll b, total chlorophyll, and carotenoid contents by 46.7%, 80.0%, 75.0%, and 56.2% higher, as compared with 150 mM NaCl-contaminated soils. The effects of AMF and biochar on chlorophyll were found to be statistically different (p < 0.05) in wheat under the different levels of salt stress (Figure 3). In S1, B0, B1, B2, A0, A1, AB0, AB1, AB2, and AB3 treatments, there was no significant difference observed in chlorophyll a, b, and total chlorophyll relative to the control; whereas they were found to be lower in S2-, S3-, B3-, A2-, and A3-treated plants than those of control. The decrease in chlorophylls content in biochar-treated plants was lower than those in S3 and A3 in 150 mM NaCl-contaminated soils. Amendment with exclusive biochar and co-application of biochar and AMF maintained the photosynthetic machinery in wheat grown in high saline soils (Figure 3). The interacting effect of biochar and AMF on NaCl-stressed wheat plants significantly ameliorated the effect of stress induced by the different level of NaCl. The effect of treatments on carotenoid was found to be statistically different (p < 0.05) in wheat under different levels of salinity stress (Figure 3). Carotenoids in control plants (CK) were statistically similar to carotenoids found in B0, B1, B2, A1, AB1, AB2, and AB3 in wheat grown in saline soils. Carotenoids in wheat treated with A0 and AB0 were significantly higher than those of the control (CK). Conversely, carotenoids were significantly lower in S1, S2, S3, B3, A2, and A3 than those of control. Carotenoids in leaves of wheat decreased by 30.2% under S1, 54.8% under S2, and 68.6% under A3 (Figure 3).
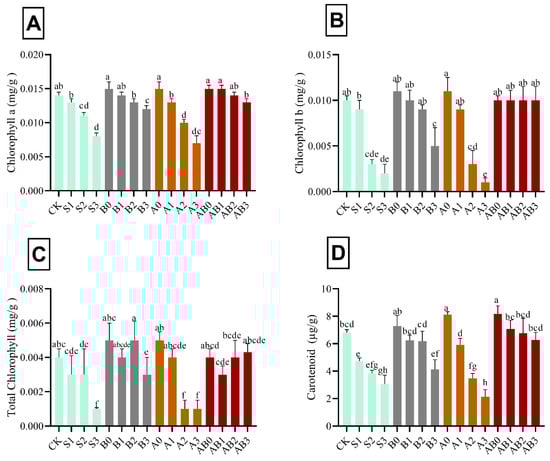
Figure 3.
Impact of AMF and biochar on photosynthetic pigments: chlorophyll a (A), chlorophyll b (B), total chlorophyll (C), and carotenoid (D) in wheat under different levels of salinity. Data present the mean ± standard deviation of three replicates. Different letters above bars indicate significant differences (p < 0.05) among treatments by Duncan multiple range test. The description of acronyms is mentioned in Table 1.
3.5. Nutrient Uptake of Wheat Plant
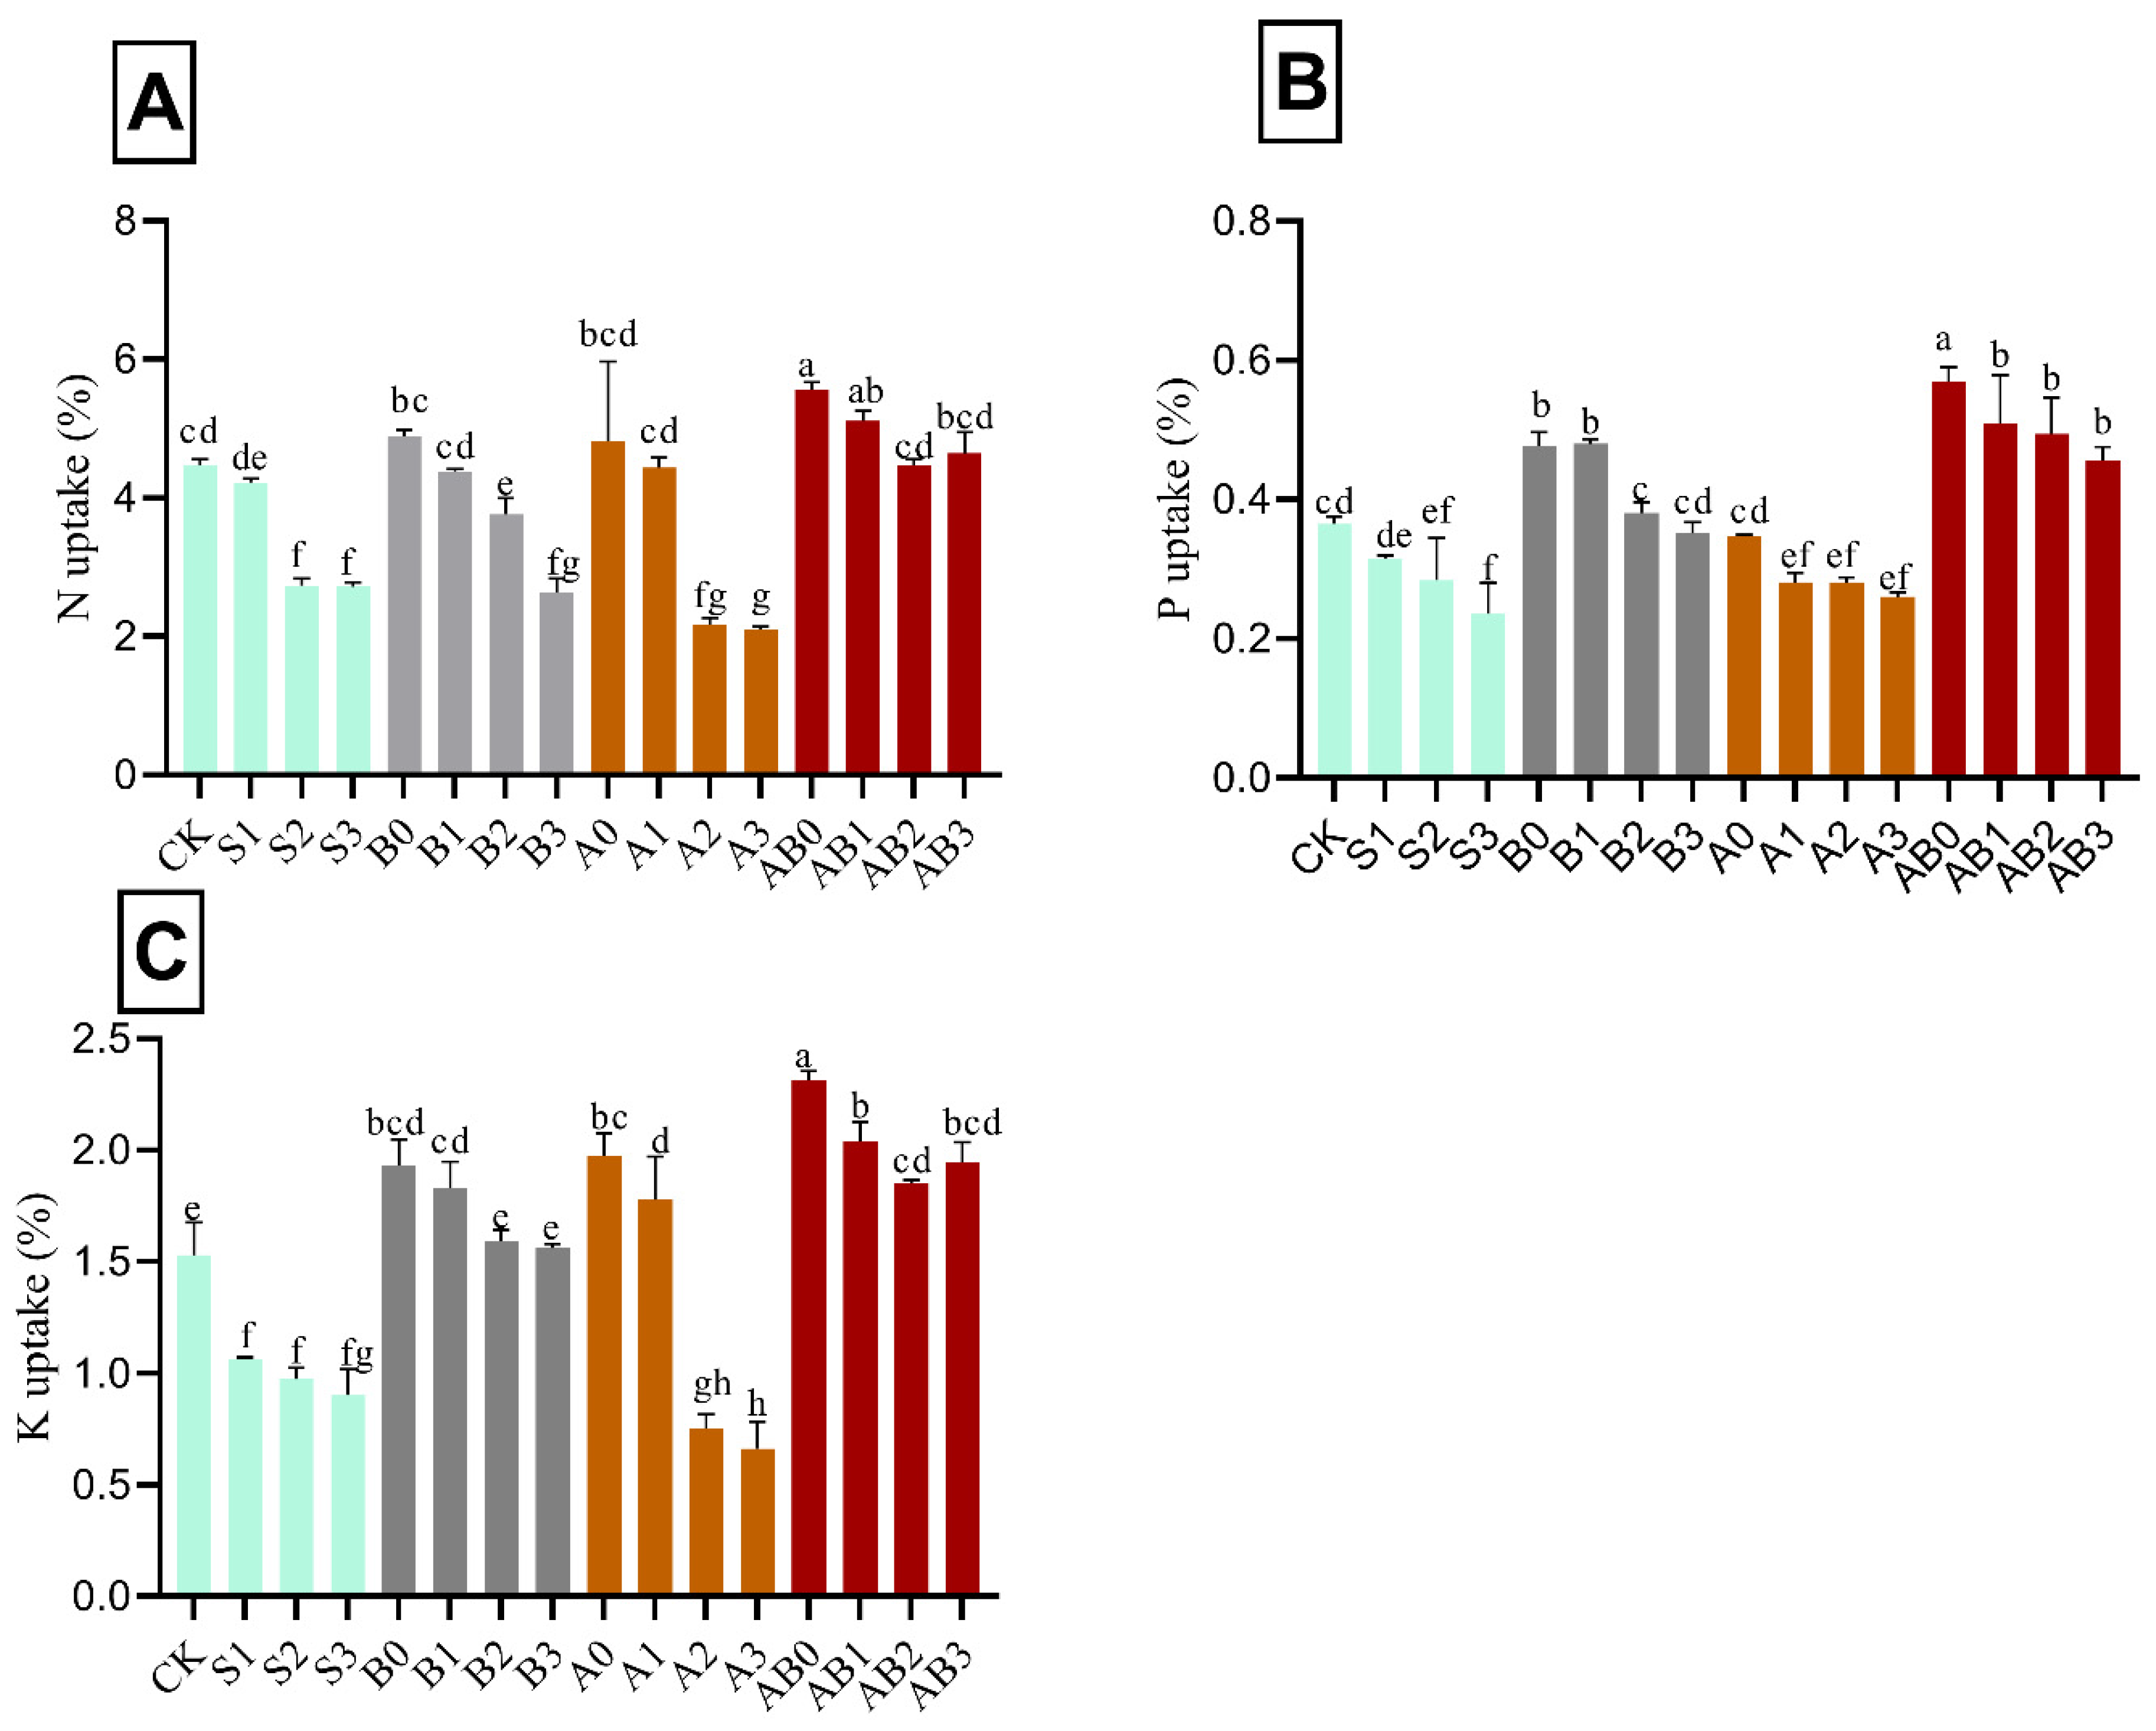
Application of biochar and AMF singly and in combination had a significant effect on the concentration of total nitrogen, available phosphorus, and total potassium in wheat plant. Mean comparisons showed that the uptake of N, and P were decreased with an increase in the concentration of NaCl salinity. The amendment of biochar/or AMF resulted in an increase in the uptake of N, P, and K under NaCl saline soil by 19.5%, 35.9%, and 33.9%, respectively, as compared with control (Figure 4). The combination of biochar and AMF in their various levels significantly had the highest uptake across the nutrients tested in the order of AB0, AB1, AB2, and AB3 treatments. The highest uptakes for nitrogen were 5.1%, 4.9%, 4.6%, and 4.5% for AB1, B0, AB3, and AB2, respectively, relative to control. The highest uptake of P was under biochar + AMF amendment. AB1 had the highest P uptake, which was not significantly different from AB2 and AB3. AMF and biochar amendment significantly increased the concentration of total K. B1, A1, and A2 significantly had the highest concentration of P.
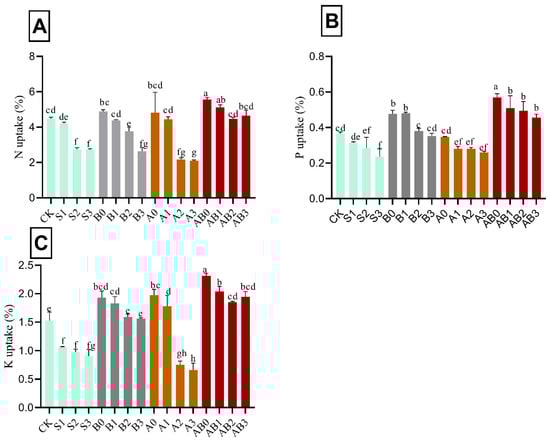
Figure 4.
Impact of AMF and biochar on nutrient uptake of wheat plant: N uptake (A), P uptake (B), and K uptake (C) of wheat under different levels of salinity. Data present the mean ± standard deviation of three replicates. Different letters above bars indicate significant differences (p < 0.05) among treatments by Duncan multiple range test. The description of acronyms is mentioned in Table 1.
3.6. Influence of AMF and Biochar on Soil Chemical Properties
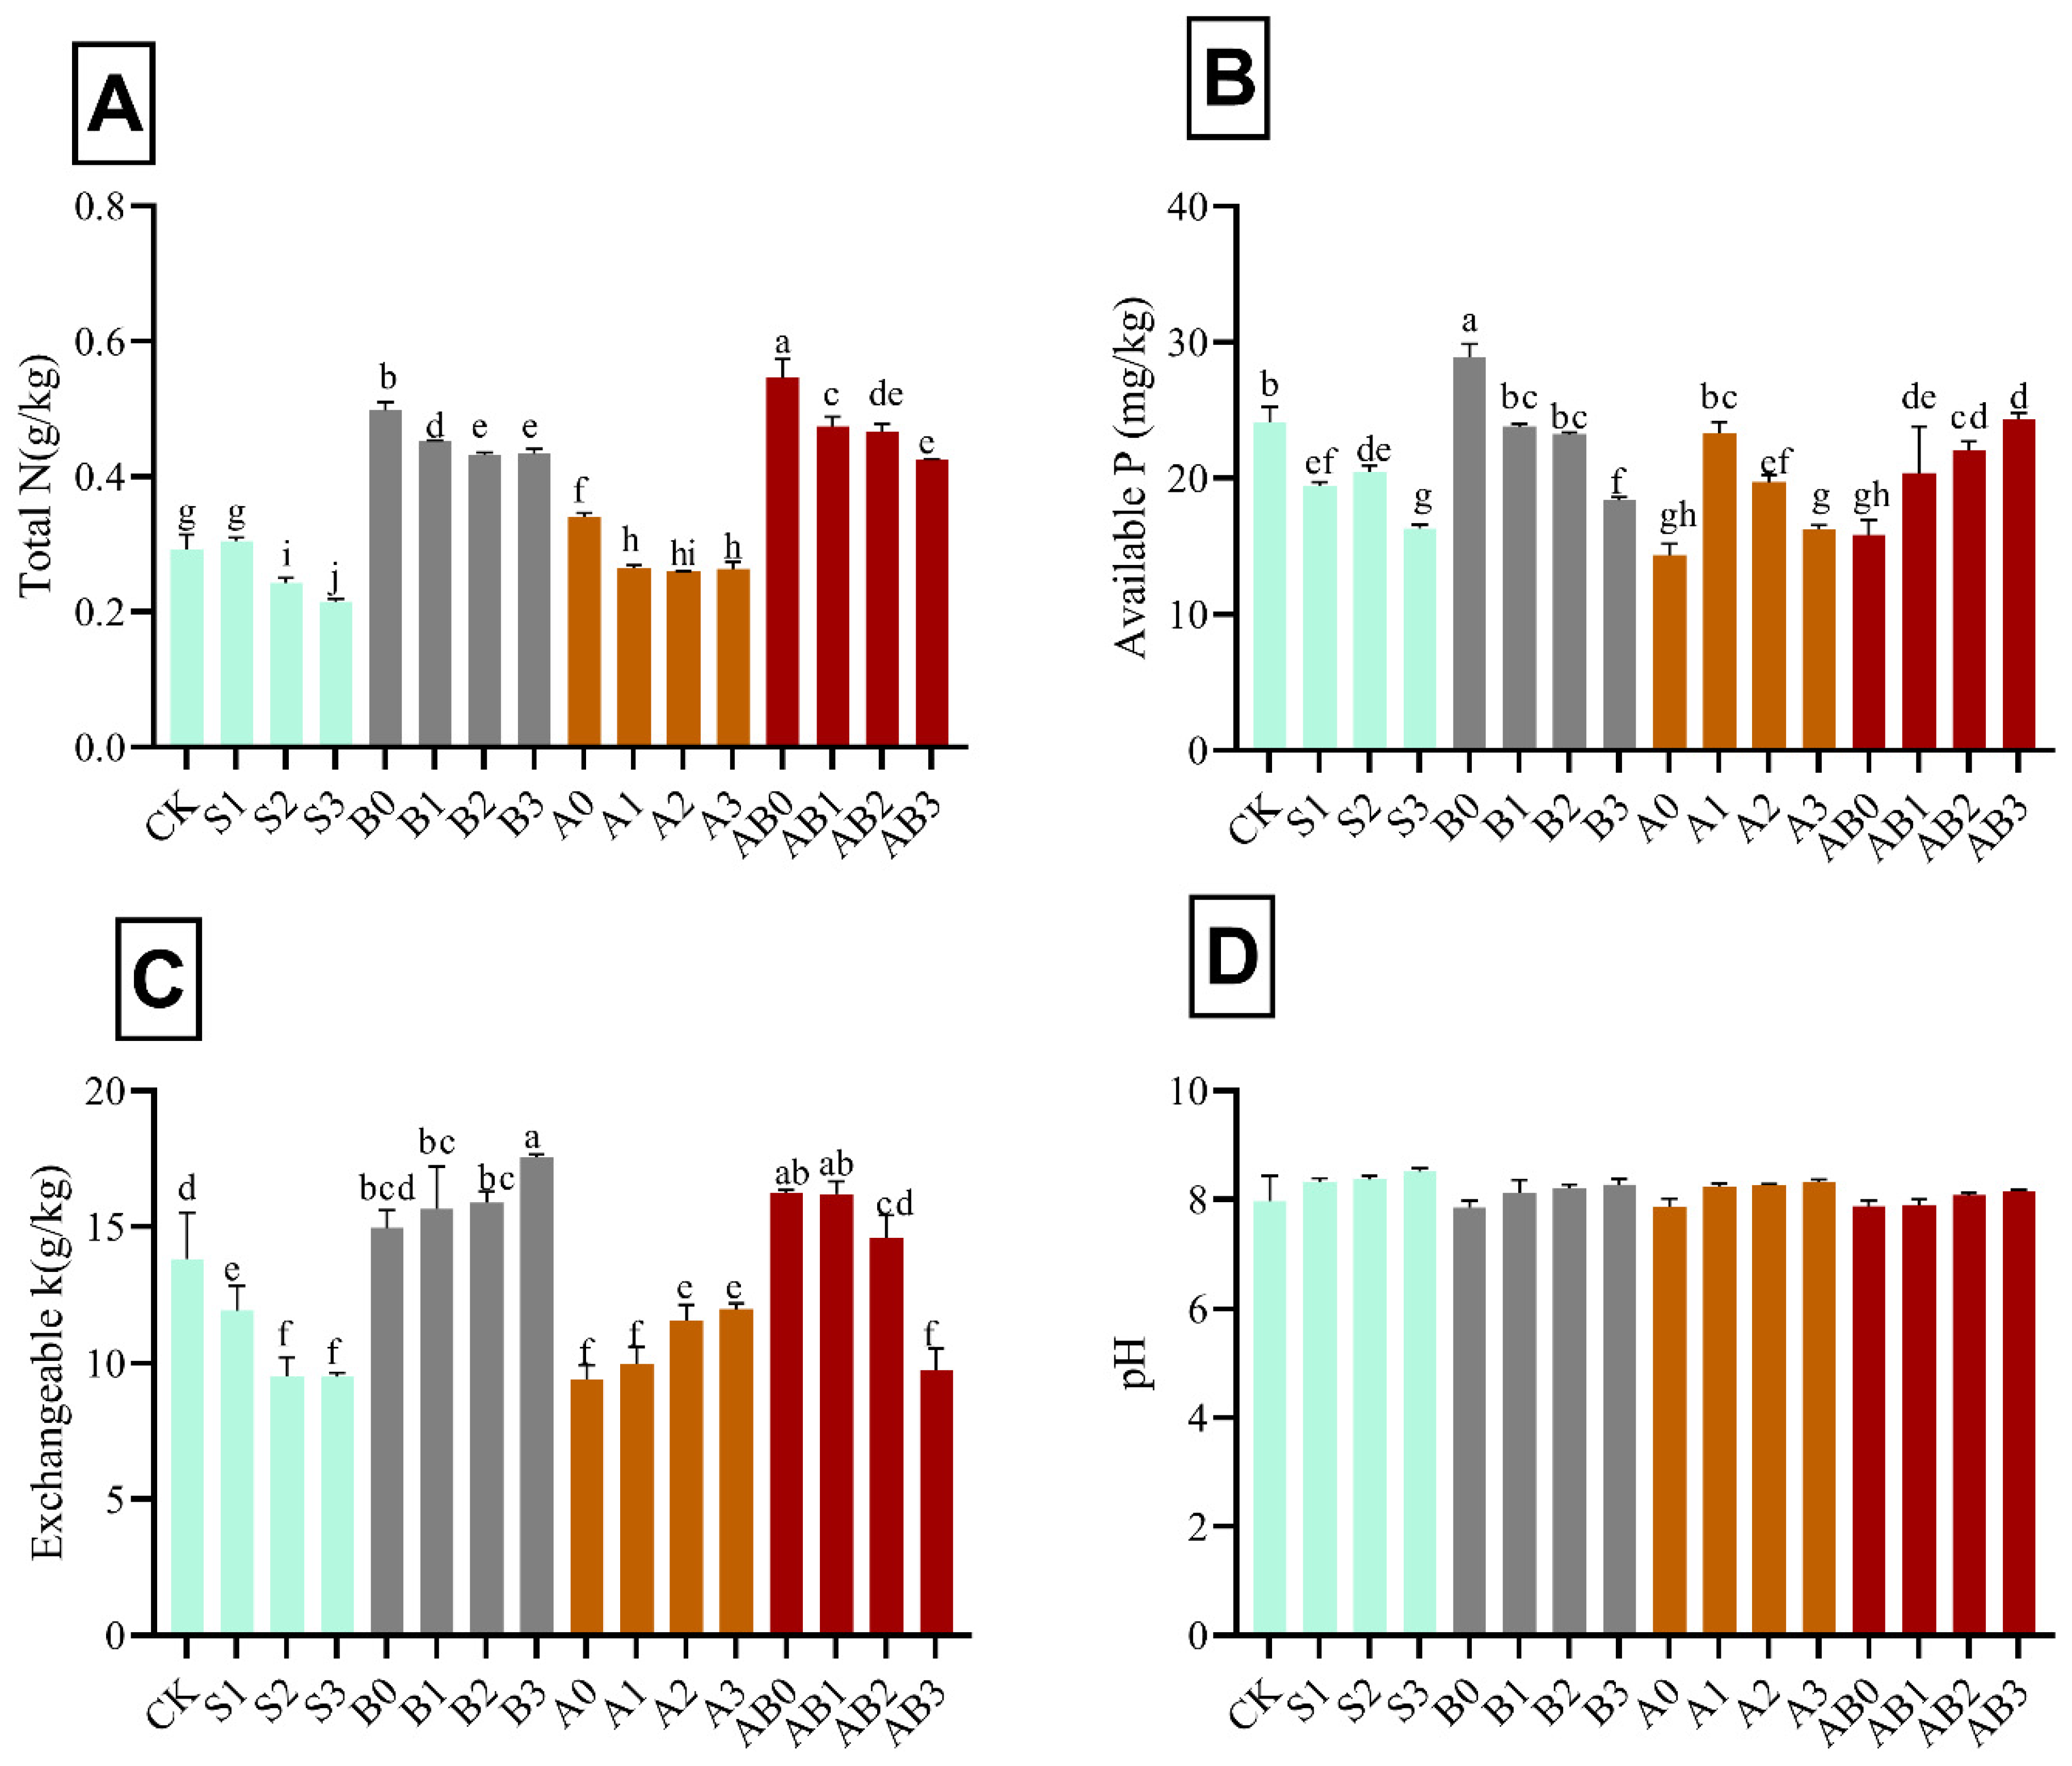
The amendment with biochar and AMF on salinity-stressed wheat plants significantly affected the soil total N, available P, and total K, with pH remaining almost constant in all levels of amendment. Total N, available P, and total K decreased with increase in NaCl salinity (Figure 5). Biochar amendment increased the availability of P, total K, and N in NaCl salinity. Interaction of biochar + AMF on 50 mM NaCl recorded the highest total N (0.54 g kg−1) and K (17.55 g kg−1); AB2 had the highest available P (28.87 g kg−1) in soil after harvest. However, total N in A2 was not significantly different from S2; available P in AB1 and A2B3 were not significantly different from S1, S2, and S3. There was an increase in total K in all levels of biochar + AMF amendment, with AB3 not significant from S3. The pH in the soil after harvest remained almost constant when compared with the initial pH. pH ranged from 7.97 to 8.5 in all treatments.
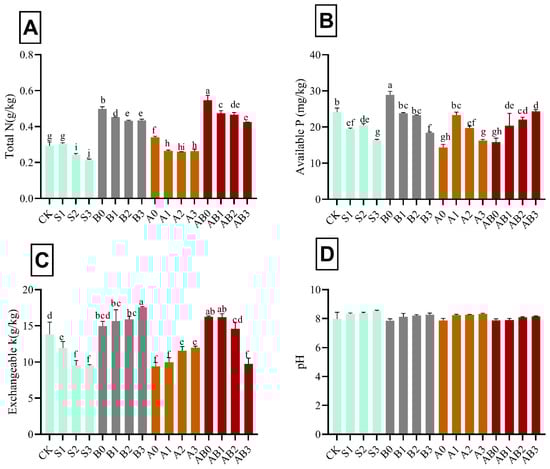
Figure 5.
Impact of AMF and biochar on soil nutrient content after harvesting: total N (A), available P (B), exchangeable K (C), and soil pH (D) after harvesting wheat grown under different levels of salinity. Data present the mean ± standard deviation of three replicates. Different letters above bars indicate significant differences (p < 0.05) among treatments by Duncan multiple range test. The description of acronyms is mentioned in Table 1.
3.7. AMF Colonization
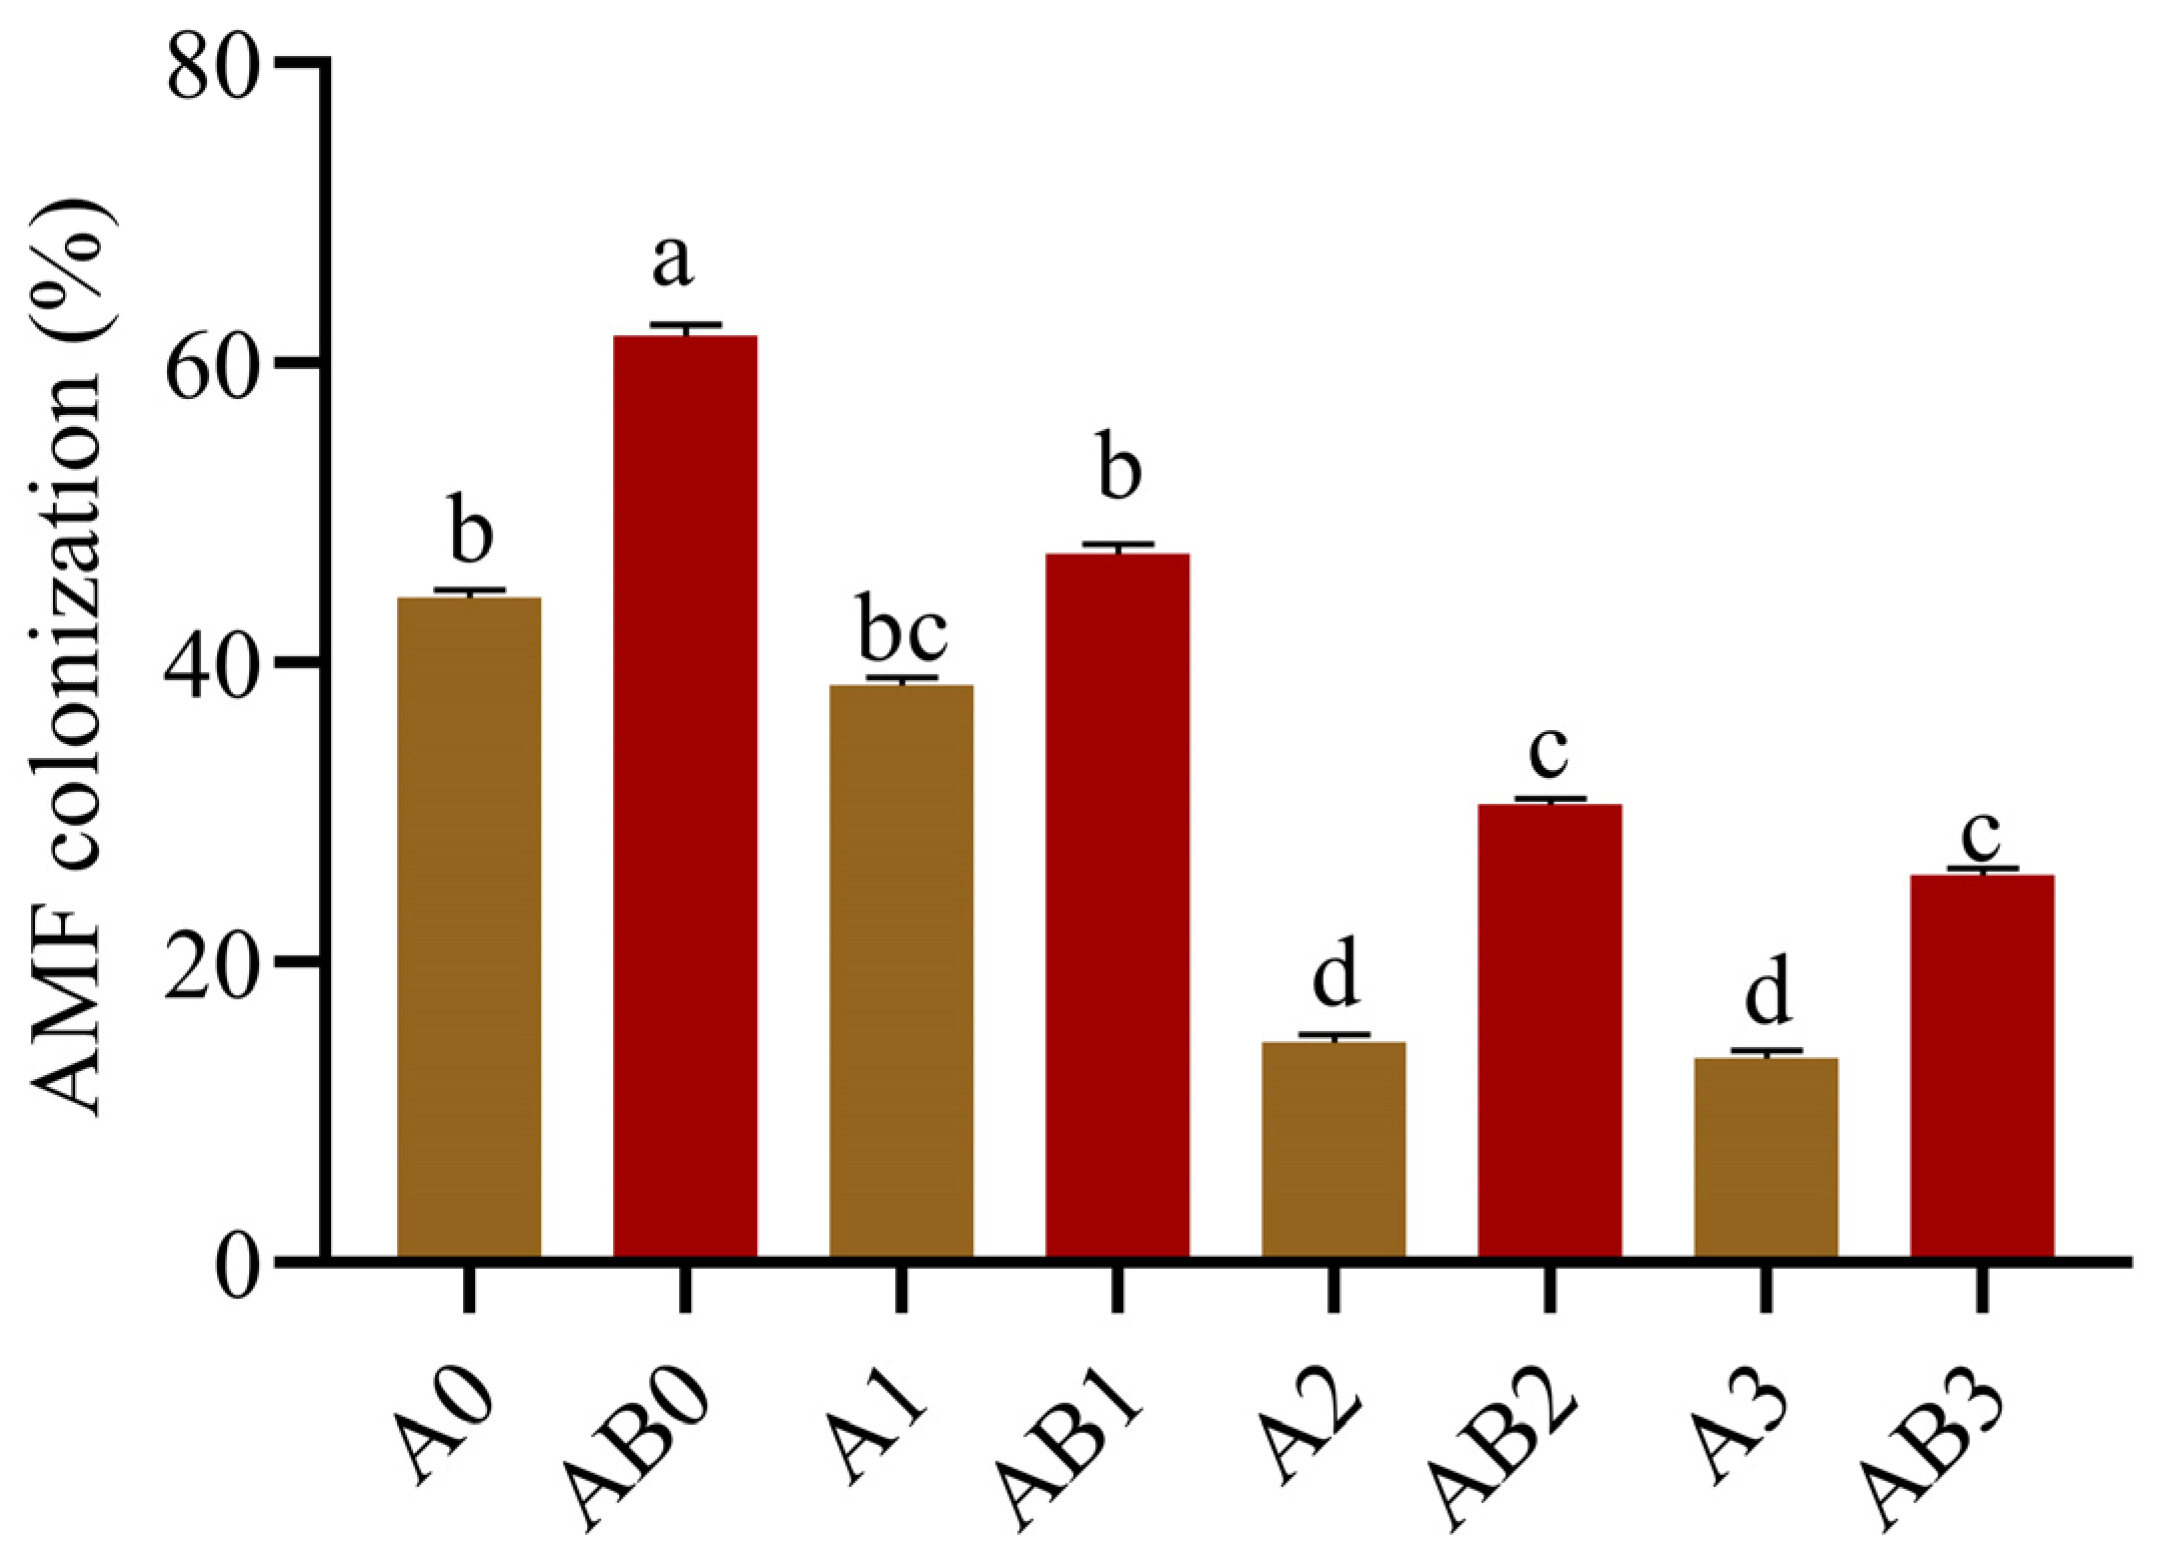
AMF colonization measured in roots of wheat grown under salinity after treatment with AMF and with/without biochar are shown in Figure 6. Our results indicate that salinity stress negatively affected the AMF symbiosis with wheat plants. Conversely, biochar induced an increase in the observed mycorrhization rate relative to the treatments with AMF alone. For instance, AMF colonization was 44.35, 38.47, 14.73, and 13.64% for single treatments with A0, A1, A2, and A3, respectively, which increased to 61.83, 47.27, 30.57, and 25.86% in the presence of biochar, respectively. For all the treatments, AB0 induced the largest increase of 17.48%, followed by AB2 (15.84%).

Figure 6.
AMF colonization of the wheat plant. Data present the mean ± standard deviation of three replicates. Different letters above bars indicate significant differences (p < 0.05) among treatments by Duncan multiple range test. The description of acronyms is mentioned in Table 1.
4. Discussion
Soil amendments with biochar [40] and AMF [41] have been highlighted to enhance crop morphological and physiological traits. Our study has evaluated and confirmed the mitigating impact of co-application of AMF and biochar on salinity stress damage on wheat plants. Through the measurement of growth parameters, fatty acids content, antioxidant enzymes activity, nutrient uptake, and photosynthetic pigments, we evaluated the potential of soil amendments with AMF and biochar in mitigating the detrimental effects of salinity stress on wheat plants. Wheat plant height, SFW, and RFW were significantly reduced with increased level of salinity. Growth retardations in plants subjected to salinity stress might result after a water potential imbalance established by the chemical potential of the saline soil, as reported by Bohnert et al. [42]. At 150 mM NaCl, the shoots were more sensitive to salinity than roots, which agreed with the result of Ben et al. [43]. Because the plant acts as an interconnected system in which metabolic stress-induced signals propagate throughout the plant, this is most likely owing to a change in plant metabolism, even in places where stress conditions are not present. There was an improvement in growth parameters in B2- and B3-treated plants that could reflect the beneficial effect of biochar against high salinity stress. Our result agrees with previous studies that reported beneficial changes in plants due to biochar amendments [44]. A similar study was also mentioned by Ved and Sukhbir [45] in eggplant. Similarly, a decrease in unsaturated fatty acids induced by salinity stress was previously highlighted by Ben et al. [43] in tomato under metal stress. Likewise, salt stress led to a deterioration in the activity of SOD. This is consistent with a report by Na Sui et al. [46] in peanut under salinity stress.
Application of biochar to saline soils reduced salt stress and increased plant growth directly through the release of important macro- and micronutrients such as Ca, K, N, P, and Zn in soil to help counter the negative effects of salts, according to laboratory and field research [47,48]. Because salt-stressed plants accumulate Na and have impaired K nutrition [49], increasing the K/Na ratio via increasing K availability is thought to be a valuable technique for increasing plant growth and yield in saline soils [50]. Biochar may enhance K content in soils, depending on the feedstock, and such an increase in salt-affected soils to counteract the negative effects of Na is regarded one of the key benefits of biochar application [49]. In addition, biochar has been shown to improve plant growth in salt-affected soils through a variety of indirect benefits, including (i) reduced availability and uptake of toxic salts such as Na through adsorption onto biochar surfaces, or physical entrapment of Na in fine pores of biochar, or improved leaching from the soil profile [51]; (ii) improvement in physical, chemical, and biological properties of salt-affected soils [52]; (iii) reduction in oxidation stress [53]; (iv) reduction in osmotic stress [54]; (v) lower production of phytohormones [55]; (vi) improved stomatal density and conductance [56]; (vii) improved seed germination [57]; and (viii) promotion of microbial activities and a bacterial community shift toward beneficial taxa in the rhizosphere [57].
Biochar amendment increased the photosynthesis and antioxidative system in Malus hupehensis seedlings as a defense mechanism against biotic stress [58]. Biochar has been cited as a crucial factor in the increased synthesis of photosynthesis pigments due to its high mineral concentration [59]. Reduced unsaturated fatty acid content in membrane lipids increase vulnerability to salt stress, whereas increased unsaturated fatty acid content promotes salinity tolerance [60]. In this present study, C18:1 and C18:3 increased in wheat plants amended with biochar. Application of biochar singly or in combination with AMF in soil with excessive soluble Na+ level increased C16:1, C18:1, and C18:3 content of wheat. Conversely, at moderate salinity (50 mM), C18:1 and C18:3 were both increased and later decreased at high salinity (100–150 mM) under AMF application. This could be due to biochar’s high adsorption capacity, which helps to alleviate the negative effect of salinity by reducing the uptake of Na+ [61].
The antioxidant enzymes activity helps plants to mitigate salinity stress. Free radicals predispose plant tissues to injuries, and antioxidant enzymes neutralize the harmful effects of free radicals [21]. From our results, exclusive application of biochar or its combination with AMF increased antioxidant enzymes activity and photosynthetic pigments of wheat. Rao et al. [44] described enhanced antioxidant enzymes activity and photosynthetic rate as an antioxidative strategy in drought-stressed crop plants. Very few reports have discussed the impacts of the combined application of AMF and biochar. Our results demonstrate that co-application of biochar and AMF mitigated the negative impact of salinity stress in wheat more than their individual applications. This may partly be ascribed to the protective effect of biochar on fungi, making the co-application of AMF and biochar more effective than exclusive AMF application. This agrees with a previous study by AbeerHashem et al. [62] on chickpea under drought stress. The increased antioxidant enzyme activities induced by the interactive actions of AMF and biochar may have enhanced the synthesis of photosynthetic pigments and the production of unsaturated fatty acids for salinity stress mitigation through maintenance of tissue osmolarity [63].
Furthermore, high salinity stress suppressed the beneficial effects of AMF, which was consistent with the previous study on E. maackii seedlings [64]. This may have occurred through the osmotic and toxic effects of salt on fungi species, as previously reported by Juniper et al. [65]. Our results also corroborate the findings of Allakhverdiev et al. [66], who established that AMF are no longer effective in minimizing the deleterious effect of high salinity stress on plants. These may have accounted for the decline in mycorrhizal intensity in salinity-stressed wheat plant roots. According to an earlier study by Alqarawi et al. [67], AMF inoculation may have increased unsaturated fatty acid concentrations in cellular membranes, allowing them to maintain functional and structural integrity.
High salinity had an inhibitory effect on POD activity in the wheat plants under either individual or combined AMF and biochar amendments. These results indicate that under varied soil amendments, plants respond differently to stressful conditions. This is in sharp contrast with a study by Mohammad et al. [68] in Pisum sativum grown in elevated arsenic soils. The sole application of AMF failed to mitigate the effect of high salinity stress on the activity of SOD and the photosynthetic pigments. Our results contradict the report of [69], which displayed that soil amendment with AMF increased the antioxidant enzymes activity and photosynthetic pigments in Acacia gerrardii under salinity stress.
The detrimental effect of NaCl was mitigated by the application of biochar, which reduced Na+ intake. This is consistent with the report of Akhtar et al. [63], who found that biochar application was efficient in relieving salt stress in potatoes, resulting in increased salinity-stressed potato production. Biochar has a high capacity for adsorption. It adsorbs Na+ to prevent the plant from absorbing it. Under salt stress Farhangi-Abriz and Torabian [53] discovered that biochar lowered Na+ levels in the roots. Plant growth is aided by lower Na+ levels in the roots. As a result, biochar application promotes root growth, which improves plant growth and yield under salinity stress. The increase in K in the soil after harvest could be the result of the application of biochar. Furthermore, by improving soil water availability, biochar application lowered osmotic stress. The inoculation of AMF with biochar increased soil accessible P, indicating that biochar provided an adsorption complex for cation and anion exchange required for plant growth, according to Major [70]. Mau and Utami [71], who also reported a significant increase in total soil P, indicated that such increase could be because of improved balance of soluble and adsorbed P. Statistically, biochar and its interaction with AMF did not significantly increase soil pH relative to that of the control (Figure 5D). This observation is consistent with the study of Ndiate et al. [22], which showed no significant relationship for biochar or biochar-AMF interaction with soil pH. The interaction of biochar and AMF that induced increase in total soil P is a result of the large surface area provided by biochar that created a better habitat for the activities of soil microbes [71,72,73]. The ability of biochar in combination with AMF to ameliorate the harmful effects of salt stress is demonstrated in this study by an improvement in photosynthetic rate. However, the possible influence of biochar and AMF on agronomic crops and their production can vary depending on the unique impacts of biochar on soil type. Depending on the soil composition and climatic conditions in specific locations, the findings of this study could be applied to numerous species of AMF, such as Glomus fasciculatum, Glomus fasciculatus, Glomus monosporus, and Glomus deserticola. As a result, further long-term field research is required to determine the synergistic potential of biochar and AMF in promoting plant growth, as well as their effects on salinity in plants affected by using brackish (low-quality) water in agricultural soils.
5. Conclusions
High salinity in soils induced oxidative stress in wheat and consequently decreased unsaturated fatty acids and antioxidant enzymes activity along with reduced photosynthetic pigments, which inevitably resulted in decreased growth parameters. However, the synergistic effect of AMF and biochar was extremely effective in maintaining or increasing unsaturated fatty acids C18:1, C18:2, and C18:3 and in improving the activity of SOD, chlorophyll content, and carotenoids in wheat in soil treated with extreme Na+ concentration ranging from 50 to 150 mM NaCl. In addition, soil amendment with exclusive biochar application enhanced or maintained antioxidant enzymes activity SOD; unsaturated fatty acid content such as C18:1, C18:2, and C18:3; and photosynthetic pigments and subsequently improved height, SFW, and RFW of wheat grown in saline soil at 50 and 100 mM NaCl. It is recommended that high saline soils can be mitigated with the co-application of AMF and biochar in wheat. Still, due of the specific impacts of biochar on the soil type, the potential impact of biochar and AMF on agronomic crops and their production can vary. The findings of the current study could be extended to various strains of AMF—i.e., Glomus fasciculatum, Glomus fasciculatus, Glomus monosporus, and Glomus deserticola—depending on the soil composition and climatic circumstances of specific places. Therefore, more field research is needed on the sustainable basis for identifying the synergistic potential of biochar and AMF in boosting plant growth, as well as their impacts on salinity in plants that are simultaneously affected by the utilization of brackish (poor quality) water in agricultural soils.
Author Contributions
Conceptualization, N.I.N.; writing—original draft preparation, N.I.N.; methodology, N.I.N.; software, N.I.N.; formal analysis, N.I.N.; writing and editing, N.I.N., Q.u.Z.; M.A., A.K., D.G., A.R., I.N.F., F.U.H. and O.A.D., Review, D.G. and C.L.; supervision. All authors have read and agreed to the published version of the manuscript.
Funding
This work was supported by National Natural Science Foundation of China (41661049, 31571594), and the Scientific Research Start-up Funds for Openly-Recruited Doctors (GAU-KYQD-2018-39).
Institutional Review Board Statement
Not applicable.
Informed Consent Statement
Not applicable.
Data Availability Statement
Not applicable.
Acknowledgments
We thank Richard Dormatey for his assistance during the preparation of this manuscript.
Conflicts of Interest
The authors declare no conflict of interest.
References
- Umar, K.B. Wheat: Post-Harvest Operations; Agricultural Research Council (PARC): Islamabad, Pakistan; Food and Agriculture Organization of the United Nations (FAO): Rome, Italy, 1999.
- Scott, R.; Jikun, H. China and World Wheat Markets: Assessing Supply, Demand, and Trade in China; Center for Chinese Agricultural Policy: Beijing, China, 1998; Volume 2. [Google Scholar]
- McCance, R.A.; Widdowson, E.M.; Moran, T.; Pringle, W.J.S.; Macrae, T.F. The chemical composition of wheat and rye and flours derived therefrom. Biochem. J. 1945, 39, 213–222. [Google Scholar] [CrossRef] [PubMed] [Green Version]
- Spragg, J. Benefit to Australian grain growers in the feed grain market. In A Report for the Grains Research and Development Corporation; JCS Solutions Pvt Ltd. GRDC: Canberra, Australia, 2008; pp. 26–31. [Google Scholar]
- Gao, L.; Wang, S.D.; Oomah, B.D.; Mazza, G. Wheat quality: Antioxidant activity of wheat millstreams. In Wheat Quality Elucidation; AACC International: St. Paul, MN, USA, 2002; pp. 219–233. [Google Scholar]
- Hazzledine, M.; Pine, A.; Mackinson, I.; Ratcliffe, J.; Salmon, L.; Levels, R.; Staffs, W. Estimating Displacement Ratios of Wheat DDGS in Animal Feed Rations in Great Britain; A working paper (2011–2018) commissioned by the International Council on Clean Transportation; ICCT: Washington, DC, USA, 2011. [Google Scholar]
- Asgari, H.R.; Cornelis, W.; Damme, P.V. Salt stress effect on wheat (Triticum aestivum L.) growth and leaf ion concentrations. Int. J. Plant Prod. 2012, 6, 195–208. [Google Scholar] [CrossRef]
- Bacu, A.; Comashi, K.; Hoxhaj, M.; Ibro, V. GSTF1 gene expression at local Albanian wheat cultivar Dajti under salinity and heat conditions. EuroBiotech J. 2017, 1, 253–257. [Google Scholar] [CrossRef] [Green Version]
- Haq, T.U.; Gorham, J.; Akhtar, J.; Akhtar, N.; Steele, K.A. Dynamic quantitative trait loci for salt stress components on chromosome 1 of rice. Funct. Plant Biol. 2010, 37, 634–645. [Google Scholar] [CrossRef]
- Niamat, B.; Naveed, M.; Ahmad, Z.; Yaseen, M.; Ditta, A.; Mustafa, A.; Rafique, M.; Bibi, R.; Sun, N.; Xu, M. Calcium-Enriched Animal Manure Alleviates the Adverse Effects of Salt Stress on Growth, Physiology and Nutrients Homeostasis of Zea mays L. Plants 2019, 8, 480. [Google Scholar] [CrossRef] [Green Version]
- Guo, Q.; Liu, L.; Barkla, B.J. Membrane Lipid Remodeling in Response to Salinity. Int. J. Mol. Sci. 2019, 20, 4264. [Google Scholar] [CrossRef] [Green Version]
- Mata-Pérez, C.; Sánchez-Calvo, B.; Padilla, M.N.; Begara-Morales, J.C.; Luque, F.; Melguizo, M.; Jiménez-Ruiz, J.; Fierro-Risco, J.; Peñas-Sanjuán, A.; Valderrama, R.; et al. Nitro-Fatty Acids in Plant Signaling: Nitro-Linolenic Acid Induces the Molecular Chaperone Network in Arabidopsis. Plant Physiol. 2015, 170, 686–701. [Google Scholar] [CrossRef]
- Mikami, K.; Murata, N. Membrane fluidity and the perception of environmental signals in cyanobacteria and plants. Prog. Lipid Res. 2003, 42, 527–543. [Google Scholar] [CrossRef]
- Shafi, M.; Bakht, J.; Hassan, M.J.; Raziuddin, M.; Zhang, G. Effect of Cadmium and Salinity Stresses on Growth and Antioxidant Enzyme Activities of Wheat (Triticum aestivum L.). Bull. Environ. Contam. Toxicol. 2009, 82, 772–776. [Google Scholar] [CrossRef]
- Mohammad, Z.A.; Lynne, C.B.; Md-Anamul, H.; Golam, J.A. Effect of soil amendments on antioxidant activity and photosynthetic pigments in pea crops grown in arsenic-contaminated soil. Heliyon 2020, 6, e05475. [Google Scholar]
- Gara, L.D.; Pinto, M.C.; Tommasi, F. The antioxidant systems vis-à-vis reactive species during plant-pathogen interaction. Plant Physiol. Biochem. 2003, 41, 863–870. [Google Scholar] [CrossRef]
- Oyiga, B.C.; Sharma, R.C.; Shen, J.; Baum, M.; Ogbonnaya, F.C.; Léon, J.; Ballvora, A. Identification and Characterization of Salt Tolerance of Wheat Germplasm Using a Multivariable Screening Approach. J. Agron. Crop Sci. 2016, 202, 472–485. [Google Scholar] [CrossRef]
- Evelin, H.; Kapoor, R. Arbuscular mycorrhizal symbiosis modulates antioxidant response in salt-stressed Trigonella foenum-graecum plants. Mycorrhiza 2013, 24, 197–208. [Google Scholar] [CrossRef]
- Cui, Q.; Xia, J.; Yang, H.; Liu, J.; Shao, P. Biochar and effective microorganisms promote Sesbania cannabina growth and soil quality in the coastal saline-alkali soil of the Yellow River Delta, China. Sci. Total Environ. 2021, 756, 143801. [Google Scholar] [CrossRef]
- Tahir, A.; Muhammad, R.; Shafaqat, A.; Muhammad, Z. Effect of biochar on cadmium bioavailability and uptake in wheat (Triticum aestivum L.) growth in a soil with aged contamination. Ecotoxicol. Environ. Saf. 2017, 140, 37–47. [Google Scholar]
- Annunziata, M.G.; Ciarmiello, L.F.; Woodrow, P.; Maximova, E.; Fuggi, A.; Carillo, P. Durum wheat roots adapt to salinity remodelling the cellular content of nitrogen metabolites and sucrose. Front. Plant Sci. 2017, 7, 2035. [Google Scholar] [CrossRef] [Green Version]
- Ndiate, N.I.; Saeed, Q.; Haider, F.U.; Liqun, C.; Nkoh, J.N.; Mustafa, A. Co-Application of Biochar and Arbuscular mycorrhizal Fungi Improves Salinity Tolerance, Growth and Lipid Metabolism of Maize (Zea mays L.) in an Alkaline Soil. Plants 2021, 10, 2490. [Google Scholar] [CrossRef] [PubMed]
- Walkley, A.; Black, D.R. An examination of the digestion method for determination soil organic matter and proposed modification of the chronic acid titration method. Soil Sci. 1935, 37, 29–38. [Google Scholar] [CrossRef]
- Jackson, M.L. Soil Chemical Analysis; Prentice Hall: New Delhi, India, 1973. [Google Scholar]
- Olsen, S.R.; Sommers, L.E. Phosphorus; American Society of Agronomy: Madison, WI, USA, 1982; pp. 403–430. [Google Scholar]
- Mia, S.; Uddin, N.; Hossain, S.A.A.M.; Amin, R.; Mete, F.Z.; Hiemstra, T. Production of biochar for soil application: A comparative study of three kiln models. Pedosphere 2015, 25, 696–702. [Google Scholar] [CrossRef]
- Nelson, D.W.; Sommers, L.E. Total Carbon, Organic Carbon, and Organic Matter. In Methods of Soil Analysis Part 3—Chemical Methods; SSSA Book Series; Soil Science Society of America, Inc.: Madison, WI, USA, 1996; pp. 961–1010. [Google Scholar]
- Sparks, D.L.; Page, A.L.; Helmke, P.A.; Loeppert, R.H.; Soltanpour, P.N.; Tabatabai, M.A.; Johnston, C.T.; Summer, M.E. Methods of Soil Analysis, Parts 2 and 3 Chemical Analysis; Soil Science Society of America Inc.: Madison, WI, USA, 1996. [Google Scholar]
- Association of Official Agricultural Chemists. Official Methods of Analysis, 10th ed.; AOAC: Washington, WA, USA, 1965; pp. 308, 764, 757. [Google Scholar]
- Gerdemann, J.W.A.; Nicolson, T.H. Species of mycorrhizal endogone species extracted from soil by wet sieving and decanting method. Trans. Br. Mycol. Soc. 1963, 46, 235–246. [Google Scholar] [CrossRef]
- Giovanetti, M.; Mosse, B. An evaluation of techniques for measuring vesicular mycorrhizal infection in roots. New Phytol. 1980, 97, 447–453. [Google Scholar] [CrossRef]
- Hariadi, Y.; Marandon, K.; Tian, Y.; Jacobsen, S.-E.; Shabala, S. Ionic and osmotic relations in quinoa (Chenopodium quinoa Willd.) plants grown at various salinity levels. J. Exp. Bot. 2010, 62, 185–193. [Google Scholar] [CrossRef] [PubMed] [Green Version]
- Xu, Y.; Siegenthaler, P.A. Low Temperature Treatments Induce an Increase in the Relative Content of Both Linolenic and Δ3-trans-Hexadecenoic Acids in Thylakoid Membrane Phosphatidylglycerol of Squash Cotyledons. Plant Cell Physiol. 1997, 38, 611–618. [Google Scholar] [CrossRef] [Green Version]
- Beauchamp, C.O.; Fridovich, I. Isozymes of superoxide dismutase from wheat germ. BBA Protein Struct. 1973, 317, 50–64. [Google Scholar] [CrossRef]
- Maehly, A.C.; Chance, B. The assay of catalases and peroxidases. Methods Biochem. Anal. 1954, 1, 357–424. [Google Scholar] [CrossRef]
- Arnon, D.I. Copper Enzymes in Isolated Chloroplasts. Polyphenoloxidase in Beta vulgaris. Plant Physiol. 1949, 24, 1–15. [Google Scholar] [CrossRef] [PubMed] [Green Version]
- Khan, M.Y.; Haque, M.M.; Molla, A.H.; Rahman, M.M.; Alam, M.Z. Antioxidant compounds and minerals in tomatoes by Trichoderma-enriched biofertilizer and their relationship with the soil environments. J. Integr. Agric. 2017, 16, 691–703. [Google Scholar] [CrossRef]
- Philips, J.M.; Hayman, D.A. Improved Procedures for Clearing Roots and Staining Parasitic and Vesicu-lar-Arbuscular Mycorrhizal Fungi for Rapid Assessment of Infection. Trans. Br. Mycol. Soc. 1970, 55, 158–161. [Google Scholar] [CrossRef]
- Trouvelot, A.; Kough, J.L.; Gianinazzi-Pearson, V. Mesure du taux de mycorhization VA d’un systeme radi- culaire. Recherche de methods d’estimation ayant une signification fonctionnelle. In Physiological and Genetical Aspects of Mycorrhizae; Gianinazzi-Pearson, V., Gianinazzi, S., Eds.; INRA: Paris, France, 1986; pp. 217–221. [Google Scholar]
- Mehari, Y.; Elad, D.; Rav-David, E.R.; Graber, Y.M.H. Induced systemic resistance in tomato (Solanum Lycopersicum) against Botrytis cinerea by biochar amendment involves jasmonic acid signaling. Plant Soil. 2015, 395, 31–44. [Google Scholar] [CrossRef]
- Abeer, H.; Abd_Allah, E.F.; Alqarawi, A.A.; Al-Huqail, A.A.; Shah, M.A. Induction of Osmoregulation and Modulation of Salt Stress in Acacia gerrardii Benth. by Arbuscular Mycorrhizal Fungi and Bacillus subtilis (BERA 71). BioMed Res. Int. 2016, 2016, 6294098. [Google Scholar]
- Bohnert, H.J.; Nelson, D.E.; Jensen, D.G. Adaptations to environmental stresses. Plant Cell 1995, 7, 1099–1111. [Google Scholar] [CrossRef] [PubMed]
- Ben Ammar, W.; Nouairi, I.; Zarrouk, M.; Jemal, F. Cadmium stress induces changes in the lipid composition and biosynthesis in tomato (Lycopersicon esculentum Mill.) leaves. Plant Growth Regul. 2007, 53, 75–85. [Google Scholar] [CrossRef]
- Rao, D.; Chaitanya, K.V. Photosynthesis and antioxidative defense mechanisms in deciphering drought stress tolerance of crop plants. Biol. Plant. 2016, 60, 201–218. [Google Scholar] [CrossRef]
- Ved, P.; Sukhbir, S. Potential of Biochar Application to mitigate Salinity stress in Eggplant. HortScience 2020, 55, 1946–1955. [Google Scholar]
- Sui, N.; Wang, Y.; Liu, S.; Yang, Z.; Wang, F.; Wan, S. Transcriptomic and Physiological Evidence for the Relationship between Unsaturated Fatty Acid and Salt Stress in Peanut. Front. Plant Sci. 2018, 9, 7. [Google Scholar] [CrossRef] [Green Version]
- Kim, H.-S.; Kim, K.-R.; Yang, J.E.; Ok, Y.S.; Owens, G.; Nehls, T.; Wessolek, G.; Kim, K.-H. Effect of biochar on reclaimed tidal land soil properties and maize (Zea mays L.) response. Chemosphere 2016, 142, 153–159. [Google Scholar] [CrossRef]
- Haider, F.U.; Coulter, J.A.; Cai, L.; Hussain, S.; Alam Cheema, S.; Wu, J.; Zhang, R. An overview on biochar production, its implications, and mechanisms of biochar-induced amelioration of soil and plant characteristics. Pedosphere 2021, 32, 107–130. [Google Scholar] [CrossRef]
- Saifullah; Dahlawi, S.; Naeem, A.; Rengel, Z.; Naidu, R. Biochar application for the remediation of salt-affected soils: Challenges and opportunities. Sci. Total Environ. 2018, 625, 320–335. [Google Scholar] [CrossRef]
- Chakraborty, K.; Bhaduri, D.; Meena, H.N.; Kalariya, K. External potassium (K+) application improves salinity tolerance by promoting Na+-exclusion, K+-accumulation and osmotic adjustment in contrasting peanut cultivars. Plant Physiol. Biochem. 2016, 103, 143–153. [Google Scholar] [CrossRef]
- Abbas, T.; Rizwan, M.; Ali, S.; Adrees, M.; Zia-Ur-Rehman, M.; Qayyum, M.F.; Ok, Y.S.; Murtaza, G. Effect of biochar on alleviation of cadmium toxicity in wheat (Triticum aestivum L.) grown on Cd-contaminated saline soil. Environ. Sci. Pollut. Res. 2017, 25, 25668–25680. [Google Scholar] [CrossRef]
- Agbna, G.; Ali, A.; Bashir, A.; Eltoum, F.; Hassan, M. Influence of biochar amendment on soil water characteristics and crop growth enhancement under salinity stress; Works Kambohwell Publishers Enterprise. Int. J. Eng. 2017, 4, 49–54. [Google Scholar]
- Farhangi-Abriz, S.; Torabian, S. Biochar Increased Plant Growth-Promoting Hormones and Helped to Alleviates Salt Stress in Common Bean Seedlings. J. Plant Growth Regul. 2017, 37, 591–601. [Google Scholar] [CrossRef]
- Ali, S.; Rizwan, M.; Qayyum, M.F.; Ok, Y.S.; Ibrahim, M.; Riaz, M.; Arif, M.S.; Hafeez, F.; Al-Wabel, M.I.; Shahzad, A.N. Biochar soil amendment on alleviation of drought and salt stress in plants: A critical review. Environ. Sci. Pollut. Res. Int. 2017, 24, 12700–12712. [Google Scholar] [CrossRef] [PubMed]
- Lashari, M.S.; Ye, Y.; Ji, H.; Li, L.; Kibue, G.W.; Lu, H.; Zheng, J.; Pan, G. Biochar-manure compost in conjunction with pyroligneous solution alleviated salt stress and improved leaf bioactivity of maize in a saline soil from central China: A 2-year field experiment. J. Sci. Food Agric. 2014, 95, 1321–1327. [Google Scholar] [CrossRef]
- Thomas, S.C.; Frye, S.; Gale, N.; Garmon, M.; Launchbury, R.; Machado, N.; Melamed, S.; Murray, J.; Petroff, A.; Winsborough, C. Biochar mitigates negative effects of salt additions on two herbaceous plant species. J. Environ. Manag. 2013, 129, 62–68. [Google Scholar] [CrossRef] [PubMed]
- Zheng, H.; Wang, X.; Chen, L.; Wang, Z.; Xia, Y.; Zhang, Y.; Wang, H.; Luo, X.; Xing, B. Enhanced growth of halophyte plants in biochar-amended coastal soil: Roles of nutrient availability and rhizosphere microbial modulation. Plant Cell Environ. 2017, 41, 517–532. [Google Scholar] [CrossRef]
- Milla, E.B.; Rivera, W.J.; Huang, C.C.; Chien, Y.M. Wang Agronomic properties and characterization of rice husk and wood biochars and their effect on the growth of water spinach in a field test. J. Soil Sci. Plant Nutr. 2013, 13, 251–266. [Google Scholar]
- Cheng, S.; Yang, Z.; Wang, M.; Song, J.; Sui, N.; Fan, H. Salinity improves chilling resistance in Suaeda salsa. Acta Physiol. Plant. 2014, 36, 1823–1830. [Google Scholar] [CrossRef]
- Allakhverdiev, S.; Nishiyama, Y.; Suzuki, I.; Tasaka, Y.; Murata, N. Genetic engineering of the unsaturation of fatty acids in membrane lipids alters the tolerance of Synechocystis to salt stress. Proc. Natl. Acad. Sci. USA 1999, 96, 5862–5867. [Google Scholar] [CrossRef] [Green Version]
- Thakur, S.; Singh, L.; Zularisam, A.W.; Sakinah, M.; Din, M.F.M. Lead-induced oxidative stress and alteration in the activities of antioxidative enzymes in rice shoots. Biol. Plant. 2017, 61, 595–598. [Google Scholar] [CrossRef]
- Hashem, A.; Kumar, A.; Al-Dbass, A.M.; Alqarawi, A.A.; Al-Arjani, A.B.F.; Singh, G.; Abd_Allah, E.F. Arbuscular mycorrhizal fungi and biochar improve drought tolerance in chickpea. Saudi J. Biol. Sci. 2019, 26, 614–624. [Google Scholar] [CrossRef] [PubMed]
- Akhtar, S.S.; Andersen, M.N.; Liu, F. Biochar mitigates salinity stress in potato. J. Agron. Crop Sci. 2015, 201, 368–378. [Google Scholar] [CrossRef]
- Li, Z.; Wu, N.; Meng, S.; Wu, F.; Liu, T. Arbuscular mycorrhizal fungi (AMF) enhance the tolerance of Euonymus maackii Rupr. at a moderate level of salinity. PLoS ONE 2020, 15, e0231497. [Google Scholar] [CrossRef] [PubMed]
- Juniper, S.; Abbott, L.K. Soil salinity delays germination and limits the growth of hyphae from propagules of arbuscular mycorrhizal fungi. Mycorrhiza 2006, 16, 371–379. [Google Scholar] [CrossRef] [PubMed]
- Allakhverdiev, S.I.; Kinoshita, M.; Inaba, M.; Suzuki, I.; Murata, N. Unsaturated fatty acids in membrane lipids protect the photosynthetic machinery against salt-induced damage in Synechoccus. Plant Physiol. 2001, 125, 1842–1853. [Google Scholar] [CrossRef] [PubMed] [Green Version]
- Alqarawi, A.A.; Abd Allah, E.F.; Hashem, A. Alleviation of salt-induced adverse impact via mycorrhizal fungi in Ephedra aphylla Forssk. J. Plant Inter. 2014, 9, 802–810. [Google Scholar] [CrossRef] [Green Version]
- Ndiaye, I.N.; Cai, L.Q.; Jackson, N.N. Importance of soil amendments with biochar and/or Arbuscular Mycorrhizal fungi to mitigate aluminum toxicity in tamarind (Tamarindus indica L.) on an acidic soil: A greenhouse study. Heliyon 2022, 8, e09009. [Google Scholar] [CrossRef]
- Pooja, S.; Rajesh, K. Soil salinity: A serious environmental issue and plant growth-promoting bacteria as one of the tools for its alleviation. Saudi J. Biol. Sci. 2015, 22, 123–131. [Google Scholar]
- Major, J.; Rondon, M.; Molina, D.; Riha, S.J.; Lehmann, J. Maize yield and nutrition during 4 years after biochar application to a Colombian savanna oxisol. Plant Soil 2010, 333, 117–128. [Google Scholar] [CrossRef]
- Mau, A.E.; Utami, S.R. Effects of biochar amendment and arbuscular mycorrhizal fungi inoculation on availability of soil phosphorus and growth of maize. J. Degrad. Min. Lands Manag. 2014, 1, 69–74. [Google Scholar]
- Haider, F.U.; Farooq, M.; Hussain, S.; Cheema, S.A.; Ain, N.U.; Virk, A.L.; Ejaz, M.; Janyshova, U.; Liqun, C. Biochar application for the remediation of trace metals in contaminated soils: Implications for stress tolerance and crop production; update. Ecotoxicol. Environ. Saf. 2022, 230, 113165. [Google Scholar] [CrossRef] [PubMed]
- Haider, F.U.; Coulter, J.A.; Cheema, S.A.; Farooq, M.; Wu, J.; Zhang, R.; Shuaijie, G.; Liqun, C. Co-application of biochar and microorganisms improves soybean performance and remediate cadmium-contaminated soil. Ecotoxicol. Environ. Saf. 2021, 214, 112112. [Google Scholar] [CrossRef] [PubMed]

Publisher’s Note: MDPI stays neutral with regard to jurisdictional claims in published maps and institutional affiliations. |
© 2022 by the authors. Licensee MDPI, Basel, Switzerland. This article is an open access article distributed under the terms and conditions of the Creative Commons Attribution (CC BY) license (https://creativecommons.org/licenses/by/4.0/).