Article

Multispectral Analysis of Small Plots Based on Field and Remote Sensing Surveys—A Comparative Evaluation

1
Institute of Crop Sciences, Faculty of Agricultural and Food Sciences and Environmental Management, University of Debrecen, Böszörményi Str. 138, H-4032 Debrecen, Hungary
2
Institute of Water and Environmental Management, Faculty of Agricultural and Food Sciences and Environmental Management, University of Debrecen, Böszörményi Str. 138, H-4032 Debrecen, Hungary
3
Institute of Land Use, Engineering and Precision Farming Technology, Faculty of Agricultural and Food Sciences and Environmental Management, University of Debrecen, Böszörményi Str. 138, H-4032 Debrecen, Hungary
4
Institutes for Agricultural Research and Educational Farm, University of Debrecen, Böszörményi Str. 138, H-4032 Debrecen, Hungary
*
Author to whom correspondence should be addressed.
Sustainability 2022, 14(6), 3339; https://doi.org/10.3390/su14063339
Submission received: 31 January 2022 / Revised: 28 February 2022 / Accepted: 9 March 2022 / Published: 12 March 2022
(This article belongs to the Special Issue Applying Remote Sensing for Sustainable Land Use Changes)

Abstract

:
Remote sensing is an efficient method of monitoring experiments rapidly and by enabling the collection of significantly more detailed data, than using only field measurements, ensuring new possibilities in scientific research. A small plot field experiment was conducted in a randomized block design with winter oat (Avena sativa L.) varieties in Debrecen, Hungary in the 2020/2021 cropping year. Multiple field measurements and aerial surveys were carried out examining the response of oat on Silicon and Sulfur foliar fertilization treatments thereby monitoring their effects on the physiology, production and stress tolerance. Parallel application of in situ (elevation, soil pH, NDVI, SPAD, chlorophyll content) and aerial (NDVI, NDRE) surveys including unmanned aerial vehicles (UAVs) provided a diverse source of data for evaluation. Both the oat varieties (88.9%) and the foliar fertilization treatments (87.5%) were correctly classified and clearly separated with the discriminant analysis based on measured data. The Pearson correlation analysis showed a very strong positive connection (r = 0.895–1.00) between the NDVI values measured using a hand-held system and UAV-installed camera, except the third measurement time, where the correlation was weaker (r = 0.70). Our results indicate that field experiments can be effectively supported by UAVs.

1. Introduction

There has been an increase in concern about food security and sustainable agricultural development in the world recently, of which one of the main components is the actual estimation of supply and demand of crops such as oat (Avena sativa L.). Oat is the sixth most grown cereal globally [1] and the fifth most important in Europe [2]. The assessment of biomass and yield before actual production is crucial as it determines policies and decisions in the agricultural production system, due to the rising demand for food grain around the world [3]. The temperature in Hungary is raising [4,5], which is accompanied by a decrease in precipitation and an increase in the frequency of droughts [6].
Observations in agriculture require real-time data on the crops. The close connection between the canopy Leaf Area Index (LAI) and fAPAR (fraction of Absorbed Photosynthetically Active Radiation) [7,8] explains the viability of remote sensing-based biomass monitoring systems. NDVI can be used as an indirect measure of primary productivity because of its almost linear relationship with fAPAR. NDVI sensors are one of several solutions for nutrient and water management based on the measurement of pigment activity related to photosynthetic activity. NDVI is an indicator of photosynthetically active vegetation, and its value coincides with the specific chlorophyll content and biomass content of the vegetation coverage of the area, hence it gives essential information for farmers [9,10,11,12,13]. In addition, applications of various proximal sensors are available to measure pigment activity related to the photosynthetic activity [14,15]. Multispectral cameras featuring high spatial and temporal resolution images are also effective in determining vegetation coverage and typology, biomass and vegetation analysis [16] for weed management [17] and nutrient supply. Integrated management of macro and micronutrients is considered essential to prevent any deficiency that would lead to productivity reduction. However, some non-essential elements, like Silicon, can enhance the healthy growth, development and yield of different crops [18], mitigating the negative effect of abiotic [19,20] and biotic [21,22] stresses by promoting plant physiological processes. Sulfur deficiencies restrict plant biomass, yield and quality [23]. Sulfur plays an important role in the protection against environmental stresses, too. As Sulfur is not mobile in the plant, a continuous supply of Sulfur is needed for optimum crop performance [24].
Agricultural monitoring systems based on remote sensing are capable of providing timely information on nutrient supply status, growth phases and predicted crop yields [9,25,26], complementing the traditional methodology [27,28,29]. Due to its ability to collect data synoptically, with a large spatial coverage, and possibly at the global scale, interest in deploying satellite-based remote sensing data for crop monitoring and yield forecasts has exploded. Furthermore, remote sensing can provide timely (and potentially real-time) and objective crop growth data at relatively minimal costs. Crop yield estimation and early crop production forecasting are critical for policymakers to make timely decisions when planning for exports. Farmers can quickly identify fields where crop yields are likely to change [30].
Our objectives were to observe the relationship among different field and remote sensing measurements in winter oats. A further aim is to analyze and apply a biomass monitoring system based on Vegetation Indices derived from on-field spot measurement and drone-based imagery. Therefore, elevation, soil pH, NDVI (field and UAV), SPAD, chlorophyll content and other plant parameters were measured.
Hypothesis 1.
There is a strong relationship between the data measured with handheld and UAV sensors.
Hypothesis 2.
It is possible to separate the winter oat varieties and foliar fertilization treatments based on the combination of measured data using discriminant analysis.

2. Materials and Methods

2.1. Soil Characteristics of the Experimental Site

The experiment was conducted in 2020/2021 at the research area of the Debrecen University, Hungary, the coordinates are 47°33′02″ N; 21°35′56″ E. The area has homogeneous chernozem soil, in the World Reference Base for Soil Resources it is Calcic Endofluvic Chernozem (Endosceletic), [31].
The upper layer’s humus content is good (Hu% = 2.70–3.66), and the humus layer’s thickness is roughly 80 cm. The soil plasticity index (KA) was 38. The upper soil layers are slightly alkaline (pHH2O = 8.30–8.43) in acidity. The calcareous soil’s phosphorus supply is very good (AL-soluble P2O5 1076.8–1671.6 mg kg−1), and its potassium supply is also very good (AL-soluble K2O 525.5–658.9 mg kg−1 (Table 1). The sulfate supply is low, which indicates the necessity of Sulfur application. The water table is 6–7 m deep, and the soil has a good water regime.

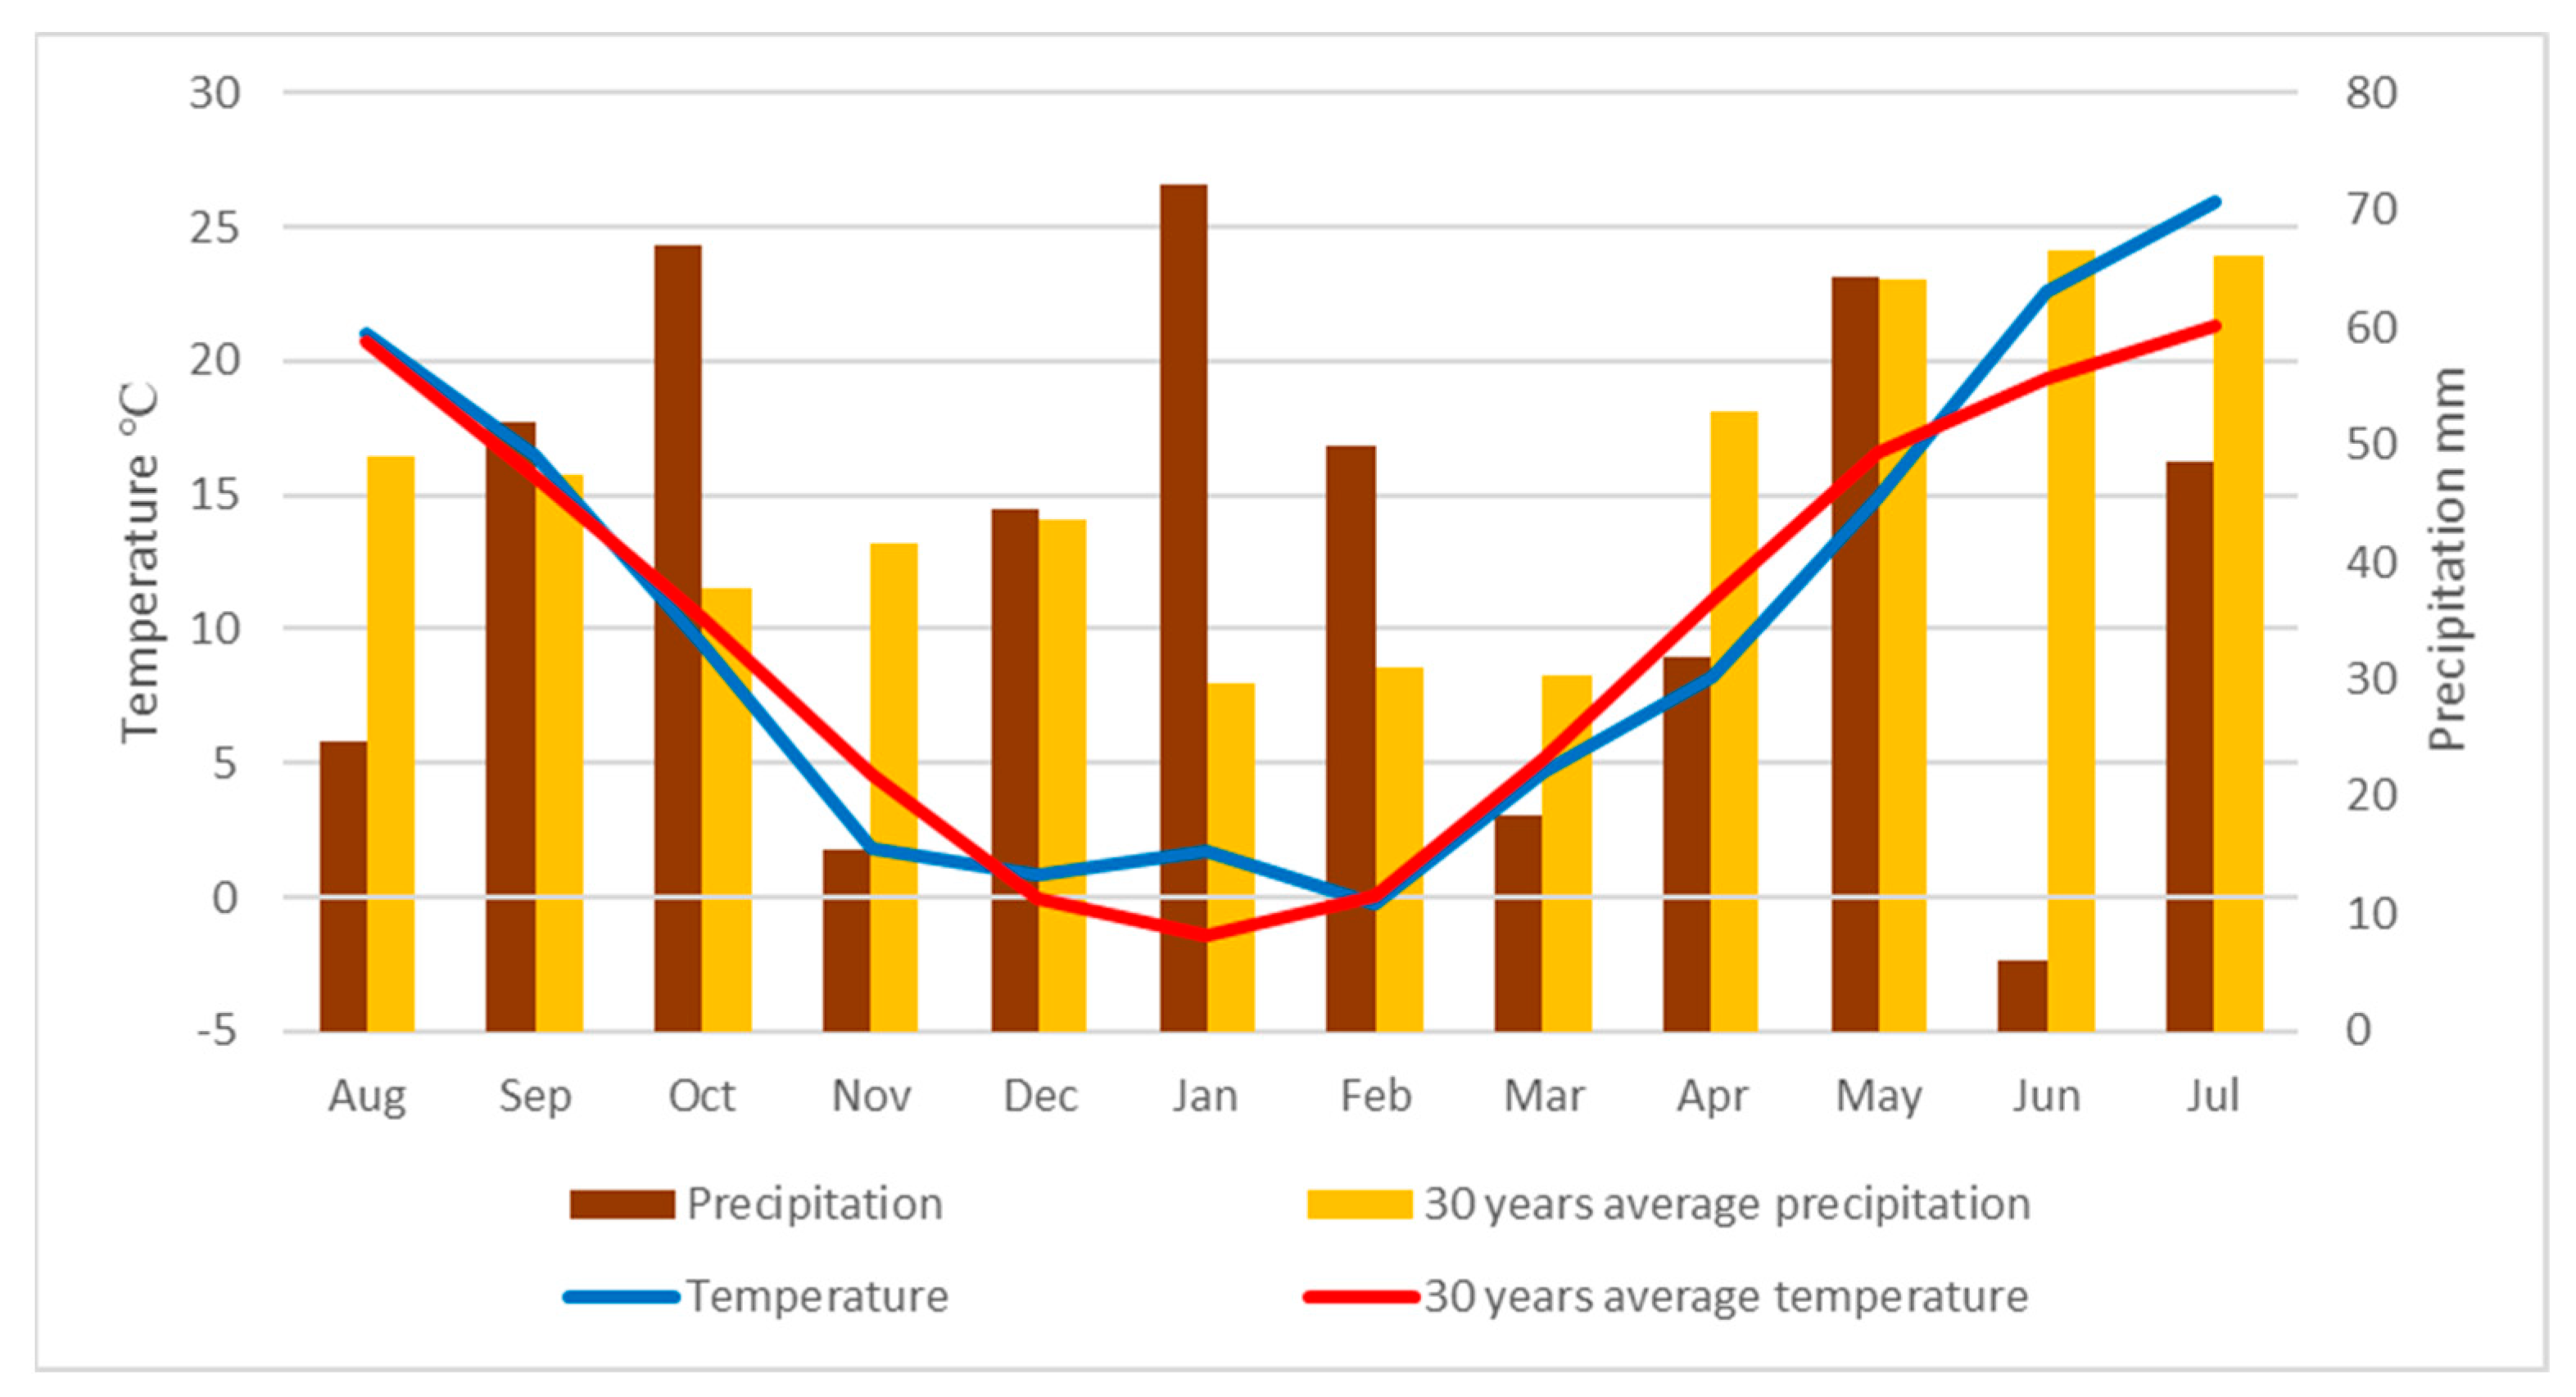
2.2. Weather Characteristics of the Experiment Year

Debrecen’s climate is typical of the continental region, with harsh winters and hot, dry summers, especially in July and August. The 30-year average temperature (1981–2010) is 10.3 °C. The weather characteristics of the experiment year are shown in Figure 1.
The germination and initial development of the winter oat experiment were very favorable, despite the relatively late sowing (26 October 2020) due to above-average rainfall in September–October and a mild and wet winter. A cooler-than-average spring helped the tillering and vegetative development of winter oat varieties. June brought a very long dry period, with temperatures above the 30-year average, which resulted in premature drying and forced maturation of the plants.

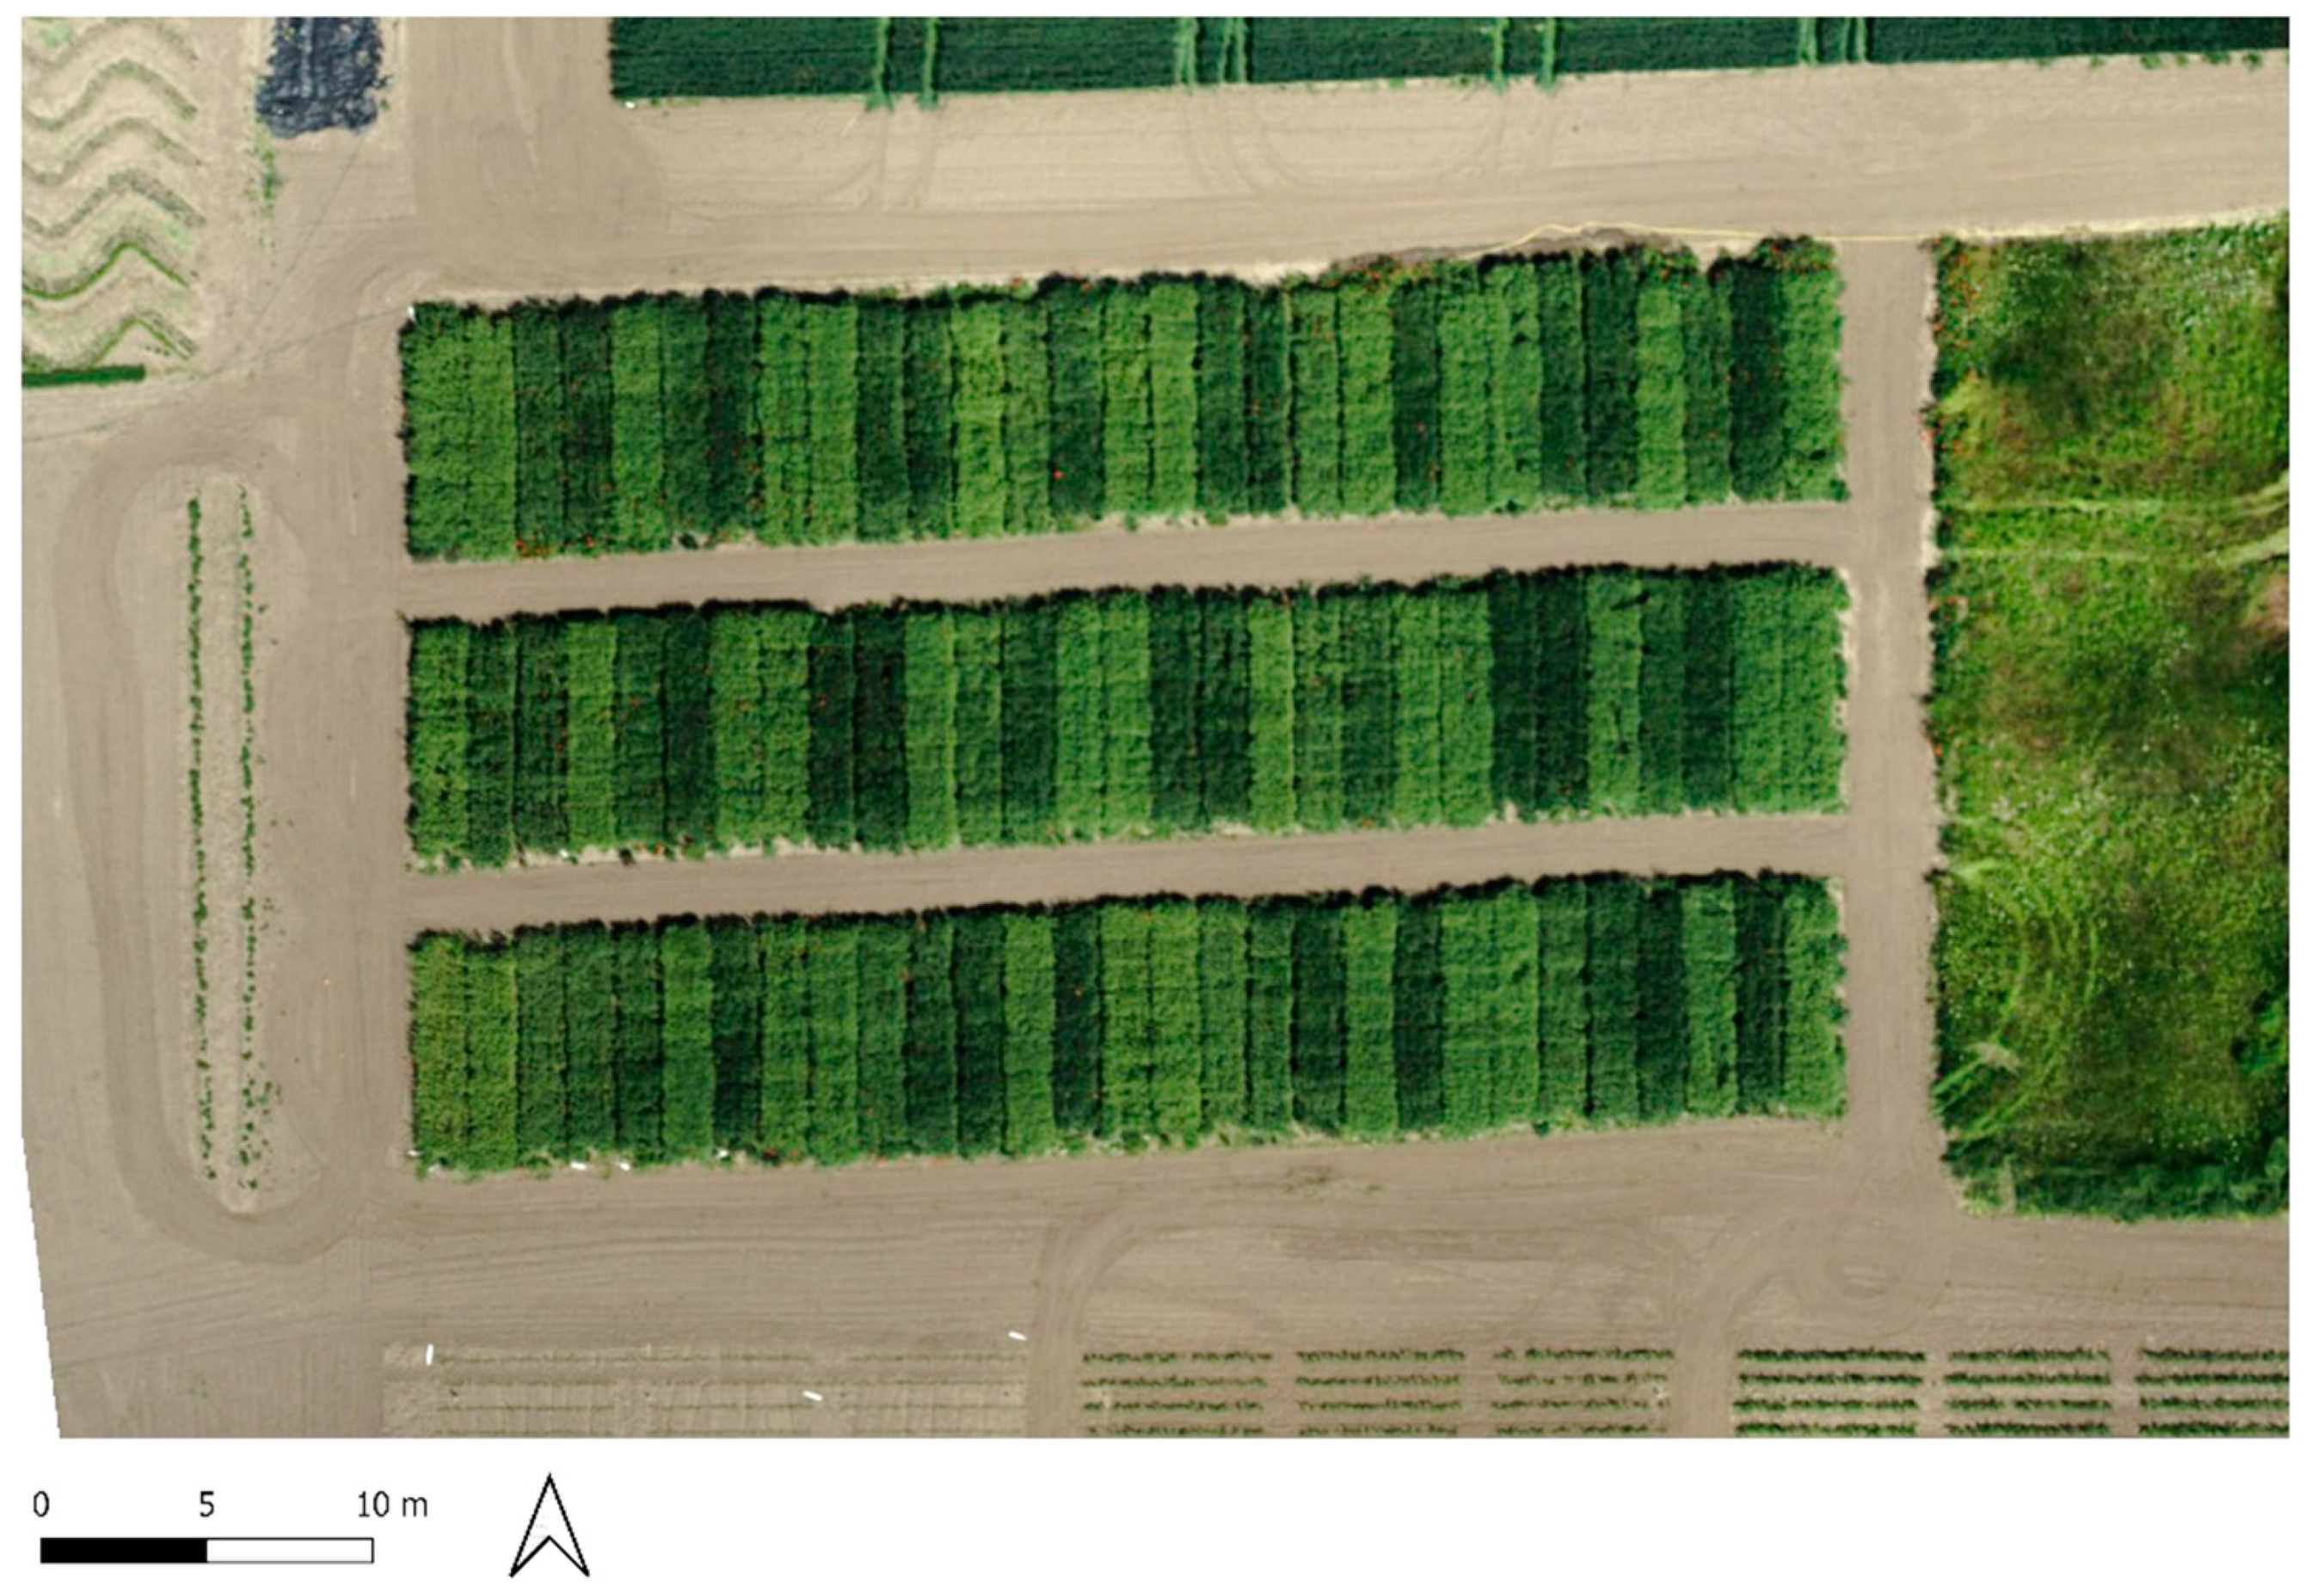
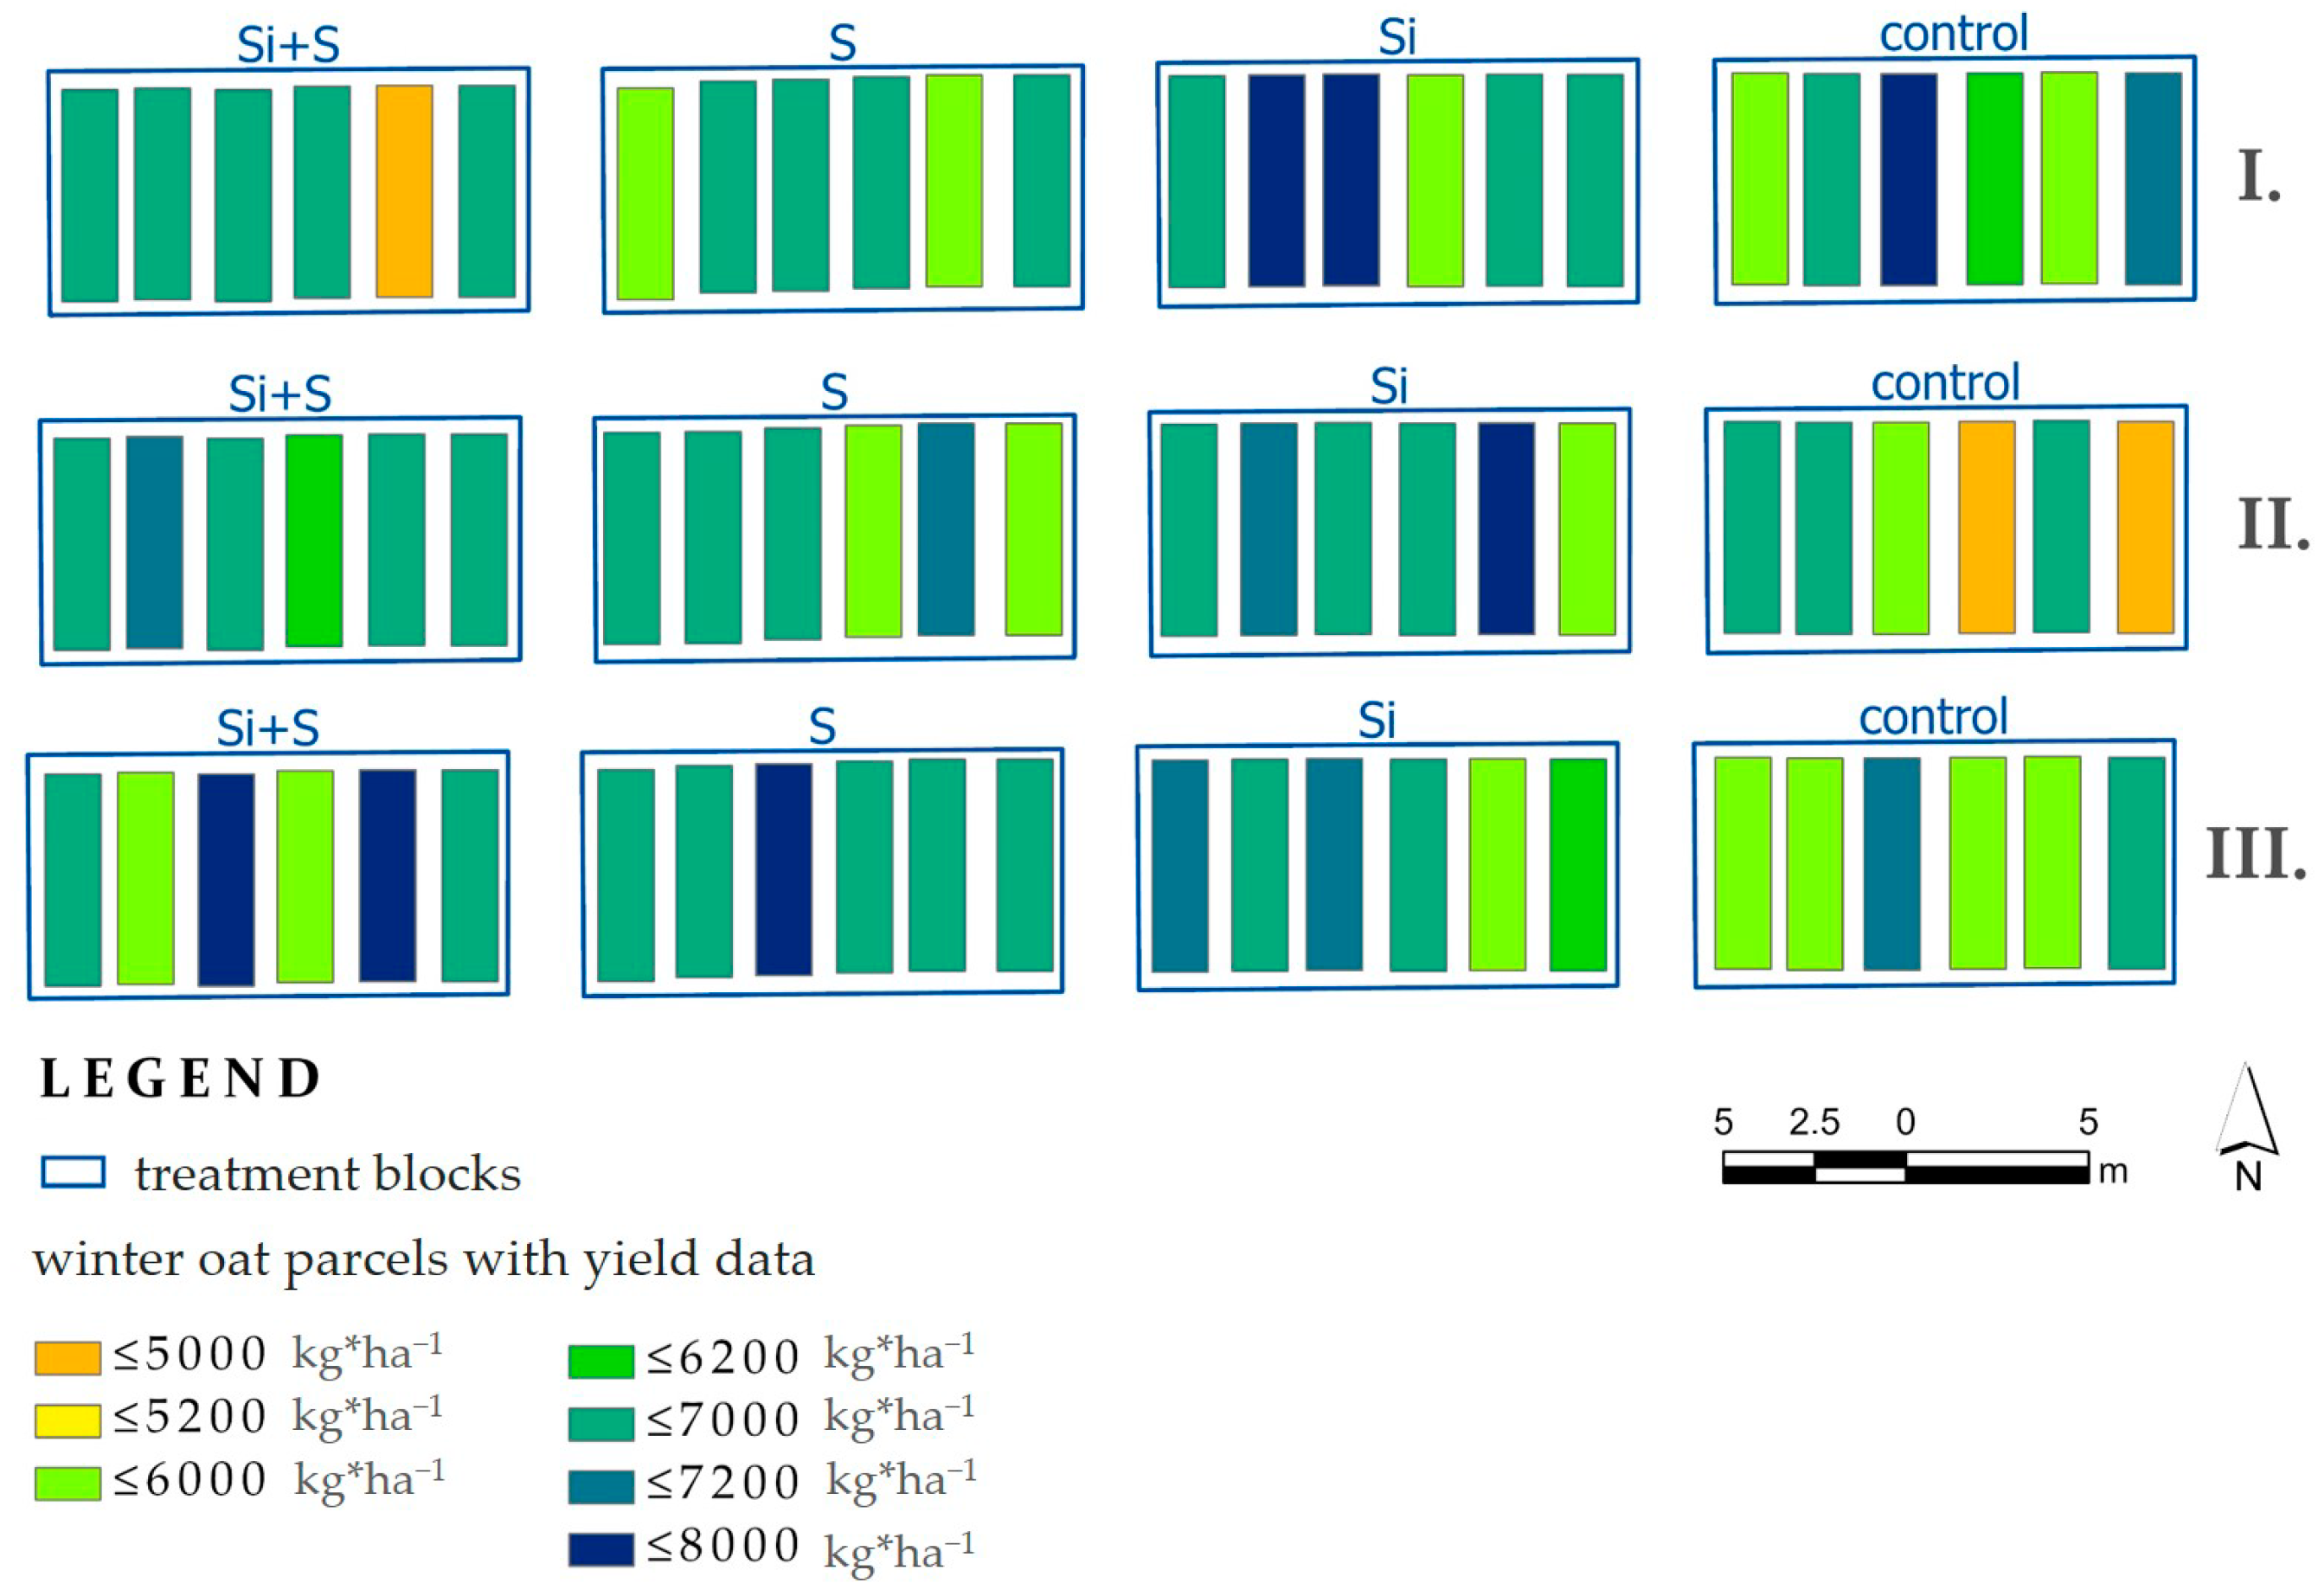
2.3. Experiment Setup

The measurements were taken in a small plot (1.5 × 7 m = 10.5 m2) experiment, with three independent repetitions (Figure 2). Sowing was done on 26 October 2020, with 550 seeds per m2 seed rate, with the depth at 5 cm.
(1) ‘Mv Hópehely’, (2) ‘Mv Kincsem’, (3) ‘Mv Imperiál’, (4) ‘Mv Istráng’, (5) ‘GK Arany’ and (6) ‘GK Impala’ are locally bred new, promising winter oat (Avena sativa L.) genotypes that were evaluated. ‘Mv Hópehely’ is the first (2007) winter oat variety of Agricultural Institute, Centre for Agricultural Research, Eötvös Loránd Research Network, Martonvásár, Hungary, while ‘Mv Kincsem’, ‘Mv Imperiál’ and ‘Mv Istráng’ were registered in 2016. ‘Mv Imperiál’ is the first black-seeded winter oat registered in Hungary. ‘GK Arany’ (2017) and ‘GK Impala’ (2005) are the varieties of Cereal Research Non-Profit Ltd., Szeged, Hungary.
Fertilization was: N20P40K120 kg ha−1, October 2020, N50 kg ha−1 26 February 2021.
We used four different treatments.
  • Control, without foliar fertilization.
  • Silicon fertilization (Si) 3.0 L ha−1.
  • Sulfur fertilization (S) 5.0 L ha−1.
  • Silicon+Sulfur fertilization (Si+S) 3.0+5.0 L ha−1.
Foliar fertilizers:
  • Sulfur fertilizer: liquid foliar fertilizer with a high Sulfur content (lignosulfonate formulation) 1000 g L−1 SO3, 30 g L−1 N, 30 g L−1 MgO, 27 g L−1 B, 0.003 g L−1 Mo.
  • Silicon fertilizer: (potassium silicate formulation) 1.4 m/m% Si, 10.5 m/m% K2O.
Application times for foliar fertilization:
1 December 2020BBCH13 (3 leaves unfolded)
10 May 2021BBCH39 (flag leaf stage)
18 June 2021BBCH73 (early milk)

2.4. Measurements, Calculations and Their Methodology

2.4.1. Field Measurements

Elevations of the field and coordinates of corner points of each parcel were surveyed on the field with a geodetic theodolite. The parcel boundaries, as well as the corner point coordinates of the experiment field, were determined with Stonex S9i RTK GPS using the Stop&Go technique. Field survey information, thereafter, were processed in the ESRI ArcGIS Pro software environment, where each parcel was interpreted as a rectangular polygon. These polygons individually provided the spatial extent of the other attributes. Thereby the spatial connection of the versatile measured and calculated parameter set is given in the joint parameter table.
The chlorophyll content of leaves was measured using SPAD-502Plus (Konica Minolta Inc., Tokyo, Japan) lightweight handheld chlorophyll meter without causing damage to plants. Chlorophyll absorbance peaks in the blue (400–500 nm) and red (600–700 nm) regions, with no absorbance in the near-infrared region. The SPAD-502Plus measures the absorbance of the leaf in the red and near-infrared regions. Considering these two absorbance values, the numerical Soil Plant Analytical Division (SPAD) value can be calculated, which is proportional to the amount of chlorophyll present in the leaf [32].
The SPAD values were measured three times: 27 May (BBCH 52); 10 June (BBCH 65); 24 June (BBCH 77) [33]. Each time, six plant measurements were taken for each plot.
The Normalized Difference Vegetation Index (NDVI) was estimated based on the absorption and reflection of near-infrared and visible red light [34]. The NDVI values were observed using two methods: on-field and drone-based imagery. A Trimble (Sunnyvale, CA, USA) GreenSeeker hand-held crop sensor was used to measure the NDVI on the field. This sensor uses light-emitting diodes (LEDs) with wavelengths of 656 nm and 774 nm for active illumination. The two-band optical reflectance sensor (optical reflectance ratio) records the intensity of the reflected light (Red and NIR). The sensor started to operate by pulling the trigger at the start of each row. We took multiple readings and an average was calculated when the trigger was released at the end of the sensed area. We held the sensor consistently 60 cm above the canopy for optimal reading.
NDVI, NDVIUAV and NDREUAV values were measured five times, 27 May (BBCH52), 3 June (BBCH58), 10 June (BBCH65), 17 June (BBCH73), 24 June (BBCH77).
Prior to harvest, the maximum plant height for each individual plot was also measured. On 9 July 2021 (BBCH89), the grain yield of each plot was harvested using a Wintersteiger 125 plot combine with a 125-cm cutting width. Grain samples were taken from each plot to determine the grain moisture content and 1000 kernel weight (TKW).

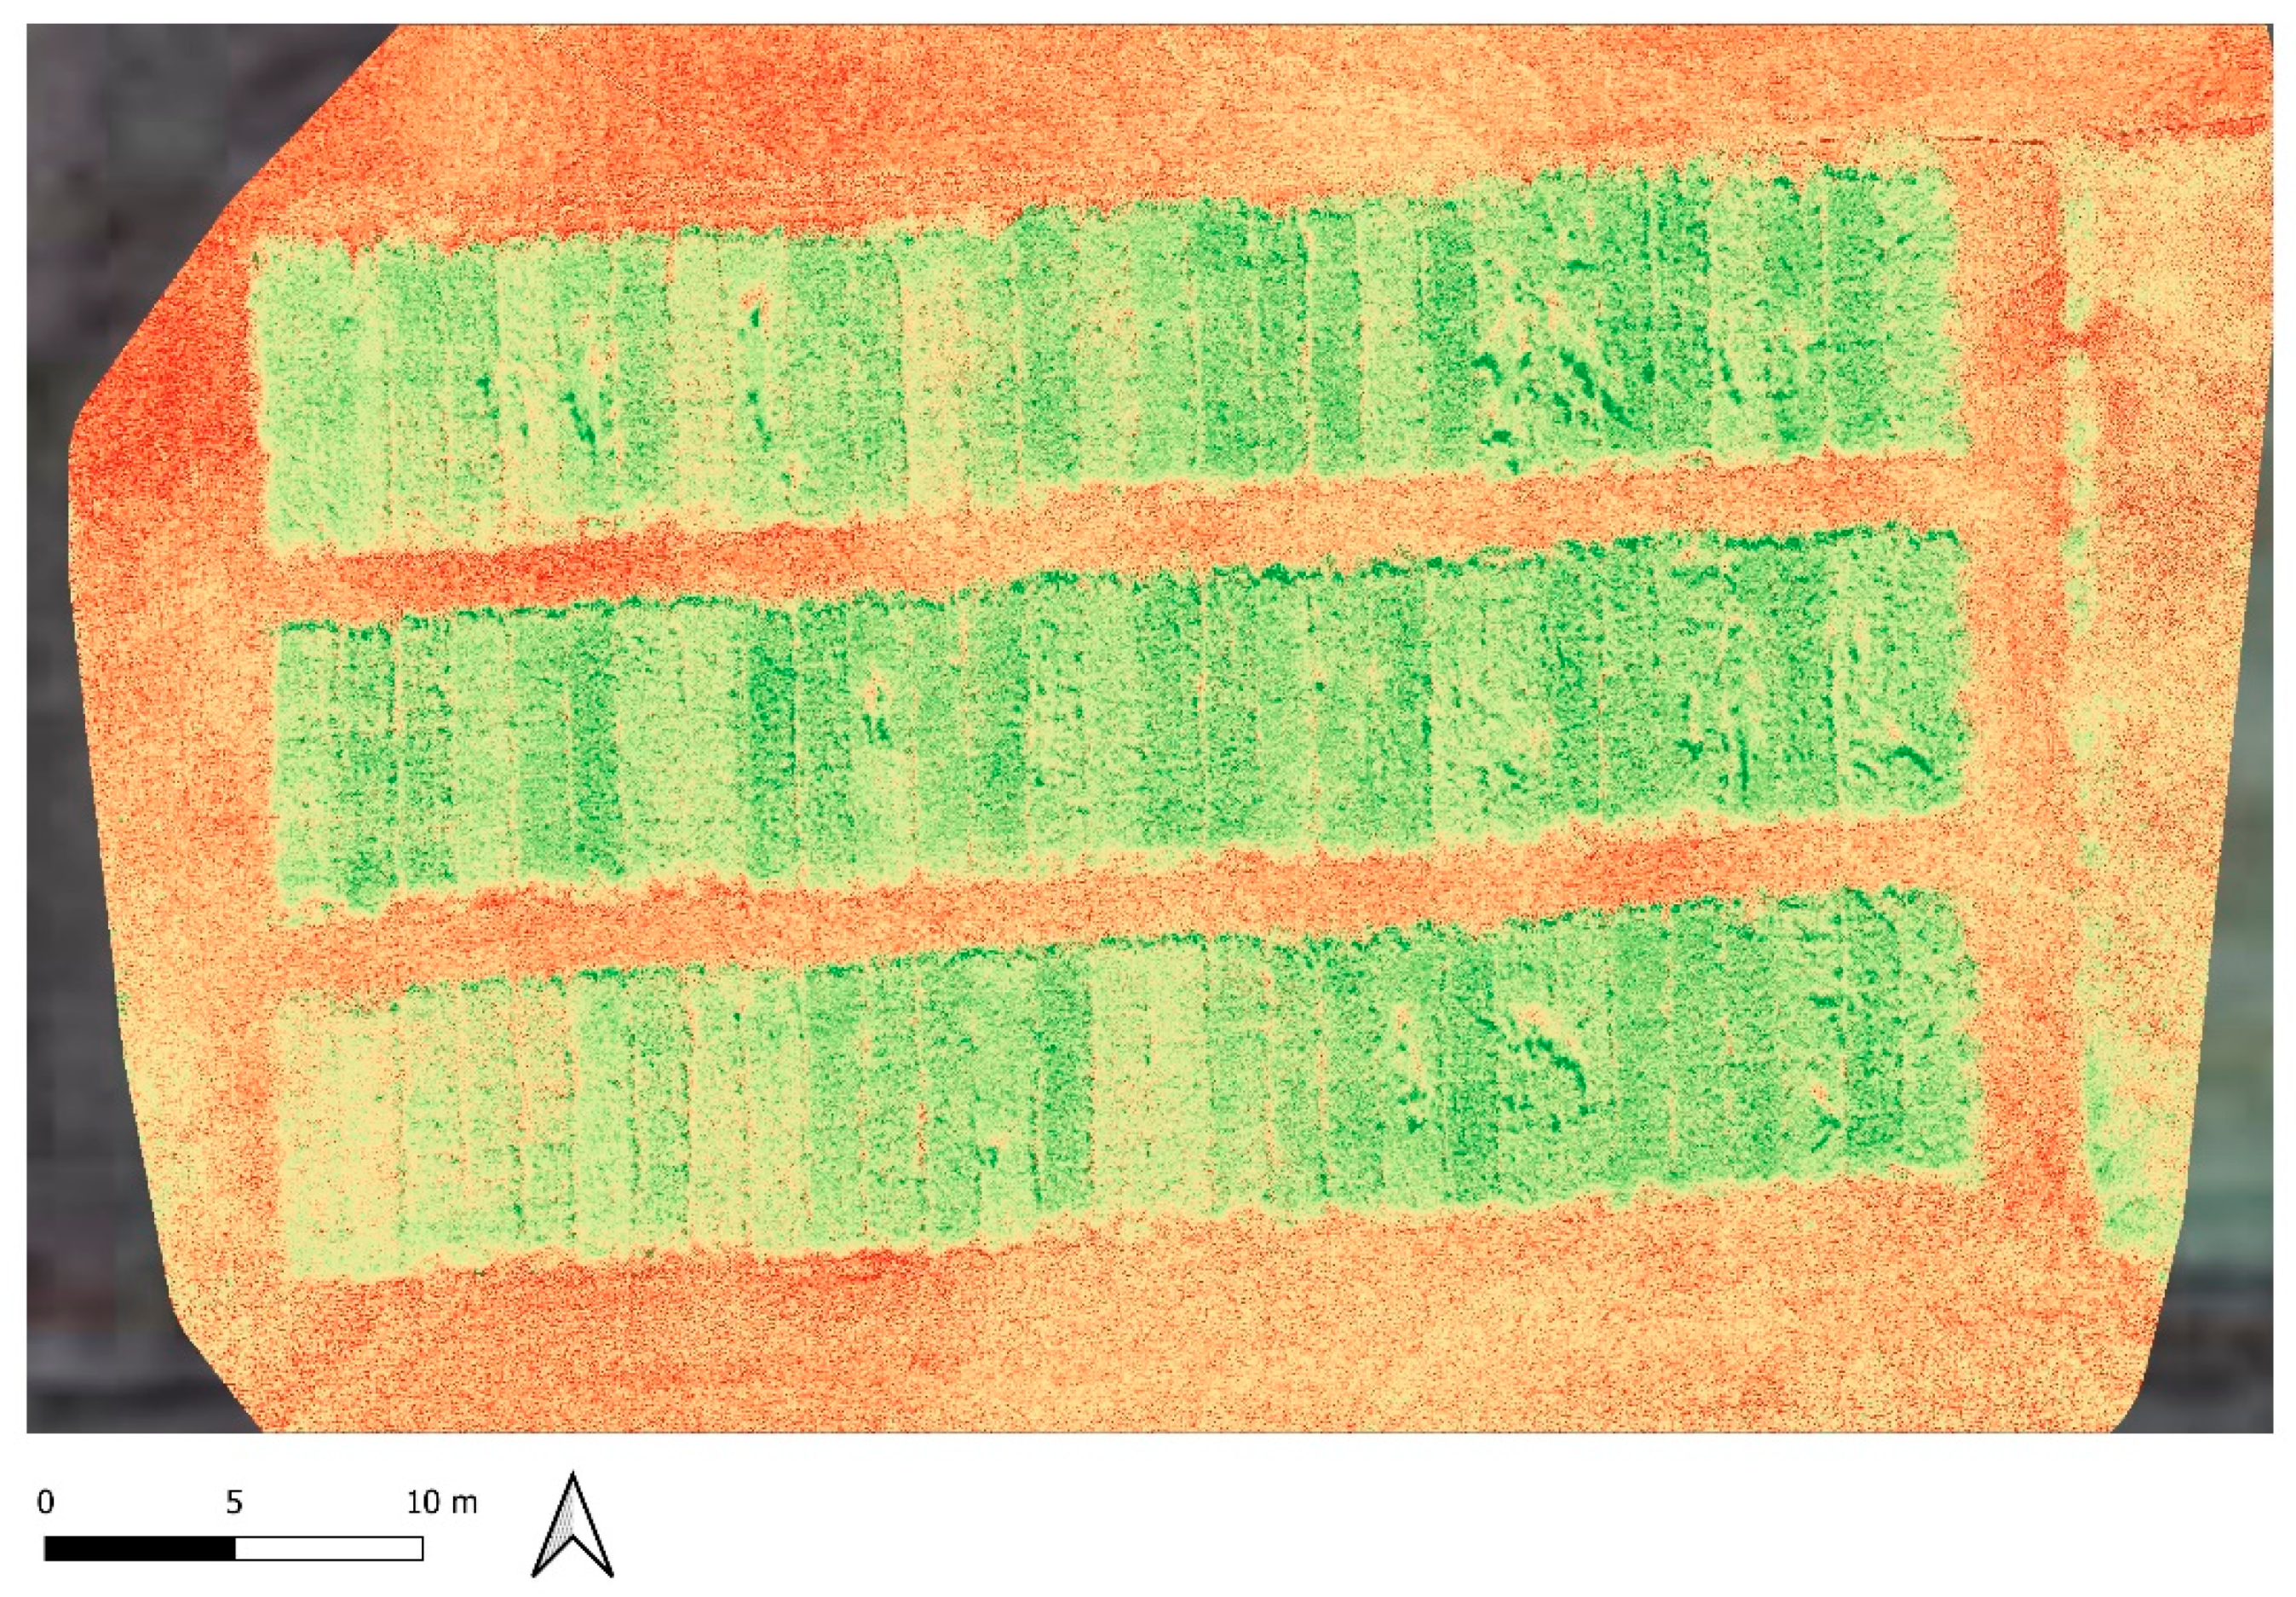
2.4.2. UAV Based Measurements

A DJI Phantom 4 Pro V2 drone equipped with Sentera Double 4K TrueNDVI and TrueNDRE sensors was used to record remotely sensed NDVI and NDRE images. The orthorectified photos were analyzed in QGIS 3.16.12. Hannover software.
It was necessary to separate the channels further, we can use a system of equations to subtract out the effect of the out-of-band channels on each band. This calculation assumes that the incoming light is approximately uniform (which is the case with daylight). We also add the constraint that the power across each of the filtered bands is equal. This allows us to perform calculations across each of the color bands, even if the filter widths vary. This results in the following [35] (Equations (1)–(3)):
R e d = 0.966 × D N b l u e + 1.000 × D N r e d
N I R = 4.350 × D N b l u e 0.286 × D N r e d
N D V I = ( N I R R e d ) ( N I R + R e d )
If our light source has smooth power across our wavelengths of interest, we can subtract out the use of band wavelengths in the NIR and Red Edge portions via the following (Equations (4)–(6)):
R e d E d g e = 0.956 × D N b l u e + 1.000 × D N r e d
N I R = 2.426 × D N b l u e 0.341 × D N r e d
N D R E = ( N I R R e d E d g e ) ( N I R + R e d E d g e )
The boundaries of the plots were determined by Trimble RTK. The resulting polygon shape file was pasted onto the stitched orthophoto at different time points. Then by the QGIS software, the raster was recalculated using the formula, and zone statistics were used to determine the mean values on each plot.

2.4.3. Laboratory Measurements

The following parameters were examined analytically in laboratories: pH values of the soil, and the chlorophyll content of oat samples.
Soil samples were taken 29 June 2021 from three locations in each parcel from the top 20 cm. The soil of the small plot field is homogenous from the aspect of soil genetics and during this experiment, no treatment was applied on the pedosphere therefore, samples were handled according to averaging method during ample preparation and laboratory measurements. Hence, instead of 216 samples, only 24 samples were examined on three large blocks of four treatments on six varieties.
The pH was measured with a WTW pH/Cond 3320 m from soil samples that were dissolved in distilled water at a ratio of 1:2.5. The solutions were filtered for measurement after shaking them on a flat platform shaker for 24 h in sealed glass beakers.
Leaf samples were taken from three sample points within each parcel. Total chlorophyll content assessment was carried out on leaf samples taken on 24 June (BBCH 77). Leaf samples were preserved and prepared for analysis according to the findings of Szabó et al. [36]. The leaves were refrigerated at 4 °C before being delivered and processed in the laboratory within 6 h—according to the common procedure. For uniformity, 80 percent acetone and 1 g quartz sand were used to destroy the pigment content of the leaf samples. The suspensions were centrifuged for 3 min at 3000 rev/min in a Hettich ROTOFIX 32A, and the clean solution was transferred to a 2.5 mL quartz cuvette. The absorbance of the solution was determined using a SECOMAN Anthelie Light II. UV-VIS spectrophotometer at wavelengths of 470, 644 and 663 nm. Light in the red range is absorbed by chlorophyll-A, whereas light in the blue range is absorbed by chlorophyll-B. Droppa et al. [37] used the following formula to convert the observed values to total chlorophyll levels (Equation (7)):
C h l a + b = ( 20.2 × A 644 + 8.02 × A 663 ) × V w  
Chla+b: chlorophyll-A and B content (µg/g), V: volume of extracted plant tissue (mL), A644: spectral absorbance value in wavelength of 644 nm (unitless), A663: spectral absorbance value in wavelength of 663 nm (unitless), w: weight of fresh plant tissue sample (g).
Measured values for all mentioned parameters were imported into ArcGIS based on sample point coordinates and parcel corner coordinates measured on the field with a Stonex S9i GNSS Receiver brand RTK GPS device.
For soil pH values, three parcels (one for each experiment repetition for the same treatment) have the same values, respectively, due to the average sampling and measuring. In the case of the chlorophyll content of oats, each sampling point is represented as one record in the GIS database; hence, points were available in sufficient amount to run raster interpolation providing chlorophyll content distribution map supporting data visualization.

2.5. Data Analysis

The IBM SPSS Statistics 22.0 statistical software (IBM Corp. Chicago, IL, USA) was used for data analysis and evaluation. To compare the means of the different parameters among the varieties and treatments, a univariate GLM model with descriptive statistics turned on was utilized. We checked the prerequisites to the analysis of variance (normality, homogenous variances and independency) on the dependent variables. The Kolmogorov–Smirnov test was used to check for normality. For pairwise comparisons of the means, LSD post hoc testing was used. The significance level (alpha) was set to p = 0.05. To test group membership, discriminant analysis was applied on standardized values. The linear relations between the parameters were detected using Pearson correlation analysis (two-tailed). The interval of standard error and significance on the figures and tables were presented where it was relevant.

3. Results

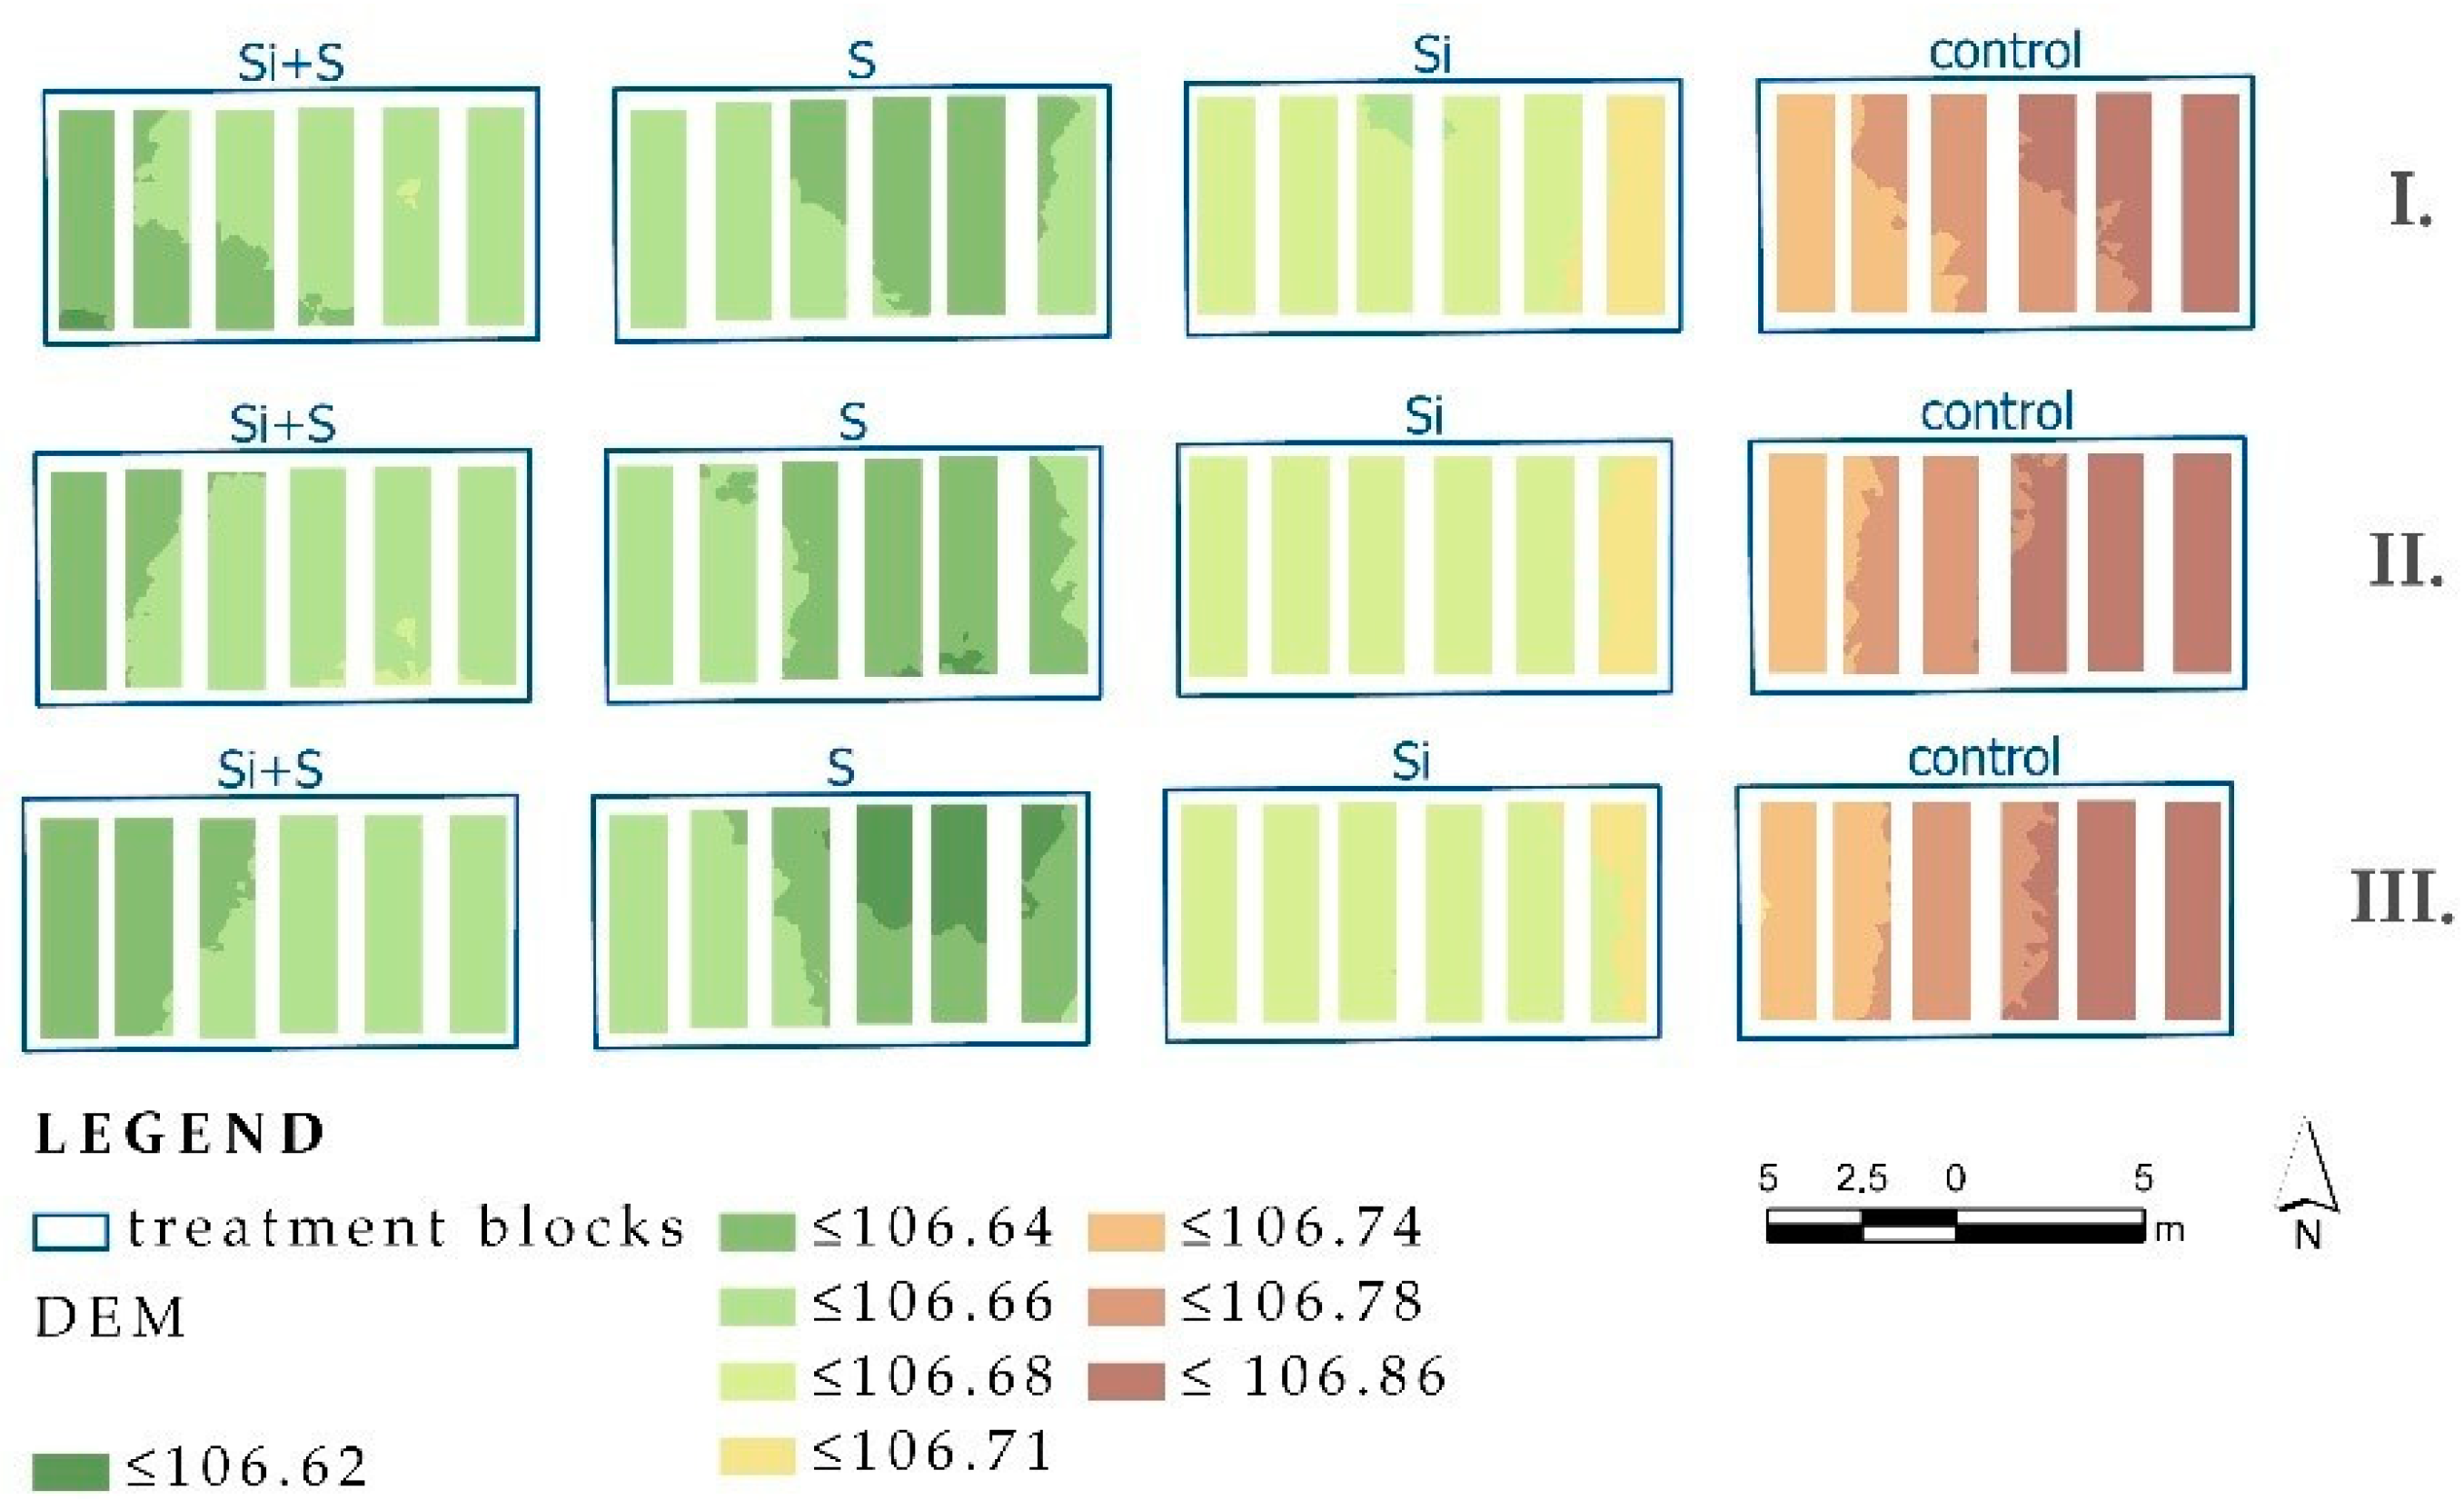
3.1. Elevation and Soil pH

The Digital Elevation Model (DEM) generated from the measured elevation values shows a slight dipping towards the west, consequently, the general flow direction is from east to west. The mean is 106.67 m, the minimum value is 106.493 m, while the highest points are 106.86 m above sea level (Figure 3).
The measured pH values fall within a narrow range (7.59–7.87), but vary between treatments, with the highest pH values measured in the Si and S treated areas and in the control areas and the lowest pH values measured in the S treated areas (Figure 4).

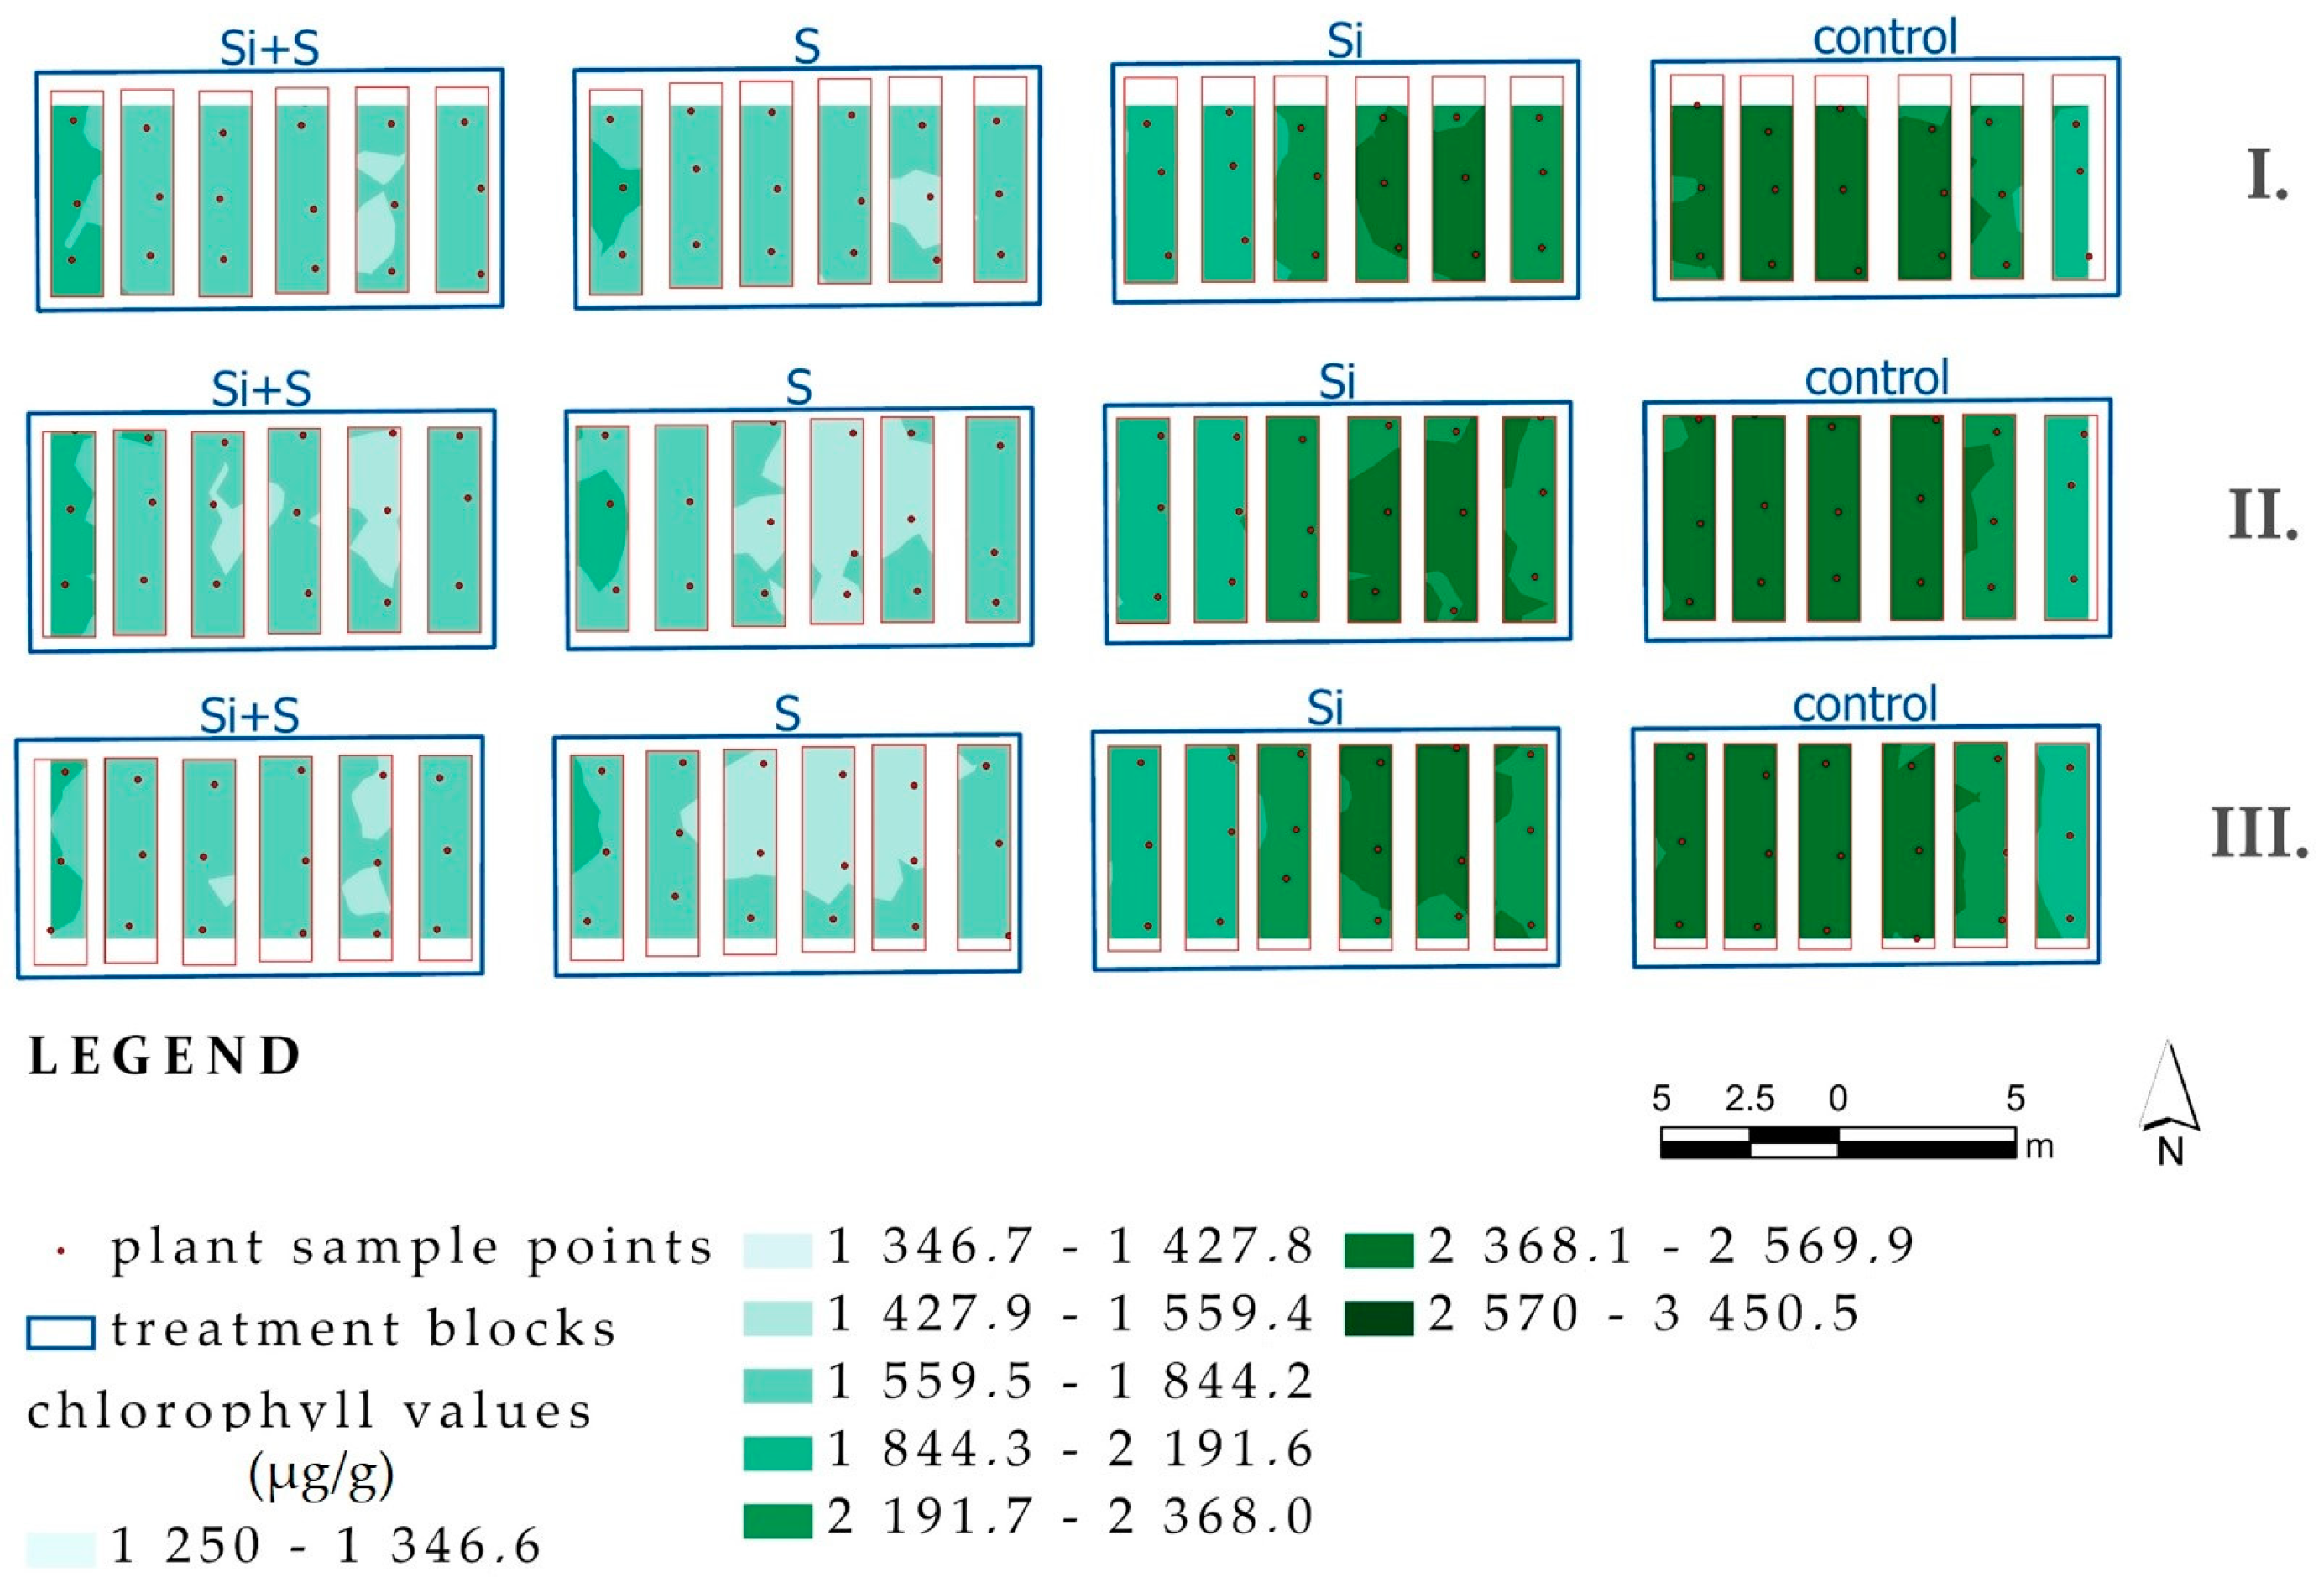
3.2. Effects of Treatments on the Chlorophyll Content and SPAD Value of Oat

The chlorophyll content data series of plant samples show a bimodal lognormal distribution with higher values in the control and Si treated areas (Figure 5), although the differences among the varieties or the treatments were not significant.
The foliar fertilization caused a significant discrepancy (p < 0.001) in the SPAD value of the oat varieties in all three measurement times (Figure 6). The range was between 33.88 and 59.50 on 27 May (BBCH52), 43.70 and 64.18 on 10 June (BBCH65) and 15.70 and 56.58 on 24 June (BBCH77). The last measurement showed very low values of SPAD (control, Si, S, Si+S, 44.47, 38.15, 44.95, 32.71, respectively), and the variation was the highest. The means of the control and Sulfur fertilized plots were equal on 27 May, while the Si and Si+S treatments resulted in lower SPAD values by 3.1 and 8.2%, respectively, compared to the control. Later in the season, the Sulfur fertilized plants had the highest relative chlorophyll content, but the values were higher only by 2.9 and 1.1% than the control. Silicon foliar fertilization decreased the SPAD value of the oat observed on 10 and 24 June, it was lower by 9.3 and 14.2% than the control.
The response of the varieties to the treatments was varied in the SPAD values. On 10 June, when the highest values were observed, ‘Mv Istráng’ showed the highest SPAD value (58.45), and ‘GK Arany’ was the lowest (54.03). The Si fertilized plants showed lower SPAD value compared to the control plots in ‘Mv Hópehely’, ‘Mv Kincsem’, ‘Mv Imperiál’, ‘Mv Istráng’, ‘GK Arany’, ‘GK Impala’, by 5.8, 14.5, 13.0, 9.8, 3.4, 8.3%, respectively (Figure 7).
We found no significant correlations among the soil pH, the chlorophyll content measured in the laboratory from leaf samples were taken on 24 June (BBCH 77) and the SPAD values from field measurements at different vegetation periods: 27 May (BBCH 52); 10 June (BBCH 65); 24 June (BBCH 77). Pearson correlation coefficient (r) values can be found in Table 2.

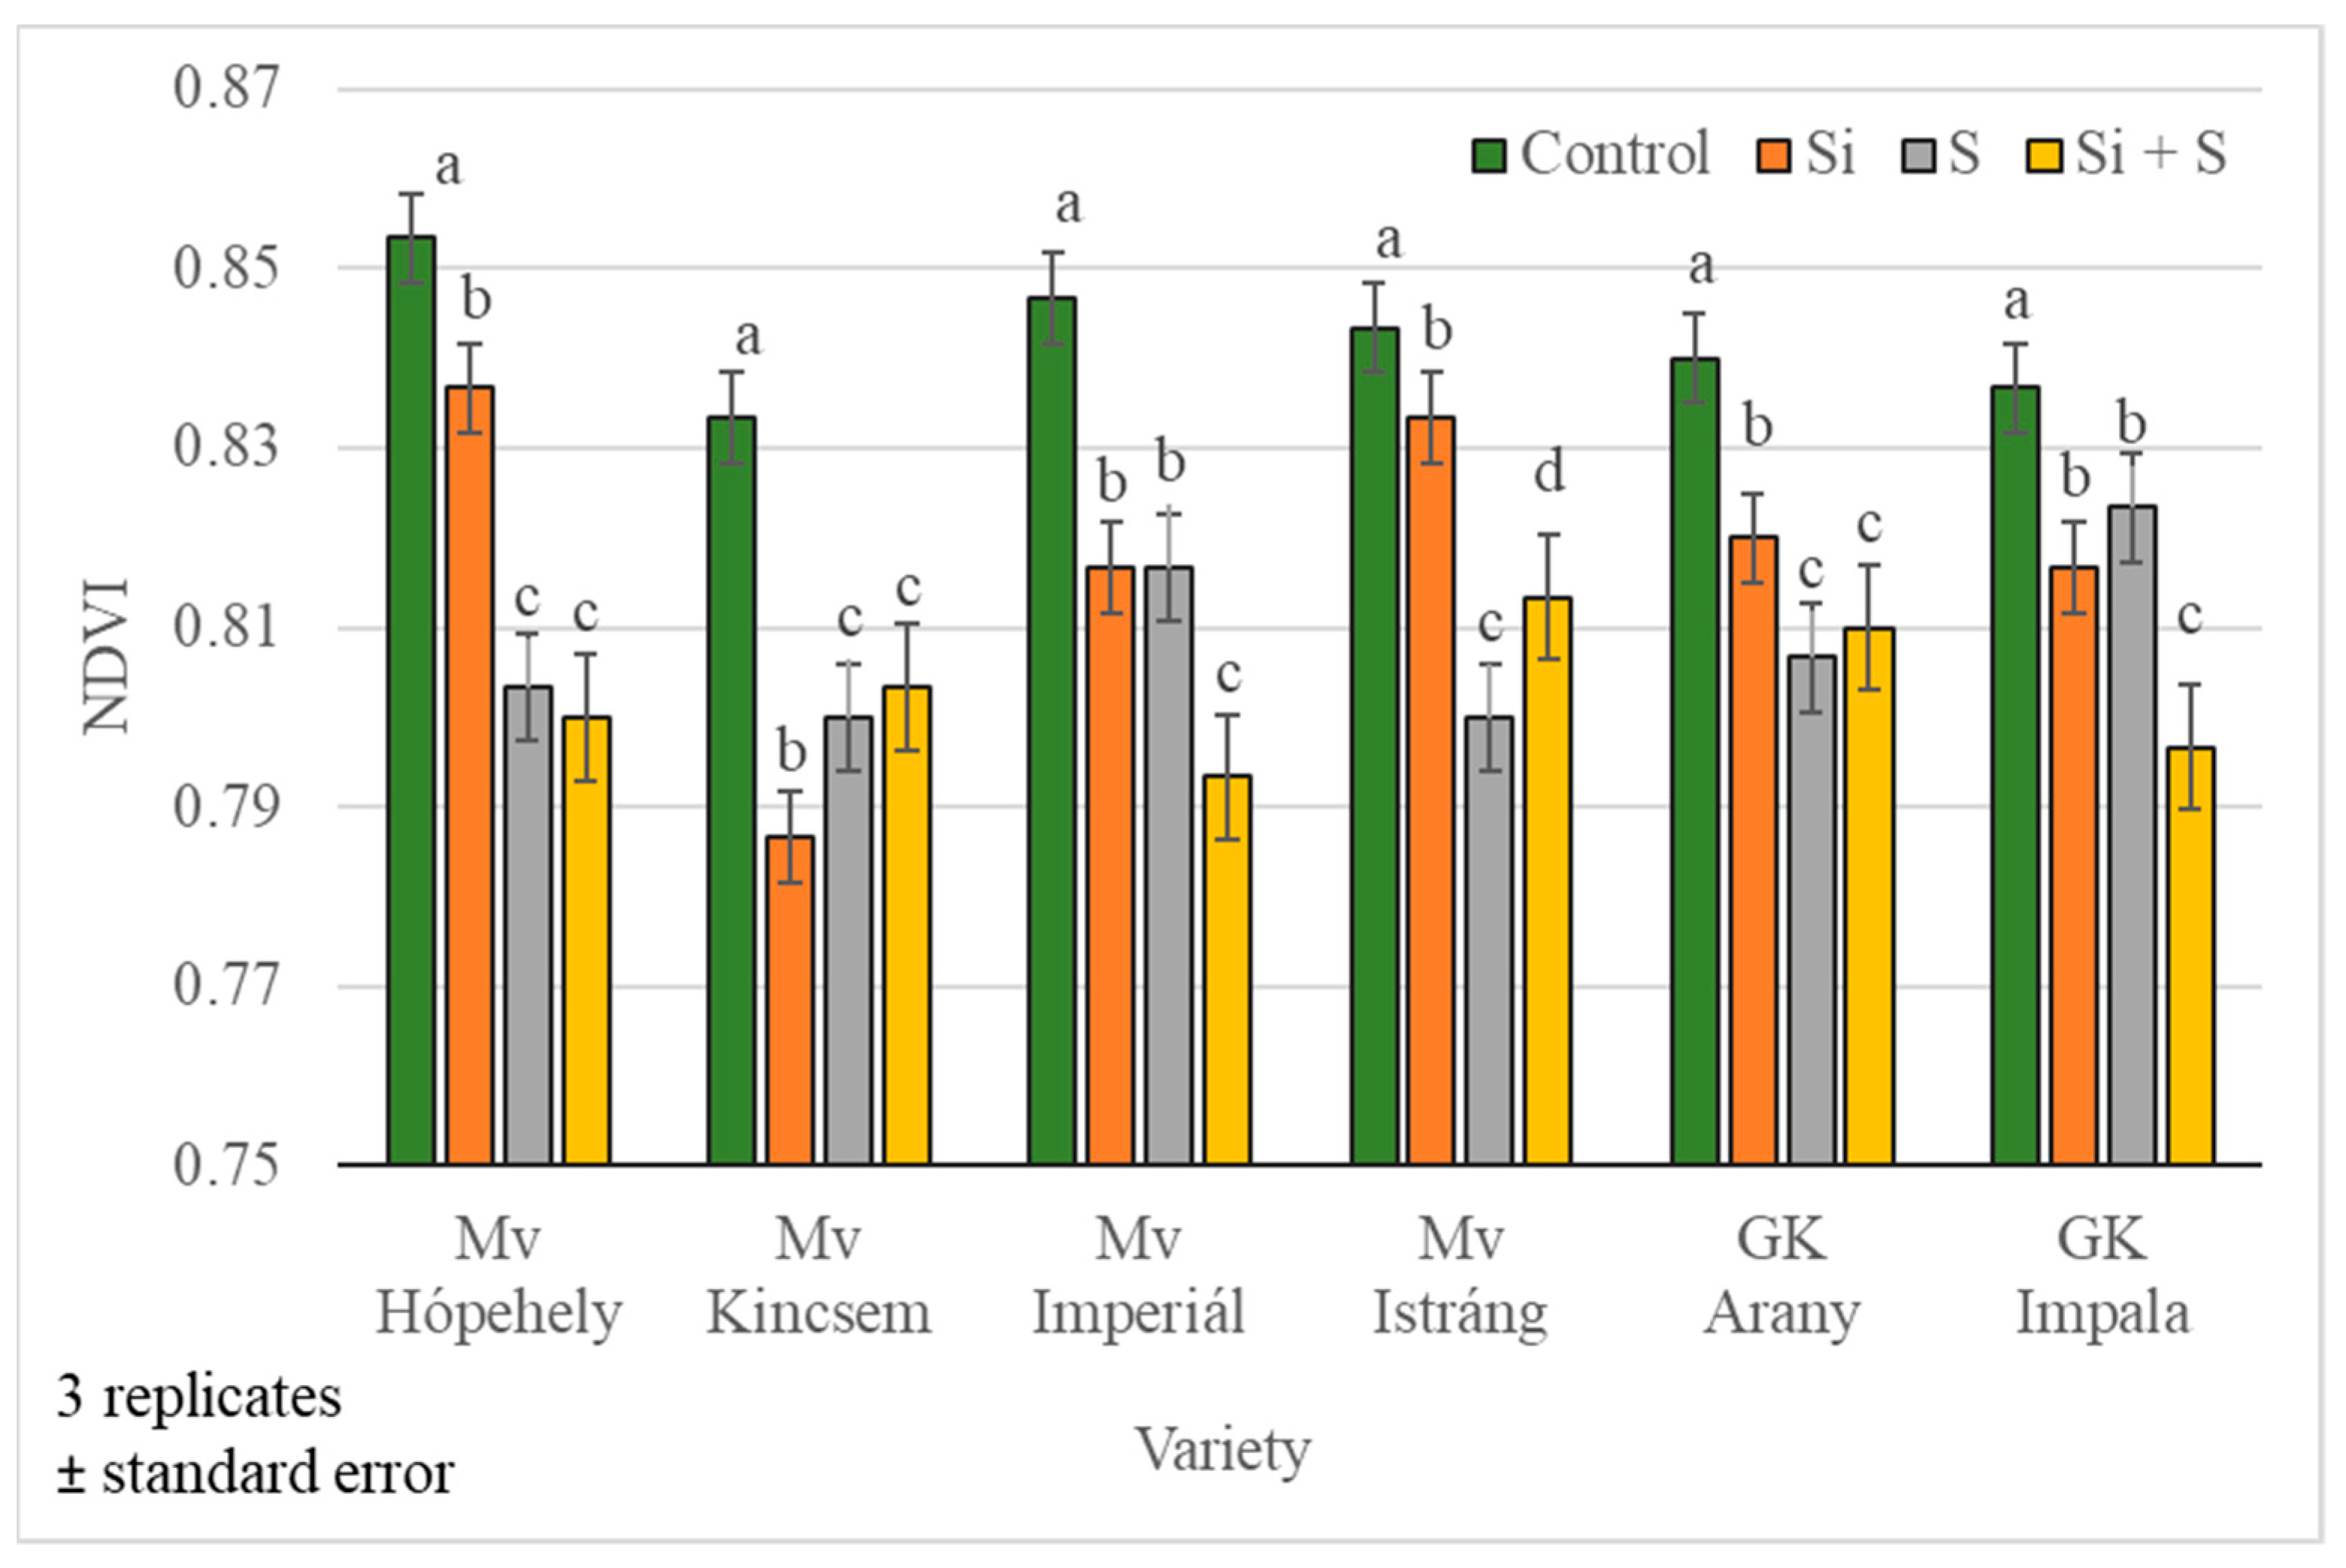
3.3. NDVI Field and UAV Measurements

The application of foliar fertilization caused significant differences in the NDVI values in all the measurement times (p < 0.001). The highest NDVI values were observed in the control plots, the difference varied between 2.2–3.4% on 27 May, 2.8–4.4% on 3 June, 1.0–2.8% on 10 June, 0.6–3.7% on 17 June and 3.0–15.6% on 24 June (Figure 8). The effect of the treatments was more articulated at the last measurement time (BBCH77).
The differences in NDVI were also significant among the varieties (p < 0.001), the variation was very low. The differences varied from 0.12% to 2.44% on 27 May (BBCH52), from 0.08% to 2.08% on 3 June (BBCH58), from 0.10% to 3.43% on 10 June (BBCH65), from 0.28% to 2.53% on 17 June (BBCH73) and from 0.35% to 10.12% on 24 June (BBCH77) (Figure 9).
Parallel with the field measurements, UAV-based observations were made. The high-resolution RGB image and high resolution stitched orthophotos of NDVI and NDRE can be found in Figure 10, Figure 11 and Figure 12.
The relationship was inspected between the NDVI values measured using a hand-held system and UAV-installed camera (NDVIUAV) with Pearson correlation analysis (Table 3). Close correlation was expected, and the coefficients pointed to a very strong positive connection between them (r = 0.895–1.000), except for the third measurement time, where the correlation was weaker (r = 0.700). The correlation was statistically significant (p = 0.01). There was also a positive correlation between the hand-held NDVI and NDREUAV values (r = 0.213–0.517).
The correlation was inspected between the SPAD, NDVIUAV and NDREUAV values (Table 4). The Pearson correlation analysis resulted in positive but low correlation coefficient (r) values. The range was from 0.017 to 0.601, and in some cases, it was statistically significant at p = 0.05 or 0.01 level. The results showed that there was a weak or no connection between the SPAD and NDVIUAV values (r = 0.017–0.437) in the first three measurement times. Between the NDVIUAV5 and SPAD1-3 values, there was medium strength and significant correlation (r = 0.601, 0.350, 0.452, respectively). The NDREUAV and SPAD values showed no connection to medium correlation (r = 0.022–0.485).

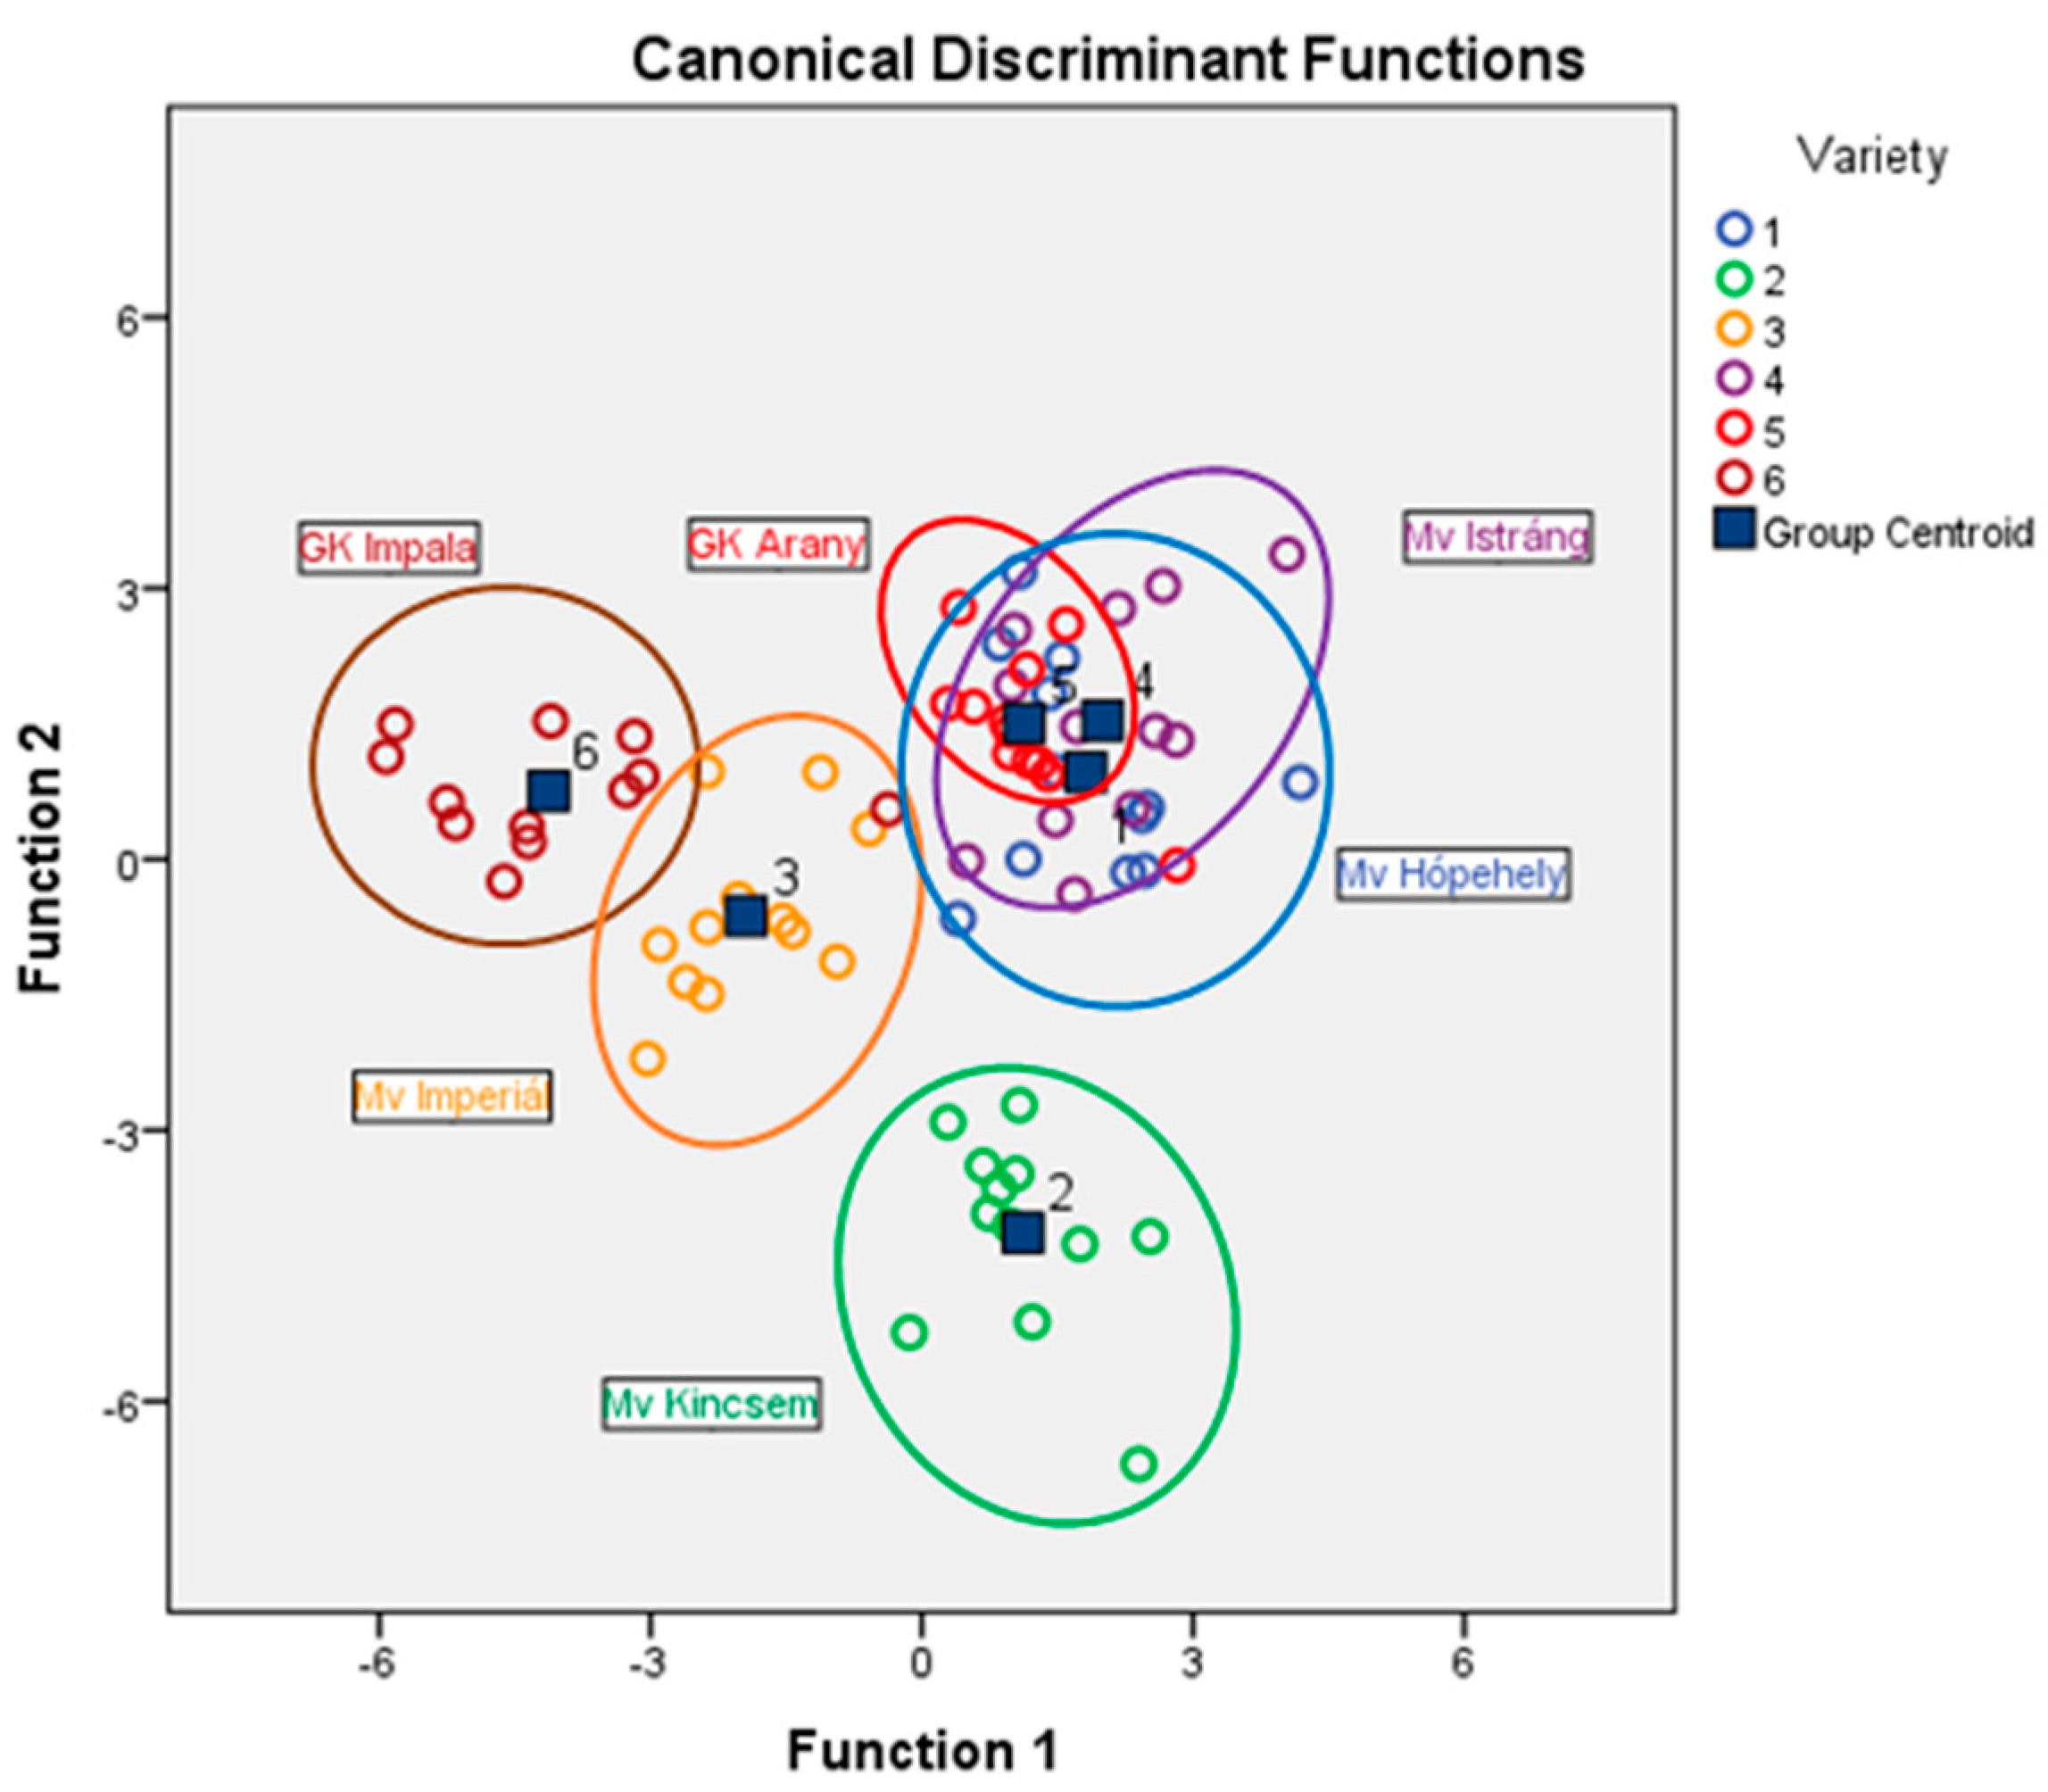
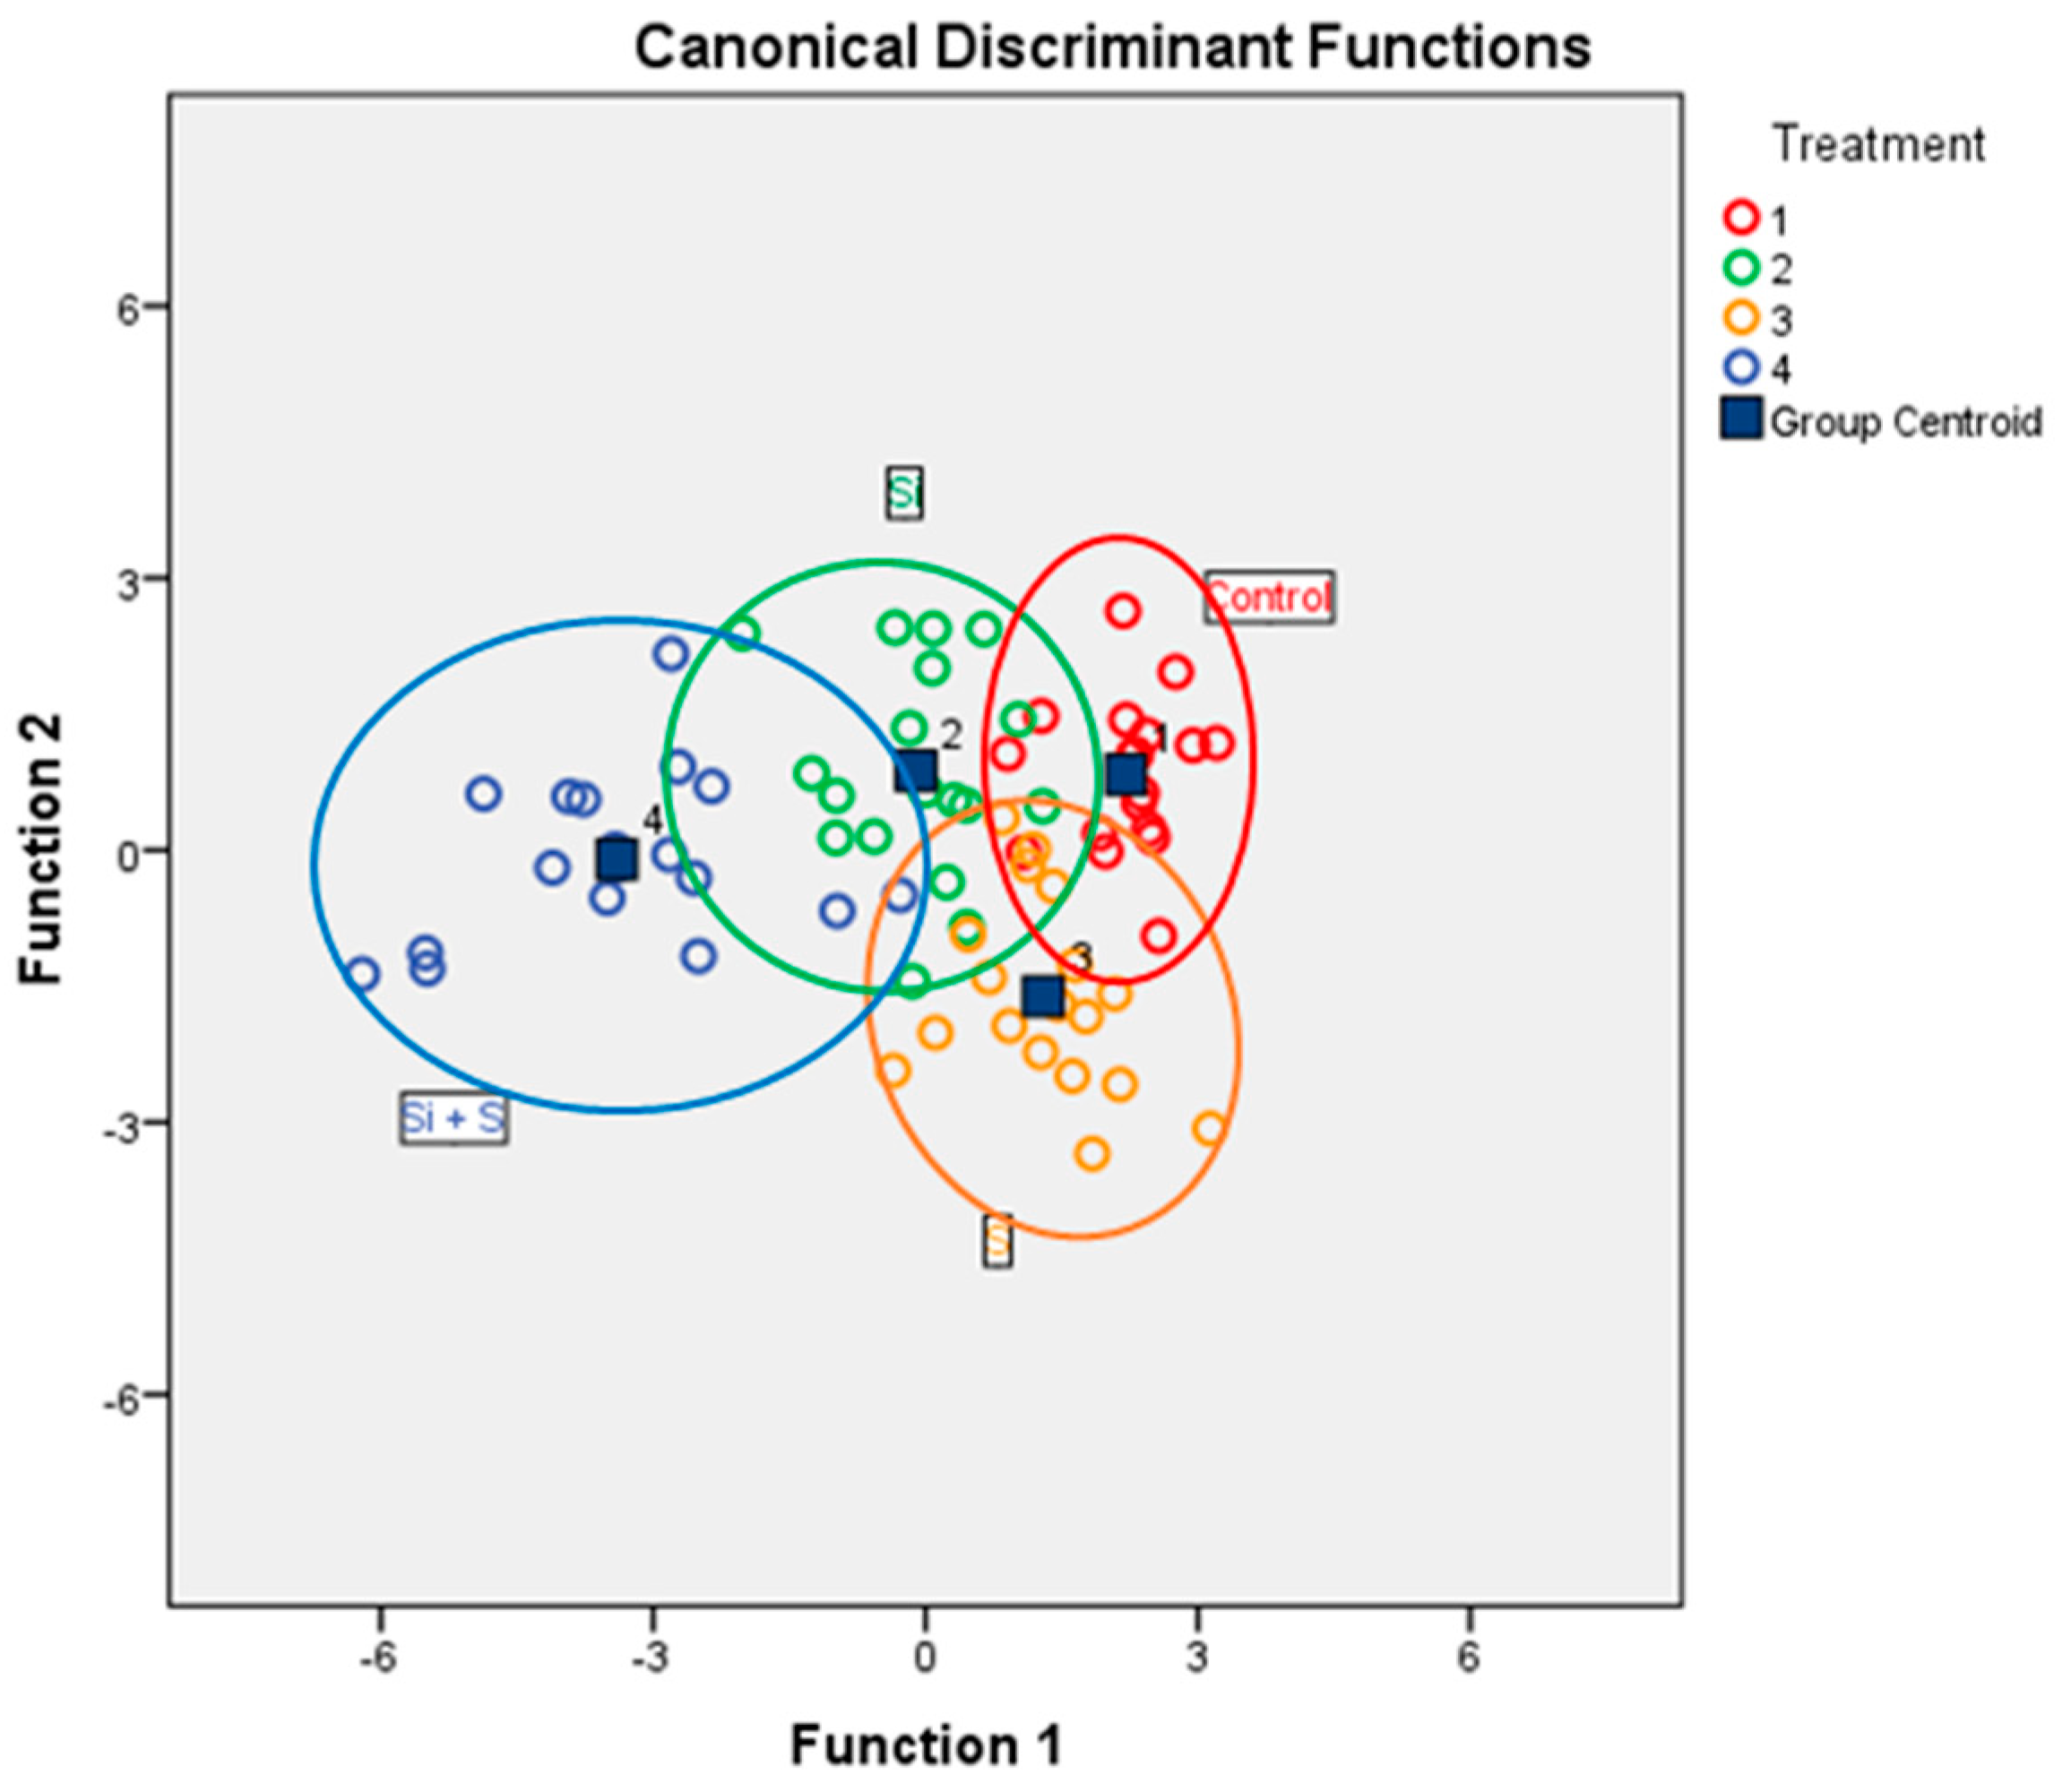
3.4. Discriminant Analysis

Discriminant analysis was run to investigate the relationship between the categorical grouping variables and a group of interrelated scale variables after standardization (NDVIUAV1-5, NDREUAV1-5, SPAD1-3, Height, TKW and Yield). The yield map can be seen in Figure 13.
First, the categorical variable was the variety. The result showed that classification was successful because 88.9% of original grouped cases were correctly classified. The original and predicted group memberships fitted well (Table 5). The percent of correctly classified cases varied from 66.7% (‘Mv Hópehely’) to 100% (Mv Kincsem, Mv Imperiál). Figure 14 presents the visual interpretation of the classification result. The varieties ‘Mv Kincsem’, ‘Mv Imperiál’ and ‘GK Impala’ are clearly separated.
Table 6 shows the discriminant analysis result where the categorical variable was the foliar fertilization treatment. The classification was also successful, 87.5% of original grouped cases were correctly classified. The share of the correctly classified cases varied from 83.3% (Si) to 94.4% (Si+S). On the combined groups plot (Figure 15), the fertilization treatments can be separated visually, but overlapping also can be observed.

4. Discussion

All cultivated areas in the world are affected by climate change, and the most negative effects (increased incidents of heatwaves and droughts) will be found for the continental climate in the Pannonian zone, including Hungary, too [38]
Plants change their appearance continuously during their growth cycle in response to different abiotic and biotic environmental effects and the added treatments, just like macro- and micronutrient fertilization. Data were recorded on the physiological aspects of crops with different field and remote sensing surveys. As the spectral response of crop canopy is influenced by the plant health, growth stage, field management practices and stress condition, monitoring our fields by UAV surveys could be useful for a rough evaluation of the nutritional status of plants [39]. Remote sensing is a valuable tool to provide improved information on the response of winter oat varieties to Silicon and Sulfur foliar fertilizer treatments applied at different phenological stages.
Hand-held relative chlorophyll content meters, like the SPAD-502Plus are well suited to measuring the chlorophyll content of leaves relatively accurately in many plant species. The researchers report different and sometimes conflicting results on its usefulness. The accuracy depends on the species and the type of leaf pigment. Mielke et al. [40] evaluated the SPAD values using laboratory leaf samples measurements. They found that SPAD values are quite reliable when the measurement location and the sampling location are the same on the leaf. Zandonadi et al. [41] found positive linear correlations among SPAD values and nitrogen content of sorghum hybrids. In contrast, we found no significant correlation between the chlorophyll content measured in a laboratory from leaf samples and the SPAD values from field measurements at different growth stages. In our study, we found that the differences among the varieties were not significant, but the foliar fertilization caused a significant change in the SPAD values. Żelazny [42] reported that the chlorophyll concentration of the oat leaves can be predicted using hyperspectral imagery.
Our results revealed significant differences among the foliar fertilizer treatments in the NDVI values in all measurement times. The effect of the treatments was more pronounced at the end of the growing season (24 June, BBCH77). Shah et al. [43], Hatfield and Prueger [39] and Kizilgeci et al. [44] obtained similar results with oats and different field crops (maize, soybean, wheat, durum wheat and canola).
The use of remote sensing capabilities allows fast measurements compared to manual measurements. The question is the reliability of the measurement results obtained, which is why they need to be validated. We examined the relationship between the NDVI values measured with the hand-held instrument and UAV-installed camera (NDVIUAV) with Pearson correlation analysis. A very strong positive correlation was found between them (r = 0.895–1.000). Thus, the hypothesized (hypothesis 1) close correlation between the manual measurements and the UAV sensor readings was confirmed.
Hypothesis 2 was that it is possible to separate the oat varieties and foliar fertilization treatments based on the measured SPAD, NDVIUAV, NDREUAV, height, TKW and yield parameters using discriminant analysis. There are data in the literature on the classification of genotypes of different crops. Öner [45] wrote, based on the investigation on local maize genotypes that the classification was successful, but increasing the number of heritable traits gives the more effective classification of genotypes. Other researchers stated that discriminating the crop varieties based on morphological and biophysical features is possible, but using hyperspectral data is more useful and applicable on large scale. The accuracy is generally high in cultivar detection. Bégué et al. [46] stated 73–92% accuracy, but other researchers demonstrated higher success rates (89.9–100%) [47]. In the maize crop, the accuracy was affected by the phenological stages, and Chivasa et al. [48] found that flowering and onset of senescence were the ideal stages for accurate discrimination. Zhang et al. [49] demonstrated that cotton cultivars can be classified using hyperspectral data with accuracy from 90.4% to 100%. The discriminant analysis results in our investigation demonstrated that classification was successful, with 88.9% of the initial grouped cases properly classified. The original and predicted group memberships fitted well, and the accuracy varied from 66.7% to 100%. We also found that the accuracy of the classification in the discriminant analysis on the foliar fertilization treatment also was very high, 87.5% of original grouped cases were correctly classified and the accuracy varied from 83.3% (Si) to 94.4% (Si+S) in the treatments.
The problem in comparing the results of different studies is that usually different sensors and different experimental conditions (crop species, varieties, soil conditions, etc.) were used.

5. Conclusions

The field observed relative chlorophyll content (SPAD) and the laboratory-measured leaf chlorophyll content are not necessarily closely related.
Using hyperspectral imagery, oat varieties and plots receiving different silicon and Sulfur foliar fertilization treatments can be reliably distinguished.
Based on our results, high-resolution RGB orthophotos and NDVI and NDRE maps from UAV instruments equipped with hyperspectral cameras could be an important additional input for the evaluation of small plot field experiments, but accurate and detailed research also requires surface measurements. The remote sensing method provides a detailed raster data set of the upper leaves and sampling should be designed accordingly, and the values measured by the two methods are to be compared in more detail.
The advantages of using remote sensing in small plot experiments were confirmed in this study, however, the measurements using handheld equipment cannot be completely substituted by them. Both varieties (88.9%) and treatments (87.5%) were successfully classified using discriminant analysis based on a combination of remote sensing and surface data.

Author Contributions

Conceptualization, E.K., J.C. and E.B.-B.; methodology, E.K., J.C., A.T. and E.B.-B.; software, J.C. and Z.Z.F.; validation, J.C., E.K. and E.B.-B.; formal analysis, E.K.; investigation, J.C., E.K. and E.B.-B.; resources, E.K. and A.M.V.; data curation, I.C.V., F.F., E.B.-B., C.B. and A.T.; writing—original draft preparation, J.C., E.K., E.B.-B., A.N. and A.T.; writing—review and editing, J.C., E.K. and E.B.-B.; visualization, J.C., E.B.-B., Z.Z.F. and A.T.; supervision, J.C. and E.K.; project administration, E.K.; funding acquisition, E.K. All authors have read and agreed to the published version of the manuscript.

Funding

This research was funded by the EFOP-3.6.1-16-2016-00022 Project. The project is co-financed by the European Union and the European Social Fund and was funded by the project EFOP-3.6.3-VEKOP-16-2017-00008. The project is co-financed by the European Union and the European Social Fund.

Institutional Review Board Statement

Not applicable.

Informed Consent Statement

Not applicable.

Conflicts of Interest

The authors declare no conflict of interest. The funders had no role in the design of the study; in the collection, analyses, or interpretation of data; in the writing of the manuscript, or in the decision to publish the results.

References

  1. Stevens, E.J.; Armstrong, K.W.; Bezar, H.J.; Griffin, W.B.; Hampton, J.G. Chapter II—Fodder Oats: An Overview. In Fodder Oats: A World Overview; Suttie, J.M., Reynolds, S.G., Eds.; FAO Plant Production and Protection Series No.33; Food and Agriculture Organization of the United Nations: Rome, Italy, 2004; p. 251. ISBN 92-5-105243-3. [Google Scholar]
  2. EUROSTAT. apro_cpnh1. 2021. Available online: http://appsso.eurostat.ec.europa.eu/nui/submitViewTableAction.do (accessed on 16 December 2021).
  3. Sawasawa, H.L.A. Crop Yield Estimation: Integrating RS, GIS, and Management Factors. A Case Study of Birkoor and Kortigiri Mandals, Nizamabad District India. Master’s Thesis, International Institute for Geo-Information Science and Earth Observation, Enschede, The Netherlands, March 2003. [Google Scholar]
  4. Bartholy, J.; Barcza, Z.; Bihari, Z.; Czira, T.; Haszpra, L.; Horányi, A.; Horváth, E.S.; Krüzselyi, I.; Lakatos., M.; Mészáros, R.; et al. Klímaváltozás. Klímaszcenáriók a Kárpát-medence térségére. Országos Meteorológiai vizsgálat. (Climate Change, Climate Scenarios in Carpathian Basin Region. National Meteorological Study); Hungarian Academy of Sciences and Eötvös Lóránd University: Budapest, Hungary, 2011. (In Hungarian) [Google Scholar]
  5. Juhász, C.; Gálya, B.; Kovács, E.; Nagy, A.; Tamás, J.; Huzsvai, L. Seasonal predictability of weather and crop yield in regions of Central European continental climate. Comput. Electron. Agric. 2020, 173, 105400. [Google Scholar] [CrossRef]
  6. Szász, G. Termésingadozást kiváltó éghajlati változékonyság a Kárpát-medencében. (Yield fluctuation caused by climatic variability in Carpathian Basin). Agro-21 füzetek 2005, 40, 33–69. (In Hungarian) [Google Scholar]
  7. Prince, S.D. A model of regional primary production for use with coarse resolution satellite data. Int. J. Remote Sens. 1991, 12, 1313–1330. [Google Scholar] [CrossRef]
  8. Baret, F.; Guyot, G. Potentials and limits of vegetation indices for LAI and APAR assessment. Remote Sens. Environ. 1991, 35, 161–173. [Google Scholar] [CrossRef]
  9. Bolton, D.K.; Friedl, M.A. Forecasting crop yield using remotely sensed vegetation indices and crop phenology metrics. Agric. For. Meteorol. 2013, 173, 74–84. [Google Scholar] [CrossRef]
  10. Panda, S.S.; Ames, D.P.; Panigrahi, S. Application of vegetation indices for agricultural crop yield prediction using neural network techniques. Remote Sens. 2010, 2, 673–696. [Google Scholar] [CrossRef] [Green Version]
  11. Dempewolf, J.; Adusei, B.; Becker-Reshef, I.; Hansen, M.; Potapov, P.; Khan, A.; Barker, B. Wheat yield forecasting for Punjab Province from vegetation index time series and historic crop statistics. Remote Sens. 2014, 6, 9653–9675. [Google Scholar] [CrossRef] [Green Version]
  12. Mkhabela, M.S.; Bullock, P.; Raj, S.; Wang, S.; Yang, Y. Crop yield forecasting on the Canadian Prairies using MODIS NDVI data. Agric. For. Meteorol. 2011, 151, 385–393. [Google Scholar] [CrossRef]
  13. de la Casa, A.; Ovando, G.; Bressanini, L.; Martínez, J.; Díaz, G.; Miranda, C. Soybean crop coverage estimation from NDVI images with different spatial resolution to evaluate yield variability in a plot. ISPRS J. Photogramm. Remote Sens. 2018, 146, 531–547. [Google Scholar] [CrossRef]
  14. Pullanagari, R.R.; Yule, I.; King, W.; Dalley, D.; Dynes, R. The use of optical sensors to estimate pasture quality. Int. J. Smart Sens. Intell. Syst. 2011, 4, 125–137. [Google Scholar] [CrossRef] [Green Version]
  15. Pallottino, F.; Antonucci, F.; Costa, C.; Bisagli, C.; Figorilli, S.; Menesatti, P. Optoelectronic proximal sensing vehicle-mounted technologies in precision agriculture: A review. Comput. Electron. Agric. 2019, 162, 859–873. [Google Scholar] [CrossRef]
  16. Modica, G.; Messina, G.; De Luca, G.; Fiozzo, V.; Praticò, S. Monitoring the vegetation vigor in heterogeneous citrus and olive orchards.A multiscale object-based approach to extract trees’crowns from UAV multispectral imagery. Comput. Electron. Agric. 2020, 175, 105500. [Google Scholar] [CrossRef]
  17. Riczu, P.; Nagy, A.; Tamás, J.; Lehoczky, É. Precision weed detection using terrestrial laser scanning techniques. Commun. Soil Sci. Plant Anal. 2015, 46, 309–316. [Google Scholar] [CrossRef] [Green Version]
  18. Frew, A.; Weston, L.A.; Reynolds, O.L.; Gurr, G.M. The role of silicon in plant biology: A paradigm shift in research approach. Ann. Bot. 2018, 121, 1265–1273. [Google Scholar] [CrossRef] [PubMed] [Green Version]
  19. Kutasy, E.; Buday-Bódi, E.; Virág, I.C.; Forgács, F.; Melash, A.A.; Zsombik, L.; Nagy, A.; Csajbók, J. Mitigating the Negative Effect of Drought Stress in Oat (Avena sativa L.) with Silicon and Sulphur Foliar Fertilization. Plants 2022, 11, 30. [Google Scholar] [CrossRef] [PubMed]
  20. Bhat, J.A.; Shivaraj, S.M.; Singh, P.; Navadagi, D.B.; Tripathi, D.K.; Dash, P.K.; Solanke, A.U.; Sonah, H.; Deshmukh, R. Role of Silicon in Mitigation of Heavy Metal Stresses in Crop Plants. Plants 2019, 8, 71. [Google Scholar] [CrossRef] [Green Version]
  21. Ning, D.; Song, A.; Fan, F.; Li, Z.; Liang, Y. Effects of slag-based silicon fertilizer on rice growth and brown-spot resistance. PLoS ONE 2014, 9, e102681. [Google Scholar] [CrossRef] [PubMed] [Green Version]
  22. Villegas, J.M.; Way, M.O.; Pearson, R.A.; Stout, M.J. Integrating Soil Silicon Amendment into Management Programs for Insect Pests of Drill-Seeded Rice. Plants 2017, 6, 33. [Google Scholar] [CrossRef] [Green Version]
  23. Yu, Z.; She, M.; Zheng, T.; Diepeveen, D.; Islam, S.; Zhao, Y.; Zhang, Y.; Tang, G.; Zhang, Y.; Zhang, J.; et al. Impact and mechanism of sulphur-deficiency on modern wheat farming nitrogen-related sustainability and gliadin content. Commun. Biol. 2021, 4, 945. [Google Scholar] [CrossRef]
  24. Zenda, T.; Liu, S.; Dong, A.; Duan, H. Revisiting Sulphur—The Once Neglected Nutrient: It’s Roles in Plant Growth, Metabolism, Stress Tolerance and Crop Production. Agriculture 2021, 11, 626. [Google Scholar] [CrossRef]
  25. Tewkesbury, A.P.; Comber, A.J.; Tate, N.J.; Lamb, A.; Fisher, P.F. A critical synthesis of remotely sensed optical image change detection techniques. Remote Sens. Environ. 2015, 160, 1–14. [Google Scholar] [CrossRef] [Green Version]
  26. Vicente-Serrano, S.M.; Cabello, D.; Tomás-Burguera, M.; Martín-Hernández, N.; Beguería, S.; Azorin-Molina, C.; Kenawy, A.E. Drought variability and land degradation in semiarid regions: Assessment using remote sensing data and drought indices (1982–2011). Remote Sens. 2015, 7, 4391–4423. [Google Scholar] [CrossRef] [Green Version]
  27. Atzberger, C. Advances in remote sensing of agriculture: Context description, existing operational monitoring systems and major information needs. Remote Sens. 2013, 5, 949–981. [Google Scholar] [CrossRef] [Green Version]
  28. Tamás, J.; Nagy, A.; Fehér, J. Agricultural biomass monitoring on watersheds based on remotely sensed data. Water Sci. Technol. 2015, 72, 2212–2220. [Google Scholar] [CrossRef] [PubMed]
  29. Nagy, A.; Szabó, A.; Adeniyi, O.D.; Tamás, J. Wheat Yield Forecasting for the Tisza River Catchment Using Landsat 8 NDVI and SAVI Time Series and Reported Crop Statistics. Agronomy 2021, 11, 652. [Google Scholar] [CrossRef]
  30. Clement, S.; Lassman, F.; Barley, E.; Evans-Lacko, S.; Williams, P.; Yamaguchi, S.; Slade, M.; Rüsch, N.; Thornicroft, G. Mass media interventions for reducing mental health-relatedstigma (Review). Cochrane Libr. 2013, 23, CD009453. [Google Scholar]
  31. USS Working Group WRB. World Reference Base for Soil Resources 2014, International Soil Classification System for Naming Soils and Creating Legends for Soil Maps; World Soil Resources Reports; FAO: Rome, Italy, 2015. [Google Scholar]
  32. Konica Minolta. Available online: https://www5.konicaminolta.eu/fileadmin/content/eu/Measuring_Instruments/2_Products/1_Colour_Measurement/6_Chlorophyll_Meter/PDF/Spad502plus_EN.pdf (accessed on 22 January 2022).
  33. Meier, U. Growth Stages of Mono and Dicotyledonous Plants, BBCH Monograph; Julius Kühn-Institut (JKI): Quedlinburg, Germany, 2018. [Google Scholar] [CrossRef]
  34. Rouse, W.J.; Haas, R.H.; Schell, J.A.; Deering, D.W. Monitoring Vegetation Systems in the Great Plains with ERTS. In Proceedings of the Third ERTS Symposium, Washington, DC, USA, 10–14 December 1973; pp. 309–317. [Google Scholar]
  35. Sentera. 2021. Available online: https://support.sentera.com/portal/en/kb/sentera (accessed on 21 January 2022).
  36. Szabó, A.; Tamás, J.; Nagy, A. The influence of hail net on the water balance and leaf pigment content of apple orchards. Sci. Hortic. 2021, 283, 110112. [Google Scholar] [CrossRef]
  37. Droppa, M.; Erdei, S.; Horváth, G.; Kissimom, J.; Mészáros, A.; Szalai, J.; Kosáry, J. Növénybiokémiai és élettani gyakorlatok (Plant Biochemistry and Physiology Practices); Budapest University of Economic Sciences and Public Administration: Budapest, Hungary, 2003; p. 88. (In Hungarian) [Google Scholar]
  38. Olesen, J.; Trnka, M.; Kersebaum, K.; Peltonen-Sainio, P.; Rossi, F.; Kozyra, J.; Micale, F.; Seguin, B.; Skjelvåg, A. Impacts and adaptation of European crop production systems to climate change. Eur. J. Agron. 2011, 34, 96–112. [Google Scholar] [CrossRef]
  39. Hatfield, J.L.; Prueger, J.H. Value of Using Different Vegetative Indices to Quantify Agricultural Crop Characteristics at Different Growth Stages under Varying Management Practices. Remote Sens. 2010, 2, 562–578. [Google Scholar] [CrossRef] [Green Version]
  40. Mielke, M.; Schaffer, B.; Li, C. Use of a SPAD meter to estimate chlorophyll content in Eugenia uniflora L. leaves as affected by contrasting light environments and soil flooding. Photosynthetica 2010, 48, 332–338. [Google Scholar] [CrossRef]
  41. Zandonadi, C.H.S.; Albuquerque, C.J.B.; de Freitas, R.S. Chlorophyll index (SPAD) and macronutrients relation and productive performance of sorghum hybrids in different sowing dates. Aust. J. Crop. Sci. 2016, 10, 546–555. [Google Scholar] [CrossRef]
  42. Żelazny, W.R. Application of feature selection for predicting leaf chlorophyll content in oats (Avena sativa L.) from hyperspectral imagery. Agron. Res. 2020, 18, 2665–2676. [Google Scholar] [CrossRef]
  43. Shah, J.; Wang, X.; Khan, S.U.; Khan, S.; Gurmani, Z.A.; Fiaz, S.; Qayyum, A. Optical-Sensor-Based Nitrogen Management in Oat for Yield Enhancement. Sustainability 2021, 13, 6955. [Google Scholar] [CrossRef]
  44. Kizilgeci, F.; Yildirim, M.; Islam, M.S.; Ratnasekera, D.; Iqbal, M.A.; Sabagh, A.E. Normalized Difference Vegetation Index and Chlorophyll Content for Precision Nitrogen Management in Durum Wheat Cultivars under Semi-Arid Conditions. Sustainability 2021, 13, 3725. [Google Scholar] [CrossRef]
  45. Öner, F. Assessment of genetic variation in Turkish local maize genotypes using multivariate discriminant analysis. Appl. Ecol. Environ. Res. 2018, 16, 1369–1380. [Google Scholar] [CrossRef]
  46. Bégué, A.; Arvor, D.; Bellon, B.; Betbeder, J.; De Abelleyra, D.; Ferraz, R.P.D.; Lebourgeois, V.; Lelong, C.; Simões, M.; Verón, S.R. Remote Sensing and Cropping Practices: A Review. Remote Sens. 2018, 10, 99. [Google Scholar] [CrossRef] [Green Version]
  47. Rascio, A.; Carlino, E.; De Santis, G.; Di Fonzo, N. A Discriminant Analysis to Categorize Durum Wheat Varieties in Drought-tolerance Classes on the Basis of Rheological and Physiological Traits. Cereal Res. Commun. 2013, 41, 88–96. Available online: http://www.jstor.org/stable/23792259 (accessed on 26 January 2022). [CrossRef]
  48. Chivasa, W.; Mutanga, O.; Biradar, C. Phenology-based discrimination of maize (Zea mays L.) varieties using multitemporal hyperspectral data. J. Appl. Rem. Sens. 2019, 13, 017504. [Google Scholar] [CrossRef]
  49. Zhang, H.; Hinze, L.L.; Lan, Y.; Westbrook, J.K.; Hoffmann, W.C. Discriminating among Cotton Cultivars with Varying Leaf Characteristics Using Hyperspectral Radiometry. Trans. ASABE 2012, 55, 275–280. [Google Scholar] [CrossRef]
Figure 1. Monthly precipitation totals and monthly average temperatures compared to the 30-year average. 30-year-average: monthly averages for the period 1981–2010 at the experiment site, first published by Kutasy et al. [19].
Sustainability 14 03339 g001
Figure 2. Field map with base map of NDRE image of 4 June 2021; Control, Si, S, Si+S: foliar fertilization treatments; I., II., III.: replications; inside the treatment blocks the six oat varieties ((1) ‘Mv Hópehely’, (2) ‘Mv Kincsem’, (3) ‘Mv Imperiál’, (4) ‘Mv Istráng’, (5) ‘GK Arany’, (6) ‘GK Impala’) were randomized.
Sustainability 14 03339 g002
Figure 3. DEM of the experiment site within the parcels; Control, Si, S, Si+S: foliar fertilization treatments; I., II., III.: replications; inside the treatment blocks the six oat varieties were randomized.
Sustainability 14 03339 g003
Figure 4. Soil pH map for the winter oat parcels; Control, Si, S, Si+S: foliar fertilization treatments; I., II., III.: replications; inside the treatment blocks the six oat varieties were randomized.
Sustainability 14 03339 g004
Figure 5. Map of the experiment generated from chlorophyll content (µg g–1) values measured on 24 June 2021; control, Si, S, Si+S: foliar fertilization treatments; I., II., III.: replications; inside the treatment blocks the six oat varieties were randomized.
Sustainability 14 03339 g005
Figure 6. The SPAD values of the winter oat as the effect of the treatments (Debrecen, 10 June 2021); Means of the varieties, ±standard error. The differences among the treatments were significant at p = 0.001. The different letters mean significant difference at p < 0.05 among the treatments.
Sustainability 14 03339 g006
Figure 7. The SPAD values of the winter oat varieties as the effect of the treatments (Debrecen, 10 June 2021); ±standard error. The differences among the treatments were significant at p = 0.001. The different letters mean significant difference at p < 0.05 among the treatments.
Sustainability 14 03339 g007
Figure 8. The NDVI values of the winter oat as the effect of the treatments (Debrecen, 2021); Mean of the varieties, ±standard error. The differences among the treatments were significant at p = 0.001. The different letters mean significant difference at p < 0.05 among the treatments.
Sustainability 14 03339 g008
Figure 9. The NDVI values of the winter oat varieties as the effect of the treatments (Debrecen, 3 June 2021); ±standard error. The differences among the treatments were significant at p = 0.001. The different letters mean significant difference at p < 0.05 among the treatments.
Sustainability 14 03339 g009
Figure 10. Winter oat experiment RGB 4 June 2021. Captured by Phantom 4 Pro V2. High resolution—2 cm/pixel. The plots are clearly separated.
Sustainability 14 03339 g010
Figure 11. Winter Oat experiment 17 June 2021. NDVI raster calculated by Sentera formula. Captured by Phantom 4 Pro V2 Sentera Double 4K NDVI camera. High-resolution stitched orthophoto.
Sustainability 14 03339 g011
Figure 12. Winter Oat experiment 17 June 2021. NDRE raster calculated by Sentera formula. Captured by Phantom 4 Pro V2 Sentera Double 4K NDRE camera. High-resolution stitched orthophoto.
Sustainability 14 03339 g012
Figure 13. Yield map of the winter oat foliar fertilization experiment; Control, Si, S, Si+S: foliar fertilization treatments; I., II., III.: replications; inside the treatment blocks the six oat varieties were randomized.
Sustainability 14 03339 g013
Figure 14. Combined groups plot of discriminant analysis, oat varieties (Debrecen, 2021).
Sustainability 14 03339 g014
Figure 15. Combined groups plot of discriminant analysis, foliar fertilization treatments (Debrecen, 2021).
Sustainability 14 03339 g015
Table 1. Soil analysis results of the experiment area, first published by Kutasy et al. [19] (2021, Debrecen).
Layer
0–20 cm
Layer
20–40 cm
Layer
40–60 cm
pH (H2O)8.308.368.43
KA383838
CaCO3 (%)8.18.18.1
Humus (%)3.662.922.70
NO3+NO2 (mg kg−1)1.712.953.18
NH4 (mg kg−1)0.8361.0233.180
P2O5 (AL) (mg kg−1)1671.61376.11076.8
K2O (AL) (mg kg−1)658.9648.2525.5
SO4 (mg kg−1)3.076.007.81
Note: KA: Arany-type plasticity; AL: ammonium lactate-soluble.
Table 2. Pearson correlation coefficient (r) values between chlorophyll content, pH and SPAD values in winter oat (2021, Debrecen).
Chlorophyll ContentpHSPAD1SPAD2SPAD3
Chlorophyll content1−0.304−0.059−0.2160.011
pH−0.3041−0.0710.208−0.162
Table 3. Pearson correlation coefficient (r) values among NDVI, NDVIUAV, NDREUAV (2021, Debrecen).
NDVI1NDVI2NDVI3NDVI4NDVI5NDRE2 UAVNDRE3 UAVNDRE4 UAVNDRE5 UAV
NDVI20.683 **-0.2100.548 **0.469 **0.517 **0.516 **0.236 *0.458 **
NDVI30.270 *0.210-0.455 **0.0900.0640.2560.1720.102
NDVI40.427 **0.548 **0.455 **-0.569 **0.431 **0.529 **0.2130.296 *
NDVI50.360 **0.469 **0.0900.569 **-0.424 **0.489 **0.247 *0.388 **
NDRE2UAV0.389 **0.517 **0.0640.431 **0.424 **-0.809 **0.389 **0.742 **
NDRE3UAV0.390 **0.516 **0.2560.529 **0.489 **0.809 **-0.495 **0.594 **
NDRE4UAV0.0350.236 *0.1720.2130.247 *0.389 **0.495 **-0.555 **
NDRE5UAV0.248 *0.458 **0.1020.296 *0.388 **0.742 **0.594 **0.555 **-
NDVI1UAV1.000 **0.683 **0.270 *0.427 **0.360 **0.389 **0.390 **0.0350.248 *
NDVI2UAV0.682 **0.988 **0.2030.590 **0.495 **0.548 **0.555 **0.235 *0.491 **
NDVI3UAV0.539 **0.516 **0.700 **0.764 **0.464 **0.402 **0.506 **0.1200.204
NDVI4UAV0.423 **0.562 **0.398 **0.968 **0.571 **0.470 **0.579 **0.2160.330 **
NDVI5UAV0.279 *0.443 **0.1570.415 **0.895 **0.352 **0.419 **0.242 *0.329 **
**. Correlation is significant at the 0.01 level; *. Correlation is significant at the 0.05 level.
Table 4. Pearson correlation coefficient (r) values between NDVIUAV, NDREUAV and SPAD values in winter oat (2021, Debrecen).
SPAD1SPAD2SPAD3
NDVIUAV10.142 0.1950.437 **
NDVIUAV20.337 **0.2260.352 **
NDVIUAV30.0330.0170.031
NDVIUAV40.456 **0.1470.382 **
NDVIUAV50.601 **0.350 **0.452 **
NDRE2UAV0.457 **0.262 *0.280 *
NDRE3UAV0.485 **0.1900.282 *
NDRE4UAV0.284 *0.0220.057
NDRE5UAV0.337 **0.1510.243 *
** Correlation is significant at the 0.01 level (two-tailed); *. Correlation is significant at the 0.05 level (two-tailed).
Table 5. Discriminant analysis classification results, oat varieties.
VarietyPredicted Group Membership
123456
166.7%0%0%25%8.3%0%
20%100%0%0%0%0%
30%0%100%0%0%0%
416.7%0%0%83.3%0%0%
58.3%0%0%0%91.7%0%
68.3%0%0%0%0%91.7%
88.9% of original grouped cases were correctly classified.
Table 6. Discriminant analysis classification results, fertilization treatments.
TreatmentPredicted Group Membership
ControlSiSSi+S
Control88.9%5.6%5.6%0%
Si5.6%83.3%11.1%0%
S5.6%11.1%83.3%0%
Si+S0%5.6%0%94.4%
87.5% original grouped cases correctly classified.
Publisher’s Note: MDPI stays neutral with regard to jurisdictional claims in published maps and institutional affiliations.

