1. Introduction
1.1. Background and Motivation
China’s rapid renewable energy development has enabled more efficient power structure optimization; however, its energy regulation laws and related measures are imperfect. Currently, policies and mechanisms do not provide sufficient incentives for developing renewable energy sources. A study on the regulation of China’s electricity market is essential in order to improve its regulatory policies under the conditions of a large-scale renewable energy grid connection. At the early stage of renewable energy development, research on renewable energy encouraged policies such as financial subsidies, tax deductions, and technical assistance. Generally, researchers believe that technology breakthroughs are essential for rapid development and that government policy support for R&D (research and development) should be increased. Hillring, [
1] discuss the importance of renewable energy technologies in promoting the development of the renewable energy industry and recommend that the government, in the initial phase, encourage technology research, encourage the dissemination of information, and implement effective administrative policies to encourage the development of renewable energy. According to references [
2,
3], research on the relationship between renewable energy, low-carbon development, energy supply security, and carbon taxes has gained momentum due to policies and the maturation of renewable energy markets. Scholars anticipate that the government will implement a package of policies for achieving a sustainable low-carbon future. In Kalkuhla et al. [
4], a global general equilibrium model was used to evaluate optimal policies using various policy instruments, including carbon taxes and renewable energy subsidies. The results showed that even very small deviations from the second-best subsidy could cause significant emissions and consumption losses. Due to their high effectiveness, renewable energy subsidies mitigated market failures associated with these technologies.
Furthermore, they can also be an important tool for tackling the important political issues raised by carbon pricing. Gawel et al. [
5], analyzed the interaction between the EU’s emissions trading scheme (ETS) and policies to support renewable energy sources (RES). In addition, he suggested that appropriate support for renewables can lead to a more effective ETS, which could eventually lead to a more efficient energy and climate policy as a whole if other objectives and externalities are taken into consideration besides climate protection. Moreover, the analysis showed that policy mixes were not necessarily negatively evaluated when looking at them from an efficiency or effectiveness perspective. Aslani et al. [
6], qualitatively and quantitatively analyzed the relationship between the policy support of renewable energy, energy dependence, and demand. Regulatory studies of the electricity industry are a longstanding research topic. In a study by Tye. [
7], generation, transmission, distribution functions, and organizational forms in the power industry were examined. Given the current technological state, the author proposed that these functions are inseparable and that deregulation and competition should be allowed in the power generation market. Hazam [
8], Ritschel, et al. [
9], and Kemezis [
10] have also studied the impact of regulatory philosophy and changes in cognition on the electricity sector. During globalization, they predicted that deregulation would accompany the power industry. Rose [
11] conducted a study of three regulating models and the US electricity market. His presentation explained how different regulatory methods work and illustrated the deregulation trend in the electricity market. In his study, he suggested that gradual liberalization of the power industry might be on the horizon. Nakajima [
12] examined US electricity retail markets without strict regulation and concluded that deregulation does not significantly affect price elasticity. Hogselius et al. [
13], examined in detail the responses of key stakeholders to deregulation in the electricity industry under both a political and a commercial context.
A review of recent studies on power industry regulation devoted quite a bit of time examining renewable energy regulation, encompassing different types of electricity and relevant market players. Shaw et al. [
14], describe the relationship between UK energy policy, regulatory objectives, and the regulation of distribution network operators (DNOs) since privatization, and suggest reforms to the regulatory framework to facilitate future low-carbon development. Geraldo et al. give an overview of the major regulatory changes in the power sector in Brazil, especially those that affect small hydropower. In order to achieve sustainability in the country’s energy system, the researchers assert that everyone involved in the renewable energy supply chain must take on a collective effort, and clear rules must be established that are both perennial and non-discriminatory for different renewable energies [
15]. Tükenmez et al. [
16], presented arguments stating that administrative obstacles, grid access problems, lack of training and information, and social acceptance were the major obstacles to increasing renewable energy production in Turkey. Byrnes et al. [
17], provided an overview of Australia’s renewable energy policies, incentives, and regulatory environment and analyzed the barriers facing the industry. The authors emphasized the need to eliminate the obstacles to developing renewable energy; otherwise, Australia’s abundant renewable resources would not be developed further, resulting in a loss of opportunities for social, environmental, and economic gains. According to Agrell et al. [
18], the most significant impacts of new investment policies were analyzed regarding tasks, assets, and costs and compared to hypothetical economic regulation assumptions. They developed a model for analyzing regulatory investment provisions using conventional principal agency theory. Their research suggested that network regulation should be centered around a focal point, incorporate externalities into performance assessments, and avoid decentralized contract billings smart-grid investments. According to Wijayatunga [
19] and colleagues’ analysis, the development of a policy and regulatory framework, as well as the implementation of different approaches to renewable energy, have been successful in Sri Lanka, resulting in the rapid expansion of the renewable energy supply industry, not only in terms of overall capacity additions but also via diversification of renewable energy sources. Wang et al. [
20], established a critical analysis of China’s national renewable energy policy and assessed its impacts on the power generation structure.
Electricity generation and consumption in China increased by 0.9 and 1.3 percent, respectively, in 2020, producing capacity of power plants increased by 5.6 GW, coal consumption of power supply decreased by 4.3 g/kWh, power generation projects investment increased by 51.6 billion RMB, power grid projects investment decreased by 1.8 billion RMB, and newly installed generation capacity increased by 769 GW year on year (YOY), respectively. During the first three quarters of 2021, the generation, consumption, and coal consumption of electricity increased respectively by 10.7% and 12.9%, the generating capacity of power plants increased by 9.4 GW, the average coal consumption of power supply decreased by 0.9 g/kWh, power generation projects investment increased by 1.8 billion RMB, while the power grid projects investment decreased by 0.3 billion RMB and new generation capacity added around 20.16 GW compared to the same period last year.
1.2. Contribution and Organization
This study analyzes China’s power demand and supply, generation, electricity usage patterns, and market structure in both upstream and downstream sectors during the past two years and the outlook and forecast for renewable energy development in China and emerging business opportunities. The data contained in this article are based on information gathered from the relevant agencies. Because of the rapid pace of development, the data are not precise enough to define quantitative models. The purpose of this article is to provide a comprehensive analysis of electricity demand, consumption, generation, and supply for 2020–2021 and to suggest new strategies for managing strategic energy in the absence of adequate data. Due to the above circumstances, the main innovations in this study are as follows:
Analyze and illustrate the recent development in the field of renewable energy development in China.
A detailed review of electricity generation and consumption in the years 2020 and 2021 is provided and analyzed, according to consumption by regions and industries.
Identify and recommend appropriate preventive, remedial, and policy measures to minimize the effects on the electricity sector.
The remainder of this paper is outlined as follows. In
Section 2, the method for the systematic literature review is described.
Section 3 presents data and scenarios used to assess the development of renewable energy in China and the sustainability of the power industry. In
Section 4, discussion and results are presented.
Section 5 discusses the electricity consumption for 2020 and 2021, and
Section 6 presents the conclusion and policy recommendation.
2. Literature Review
The analysis of the available studies allowed us to provide a brief overview of the Chinese electric power industry structure and analyze historical electrical demand and supply data. It explains how divergent energy policies can accelerate the development and application of renewable energy in China’s power sector. Based on
Table 1, studies are categorized by areas of application and impact. The following subsections overview the research findings on air quality, investments, and recent developments in renewable energy, electricity demand, electricity supply, electricity consumption, and renewable energy forecast for 2020 and 2021.
2.1. Overview of the Renewable Energy Sector
China’s economic development is heavily reliant on energy production. There are serious environmental and energy security concerns associated with coal and oil consumption. Chinese authorities have increasingly pushed for optimizing their energy structures in recent years. Due to the rapid development of the renewable energy industry, long-term goals and policies have been implemented. China has become the world’s largest market for renewable energy, which has reduced its dependence on coal [
26,
27,
28,
55].
Chinese renewable energy development has made ground-breaking progress in the last few years. In 2005, the Renewable Energy Law was introduced; it was amended in 2009. Several supporting policies have been issued to support the establishment of standardization committees for hydropower, wind power, and photovoltaics (PV). Hydropower is a leading source of renewable energy in China, and it plays a key role in the country’s energy supply. In order to support the industry’s growth, several support activities have been enhanced, including certification, construction, and exploration. In January 2021, the National Energy Administration (NEA) of China released its draft Energy Law for public comment (Draft Energy Law), and this stipulates that renewable energy will be prioritized [
29].
China is experiencing a boom in renewable energy production. Through solar and wind energy, the country strives to increase its share of total energy production. Hydropower, wind power, and solar energy are three of China’s most prevalent renewable energy sources. China is one of the world’s top wind and solar energy producers. The solar energy industry in China has grown to become the world’s largest market for solar energy since 2013. A recent article published by the International Energy Agency [
39] predicts China will contribute 40% of the world’s wind energy growth and 36% of its solar energy growth in the next five years.
Currently, China is converting from fossil fuels to renewable energy sources and promoting sustainable energy. China’s 14th Five-Year Plan, which outlines economic and regional development goals in 2020–2025, has included developing a clean, low-carbon, safe, and efficient energy system by 2050 as part of its energy revolution [
31]. Foreign investments in the renewable energy sector are encouraged by the Chinese government. An updated Industry Catalog for Encouraged Foreign Investment (“Catalogue”) has been released for public comment by the National Development and Reform Commission and the Ministry of Commerce. The Catalogue identifies renewable energy as one of the sectors attracting foreign investment by allowing foreign companies to establish wholly owned enterprises to develop this industry in China [
56].
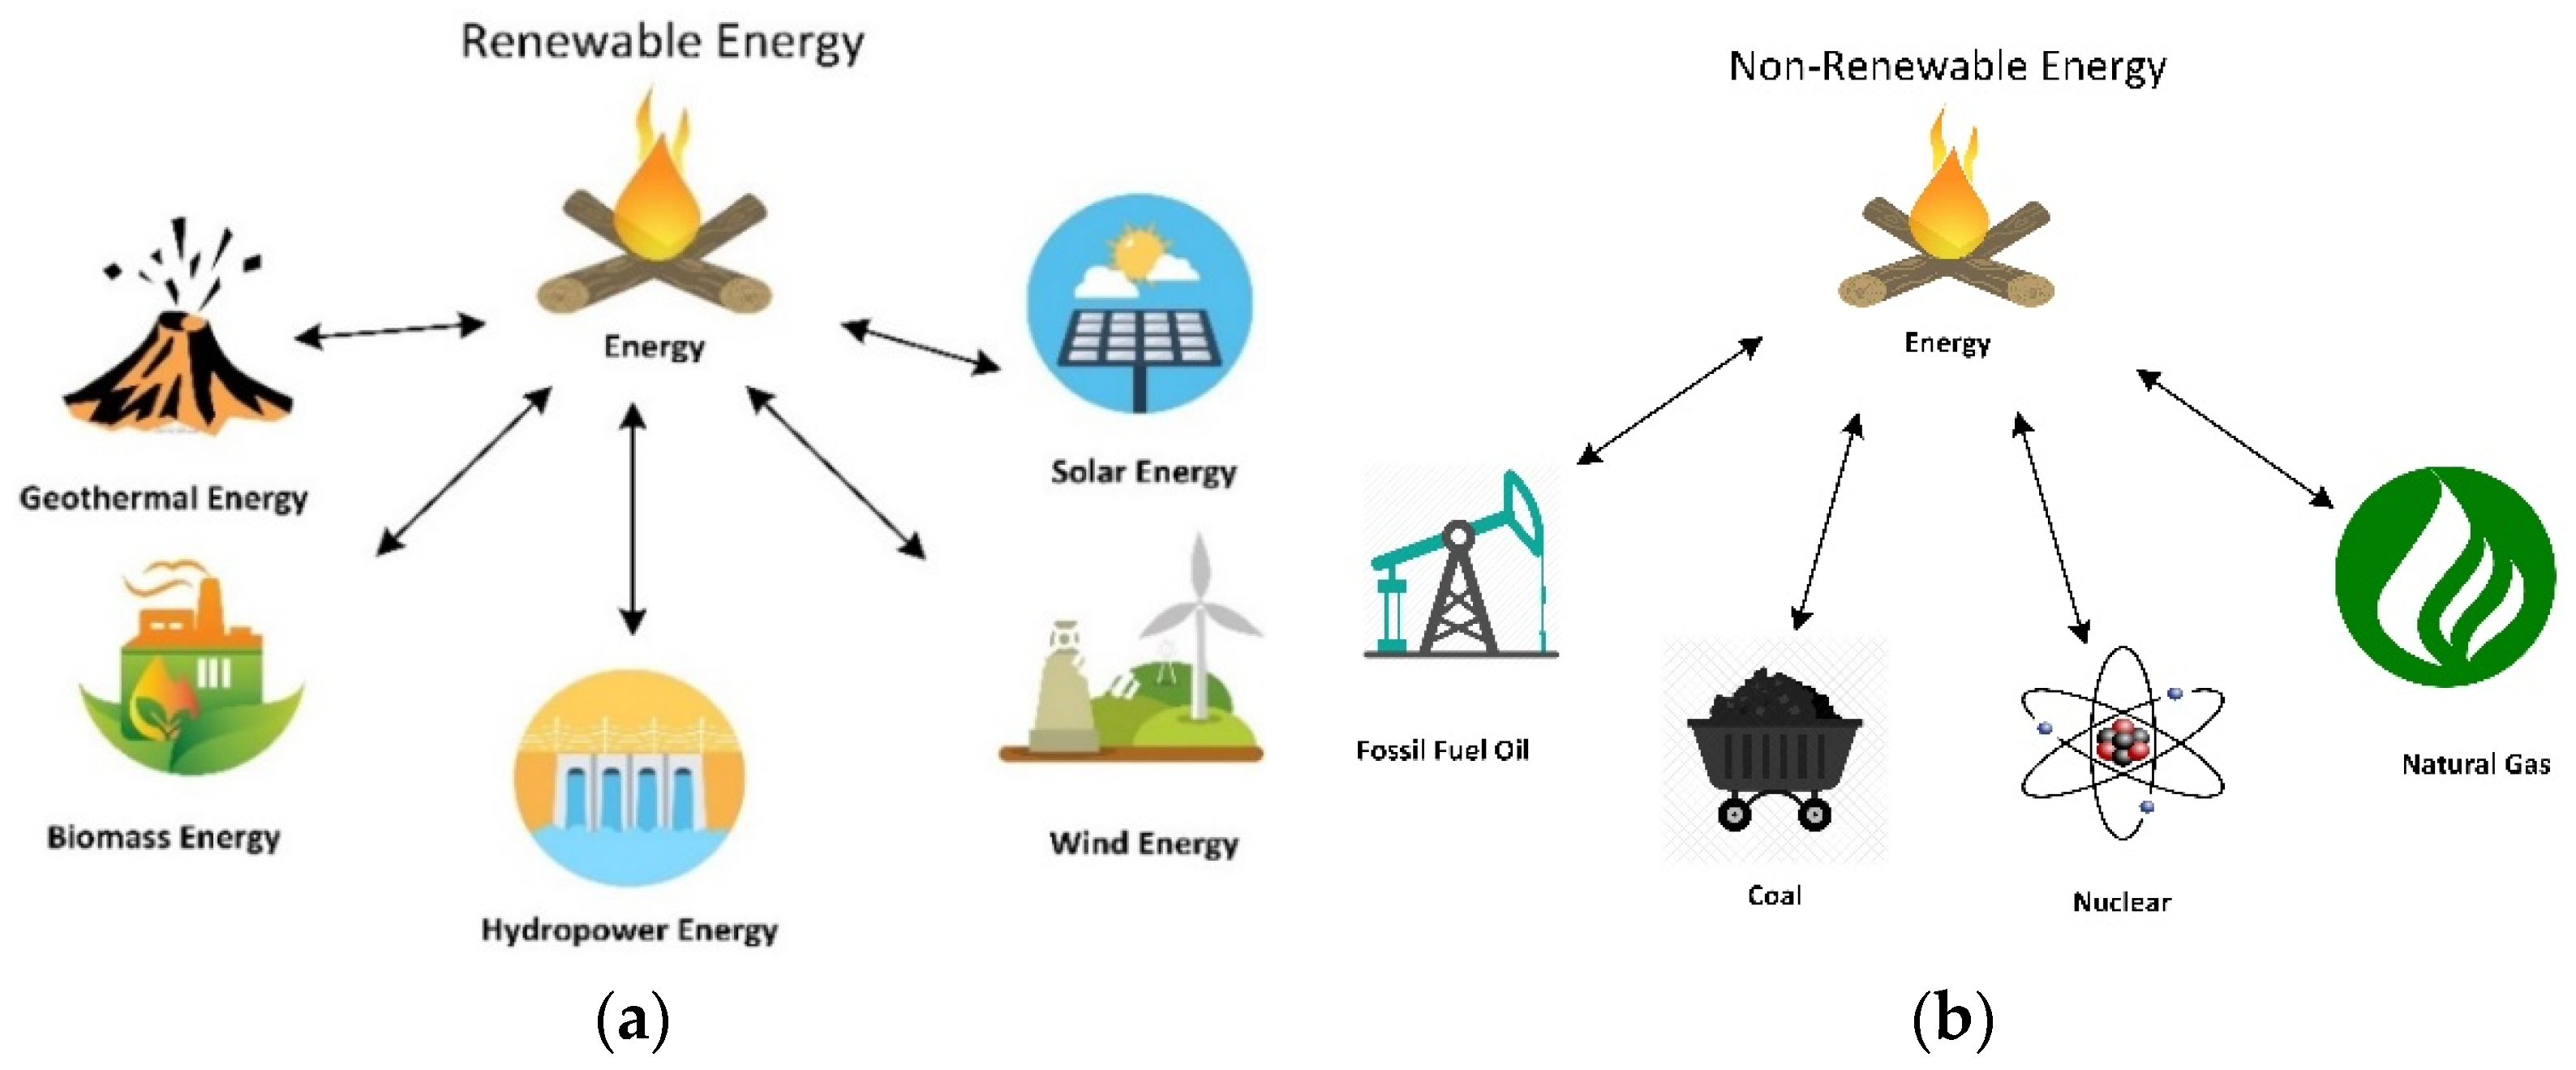
Figure 1 illustrates the sources of renewable and non-renewable energy.
2.2. Recent Development in the Renewable Energy Sector
In China, investments in renewable energy decreased by 8% in 2020 due to a combination of policy changes and market shifts. In addition to the slow economy in many sectors in 2021, the pandemic has undoubtedly impacted the renewable energy sector. Electricity demand has decreased because of COVID-19 [
49]. In particular, wind capacity has been affected by a decrease of 30.47 percent. However, Chinese policies implemented in 2020 show that the government is committed to developing renewable energy [
34]. In the Draft Energy Law, one of the most significant measures focuses on renewable energy policies that will boost the development of this industry [
41]. Energy law drafts elevate renewable energy development to a strategic position, thereby clarifying that its development should be prioritized.
On the other hand, fossil energy development must be handled responsibly. A new strategic and structural development level has been set for renewable energy resources [
42]. In addition, the Draft Energy Law contains a system of mandatory requirements to consume renewable energy, a significant change that extends the consumption requirement from grid companies to a broader range of firms, including those that sell and supply energy.
According to China’s National Energy Administration, 25.74 million kilowatts of new wind energy capacity were added to the country’s grid in 2019, and the curtailment rate fell by 3 percentage points [
43]. The national average abandonment rate for photovoltaic power generation decreased from 2.2% to 2.1%, increasing by 30.11 million kW. A total of 210 million kilowatts and 204 million kilowatts of grid-connected capacity were generated by wind and photovoltaic power, respectively, by the end of 2019 [
44].
Despite several setbacks, wind energy and photovoltaic power have continued to develop in China steadily and efficiently in 2019. However, the annual growth rate of wind power generation is significantly higher than that of photovoltaic power generation. Photovoltaic and wind power technologies have progressed rapidly and the phenomenon of power abandonment has been effectively managed [
45]. Electric storage systems, including renewable energy, have a leading position in the Chinese market. As a result of cost-competitive technologies, solar and wind energy costs have fallen dramatically in recent years. Therefore, wind and solar power no longer receive subsidies, and nationwide subsidies are also being phased out. The government is expanding its capability to develop renewable technologies as part of China’s strategy to develop renewable energy [
21,
52,
53]. By promoting distributed energy, smart grids, energy storage technology, and flexible consumption options, the National Development and Reform Commission hopes to reduce costs and increase the reliability of clean energy. They advise promoting distributed energy, smart grids, energy storage technology, and flexible consumption options to promote green energy [
56].
The focus is on increasing renewable energy consumption rather than expanding production capacity. In China, the government aims to coordinate renewable obligations and green certificates along with the participation of renewables in spot markets and ancillary services markets [
22,
23,
32,
37,
57]. Government subsidies have been provided to the renewable energy sector in China since 2011. However, the government has become stricter in restricting how these subsidies are used over the past few years. New solar PV plants can expect fewer subsidies from the NEA in 2020, as the number of subsidies has been reduced from CNY 2.6 billion to CNY 1.5 billion [
29].
2.3. Renewable Energy Development in the Year 2020
By 2020, the global renewable energy industry will have grown by more than 280 GW due to key market policy deadlines, the highest annual growth rate for the past 20 years. Supply chains continued to be challenged by the pandemic and construction delays, but renewable capacity additions in 2020 increased by over 45% from 2019 and broke yet another record. The expansion of wind power capacity worldwide rose by 90%. Furthermore, the growth in new solar PV installations of 23% to nearly 135 GW in 2020 contributed to this record growth. There was a large increase in renewable energy capacity in 2020 due to objectives implemented by the United States, China, and Vietnam. China accounted for 80% of the annual solar and wind installations increase, including offshore wind and solar PV projects contracted under China’s former feed-in tariff scheme (FIT). Those awarded in previous central and provincial competitive auctions had to be connected to the grid by 2020. Wind energy developers in the United States rushed to finalize their projects before the production tax credit (PTC) expired, even though it was extended by one year until December 2020. A record number of commercial and residential solar PV projects were installed in Vietnam during the phaseout of the feed-in tariffs (FITs) [
35,
58], as shown in the
Figure 2.
2.4. Renewable Energy Development for 2021 and 2022
The deployment of renewable energy accelerated in 2020, resulting in a “new normal” for renewable additions in 2021 and 2022. With 280 GW of new renewable energy capacity expected to be operational in 2022 and 270 GW in 2021, the pace of renewable energy addition is likely to continue at an exceptional level. As shown in
Figure 3, this growth is over 50% higher than the annual additions of capacity during 2017–2019, so renewables are expected to contribute nearly 90% of the global capacity additions in 2021 and 2022 [
59].
In 2022, annual wind capacity additions will decline after China’s extraordinary increase in 2021. Despite this, 80 GW of installations will be completed worldwide in 2022, increasing 35% over 2019. Solar PV capacity additions have continued to grow due to low investment costs and government support, lessening the effect of the slower growth of wind power additions. It is expected that solar PV expansion will reach 145 GW and 162 GW at the end of this year and next year, breaking record numbers and accounting for almost 55% of renewable energy expansion. By 2022, the rapid growth of hydropower in China will be driven by the commissioning of large hydropower projects. Other renewable energy, led by bioenergy, has had a steady growth rate, averaging 3% of all additions to renewable energy generation [
60], as illustrated in
Figure 4.
2.5. Renewable Energy Policy Transition in China
China has consistently contributed 40% to global renewable capacity growth for several years, but in 2020, it was responsible for 50% for the first time. This was made possible by a peak in new installations in December. Our projections for renewable capacity additions in China in 2022 are expected to decline by one quarter following the government’s phasing out of subsidies for wind and solar PV projects at the end of 2020. Additionally, there are uncertainties surrounding the new incentive schemes set to be announced by the end of 2022. Although China still projects that its annual additions of renewable energy capacity will increase by 45% in 2021 and 58% by 2022, these numbers are substantially higher than the average additions from 2017–2019. The country’s growth is expected to accelerate again only after 2022, boosted by new policies aligned with its ambitious long-term goal of achieving net-zero emissions by 2060 [
61]. For more information, see
Figure 5.
2.6. Future Developments and Opportunities in the Renewables Sector
In China, energy transformation is taking place. Among China’s challenges, including energy security, climate change, and severe air and water pollution, renewable energy plays a crucial role [
30,
37,
62,
63,
64,
65,
66,
67,
68]. According to the 14th Five Year Plan of China, which sets out the blueprint for the country’s economy and development goals for 2021–2025, renewable energy and innovative projects, such as renewable consumption within certain emerging industries, receive the most attention. Renewable energy technologies are becoming more competitive in cost as the subsidies in the sector are gradually phased out, along with the revision of the emission trading scheme (ETS) to achieve grid parity for renewable energy.
By the end of the 14th Five-Year Plan, wind and solar energy should have reached grid parity. By 2060, wind and solar power will be carbon neutral. There is no doubt that China will become carbon neutral and it is not clear yet how it will do so, but renewable energy will play a major role. In light of the reduced curtailments, renewable energy usage is expected to increase. Technical innovations will play a crucial role in renewable energy, battery storage, and green hydrogen. During the 75th anniversary General Assembly of the United Nations, a China official announced that China would reach peak emissions [
69].
3. Methodology
Our research uses the official data records issued by the Chinese government to provide a comprehensive and analytical description of the trend changes in electricity production and consumption in the first three quarters of 2020–2021. Statistics on energy production and consumption in the first three quarters of 2020 will be compared to those in the first three quarters of 2021 in order to focus and analyze the effects on the power industry. Overall, the China Electricity Council [
70] and the Ministry of Ecology and Environment [
71] put together an official database showing China’s electricity production and consumption, renewable energy policies, and climate change activities. The overview of the methodology is illustrated in
Figure 6.
4. Results Overview and Discussion
4.1. Data on Electricity Generation during the First Three Quarters of 2020
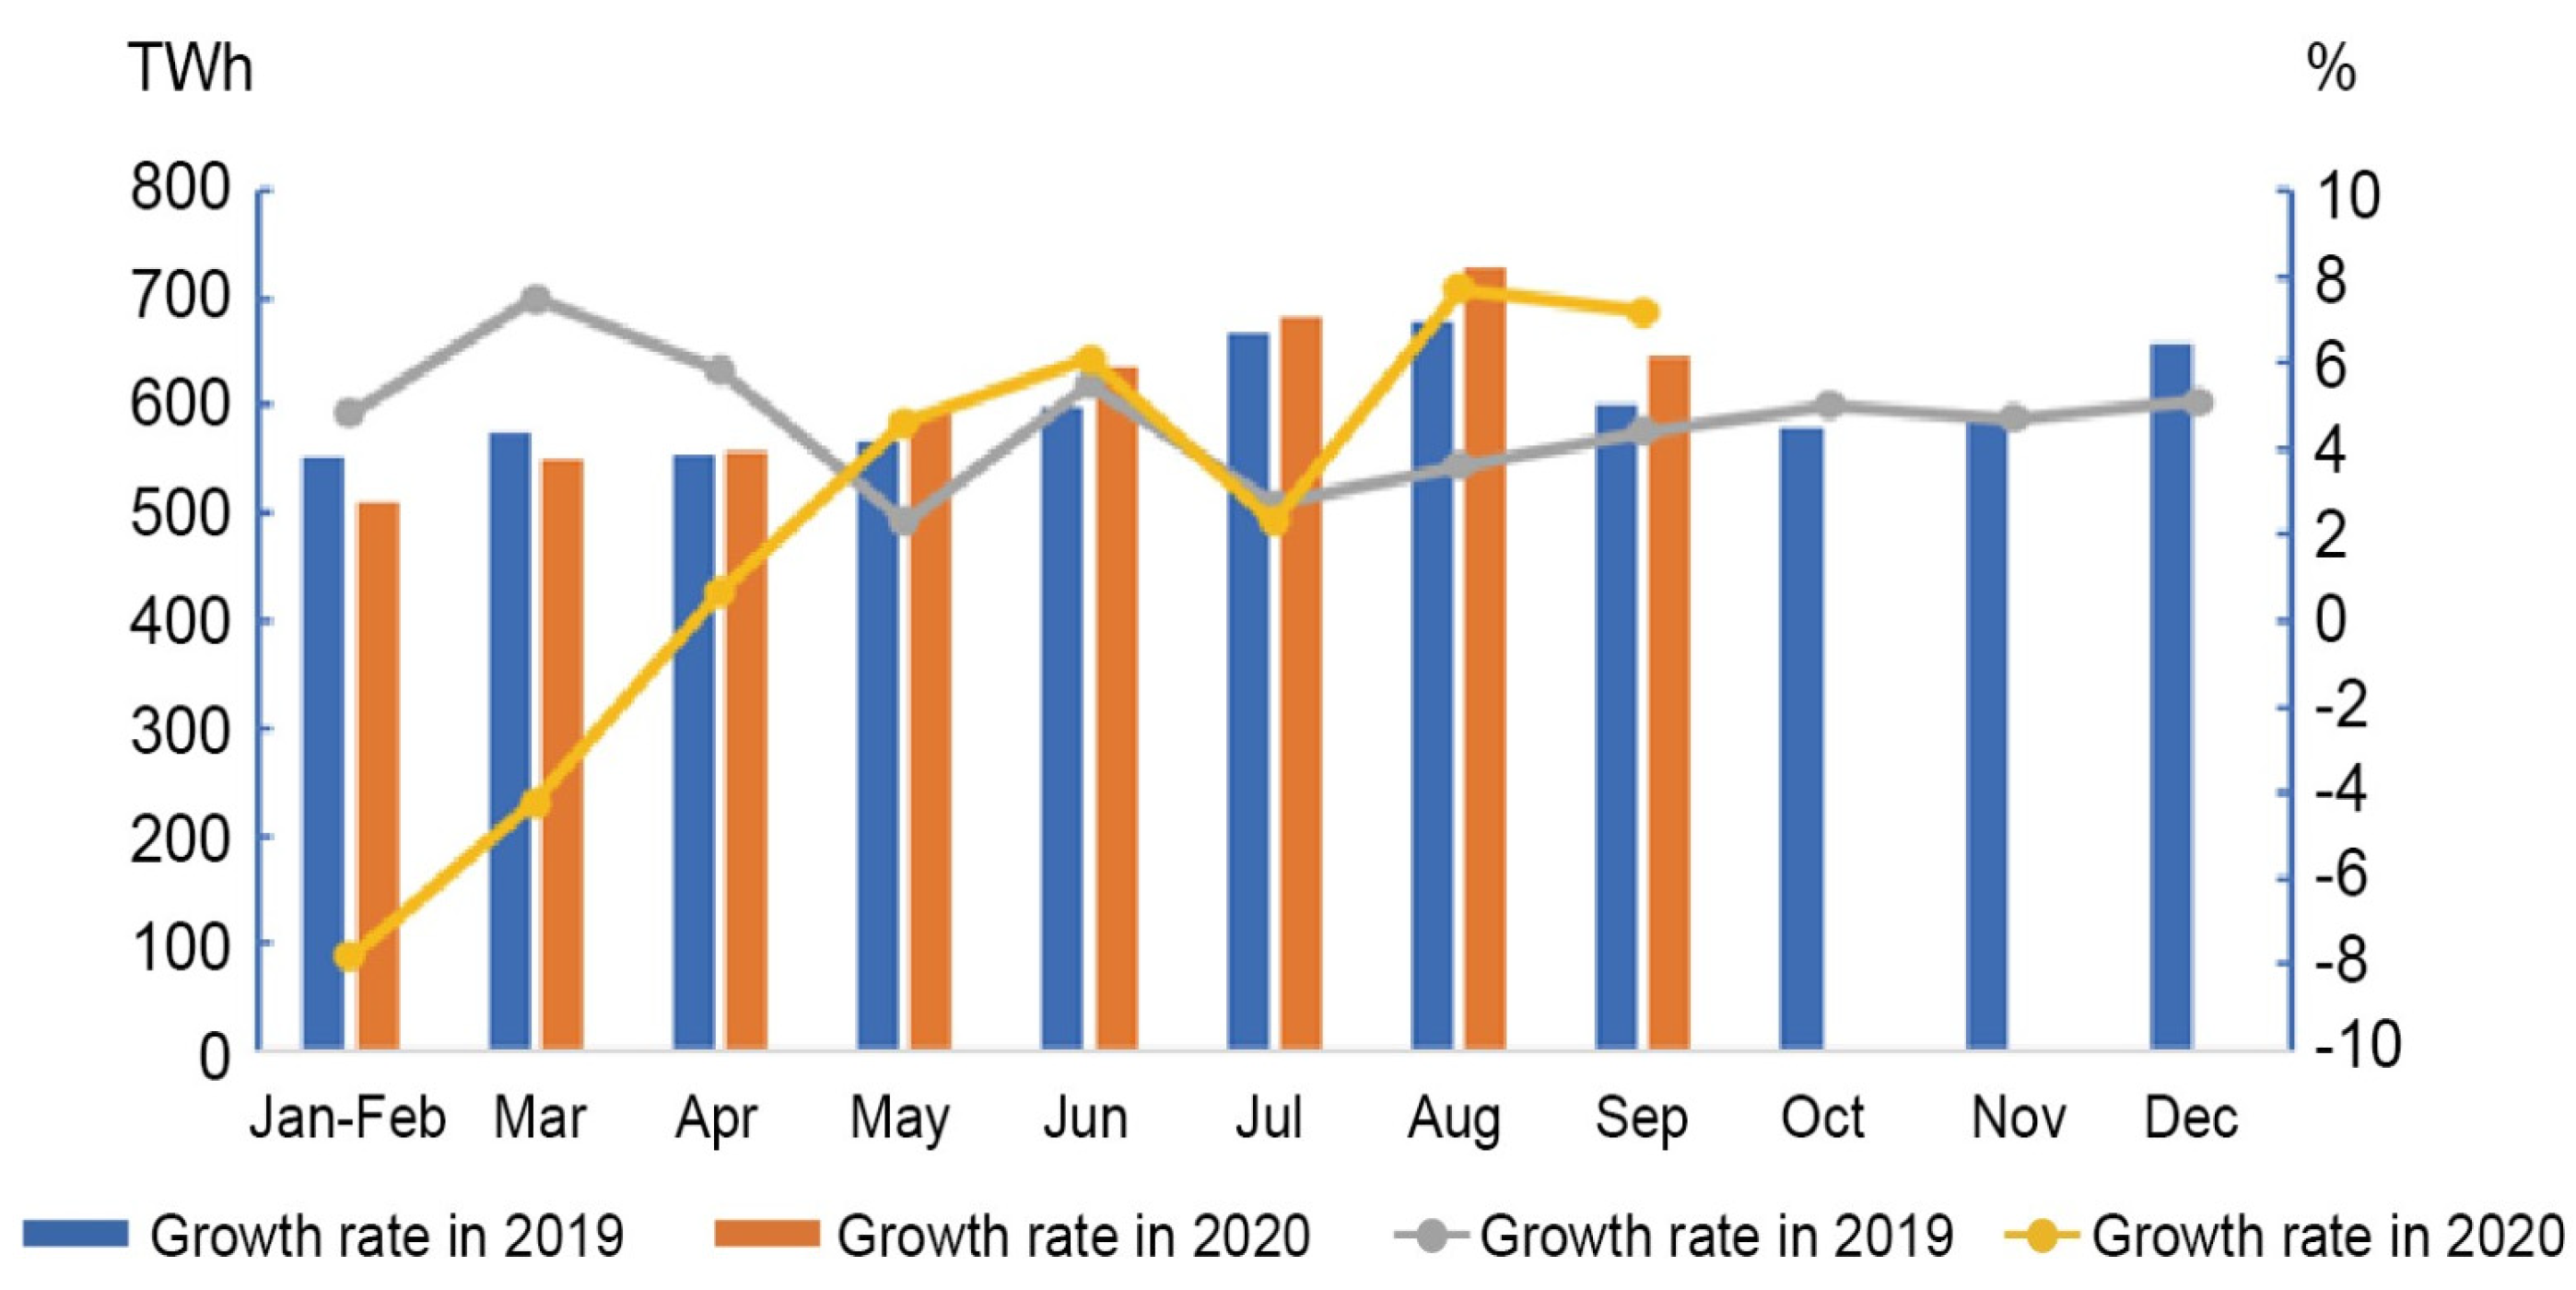
In the period from January to September, electric power generation nationwide amounted to 5408.6 TWh, representing an increase of 0.9% year on year. Hydroelectricity generation was 902.5 TWh from January to September, an increase of 0.9% year on year. Thermal electricity generation was 3831.6 TWh, a decrease of 0.3% year on year. Nuclear electricity generation was 341.5 TWh, a growth of 7.1% year on year. Finally, wind electricity generation was 333.0 TWh, a growth of 14.3% year on year [
46]. For more details see
Table 2.
4.2. Electricity Consumption by the Whole Society in 2020
During the first three quarters of 2020, electricity consumption increased by 1.3% to 5413.4 TWh, with growth rates of −6.5%, 3.9%, and 5.8%, respectively. Economic recovery is the most significant factor behind improving electricity consumption growth. As a result of these improvements, primary industry electricity consumption reached 63.7 TWh from January to September, increasing 9.6% year on year. Production in the animal husbandry and fishery sectors also increased quite rapidly. Quarterly growth rates for the first, second, and third quarters were 4.0%, 11.9%, and 11.6%, respectively. In the animal husbandry, fishery, and agriculture industries, electricity consumption increased by 18.8%, 11.2%, and 5.4%, respectively.
According to statistics, the energy consumption of the secondary industry was 3602.5 TWh in 2020, up 0.5% over the same period last year. Growth rates in the first, second, and third quarters were 8.8%, 3.3%, and 5.8%. The energy consumption of the tertiary sector was 897.5 TWh, down 0.2% compared to a year earlier. The electricity consumption of the information transmission/software and information technology services industries continued to grow strongly, with growth rates of −8.3%, 0.5%, and 5.9% in the first, second, and third quarters, respectively. The information transmission/software and information technology service industries saw a growth of 26.5% in their electricity consumption in the first three quarters of 2020 because of the continuous promotion of big data, cloud computing, and the Internet of Things.
Residential electricity consumption was 849.8 TWh in the first three quarters of 2020, increasing 6.0% over the same period last year. In the first, second, and third quarters, the growth rates were 3.5%, 10.6%, and 5.0%, respectively. In western provinces, 22 provinces recorded positive gains in electricity consumption over the past year, as illustrated in
Figure 7.
In September, electric power generation nationwide amounted to 631.5 TWh, representing an increase of 5.3% year on year. Hydroelectricity generation was 138.5 TWh in September, an increase of 22.8% year on year. Thermal electricity generation was 422.3 TWh, an increase of 0.2% year on year. Nuclear electricity generation was 40.5 TWh, a growth of 8.4% year on year. Finally, wind electricity generation was 30.2 TWh, a growth of 14.7% year on year.
In September, the overall electricity consumption was 645.4 TWh, an increase of 7.2% over the same period last year. Specifically, electricity consumption by the primary, secondary, and tertiary industries increased by 11.6%, 8.6%, and 5.1% year on year in September, while the industrial and residential consumption increased by 8.7% and 4.0%, respectively, as indicated in
Figure 8 and
Table 3.
4.3. Electricity Consumption by Regions
Electricity consumption in eastern, central, western, and northeast China from January to September 2020 was 2563.6 TWh, 1016.3 TWh, 1526.2 TWh, and 307.3 TWh, respectively, with year on year growth rates of 0.4%, −0.4%, 4.2%, and 0.6%.
Figure 9 illustrates that electricity consumption growth rates in the eastern, central, western, and northeast regions were 7.7%, 9.1%, 6.0%, and 2.9%, respectively, in September. In the central and western regions, the growth rates were higher by 1.3 and 0.1 percentage points than the previous month, while in the eastern and northeast regions, they were lower by 1.4 and 0.8 percent, respectively.
From January to September, the annual growth rate of electricity consumption in 17 provinces exceeded that in the national average: Yunnan (9.3%), Gansu (6.6%), Inner Mongolia (6.2%), Sichuan (5.7%), Guangxi (5.7%), Tibet (5.6%), Jiangxi (4.3%), Xinjiang (4.2%), Anhui (2.7%), Qinghai (2.6%), Jilin (2.6%), Guangdong (2.3%), Hainan (2.2%), Fujian (2.2%), Guizhou (1.7%), Hunan (1.7%), and Shaanxi (1.4%).
Twelve provinces had higher increases in electricity consumption than the national average in September, including Henan (15.7%), Anhui (14.5%), Hainan (13.7%), Shanxi (11.2%), Yunnan (11.2%), Sichuan (11.1%), Shandong (10.2%), Guangdong (9.7%), Shaanxi (9.5%), Jiangsu (9.0%), Tibet (8.0%), and Hebei (7.9%). According to
Figure 10, Beijing (−3.7%), Ningxia (−3.5%), and Hubei (−0.02) are the only provinces with negative growth rates of electricity consumption.
4.4. Electricity Consumption in the Industrial and Manufacturing Sector in 2020
The national industrial electricity consumption in 2020 went from January to September at 3536.5 TWh, an increase of 0.5%. The growth rate declined by 2.3 percentage points over the same period the previous year, representing 65.3% of the total power consumption, as illustrated in
Table 2. From January to September, industrial electricity consumption amounted to 2683.7 TWh, a 0.7% growth rate compared to the same period last year, and a 2.5-point decline in growth rate. In total, the electricity consumption of these four energy-intensive industries amounted to 1490.36 TWh, an increase of 1.7% over the previous year. However, the growth rate declined by 1.1 percentage points compared to the same period of the previous year. High-tech and equipment manufacturing activity consumed 553.5 TWh, a 1.1% increase year on year, and the growth rate was down 2.3 percentage points compared to the same period last year. Electricity consumption of the consumer goods manufacturing industry was 351.6 TWh, a decline of 4.3% over the previous year. The growth rate decreased by 6.3 percentage points from the previous year’s same period. In other manufacturing markets, electricity consumption was 288.3 TWh, a growth rate of 4.8 percentage points lower than the same period last year and an increase of 1.3% year on year.
Based on the data in
Table 2, the national industrial electricity consumption in September 2020 was 402.3 TWh, an increase of 8.7% from September last year. The annual percentage growth rate was 5.3 points higher from the same time last year. The share of industrial electricity in the total electricity consumption was 62.3%. During September, the manufacturing industry consumed 333.9 TWh of electricity, an increase of 8.9% year on year and an increase of 6.6 percentage points compared to the same period last year. The average daily electricity consumption in the manufacturing industry was 11.13 TWh, up by 0.91 TWh from the same period last year and down by 0.19 TWh from last month. The total electricity consumption of the four energy-intensive industries was 180.0 TWh, increasing 8.8% year on year. The growth rate increased by 8.7 percentage points from the same period of the previous year. The electricity consumption of the high-tech and equipment manufacturing industry increased by 11.8% year on year, and the growth rate was 7.4 percentage points higher than that of the same period in the previous year. As of the end of September, the electricity consumption of the consumer goods manufacturing industry was 46.6 TWh, an increase of 4.9% year on year and an increase of 0.9 percentage points from the same period of the previous year. According to
Figure 11, the electricity consumption of other manufacturing industries was 36.4 TWh, an increase of 9.2% over last year and an increase of 2.1 percentage points over the same period last year.
4.5. Electricity Consumption in Energy-Intensive Industries
The chemical industry consumed 331.4 TWh of electricity from January to September, a decrease of 0.6% year on year. The growth rate fell by 1.5 percentage points from the same period last year. In the building materials industry, electricity consumption was 272.8 TWh, up 0.9% year on year, but growth was down by 4.9 percentage points compared with the same period of the previous year. The ferrous metal smelting and refining industry consumed 432.9 TWh, an increase of 2.2% year on year, and the rate of growth was 3.5 points less than in the same period of the previous year. In the non-ferrous metal smelting and refining industry, electricity consumption was 453.1 TWh, an increase of 3.4% over the previous year. The increase rate was 3.6 percentage points higher than the previous year.
The chemical industry consumed 38.1 TWh of electricity in September, an increase of 5.2% on a year over year basis, and the growth rate was 6.1 percentage points higher than it was in the same period last year. Electricity consumption by the building materials industry reached 36.8TWh, representing a 10.3% increase year on year, which contains a growth rate of 5.0 percentage points higher than last year. The electricity consumption of the ferrous metal smelting and refining industry was 51.8 TWh in September 2020, an increase of 8.9% over last year, and the growth rate increased by 6.2 percentage points over the same period in the last year. According to
Figure 12, the non-ferrous metal smelting and refining industry consumed 53.3 TWh of electricity, an increase of 10.3% from the previous year, with an increased rate of 15.1% over the same period last year.
5. The National Power Supply and Demand Situation in the Year 2020
The national economy’s growth rate and energy consumption turned from negative to positive in the first three quarters of 2020 due to COVID-19 and a complex and changeable environment, with GDP increasing by 0.7%.
Investments in electric power increased by 20% year on year in the first three quarters, and investments in non-fossil energy grew rapidly. Major power enterprises incorporated into the industry investment statistics system have completed investments of 598 billion yuan, an increase of 20%. The completed investment in power generation engineering projects was 308 billion yuan, up 51.6% year on year; wind power and hydropower investment rose by 138.4% and 21.0%, and thermal power and nuclear power investment decreased by −27.2% and −2.3%, respectively; the investment in power grid construction fell −1.8% year on year to 289.9 billion yuan.
The newly installed generation capacity scale in the first three quarters of 2020 was 72.24 GW, a year on year increase of 769 GW. The share of non-fossil energy power generation also increased. At the end of September, hydropower in China had an installed capacity of 547 GW, thermal power was 335 GW, nuclear power was −297 GW, and grid-connected wind power was −2 GW. China’s installed capacity of non-fossil energy power generation totaled 890 GW, representing 42.6% of the total power generation capacity, up 0.6 percentage points since 2020. For more details, see
Table 2 and
Figure 13.
The Power Generation Equipment’s Average Utilization Hour
During the first three quarters of the year 2020, the average utilization hours of power generation equipment were 2758 h, down 98 h from the same period last year; the utilization hours of hydropower equipment were 2894 h, 9 h lower than the same period last year; thermal power equipment’s utilization hours were 3047 h, a decline of 127 h over last year; nuclear power equipment’s utilization hours were 5521 h, an increase of 69 h over last year; and grid-connected wind power equipment’s utilization hours were 1549 h, an increase of 30 h over last year as shown in
Figure 14.
In the first three quarters of 2018, the total amount of trans-regional power transmission was 452.7 TWh, increasing 13.2% over the same period last year. In the first, second, and third quarters, these growth rates were 6.8%, 11.7%, and 17.0%, respectively. The province-to-province transmission of power in China reached 1135.9 TWh, an increase of 5.0%. Electricity market transactions increased 16.2% over the previous year. The power trading centers in China completed 2256.4 TWh of market-transaction electricity in the first three quarters, an increase of 16.2% year on year. The medium and long-term direct electricity trading volume in the power market was 1767.4 TWh, an increase of 17.7% year on year, representing 32.6% of total electricity consumption, an increase of 4.5 percentage points year on year.
6. Power Supply and Demand Forecast for 2020
The power industry resolutely carried out the policies and deployments made by the State Council in the wake of the COVID-19 outbreak and the difficult domestic and international environment in 2020. During the pandemic, power enterprises also adopted preventive and control measures against the disease and secured power supplies so that society could resume normal business operations. By the end of 2020, electricity consumption had grown more rapidly, indicating that electricity supply and demand had reached a balanced state. Some areas had surplus power during peak hours, while others were restricted. During the control of the COVID-19 outbreak, the power supply was generally sufficient and reliable, providing a solid foundation for both pandemic prevention and control and economic development.
Under the influence of domestic and foreign economic conditions, meteorology, and power substitution, the electricity consumption of China increased by around 6% in the fourth quarter of the year, and the whole year’s consumption was up by 2–3% in 2020.
The share of non-fossil energy power generation capacity continues to increase. The total newly installed power production capacity in China for the whole year was about 140 GW, of which 93 GW was non-fossil energy power generation. At the end of the year, the total power generation capacity was 2140 GW, a 6.3% increase over the previous year. Non-fossil energy power generation reached 930GW, accounting for 43.7% of total installed capacity, an increase of about 1.7 percentage points since the end of 2020.
China’s power supply and demand were predicted to balance in the fourth quarter of 2020. However, some regions experienced power shortages during peak hours. It was expected that supply and demand would be balanced in north China and east China; however, supply capacity in northeast and northwest China was surplus. As a result, coal supply is uncertain in the northeast, with high heating and power supply pressure [
40].
7. Data of Electricity Generation in the Year 2021
In the period from January to September, electric power generation nationwide amounted to 6072.1 TWh, representing an increase of 10.7% year on year. Hydroelectricity generation was 903.1 TWh from January to September, a decrease of 0.9% year on year; thermal electricity generation was 4327.3 TWh, an increase of 11.9% year on year; nuclear electricity generation was 841.7 TWh, a growth of 18.3% year on year [
47] as shown in
Table 4.
7.1. Electricity Consumption by the Whole Society in 2021
In the first three quarters of 2021, China’s power consumption reached 6165.1 TWh, increasing 12.9% year on year. Monthly consumption in September was 694.7 TWh, increasing 6.8% year on year. As a result of the pandemic last year, power consumption increased rapidly in the first three quarters. In the first, second, and third quarters of the past two years, the average quarterly growth of total power consumption was 7.0%, 6.5%, and 8.2%. Over the past two years, the overall power consumption growth and average growth rate showed how China’s economy grew steadily and continuously.
Between January and September, the primary industry’s overall power consumption was 75.8 TWh, representing a year on year increase of 18.9%. The power consumption potential of the primary industry has been continually unlocked as China works to promote the development of the rural economy. Year on year growth rates were 26.4%, 15.9%, and 14.3% in the first, second, and third quarters, respectively, and the two-year average growth rate was 14.6% and 14.1%, maintaining rapid growth momentum.
The second industry’s power consumption was 4098.0 TWh in the first three quarters of 2021, increasing 12.3% year on year. Quarterly growth rates for the first, second, and third quarters were 24.1%, 10.6%, and 7.3%, respectively, while the two-year average growth rate was 7.4% and 7.3%. According to data from the Department of Energy, power consumption for high-tech and equipment manufacturing is increasing at a higher rate than average for other manufacturing sectors, reflecting that the manufacturing industry is experiencing an upgrade and new forces are driving the expansion.
During the period of January to September 2021, the tertiary industry consumed 1082.6 TWh, up 20.7% year on year and 9.9% on average. The first, second, and third quarters saw quarterly growth rates of 28.2%, 23.6%, and 9.9%, respectively. The two-year average growth rate was 7.9% and 12.0%, respectively, reflecting a faster recovery for the tertiary industry in the second quarter. In the first half of 2021, the hotel and catering industry grew by 36.8%, the business and leasing industry grew by 34.9%, the wholesale and retail industry grew by 32.9%, and the average annual growth rates were 6.5%, 13.2%, and 11.4%, respectively. During the last two years, the information and software service industry’s power consumption has grown at a rate of 26.3%. Due to the rapid growth of the electric vehicle industry, the power consumption of the charging and swapping industry has increased by 90% over the past two years.
During the first three quarters of 2021, residential power consumption reached 908.8 TWh, increasing 7.0% annually. The average increase over the last two years was 5.6%. Growth rates were 4.7%, 4.2%, and 5.6% in the first, second, and third quarters, respectively, and the two-year average was 3.9% and 7.9%. As shown in
Table 2 and
Figure 15, the power consumption of urban residents increased by 6.0% year on year and increased by an average of 4.9% over the two years, while the power consumption of rural residents increased by 2.6% year on year and increased by an average of 6.5% over the two years.
In September, electric power generation nationwide amounted to 675.1 TWh, representing an increase of 4.9% year on year. Hydro electricity generation was 189.8 TWh in September, a decrease of 0.6% year on year. Thermal electricity generation was 452.1 TWh, an increase of 5.7% year on year. Nuclear electricity generation was 33.2 TWh, a growth of 4.3% year on year.
During September, total electricity consumption for the primary, secondary, and tertiary industries grew by 14.9%, 6.0%, and 12.1%, whereas residential electricity consumption grew by 3.7%.
Figure 16 and
Table 5 illustrate these statistics.
7.2. Electricity Consumption by Region
During the first three quarters of 2021, east China experienced a higher power consumption growth rate than the previous year, and west and east China had greater two-year average growth rates. During the first three quarters of 2021, the annual growth rate of total power consumption in east, central, west, and northeast China was 2965.1 TWh, 1156.9 TWh, 1710.8 TWh, and 332.3 TWh, respectively. The growth rates in the four regions were 13.6%, 13.8%, 12.1%, and 8.2%. Average growth rates for two years were 7.8%, 6.5%, 8.7%, and 4.4%.
In September, China’s electricity consumption grew at 7.4%, 9.9%, 4.3%, and 3.3% in eastern, central, western, and northeastern regions. For more information, see
Figure 17.
From January to September, the growth rate of electricity consumption in 16 provinces of the country exceeded the national average, namely: Tibet (22.8%), Hubei (19.2%), Zhejiang (18.1%), Jiangxi (17.9%), Qinghai (17.2%), Fujian (16.8%), Shaanxi (16.7%), Guangdong (16.5%), Sichuan (16.1%), Ningxia (16.0%), Jiangsu (14.9%), Guangxi (14.9%), Chongqing (14.7%), Anhui (14.5%), Guizhou (13.7%), and Hunan (13.5%). Only 15 provinces experienced higher growth in electricity consumption than the national average in September, including Jiangxi (27.1%), Fujian (19.3%), Qinghai (18.9%), Hubei (17.6%), Chongqing (17.2%), Shanghai (16.6%), Zhejiang (16.2%), Anhui (11.8%), Xinjiang (11.6%), Guangdong (11.3%), Guizhou (10.1%), Tibet (9.8%), Hunan (8.9%), Beijing (7.5%), and Guangxi (7.2%) as shown in
Figure 18.
7.3. Electricity Consumption in the Industrial and Manufacturing Sector in 2021
The industrial electricity consumption nationwide reached 4021.3 TWh in January–September, an increase of 12.2%, representing 11.7 percentage points greater than the growth of the same period last year and accounting for 65.2% of the overall electricity demand. As of the first three quarters of 2017, the manufacturing industry utilized 3079.4 TWh of electricity, increasing 13.3% on a year over year basis, 12.6 percentage points higher than the prior year’s growth. The total electricity consumption for the four energy-intensive industries was 1662.0 TWh, growing by 9.5% year over year, with the growth rate increasing by 7.8 percentage points from the same period last year. The high-tech and equipment manufacturing industry consumed 663.5 TWh of electricity, increasing 19.7% year on year, 18.6 percentage points higher than the previous year’s same period. The consumer goods manufacturing industry consumed 415.0 TWh of electricity, an increase of 16.2%, or 20.5 percentage points over last year.
Figure 19 shows that the electricity consumption in other manufacturing industries was 338.8 TWh, 17.2% year over year, or a 15.9 percentage point increase.
In September, the national industrial electricity consumption increased 6.0% year on year and decreased 2.7 percentage points compared to last year, accounting for 62.8% of the monthly electricity consumption. Manufacturing industry electricity consumption stood at 343.4 TWh, an increase of 1.7% over the previous year, a decrease of 7.1 percentage points compared to the same period last year. In addition, the average daily electricity consumption of the manufacturing sector was 11.45 terawatt-hours/day, up by about 0.32 terawatt-hours/day from the same period last year. Among the four energy-intensive industries, electricity consumption amounted to 181.2 TWh, a decrease of 1.0%, with the growth rate dropping by 9.8 percentage points since the same period of the previous year. High-tech and equipment manufacturing industries consumed 75.3 TWh of electricity, an increase of 6.4% over last year, but 5.4 percentage points lower than the same period of the previous year. In the consumer goods manufacturing industry, electricity consumption was 48.2 TWh, up 2.3%, but the growth rate dropped by 2.7 percentage points.
Figure 19 and
Figure 20 show that the electricity consumption of other manufacturing industries was 38.7 TWh, an increase of 5.9% year on year, 3.3 percentage points lower than the same period last year.
7.4. Electricity Consumption in Energy-Intensive Industries
Electricity consumption for the chemical industry was 374.0 TWh from January to September of 2021, up 8.9% year on year with a 9.5 percent growth rate compared to the same period the previous year. The electricity consumption of the building materials sector was 308.4 TWh, an increase of 12.4% over the same period last year, 11.4 percentage points higher. The ferrous metal smelting and refining industry consumed 480.0 TWh, representing a 10.6% increase year on year, 8.3 percentage points higher than the same period last year. The electricity consumption of the non-ferrous metal smelting and refining industry was 499.6 TWh, a 7.3% increase and growth rate 3.9 percentage point increase compared to the same period of the previous year.
The chemical industry consumed 40.2 TWh of electricity in September, increasing 1.8% compared with last year’s same period. However, its growth rate decreased by 3.4 percentage points. In the building materials industry, electricity consumption was 36.3 TWh, down 1.9% year on year and 12.2 percentage points from the same period in the previous year. The electricity consumption of the ferrous metal smelting and refining industry was 49.8 TWh during the period, an increase of 4.3% year on year and a decrease of 13.2 percentage points from the previous year. In the non-ferrous metal smelting and refining industry, electricity consumption reached 54.9 TWh in 2021, increasing 0.7% year on year but dropping 9.7%. For more information, see
Figure 21.
8. The National Power Supply and Demand Situation in 2021
The installed generation capacity of China reached 2.26 TWh by the end of September 2021, up 9.5% year on year. The amount of non-fossil energy capacity installed in 2021 was 45.4% of the total installed capacity, an increase of 3.2% over last year. According to the latest data, the proportion of coal-fired power installed generating capacity was 48.2%, decreasing 3.3% year on year. Following carbon neutrality and carbon peak, it was evident that green and low-carbon technologies were being implemented in the power sector. During the first three quarters of 2021, the nation generated 6072.1 TWh of electricity, increasing by 10.7% year on year. The average utilization hours of power generation equipment were 2880, increasing by 113 h this year.
A total of 313.8 billion RMB was invested by major power enterprises in the first three quarters, increasing 1.8% year on year. Hydropower, thermal power, nuclear power, and solar power investments grew by 5.3%, 12.3%, 51.6%, and 27.3%, and wind power investments shrank by −126%, respectively; investment in power grid construction came in at 289.1 billion yuan, which was a decrease of 0.3% year on year.
The newly installed capacity of China’s power plants reached 92.40 GW in the first three quarters, growing by 20.16% year on year. In September, China’s installed generating capacity of hydropower reached 14.36 GW, up 6.09%; the installed capacity of thermal power reached 32.46 GW, up 0.63%; the installed capacity of nuclear power reached 3.40 GW, up 2.28%; the installed capacity of grid-connected wind power reached 16.43 GW, up 3.36%; and the installed capacity of grid-connected solar power reached 25.56 GW, up 7.85%. There was an increase of 17.8% in installed capacity of non-fossil energy year on year to 1.02 GW, a 45.4%, 3.2% increase over the previous year. There was an increase of 2.5 GW in installed coal power capacity year on year to 1.09 GW, a 48.2% increase, a 3.3% decrease from last year.
Table 4 and
Figure 22 show that grid-connected wind and solar power generation capacity increased by 44.6% and 24.0% over the previous year, respectively, and thermal power generation increased by 15.0% over the previous year [
48].
The national total installed power generation capacity increased 9.4% year over year to 2294.83 TWh in the first half of 2021. The hydropower generating capacity of the nation was 383.53 TWh and increased by 5.0% due to low precipitation and other factors; limited by high power consumption and the slow thermal power generation growth, the nuclear power generation capacity of the nation was 53.26 TWh and increased by 6.8% year on year. Grid-connected wind power generation capacity was 297.27 TWh, and grid-connected solar power generation capacity was 278.35 TWh, increasing by 32.8% and 24.6%, respectively, year on year. Apart from hydropower and solar power, other equipment’s utilization hours have improved year over year, with nuclear and wind power growing by 286 h and 88 h, respectively.
Power generation equipment’s average utilization hours (AUhs) increased by 113 to 2880 in the year’s first half. In particular, the AUhs of hydropower equipment decreased by 100 h, down to 2794 h compared to last year. Nuclear power equipment reached 5824 AUhs with an increase of 321 h. Thermal power equipment AUhs grew by 280 h to 3339 h, and coal-fired power AUhs increased by 254 h to 2257 h. Grid-connected wind power equipment’s AUhs increased by 91 h to 1640 h; solar power equipment’s AUhs decreased by 4 h to 1006 h. See
Figure 23 and
Table 4 for further details.
Annual power generation increases. Cumulative coal imports declined by 19.7% during the year’s first half. During the second quarter, the price of thermal coal reached a record high, making it increasingly difficult to purchase thermal coal and ensure power supplies. In recent years, coal-fired power company fuel prices have risen substantially. The unit price of standard coal for part of the major power generation groups increased by 50.5% in June. As a result, coal-fired power companies have been losing significant market share. Several coal power companies suffered deficits, and some had 70% or more deficits in June.
During the first half of the year, China’s power demand and supply achieved an overall balance, although some areas are still experiencing pressure during peak hours. Some provinces experienced power shortages in January due to cold weather and other factors, including Jiangsu, Zhejiang, Anhui, Hunan, Jiangxi, Sichuan, Xinjiang, etc. A demand response program and measures to promote orderly power consumption were implemented immediately. In the second quarter, measures were taken to reduce demand and improve power consumption efficiency in the Western Mongolia Economic Zone, Guangdong, Yunnan, Guangxi, etc. Particularly in Yunnan and Guangxi, the power supply was limited.
China’s economy has been steadily improving and its exports have seen rapid growth, driving the demand for power consumption to rise more than expected since the beginning of last year. China’s total power consumption increased between 6 and 10% in the first three quarters and between 10 and 11% in the entire year in comparison with last year, considering the fluctuation of the domestic and international economy in the second half of the year 2021, low base numbers from a year ago, power substitution, as well as the uncertain global environment related to the pandemic. There is the possibility that the annual growth rate may exceed 11% if there is long-term, large-scale cold weather in winter [
54,
74,
75].
The Share of Non-Fossil Power Installed Capacity Is Projected to Surpass Coal Power Generation for the First Time by the End of 2022
A newly installed generation capacity of 180 GW, including 140 GW of non-fossil power, is expected to be installed. Installed generating capacity in China is expected to reach 2370 GW, an increase of 7.7% over last year. It is estimated that coal power, hydropower, grid-connected wind power, grid-connected solar power, nuclear power, and biomass power will reach 1100 GW, 390 GW, 330 GW, 310 GW, 54.41 GW, and 35 GW, respectively. The non-fossil generating capacity is projected to reach 1120 GW, or 47.3% of the total installed capacity, an increase of 2.5% compared to 2021. It is expected that non-fossil power installed capacity will overtake coal power generation for the first time.
9. Power Supply and Demand Forecast for 2021
9.1. Overall Power Consumption in 2021 Is Increased by 6–7%
China’s 14th Five-Year Plan began in 2021. New conditions at home and abroad present opportunities and challenges for the country. China’s total power consumption rose at a higher rate in the first half of 2021, then slowed down for the remainder of the year, with a 6–7% annual growth throughout the year, taking into account various factors such as the economic condition, power substitution, and low base numbers for the previous year, as well as the uncertainty caused by the pandemic and changing global environment.
9.2. The Power Supply and Demand Are Generally Balanced, but Several Areas Will Experience a Shortage during the First Half of 2022
Despite some areas experiencing tight power supply during peak hours, China’s supply and demand will remain balanced through 2022. It is forecast that more regions will have a tighter and more extensive power supply than last year. Power consumption is expected to grow rapidly in the second half on the demand side. High temperatures in the summer increase the peak-to-valley difference in power load, making shifting peak load capacity more difficult. In terms of supply, wind power and solar power generation continue to increase, and the limited flexibility of the power system will get more inflexible. Coal and power supply in southwest China will be insufficient, which will limit the power generation capacity of coal-fired power plants. Natural gas supply in some regions will be short, indicating an impact on peak load.
From a regional perspective, it is expected that central China and south China will have a tight power supply and demand during peak hours, especially in the south. In contrast, north and east China will remain balanced, while northeast and northwest China will have a surplus power supply. On a provincial level, there is a possibility that the power supply will be constrained during peak hours in some provinces, such as Western Inner Mongolia Economic Zone, Zhejiang, Anhui, Hunan, Hubei, Jiangxi, Guangdong, Yunnan, Guangxi, etc., especially in Guangdong, Yunnan, and Western Inner Mongolia Economic Zone. During the summer, provinces with tight power supplies might expand again to Jiangsu, Shandong, Henan, Hebei, Sichuan, Chongqing, and so on, if there is continuous large-scale extreme high-temperature weather.
9.3. The Percentage of Non-Fossil Energy Installed Capacity Increased in 2021
Last year, 180 GW of new generating capacity was installed, including 140 GW of non-fossil energy. The installed generating capacity of China reached 2.37 TW by 2021, an increase of about 7.7%. Non-fossil generating capacity reached 1.12 TW in 2021, representing 47.3% of the total installed capacity, an increase of 2.5 percentage points over the base number. The share of wind and solar in the power mix increased by 3 percentage points, demonstrating the growing need for flexibility and resiliency.
9.4. Overall, Power Supply and Demand Were Balanced, with Some Areas Experiencing a Tight Supply
In 2021, the power supply and demand situation were generally balanced, with only some areas experiencing slightly tight or moderately tight power supply during peak hours. On a regional level, the power supply in northeast and northwest China was surplus, but east China remained balanced. On the other hand, north, central, and south China were experiencing a relatively insufficient energy supply.
10. China’s 13th Five-Year Plan: Main Features
The Chinese government’s 13th Five-Year Plan for Energy (Energy 13FYP) was a highly anticipated document in the world and had a profound impact on the carbon trajectory of the world’s top emitter.
Chinese officials have released their 13th Five Year Plan (2016–2020), which has the climate and energy-related goals, including a cap on energy consumption and a 15% goal for non-fossil energy in China’s primary energy mix. This was the master plan for China’s development over the next five years. The Energy 13FYP was a specific instance of that master plan for the energy sector, with more detailed targets intended to guide government spending and project planning better.
Figure 24 illustrates how the 13FYP for energy fits into the hierarchy of Chinese planning, which locates it as a “Special Plan” for its sector.
As shown in
Table 6, the Chinese government has already achieved numerous 2020 targets through its Strategic Energy Action Plan (2014–2020) and its national 13th Five Year Plan. The benchmark was set based on the actual levels at the end of 2015. Based on the comparison, we can determine if China’s Energy 13FYP is sufficiently ambitious to meet domestic and international obligations. Currently, we know only a few things about the targets in the Energy 13FYP because media reports and publicly available information have been utilized.
Based on this comparison, it is apparent that most targets in the Energy 13FYP were not entirely “new.” In many cases, these policies are in line with previously announced policy items, such as the Strategic Energy Action Plan (2014–2020), which, at the time of its publication, was already thought to be ambitious in curbing coal consumption and CO2 emissions beyond international expectations. Despite this, it is notable that policymakers seem even more determined to reduce coal’s share in the country’s energy mix than they were in 2014, reducing coal’s part of its primary energy consumption from 62% to 58% and capping its consumption at 4.1 Gt (roughly similar to 2014 levels).
Additionally, the country is also setting higher targets for its renewable energy sector, although different sources report different amounts of upward adjustment. It was announced in June 2016 that wind and solar installed capacity would reach 210 GW and 110 GW, respectively, by 2020, higher than what was declared at the end of 2014. Based on the most recent statistics released by the Economic Reference, these numbers have grown even further to 250 GW and 150 GW.
11. Demand-Side Management in China’s Energy Sector
The Communist Party of China and the State Council both announced mutually in March 2021 that they would further deepen China’s power sector reform. New reforms aim to ensure stability and reliability of the power system, encourage the marketization of the electricity industry, improve livelihoods, promote energy conservation and emission reduction, and enhance regulation [
77]. There are three main reform policies: orderly deregulation of prices in competitive segments (generation and consumption); orderly exploitation of distribution and retail businesses by non-governmental capital; ensuring efficient, stable, and reliable power supply by strengthening government regulation and project coordination [
78]. There are three main areas covered by demand-side management (DSM):
Energy efficiency and energy conservation,
DSM role in accommodating renewable energy, and
Demand and supply response.
11.1. Energy Efficiency and Energy Conservation
Chinese government policies have a long history of requiring extensive programs to enhance energy efficiency and conserve energy, particularly in the industrial sector. Energy efficiency is a particularly valuable power system resource in China, where air pollution from coal-fired power plants is a large and growing problem. Grid companies are critical in enhancing energy efficiency in China [
79]. The energy efficiency issue has been discussed in various Chinese industries, including cement [
24], iron and steel [
25], buildings [
80], and transportation [
81]. The literature argues that the conditions for energy efficiency and conservation in China are “ideal” for economic growth, one that involves a highly market system of governance complemented by financially sound financial intermediaries and well-functioning legal institutions. After the barriers are lifted, ESCOs will be better equipped to make China’s energy use more efficient [
82]. Yang et al. advocated the establishment of a market-driven DSM management mechanism. Several factors have impaired the development of energy service companies (ESCOs) in China [
83], including the state of the market, finance, institutions, technology, energy pricing policies, and high transaction costs [
84].
11.2. DSM Role in Accommodating Renewable Energy
Large-scale penetration of intermittent renewable energy has increased the complexity of the power system. DSM technologies have been cited in many studies as a possible way to reduce and manage the intermittent nature of renewable energy. DSM may have a role to play in enabling the integration of the growing intermittent resources in China, according to [
50]. According to Keane et al. [
85], demand response models were developed for the Irish power system. They showed that demand response could contribute to overall system adequacy and displace some conventional generation. Despite the dramatic growth of renewable energy (wind and solar power in particular) in China since 2011, serious curtailments of renewable energy have occurred. Research has expressed serious concerns about this. Several studies have examined the role of DSM in balancing power systems with high renewable energy shares in China. The significance and multiple roles of DSM in China’s new context of accelerating green development of national economy and society during the 12th Five-Year Plan Period were highlighted by Xue et al. [
38], who argued that promoting renewable energy integration through DSM has significant economic and environmental benefits, and suggested that the best method to promote large-scale intermittent renewable energy is to leverage demand-side resources. To integrate more renewable power generation into the grids and implement more DSM projects, Zheng et al. [
86], proposed a model of IRSP, or integrated resource strategic planning. In the context of China’s power industry reform, Zhou and Yang [
87], examined the DSM and demand response programs extensively in China. Zhu [
88], argues that the rapid growth of renewable energy and new energy has presented challenges to both the supply and demand sides, and optimal solutions must be sought through their interaction. Zhou [
89], argues that DSM is part of power sector reform, which should be integrated with DSM.
11.3. Demand and Supply Response
During the past few years, demand response—a cost-effective alternative to traditional supply-side generation technologies for balancing the grid—has gained increasing attention from researchers and practitioners in the power industry. According to Shen et al. [
90], factors influencing the development of demand response programs in the US and other countries were analyzed, and actions for developing untapped demand response potential were proposed. Walawalkar et al. [
91], reviewed the gap between perceptions of the ability of demand responses to mitigate renewable energy variability and reality. In order for demand response to play a more dynamic role in electricity markets, both technological and policy changes are necessary. Giles [
51], presented a model-based assessment of Germany’s potential for economic demand response.
Several Chinese studies have been published about China’s demand response. According to Gao et al., in China, demand response has been largely an administrative approach to managing electricity consumption rather than a market-oriented approach to taking full advantage of their potential. In addition, Gao [
92], pointed out that China’s electricity pricing system was rather rigid and that demand response resources were lacking in professional load aggregators. Chinese analysts Zhou and Wang, [
93] discussed the new situation and problems of demand response in China and suggested innovative DSM measures and applications of China’s demand response. Zeng et al. [
51], argued that demand response aimed to mobilize the user’s participation and improve response capabilities; they proposed three kinds of implementation methods in China: price guideline, incentive compensation, and administrative coordination. Considering the level of system operation technology and market environment in each stage, the implementation modes of demand response in the initial, transitional, and mature stages of the electricity market in China were proposed. Chinese literature mainly discussed the necessity of utilizing demand response, the limitations of demand response due to a lack of market mechanism, and the steps to take to implement demand response in China. The Chinese power sector has never stopped reforming over the past few decades, and many efforts have been made in implementing DSM programs, particularly in reforming electricity pricing mechanisms. China’s power sector reform is still underway and many DSM programs are still in their infancy. The many accumulated contradictions in China’s power sector must be resolved in order for DSM to fulfill its potential and promote efficient, reliable, and sustainable development.
12. Conclusions
This study forecasted total electricity generation, consumption, and demand from 2020 to 2021 for China’s household, government, agriculture, streetlights, commercial, and industrial sectors. The study’s findings show that in 2020, China’s electricity production and consumption increased by 0.9 and 1.3 percent year over year (YOY), and the secondary industry’s electricity consumption growth turned upwards. Seventeen provinces reported year over year growth in their electricity consumption above the national average. For the first time, positive growth in electricity consumption was registered in the manufacturing industry in 2020. The other three energy-intensive industries had positive growth in electricity consumption, except for the chemical industry.
Electricity generation and consumption in China increased by 0.9% and 1.3%, respectively, in 2020, producing capacity of power plants increased by 5.6 GW, coal consumption of power supply decreased by 4.3 g/kWh, power generation projects investment increased by 51.6 billion RMB, power grid projects investment decreased by 1.8 billion RMB, and newly installed generation capacity increased by 769 GW year on year (YOY), respectively. During the first three quarters of 2021, the generation, consumption, and coal consumption of electricity increased respectively by 10.7 and 12.9%, the generating capacity of power plants increased by 9.4 GW, the average coal consumption of power supply decreased by 0.9 g/kWh, power generation projects investment increased by 1.8 billion RMB, while the power grid projects investment decreased by 0.3 billion RMB, and new generation capacity added around 20.16 GW compared to the same period last year. Despite the complex domestic and international environment, China managed to consolidate epidemic prevention and control results during the first three quarters of 2021, and the economy has been growing steadily. The power industry contributed to China’s economic and social development. Power consumption and generation increased rapidly. Power system development continued to revolve around green and low-carbon development. While the power supply–demand balance was generally achieved in most regions, some regions experienced tight supply.
Additionally, the article reviewed China’s renewable electricity development and policies from 2020 to the present. We found that although China has made significant progress in wind and solar PV power generation, the fixed feed-in tariff subsidies distort investment incentives and lead to high subsidy debt and high curtailment rates. This study summarizes the rationale for the government’s move away from feed-in tariffs to auctions for renewable subsidies. Factors such as difficulties in obtaining technologies (manufacturing and export), a decrease in profitability, and economic uncertainty negatively affect investments in renewable energy projects. However, the decrease in power generation, the shift in peak demand, and the proliferation of renewable energy posed challenges for each country’s energy system. In order to ensure the resilience of the energy system, new projections and models are needed.
13. Policy Recommendations
The following policy implications are outlined in light of the above conclusions regarding China’s power demand–supply situation, electricity generation, and renewable energy development.
Renewable energy development can offer numerous benefits, including sustainable development and energy security. However, renewable energy did not directly replace oil consumption. Instead, a large gap between oil imports and renewable energy utilization suggests increasing oil demand much higher than renewable energy generation, harming renewable energy. Because of the large potential of renewable energy, it is wise to promote renewable energy deployment to meet China’s huge energy needs. However, China faces a significant challenge in reaching the right balance between short-term economic growth and long-term sustainable development. Further strengthening of the synergy between energy security and renewable energy policies is also necessary.
In the winter, adequate power and heat should be available, coal supply for power generation should be coordinated. The first step is to resolve the coal shortage in the northeast and guide the coal price for power production in the market to the “green range.” The second step is to ensure a safe power supply by taking measures during peak power consumption. A third step is to improve the accuracy of renewable energy forecasts to ensure the power grid’s continued operation. As a fourth step, compensate energy companies struggling with operating pressure by paying arrears on new energy subsidies.
The electricity market transaction mechanism must be continually improved, along with the signing of long- and medium-term electricity contracts and the construction of the spot market. The first step should be to make plans to resolve the connection between medium and long-term transactions and spot transactions. Secondly, accelerate the development of market information disclosure systems, release relevant information timely and accurately, and help market entities make reasonable quotations. Third, enforce quotas for renewable energy consumption to ensure the full use of renewable energy. A fourth recommendation is to investigate and establish auxiliary service mechanisms, such as capacity cost compensation, as soon as possible to facilitate the orderly transformation of thermal power enterprises.
Strengthen power planning’s contribution to low-carbon and clean power sector transformation. First, determine the rate for the use of renewable energy on a national and provincial level and the development of non-fossil energy during the “14th Five-Year Plan.” Second, develop a diversified and highly resilient smart grid that can accommodate large-scale new energy grid connections and diversified new power equipment access. Third, establish and improve the market for electricity auxiliary services and cost compensation. The fourth point is to emphasize distribution network design and planning, improve the integrated energy service model, expand the service chain, and increase the electrification ratio in society.
Balance the supply and demand of electricity during the summer
During summer this year, more areas are expected to experience power shortages than the previous year, and the power supply and demand situation are more difficult.
Plan with various generating units to make the best use of their peak power generation capacity; ensure that regional resources are allocated efficiently.
Allocation of resources should be based on market factors rather than demand management.
Coordinate the network sources, strengthen the grid structure, and solve the bottleneck problem in low-voltage lines.
The supply of fuel for generation should be enhanced.
Thermal coal has been hard to come by since the beginning of this year, and coal power companies have been on high alert in many areas. As a result of insufficient natural gas resources in some areas, the natural gas supply could be reduced or cut off during the summer. The tight supply of natural gas also drives up the gas price for power generation, which does not cover the marginal cost of gas consumption. The tight supply of natural gas will exacerbate the summer power shortage.
Enhance efforts to ensure the availability of electrical coal. We need to increase coal production capacity, increase the proportion of electrical coal in total consumption, and establish policies that favor imported coal for power generation.
Strengthen the transfer of coal for electricity. Enhance the coordination of coal sources and railway transportation capacity in the north. Strengthen supervision of electrical coal.
Ensure that natural gas is available. During summer, ensure a stable supply of natural gas for power generation by coordinating power grid distribution and gas grid operation. Identify a way to establish a linkage mechanism between power generation prices and natural gas prices.
- 7.
A natural gas price early warning system should be developed. Power companies should strive for sustainable development.
Many factors, including a decline in power prices, high fuel prices, etc., led to difficult operation situations for the power companies. The following are some suggestions for ensuring the sustainable development of power companies, energizing the construction of new power systems with new energy as the mainstay, and increasing the probability of reaching the “carbon peak, carbon-neutral” target:
Develop a mechanism for establishing electricity prices based on the market. Establish a new energy storage price mechanism to promote the development of new energy and related storage industries; study the relationship between electricity price and cost; establish a multi-market price coupling mechanism; link the electricity and coal markets to resist market risks.
Intensive efforts should be made to resolve arrears in the payment of new energy power generation subsidies. It is important to deploy relevant government documents on time, clarify the conditions for financial institutions to grant subsidies to wind and photovoltaic energy companies, and accelerate the implementation of financing policies for such projects. To offer renewable energy companies a variety of green financing channels, various financial institutions should explore how venture capital, private equity, trusts, and other financial instruments can be used.


 ,
, 


