1. Introduction
1.1. Circular Economy
The term circular economy (CE) refers to a movement to decouple economic growth from natural resource use [
1,
2]. The CE movement looks beyond the current extractive ‘take-make-waste’ industrial model, upcycle designs, and resource efficiency strategies to encourage sustainable development by giving used products and materials additional life cycles [
3,
4]. CE, although conceptualized in 1976 [
5], is receiving considerable attention, especially in the European Union [
6]. The distinguishing property of a CE is that it combines a reduction in waste with a reduction in resource use. CE has also quickly become an important ingredient in policy design. CE contributes to the European Commission’s strategy of ‘reduce, reuse, recycle’ by emphasizing a ‘holistic’ approach to the eco-innovation movement, which requires high-level policy reforms to reroute material flows into a circular pattern. By applying the notion of ‘circular by design,’ the economy can move toward sustainable green growth [
6]. Applying CE principles contributes to the direct and indirect achievement of many sub-deliverables of various SDGs [
7].
1.2. Life Cycle Assessment and CE: Methodology vs. Philosophy
Within the CE philosophy, life cycle assessment (LCA) is a widely adopted technical means for assessing alternatives [
8]. The European Commission [
9] recognizes LCA as a method for quantifying environmental impacts and trade-offs among goods and services, taking into account their full life cycle. The holistic perspective of LCA aligns with the CE principle of circularity, i.e., the efficient (re)use of resources, materials and products. Because LCA is an internationally standardized methodology [
10], quantitative LCA databases and impact methods facilitate a systematic application to CE [
11,
12,
13]. LCA helps expand perspectives beyond the waste management system [
14].
These two developments, CE and LCA, could be seen as logical twins. CE, a broad philosophy or paradigm, is driven by the standardized LCA procedure and its systematic strengths, inventories, and impact methodologies. LCA calculates the potential environmental impacts of materials, products, and services across a defined life cycle and accounts for the treatment of waste. In material CE, waste does not exist; therefore, the issue in combining LCA with CE is the perception of waste as a byproduct, which opens the door to the multiproduct hierarchies in ISO 14044 [
10]. CE has successfully directed societies and industries away from ‘wasting waste’ by considering it (mostly) as a coproduct of the system. For the LCA practitioner, this raises confusion about which LCA paradigm to apply, waste LCA or coproduct expansion and/or allocation, and whether the promotion of CE put manufacturing with or the byproducts of virgin materials and the coproducts of waste treatment on the same level.
1.3. Are Waste LCA and CE as Aligned in Practice as in Theory?
Hauschild et al. [
13] states, ‘Functions are especially important to understand when comparing two or more production systems because a comparison is only fair and meaningful if the compared systems provide (roughly) the same function(s) to the user.’ In the context of CE, the literature indicates that the overall aim of CE is to streamline ‘circularity by design’ for products and maintain material quality after disposal; by increasing recycling rates, lower resource input requirements go hand in hand with smaller amounts of waste. Given the plethora of research on LCA for CE and the daunting scrutiny of hidden inventories, the first model validation step for LCAs that claim to support CE should be the adherence of their results to the waste prevention hierarchies in CE and the governance of the circular flows of reuse, material recovery, and recycling before emission calculations.
Whenever the prevalent LCA conclusion favors virgin materials as opposed to recovered materials, an LCA practitioner may justify that result with the following rationale: If waste was a good resource, then the more waste we produce, the richer we would become. This is the core challenge of CE, to bring LCA into supportive alignment with CE from an environmental perspective. The research question is as follows: What systematic environmental correction is required to align LCA results with CE in practice? How could the circularity of a production system be better compensated in LCA applications?
The holistic nature of LCA and CE answers this question in theory; however, in practice, the results tell a different story.
1.4. What Waste LCA Functional Unit Best Describes the Function of CE?
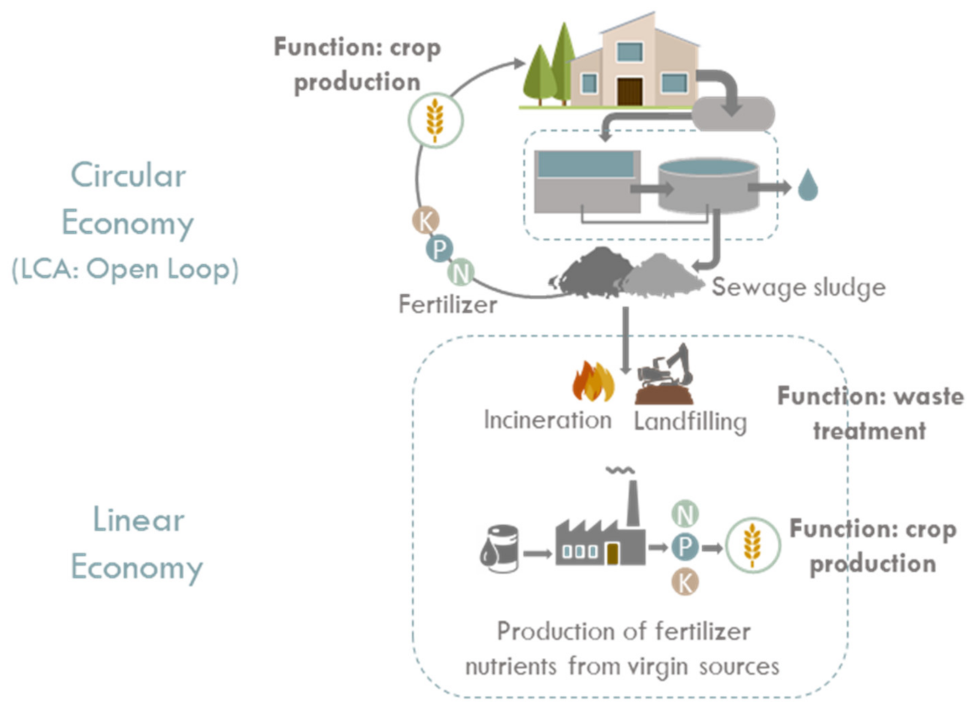
Most waste LCA applications use a functional unit (FU) measured in terms of the waste to be treated, for instance, 1 ton of municipal waste or 1000 cubic meters of wastewater. Thus, the function is to ‘treat waste’. When CE is streamlined, the intended function of waste is to be a prevalent resource for another intended function, for example, producing 1 ton of fodder or 1000 cubic meters of water for potable use (see
Figure 1). To illustrate the difference, consider the case of recovering fertilizer nutrients from treated wastewater sludge (TWS) for agricultural reuse [
15]. Instead of focusing on the wastewater treatment plant and then expanding the system to account for the saved fertilizer, we propose using the FU and the scope to the function of acres of fodder grown through this second life and then measuring the extent of the ‘lost opportunity’ in the available TWS that could have been safely utilized and instead was landfilled or incinerated. In this context, the opportunity cost is the cost of wasting waste. We argue that the latter better streamlines CE in LCA applications and promotes better utilization of waste by design.
1.5. Wasting Waste Is a Lost Opportunity with a Cost
As discussed earlier, if an environmental LCA application favors the use of virgin materials when a relatively developed practice of waste recovery exists, then we believe that externalities exist that are missed in the LCA that impede its alignment with CE. Externalities in general are defined as situations in which the effect of the production or consumption of goods and services imposes costs or benefits on others that are not reflected in the prices charged for the goods and services being provided [
16]. We argue that if such an externality or ‘opportunity cost’ is incorporated into waste LCA, this will assist in incorporating broader impacts from sustainability that are closer to what is suggested by CE rather than narrowing the environmental analysis to waste LCA. This challenge has always been a point of concern in sustainability assessments, where the limitation of thinking in the real world that encompasses the system limits the imperative for change rather than compromise [
17]. We argue that these implications readily cascade into more deliberate projections of both the economic and the social implications of waste LCA, where this issue has always been in question [
18,
19,
20].
In terms of the wastewater sludge example, the advantage of the opportunity cost or externality approach in supporting the cradle-to-cradle cycle through the CE transition aligns with the legislation issued by Directive 2000/60/EC of the European Parliament and Council. This legislation declares TWS to be a resource, not a waste [
21,
22,
23,
24,
25,
26,
27,
28,
29]. Hence, recent research objectives need to investigate the best-added utility rather than the least environmentally harmful disposal method. The opportunity cost is the additional margin introduced into the expanded system for wasting waste.
2. Literature on Waste LCA for CE
The leveraging of LCA for CE has been discussed in various applications. Waste management is a mainstream application in this discussion. Thomas and Birat [
30] thoroughly discussed how LCA could be employed to promote CE. They focus on recycling and emphasize how different recycling practices are not rewarded equally and sometimes not promoted at all, and accordingly, contradictory decisions may occur. Cobo et al. [
31] conducted an analysis of the weak spots in linear waste management methodological choices when projected onto a CE and applied to solid waste, and estimated the benefit from further research and standardization. Cobo et al.’s [
31] findings emphasize the expansion of the typical waste management boundaries to include the upstream subsystems that reflect the transformation of resources and their interconnections within the waste management subsystems. Olofsson and Borjesson [
32] also applied the allocation of LCA within a CE framework to assess the value of considering residual biomass as a resource. Rieckhof and Guenther [
33] discussed the methodological aspects of combining LCA with the allocation of flow cost accounting in CE. Civancik-Uslu et al. [
34] and [
35] used this system to assess ecodesign packaging. Tedesco et al. [
36] adopted LCA using the attributional approach to address the multifunctionality of a system with an economic allocation in the CE framework, applying this approach to a case of the bioconversion of fruit and vegetable waste. Llamas et al. [
37] assessed the impacts and limits of CE systems using losses predicted through simulation-based exergy, thermoeconomics and LCA evaluation. Eberhardt et al. [
38] discussed key methodological issues in quantifying the environmental implications of CE principles using an LCA allocation for sustainable buildings. The framework for employing LCA in CE through the allocation of TWS utilization has been discussed in Sfez et al. [
27]. In that work, the authors evaluated several allocational standpoints that arise when sludge is considered a resource, which they argue implies the partial allocation of upstream burdens to allow a fair comparison with virgin material-based counterparts.
An analysis of the opportunities for TWS within the CE context has been addressed in recent research [
3,
21,
22,
27,
39,
40]. In this context, Heimersson et al. [
29] indicate that ‘despite the general agreement on the importance of adjusting each LCA to its goal, the methodological choices in previously published LCAs on wastewater and sludge management systems are surprisingly similar, even when the information sought in the studies most likely differs’. This phenomenon has also been observed in a discussion of energy recovery from waste in Heijungs and Guinée [
41] and Ekvall and Finnveden [
42], among others. These authors note that LCA studies of waste management systems tend to produce diverging and even conflicting results. Wardenaar et al. [
43] also indicate that the choice of allocation method in the policy design has a large influence on the outcomes of an LCA. As a solution, they stress the importance of carefully considering different methodological principles and assumptions.
Considering the example of recirculating nutrients from TWS to grow forage, we noticed that most studies considered the FU to be the amount of treated mass, with common methodological choices as follows:
We argue that the first choice is best if the FU reflects that the function of CE does not include the treatment of waste, which can be accomplished, for example, by choosing a ton of forage harvested versus one cubic meter of wastewater treated. In the second choice, practitioners are susceptible to the risk of ‘overburdening’ a waste treatment process by treating it as a typical manufacturing process and thus might unintentionally use a cure worse than the disease.
3. Materials and Methods
We aim to introduce the opportunity cost concept into LCA, which further builds on the expansion of the system to support the CE in not wasting waste. In economic terms, an opportunity cost is defined as the ‘benefit foregone by choosing another course of action. Also known as the opportunity cost’ [
16,
44]. Considering a missed opportunity or an opportunity cost allows for improved handling of trade-offs to better support strategic decision-making. The opportunity cost is conceptually defined as:
Opportunity cost = Return on the best option not chosen—Return on the option chosen.
Opportunity cost thinking has proven most useful for the efficient allocation of scarce economic capital, which is used in the creation of economic value [
45] and Hahn 2012). Opportunity cost is often used by investors to compare investment alternatives, but the concept can be applied to many different scenarios. In the environmental domain, it is not new [
46,
47,
48]. Rezai [
48] indicates that the cost of climate policy depends on the ‘no-policy alternative’, without which the opportunity cost of climate action cannot be determined. In fact, Rezai [
48] indicates that one reason for failing to achieve carbon reduction targets is that missed opportunities are overlooked in the environmental context. Research by Figge and Hahn [
45] argues that opportunity cost thinking can be directly applied to environmental resources to achieve a win–win situation for the so-called green business case, i.e., for businesses to respond to environmental factors and challenges. The social projections of opportunity costs and environmental damage have also been discussed in Lovett [
46].
To illustrate our case, we present an analysis of Weidema’s [
49] hypothetical example (see
Figure 2). Weidema [
49] provides different scenarios to show how allocation can be avoided and replaced by system expansion and delimitation in relation to co-production. Coproduct A could have one or more coproducts, which can be utilized in subsequent products (Product B) after possibly receiving intermediate treatment (treatment I); then, Coproduct A could displace other products in the market and prevent their associated processes (process D).
Looking at the same example from the CE perspective, we argue that some environmental burden should further penalize process A if process A does not utilize the recycled sources as inputs, thereby promoting circularity by design [
6]. This particular burden is what we call here the environmental opportunity cost. By penalizing/taxing Process A, the burden of ‘wasted waste’ is added into the model, and hence lost opportunities are avoided. As in economics, projecting the alternatives to wasted opportunities could be endless, and decision-makers’ expertise plays an important role in limiting alternatives to those that are applicable and feasible according to the investment size and the market.
Our thesis proposes that the opportunity cost (
), or attrition cost, be added to product A’s environmental burden (i.e., product A is additionally penalized) whenever it occurs in Weidema’s [
49] example. As shown in
Figure 3,
indicates the cycle from which a product/material is attritted, which indicates a missed opportunity for applicable utilized waste that could displace a percentage of the virgin materials.
Figure 3 shows the CE circles for product stock management, which is one-half of the CE system diagram, a.k.a the CE butterfly [
50]. The other half of the CE butterfly is material flow management, which depends on the nature of Product A under study. The attrition cost,
, is mutually exclusive to avoid double counting and should be larger for larger
to ensure the priorities of CE are met; hence,
.
3.1. A Hypothetical Example for Utilizing TWS as a Fertilizer
For the sake of illustration, consider a hypothetical LCA problem where the goal is to assess the utilization of TWS to complement conventional fertilizer in agricultural activities and to contrast the result with the business-as-usual scenario, which is landfilling, to improve this activity from a CE perspective [
15].
In this case, the system boundary needs to expand to encompass a second process, which is the most likely alternative for providing the secondary function of the first process [
13]. The studied system is then expanded to cover the avoided primary products [
51]. Scenario 1 in
Figure 4 illustrates the applied system expansion to demonstrate the utilization of TWS (waste from a primary cycle) as a resource (in the secondary cycle) that serves as a substitute for conventional fertilizer in agriculture. In this hypothetical example, an FU of 100 kg of fertilizer is required to supply nutrients for agricultural activity. Let A and B be the amount (kg) of conventional fertilizer and suitable TWS, respectively, required to complement the FU. The general elements of process A are typically infrastructure, operations, transport, disposal, etc. Researchers often deal with the expanded system (B) in a similar manner for the sake of consistency. The inclusion of additional operations (I) that prepare the waste (sludge) for its intended secondary life cycle is aligned with the open-loop recycling perspective, as clause 4.3.4.3 of the ISO 14044 [
10], ILCD [
52] guidelines state: The recycling efforts, disposal of any residual waste, etc., and the related impacts are part of the primary life cycle. Therefore, in the context of sludge reuse, wastewater/sludge processing, except for additional operations to prepare it for its secondary life cycle, should not be included in the system boundary, especially because those processes are not affected by the use of the treated sludge. Hospido et al. [
23] applied a similar system boundary, and thickened mixed sludge was also selected as the starting point of that study (note that the treatment of the wastewater is excluded in both cases, as the decision to demand product B does not affect this activity, which is only affected by the decision to demand product A).
3.2. Accounting for the Missed Opportunities in LCA, Expanding the Business-as-Usual Scenario
Let W be the amount of wastewater sludge (in kilograms) to be landfilled. Then, as shown in
Figure 4, the required fertilizer will be produced entirely from conventional sources (FU = A). The missed opportunity expansion assumes that some wastewater sludge is produced regardless of reuse intention. In our proposal, we further stretch the expanded system boundary to include W. The reference flow of conventionally produced sludge must include what is landfilled and wasted, hence the missed opportunity due to wasted waste. Thus, the reference flow for this scenario should equal 130 kg (see
Figure 4). In reality. The amount W is more than 30 kg depending on the nutrient efficiency of the sludge compared to that of conventional fertilizer.
In the context of TWS utilization, the saved conventional fertilizer is considered to be the only ‘avoided’ material that was ‘substituted’ and is thus an underestimated benefit [
31]. ‘Avoiding’ landfilling should also be considered a benefit. This will not cause double counting or over-crediting [
35] but will rather correct the typical omission of an additional benefit that already exists but is often missed [
53]. Neglecting missed opportunities within an LCA, particularly a waste LCA, results in an underestimation of the environmental impact of exploiting virgin resources and could result in a recommendation of alternatives that are unaligned with CE.
4. Theory and Calculations
Consider the case in which TWS is considered to be a fertilizer through land application in order to supply a fodder plant with nutrients. Because the quality and concentration of the nutrients in the TWS are not as high as those in conventional fertilizer [
15,
26], the reference flows include the infrastructure and operations needed to produce a 70:30 virgin material-based equivalent to achieve the FU, while the amount obtained from the treated sludge land application will be subtracted. In a CE, sludge is categorized as a ‘consumable’ composed largely of biological ingredients or ‘nutrients’ but unsuitable to be released as-is into the biosphere [
54]. Similarly, an application may utilize treated sludge as a fertilizer in agriculture. In LCAs, this terminology is translated as an ‘open-loop’ system, as treated sludge is recycled into other product systems and the material undergoes a change to its inherent properties [
10,
55].
4.1. Functional Unit
The function is agricultural fodder production, and the FU is the amount of fertilizer required to cover 1 km
2 of fodder plant for one year. The reference flows are expressed in terms of fertilizer properties, which are mainly described by nitrogen (N), phosphorus (P), and potassium (K) concentrations, expressed as NPK. The amount of NPK required to produce the FU is dictated by the intended crop—in our case, a fodder field. This is different from the typical waste LCA FU, which is the amount of ‘waste’ treated (see
Figure 1). Incorporating CE concepts allows for a description of the process in terms of future intended functions—in our case, agriculture. The detailed reference flows are calculated in Aleisa et al. [
15] based on the average NPK concentrations obtained through laboratory analyses conducted by Wong et al. [
56], Lombardi et al. [
57], Sampson [
58], Wierzbowska et al. [
59], Antoniadis et al. [
60], Tontti et al. [
61] and Mtshali et al. [
62]. The average concentrations are 31.75 g of N (3.2%), 17.37 g of P (1.75%), and 4.62 g of K (0.5%) per kg of treated dry sewage sludge.
4.2. Scope and Boundaries
Two mutually exclusive scenarios are used for illustration. Both scenarios include a system expansion. Scenario One is the system expansion found in Aleisa et al. [
15]. Scenario Two is Scenario One plus opportunity costs. The system boundaries include the upstream processes to produce conventional fertilizer and prepare recycled material and landfilling.
The LCI for each scenario is obtained using Ecoinvent v.3 using the consequential mode of market processes and globally averaged delimiters for all NPK production and landfilling. The conventional NPK fertilizer is applied according to the Nova Scotia Department of Agriculture and Fisheries Soil Test Recommendations [
63]. The ratios are 10-6-10, with mean application rates of 180 kg N/km
2, 110 kg P
2O
5/km
2, and 180 kg K
2O/km
2, which are also close to the world average application rates [
64].
4.3. Scenario One (System Expansion without Opportunity Cost)
Scenario One is a typical system expansion model (see
Figure 5), where the FU is a 30% reduction in conventional fertilizer due to the use of treated sludge from wastewater plants.
Scenario One assumes a conventional fertilizer with a grade of 10-6-10 NPK, which guarantees the available plant nutrients expressed as a proportion of the weight of the fertilizer; hence, this fertilizer indicates the presence of 10% N, 6% P (P
2O
5), and 10% of K (potash or K
2O). This corresponds to a reference flow of 2.5 kg of N, 1.5 kg of P, and 2.5 kg of K, which is enough to grow 1 km
2 of fodder crops harvested once per year. The reference flows for the fertilizer requirements are calculated based on Equation (1):
The requirements are provided in
Table 1. The TWS fertilizer is of lesser quality and has a grade of 3.2-1.75-0.5.
4.4. Scenario Two (System Expansion with Opportunity Cost)
Scenario Two (see
Figure 6) is the same as Scenario One plus an expansion of the boundary to include the additional burden of landfilling the equivalent TWS that could have been utilized to save on virgin resources to produce 1 km
2 of fodder for one year. As in Scenario One, Scenario Two penalizes the system for the production of virgin NPK (70%) and credits the system for avoiding NPK production by using recovered nutrients (30%) based on a conventional fertilizer grade of 10-6-10 and the conventional nutrient concentrations in TWS, 3.2-1.75-0.5.
The opportunity cost measures the amount of sludge landfilled that could have been used to produce the FU needed to grow 1 km
2 of fodder crops harvested once per year using the sludge nutrient concentration as calculated with Equation (1). The amount of TWS landfilled is equal to 50 kg/km
2 (see
Table 1). A disclaimer: Farmers may add supplementary chemicals to substitute for the weaker nutrient content in TWS. This could include area for N, ammonium dihydrogen phosphate (ADP) for concentrated P, potassium nitrate for K, or many others. These need to be penalized in the LCI.
5. Results
LCIA was carried out using ReCiPe 2016 Midpoint (H) V1.03 to compare both scenarios with respect to freshwater ecotoxicity (FE), marine ecotoxicity (ME), human toxicity (HT), climate change (CC), urban land occupation (ULO), photochemical oxidant formation (POF), terrestrial ecotoxicity (TE), freshwater eutrophication (EUT), ozone depletion (OD), fossil depletion (FD), agricultural land occupation (ALO), particulate matter formation (PMF), terrestrial acidification (TC) and metal depletion (MD).
In general, N is responsible for approximately 88% of the environmental burden. This substantial influence masks the effect of any other processes. Thus, the difference between virgin and TWS is mostly the difference in nitrogen production, which largely adversely impacts the FD and CC impact categories. However, the discussion in this results section focuses on the impact of the opportunity cost.
Figure 7 depicts the characteristic results for both scenarios sorted by the largest differences. As expected, Scenario Two has a higher adverse environmental impact due to the additional burden imposed by the opportunity cost (see
Table 1). However, the largest difference appears to be in the impact on FE, ME, HT, and CC. The analysis per substance indicates that the cause of this difference is a waste of the metals required for N production, which are mainly copper, nickel, zinc, and manganese [
15] plus heavy metals that are leached from landfilled sludge [
65,
66].
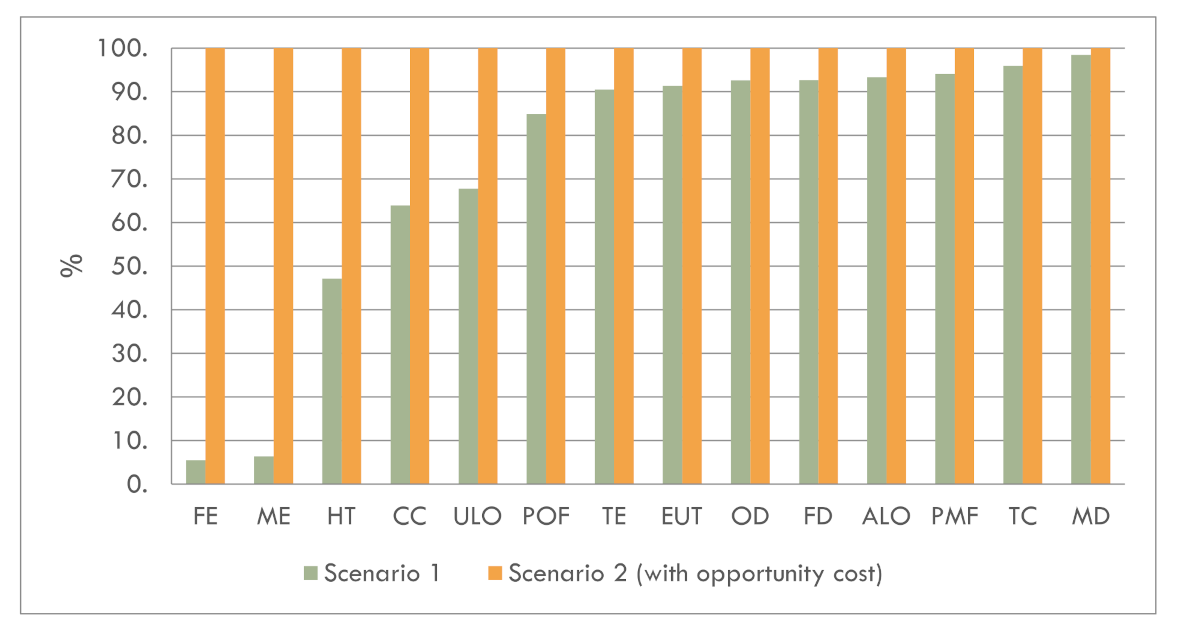
The normalized results for Scenario One and Scenario Two are provided in
Figure 8, sorted by the largest differences. The normalized results present a different perspective, with the most adversely impacted categories being CC, HT, FD, and PMF. The difference in CC and HT is due to the emission of biogenic methene from the sanitary landfill, which accounts for 89% of the impact on CC and which corresponds to 3.21 × 10
−5 DALY, followed by CO
2, which accounts for approximately 8% of the impact on CC.
To further investigate the impact of opportunity cost, we apply the paired t test to the difference between the characteristic results of Scenario One () and Scenario Two (). The null hypothesis tests for equality in the mean characteristic results, , and the alternative hypothesis asserts the contrary, that , where indicates the different impact categories. We typically reject H0 if the test statistic , where . Hence, for the 17 impact categories, the resultant = 0.008, which means we reject the null hypothesis and conclude that the opportunity cost made a difference at the indicated level of significance. The 95% confidence interval for the difference in means is .
However, for the normalized results, we obtain
= 0.128 which means we fail to reject the null hypothesis and find no evidence to conclude that the opportunity cost made a difference on a normalized scale.
6. Discussion
6.1. What Is the Cost of Overlooking CE? How Do We Account for It?
Not all CE practices are considered equal. The inner circles in
Figure 3 are prioritized and are consistent with the waste hierarchy shown in
Figure 9. However, LCA results may not favor the same conclusions; in some applications, the results appear to favor virgin materials as more environmentally friendly than utilized waste. Contextualizing LCA in terms of missed opportunities according to CE priorities could lead to a symbiotic and complementary integration. LCA is a systematic evaluation tool used to measure practices in reference to the CE baseline.
As discussed earlier, opportunity cost represents the benefits missed when choosing one alternative over another. Because the alternatives could be endless in theory, opportunity costs are difficult to measure and, in many cases, are therefore overlooked. One way to confine the possibilities to a practical scale is to expand the scope of the system to include missed opportunities discounted according to waste hierarchy properties. Neglecting the opportunity costs applied in different domains, such as environmental public policy, has a substantial impact on decision-making, resulting in the misallocation of public resources [
69].
A similar discussion could be had regarding the integration of the concept of the circular footprint formula, or CFF [
70]. The CFF is typically part of the product environmental footprint (PEF) but is used to answer questions about how to account for the benefits and burdens of these recycling and energy recovery processes. Questions include the following: Where is the boundary between the first and the second product systems? Are there differences in quality between the secondary materials or energy and the primary materials or energy? How can either double counting or gaps in benefits and burdens be avoided [
70]? These questions are the same as those raised in this study. CFF relies mainly on allocations [
70,
71,
72], whereas in our proposed methodology, we base the boundaries on system expansion.
The limitations of the opportunity cost concept are inherited from its respective economic field. Calculating opportunity costs is a daunting task that is often time-consuming and requires extensive experience to assess unforeseen externalities that are measured based on forgone opportunities to prevent environmental burden. An advantage of calculating opportunity costs in the environmental context; however, is that it is relatively simpler compared to doing so in the economics field. This is because in the environmental context, there are a limited number of waste treatment methods compared to the number of investment ventures that could be explored financially in terms of investment.
6.2. Implication of Using Allocation in the CE
A CE aims to design out waste [
8,
54]. This aim has encouraged the modeling of ‘waste’ as a resource and ‘waste treatment’ as a ‘primary’ life cycle. Thus, ‘waste treatment’ is a multifunctional primary life cycle of products and coproducts (waste). As a result, the coproduct (waste) is partially charged with an upstream environmental burden [
8,
25]. Hence, when abandoning the zero-burden assumption for waste [
25,
53], clause 4.3.4.2 or the ‘Allocation procedure’ ISO 14044 [
10] is applied under this argument. However, ILCD [
52] states that ‘the case of recycling is insofar different from the general case of multifunctionality’; in addition, it states that ‘if the market value of the waste/end-of-life product at its point of origin is above zero, then from the LCA perspective, it is a coproduct and the multifunctionality is to be solved by allocation’. Hence, the distinction between waste versus byproduct relies mainly on the dollar value of the waste [
52], which then dictates the extent of the allocation or zero-burden assumption [
73]. Another important point lies in the definition of open-loop recycling, which is when treated waste is recycled into other product systems and materials [
10,
55]. In ILCD [
52], sludge belongs to an open-loop system with different primary route categories. Thus, clause 4.3.4.3 or ‘Allocation procedures for reuse and recycling’ ISO 14044 [
10] needs to be considered rather than clause 4.3.4.2, which is related to the multifunctional system allocation. The problem is that most research in this area does not use the recycling clause; thus, the displacement of virgin material boundaries is inconsistent. In fact, when this happens, there is a risk of burdening recycled materials through a false allocation of original material consumption, hence rendering the exploitation of virgin materials more environmentally friendly, which defeats the entire purpose of the CE. For this reason, we propose a minor amendment to ISO 14040 [
74] to incorporate the concept of opportunity costs in order to support a better alternative form of evaluation and to promote CE.
7. Conclusions
In theory, LCA as a holistic methodology and the CE philosophy are in alignment; in practice, the results may not be. Many LCA studies favor the use of virgin materials when recovered options are feasible. This could be logically justified on many levels, but with respect to CE, it is not. We discuss common methodological trends in waste LCA in the context of CE, such as multiproduction systems, and system expansion and allocation. We address the question of how the circularity of a production system can be better described in LCA applications and what systematic environmental corrections are required to better align LCA results with CE in practice.
We propose two recommendations to improve LCA:
The FU should be adjusted to reflect the second-life intended utilization of treated waste as opposed to using a FU in terms of the mass treated. Opportunity costs can be incorporated to penalize systems for wasting waste.
Both recommendations build on system expansion but expand it further to account for opportunity costs because waste is generated regardless. We argue that incorporating the burden of wasting waste will support a fairer and more relevant quantitative comparison for practitioners aiming to support CE. We have also discussed the potential risk of overburdening waste treatment processes when they are modeled as typical multiproduction systems rather than multiproduction waste treatment systems.
We demonstrate this framework using an illustrative example of treating sewage sludge as fertilizer; however, the idea has wider repercussions. In the illustrative example, the LCI reference flows were expressed as the amount of NPK nutrients that are required to grow 1 km2 of fodder crops harvested once per year from virgin sources, which entails the ‘opportunity cost’ of recovering NPK from sludge plus the coupled savings related to landfill area and infrastructure requirements when the sludge is utilized. The LCIA showed that climate change, human toxicity, and fossil fuel depletion, among others, are the most impacted categories, and the results are significant on the characteristic level. The production of N is the most polluting process. Future research should be directed toward incorporating the opportunity cost and social dimensions and toward generalizing LCA and CE system expansion while incorporating opportunity cost into other waste treatment scenarios. We also recommend incorporating opportunity cost into standards related to LCA to improve the assessment of alternatives in terms of their alignment with CE.
Author Contributions
Conceptualization, E.A.; methodology, E.A.; software, E.A.; validation, R.H.; formal analysis, writing—original draft preparation, E.A.; writing—review and editing, R.H.; visualization, E.A.; supervision, R.H. All authors have read and agreed to the published version of the manuscript.
Funding
Partial funding is obtained by Kuwait University.
Institutional Review Board Statement
Not applicable.
Informed Consent Statement
Not applicable.
Data Availability Statement
All data generated or analyzed during this study are included in this published article.
Acknowledgments
The authors would like to thank Kuwait University for providing all necessary software. The authors appreciate the constructive feedback from the reviewers that have extensively improved the quality and presentation of this manuscript.
Conflicts of Interest
The authors declare no conflict of interest.
References
- EASAC. Indicators for a Circular Economy; German National Academy of Sciences Leopoldina: Halle/Saale, Germany, 2016. [Google Scholar]
- Moraga, G.; Huysveld, S.; Mathieux, F.; Blengini, G.A.; Alaerts, L.; Van Acker, K.; de Meester, S.; Dewulf, J. Circular economy indicators: What do they measure? Resour. Conserv. Recycl. 2019, 146, 452–461. [Google Scholar] [CrossRef] [PubMed]
- Lipińska, D. The Water-wastewater-sludge Sector and the Circular Economy. Comp. Econ. Res. Cent. East. Eur. 2018, 21, 121. [Google Scholar] [CrossRef] [Green Version]
- Ellen MacArthur Foundation. What Is a Circular Economy? Available online: https://ellenmacarthurfoundation.org/topics/circular-economy-introduction/overview#:~:text=A%20circular%20economy%20decouples%20economicloss%2C%20waste%2C%20and%20pollution (accessed on 8 January 2022).
- Bassi, F.; Dias, J.G. The use of circular economy practices in SMEs across the EU. Resour. Conserv. Recycl. 2019, 146, 523–533. [Google Scholar] [CrossRef]
- EEA. Circular by Design; European Union: Luxembourg, 2017. [Google Scholar]
- Ghosh, S.K. Circular Economy: Global Perspective, 1st ed.; Springer: Singapore, 2020. [Google Scholar]
- Djuric Ilic, D.; Eriksson, O.; Ödlund, L.; Åberg, M. No zero burden assumption in a circular economy. J. Clean. Prod. 2018, 182, 352–362. [Google Scholar] [CrossRef]
- EC European Platform on Life Cycle Assessment (LCA). Available online: https://ec.europa.eu/environment/ipp/lca.htm (accessed on 7 August 2021).
- ISO 14044, Environmental Management—Life Cycle Assessment—Requirements and Guidelines; The International Organization for Standardization (ISO): Geneva, Switzerland, 2006.
- Zinck, S.; Ayed, A.-C.; Niero, M.; Head, M.; Wellmer, F.-W.; Scholz, R.W.; Morel, S. Life Cycle Management Approaches to Support Circular Economy. In Designing Sustainable Technologies, Products and Policies: From Science to Innovation; Benetto, E., Gericke, K., Guiton, M., Eds.; Springer International Publishing: Cham, Switzerland, 2018; pp. 3–9. [Google Scholar]
- Kirchherr, J.; Reike, D.; Hekkert, M. Conceptualizing the circular economy: An analysis of 114 definitions. Resour. Conserv. Recycl. 2017, 127, 221–232. [Google Scholar] [CrossRef]
- Hauschild, M.Z.; Rosenbaum, R.K.; Olsen, S.I. Life Cycle Assessment: Theory and Practice; Springer: Berlin/Heidelberg, Germany, 2017. [Google Scholar]
- Ekvall, T.; Assefa, G.; Björklund, A.; Eriksson, O.; Finnveden, G. What life-cycle assessment does and does not do in assessments of waste management. Waste Manag. 2007, 27, 989–996. [Google Scholar] [CrossRef] [PubMed]
- Aleisa, E.; Alsulaili, A.; Almuzaini, Y. Recirculating treated sewage sludge for agricultural use: Life cycle assessment for a circular economy. Waste Manag. 2021, 135, 79–89. [Google Scholar] [CrossRef]
- OECD. OECD Glossary of Industrial Organisation Economics and Competition Law. Available online: https://www.oecd.org/regreform/sectors/2376087.pdf (accessed on 17 September 2021).
- Morrison-Saunders, A.; Pope, J.; Bond, A. Handbook of Sustainability Assessment; Edward Elgar Publishing: Cheltenham, UK, 2015. [Google Scholar]
- Heijungs, R.; Settanni, E.; Guinée, J. Toward a computational structure for life cycle sustainability analysis: Unifying LCA and LCC. Int. J. Life Cycle Assess. 2013, 18, 1722–1733. [Google Scholar] [CrossRef] [Green Version]
- Neugebauer, S.; Forin, S.; Finkbeiner, M. From Life Cycle Costing to Economic Life Cycle Assessment—Introducing an Economic Impact Pathway. Sustainability 2016, 8, 428. [Google Scholar] [CrossRef] [Green Version]
- Fauzi, R.T.; Lavoie, P.; Sorelli, L.; Heidari, M.D.; Amor, B. Exploring the Current Challenges and Opportunities of Life Cycle Sustainability Assessment. Sustainability 2019, 11, 636. [Google Scholar] [CrossRef] [Green Version]
- Kacprzak, M.; Neczaj, E.; Fijałkowski, K.; Grobelak, A.; Grosser, A.; Worwag, M.; Rorat, A.; Brattebo, H.; Almås, Å.; Singh, B.R. Sewage sludge disposal strategies for sustainable development. Environ. Res. 2017, 156, 39–46. [Google Scholar] [CrossRef]
- Gherghel, A.; Teodosiu, C.; De Gisi, S. A review on wastewater sludge valorisation and its challenges in the context of circular economy. J. Clean. Prod. 2019, 228, 244–263. [Google Scholar] [CrossRef]
- Hospido, A.; Moreira, T.; Martín, M.; Rigola, M.; Feijoo, G. Environmental Evaluation of Different Treatment Processes for Sludge from Urban Wastewater Treatments: Anaerobic Digestion versus Thermal Processes (10 pp). Int. J. Life Cycle Assess. 2005, 10, 336–345. [Google Scholar] [CrossRef]
- Pradel, M.; Aissani, L.; Canler, J.-P.; Roux, J.-C.; Villot, J.; Baudez, J.-C.; Laforest, V. Constructing an allocation factor based on product- and process-related parameters to assess environmental burdens of producing value-added sludge-based products. J. Clean. Prod. 2018, 171, 1546–1557. [Google Scholar] [CrossRef]
- Pradel, M.; Aissani, L.; Villot, J.; Baudez, J.-C.; Laforest, V. From waste to added value product: Towards a paradigm shift in life cycle assessment applied to wastewater sludge—A review. J. Clean. Prod. 2016, 131, 60–75. [Google Scholar]
- Pradel, M.; Aissani, L. Environmental impacts of phosphorus recovery from a “product” Life Cycle Assessment perspective: Allocating burdens of wastewater treatment in the production of sludge-based phosphate fertilizers. Sci. Total Environ. 2019, 656, 55–69. [Google Scholar] [CrossRef] [PubMed]
- Sfez, S.; De Meester, S.; Vlaeminck, S.E.; Dewulf, J. Improving the resource footprint evaluation of products recovered from wastewater: A discussion on appropriate allocation in the context of circular economy. Resour. Conserv. Recycl. 2019, 148, 132–144. [Google Scholar] [CrossRef]
- Yoshida, H.; ten Hoeve, M.; Christensen, T.H.; Bruun, S.; Jensen, L.S.; Scheutz, C. Life cycle assessment of sewage sludge management options including long-term impacts after land application. J. Clean. Prod. 2018, 174, 538–547. [Google Scholar] [CrossRef] [Green Version]
- Heimersson, S.; Svanström, M.; Ekvall, T. Opportunities of consequential and attributional modelling in life cycle assessment of wastewater and sludge management. J. Clean. Prod. 2019, 222, 242–251. [Google Scholar] [CrossRef]
- Thomas, J.S.; Birat, J.P. Methodologies to measure the sustainability of materials — Focus on recycling aspects. Rev. Metall.-Cah. Inf. Techn. 2013, 110, 3–16. [Google Scholar] [CrossRef]
- Cobo, S.; Dominguez-Ramos, A.; Irabien, A. From linear to circular integrated waste management systems: A review of methodological approaches. Resour. Conserv. Recycl. 2018, 135, 279–295. [Google Scholar] [CrossRef]
- Olofsson, J.; Borjesson, P. Residual biomass as resource—Life-cycle environmental impact of wastes in circular resource systems. J. Clean. Prod. 2018, 196, 997–1006. [Google Scholar] [CrossRef]
- Rieckhof, R.; Guenther, E. Integrating life cycle assessment and material flow cost accounting to account for resource productivity and economic-environmental performance. Int. J. Life Cycle Assess. 2018, 23, 1491–1506. [Google Scholar] [CrossRef]
- Civancik-Uslu, D.; Puig, R.; Voigt, S.; Walter, D.; Fullana-i-Palmer, P. Improving the production chain with LCA and eco-design: Application to cosmetic packaging. Resour. Conserv. Recycl. 2019, 151, 9. [Google Scholar] [CrossRef]
- Civancik-Uslu, D.; Puig, R.; Ferrer, L.; Fullana-i-Palmer, P. Influence of end-of-life allocation, credits and other methodological issues in LCA of compounds: An in-company circular economy case study on packaging. J. Clean. Prod. 2019, 212, 925–940. [Google Scholar] [CrossRef]
- Tedesco, D.E.A.; Conti, C.; Lovarelli, D.; Biazzi, E.; Bacenetti, J. Bioconversion of fruit and vegetable waste into earthworms as a new protein source: The environmental impact of earthworm meal production. Sci. Total Environ. 2019, 683, 690–698. [Google Scholar] [CrossRef]
- Llamas, A.A.; Delgado, A.V.; Capilla, A.V.; Cuadra, C.T.; Hultgren, M.; Peltomaki, M.; Roine, A.; Stelter, M.; Reuter, M.A. Simulation-based exergy, thermo-economic and environmental footprint analysis of primary copper production. Miner. Eng. 2019, 131, 51–65. [Google Scholar] [CrossRef]
- Eberhardt, L.C.M.; Birgisdottir, H.; Birkved, M. Life cycle assessment of a Danish office building designed for disassembly. Build. Res. Informat. 2019, 47, 666–680. [Google Scholar] [CrossRef] [Green Version]
- Jąderko-Skubis, K. Challenges in Developing Decision Systems Supporting Wastewater Management in a Context of Circular Economy, Decision Support Systems; Wastewater Management; Innovative Technologies; Circular Economy; Sewage Sludges Treatment. In Proceedings of the 18th International Multidisciplinary Scientific GeoConference-SGEM, Albena, Bulgaria, 2–8 July 2018. [Google Scholar]
- Werle, S.; Sobek, S. Gasification of sewage sludge within a circular economy perspective: A Polish case study. Environ. Sci. Pollut. Res. 2019, 26, 35422–35432. [Google Scholar] [CrossRef] [Green Version]
- Heijungs, R.; Guinée, J.B. Allocation and ‘what-if’ scenarios in life cycle assessment of waste management systems. Waste Manag. 2007, 27, 997–1005. [Google Scholar] [CrossRef]
- Ekvall, T.; Finnveden, G. The Application of Life Cycle Assessment to Integrated Solid Waste Management: Part 2—Perspectives on Energy and Material Recovery from Paper. Process Saf. Environ. Prot. 2000, 78, 288–294. [Google Scholar] [CrossRef]
- Wardenaar, T.; van Ruijven, T.; Beltran, A.M.; Vad, K.; Guinée, J.; Heijungs, R. Differences between LCA for analysis and LCA for policy: A case study on the consequences of allocation choices in bio-energy policies. Int. J. Life Cycle Assess. 2012, 17, 1059–1067. [Google Scholar] [CrossRef] [Green Version]
- Averkamp, H. Lost Opportunity Definition. Available online: https://www.accountingcoach.com/terms/L/lost-opportunity (accessed on 8 January 2022).
- Figge, F.; Hahn, T. Is green and profitable sustainable? Assessing the trade-off between economic and environmental aspects. Int. J. Prod. Econ. 2012, 140, 92–102. [Google Scholar] [CrossRef]
- Lovett, J.C. Ownership of Environmental Values and Opportunity Costs. Environ. Plan. C: Gov. Policy 2001, 19, 681–693. [Google Scholar] [CrossRef]
- Aleisa, E.; Al-Zubari, W. Wastewater reuse in the countries of the Gulf Cooperation Council (GCC): The lost opportunity. Environ. Monit. Assess. 2017, 189, 553. [Google Scholar] [CrossRef]
- Rezai, A. The Opportunity Cost of Climate Policy: A Question of Reference. Scand. J. Econ. 2011, 113, 885–903. [Google Scholar] [CrossRef] [Green Version]
- Weidema, B. Avoiding Co-Product Allocation in Life-Cycle Assessment. J. Ind. Ecol. 2000, 4, 11–33. [Google Scholar] [CrossRef]
- Ellen MacArthur Foundation. Circular Economy System Diagram. Available online: https://ellenmacarthurfoundation.org/circular-economy-diagram (accessed on 8 January 2022).
- Gentil, E.C.; Gallo, D.; Christensen, T.H. Environmental evaluation of municipal waste prevention. Waste Manag. 2011, 31, 2371–2379. [Google Scholar]
- JRC. ILCD Handbook: General Guide for Life Cycle Assessment—Detailed Guidance; Joint Research Centre: Luxembourg, 2010. [Google Scholar]
- Cleary, J. The incorporation of waste prevention activities into life cycle assessments of municipal solid waste management systems: Methodological issues. Int. J. Life Cycle Assess. 2010, 15, 579–589. [Google Scholar] [CrossRef]
- Ellen MacArthur Foundation. Towards Circular Economy: Accelerating the Scale-Up across Global Supply Chains; World Economic Forum: Geneva, Switzerland, 2014. [Google Scholar]
- Ekvall, T.; Tillman, A.-M. Open-loop recycling: Criteria for allocation procedures. Int. J. Life Cycle Assess. 1997, 2, 155. [Google Scholar]
- Wong, J.W.C.; Lai, K.M.; Fang, M.; Ma, K.K. Effect of sewage sludge amendment on soil microbial activity and nutrient mineralization. Environ. Int. 1998, 24, 935–943. [Google Scholar] [CrossRef]
- Lombardi, L.; Nocita, C.; Bettazzi, E.; Fibbi, D.; Carnevale, E. Environmental comparison of alternative treatments for sewage sludge: An Italian case study. Waste Manag. 2017, 69, 365–376. [Google Scholar] [CrossRef] [PubMed]
- Sampson, I. Fertilizer Value of Biosolids produced from the Treatment of Waste Water. Lead. Edge 2016, 2, 2488–9324. [Google Scholar]
- Wierzbowska, J.; Sienkiewicz, S.; Krzebietke, S.; Sternik, P. Sewage sludge as a source of nitrogen and phosphorus for Virginia fanpetals. Bulg. J. Agric. Sci. 2016, 22, 722–727. [Google Scholar]
- Antoniadis, V.; Koutroubas, S.D.; Fotiadis, S. Nitrogen, Phosphorus, and Potassium Availability in Manure- and Sewage Sludge–Applied Soil. Commun. Soil Sci. Plant Anal. 2015, 46, 393–404. [Google Scholar] [CrossRef]
- Tontti, T.; Poutiainen, H.; Heinonen-Tanski, H. Efficiently Treated Sewage Sludge Supplemented with Nitrogen and Potassium Is a Good Fertilizer for Cereals. Land Degrad. Dev. 2017, 28, 742–751. [Google Scholar] [CrossRef]
- Mtshali, J.S.; Tiruneh, A.T.; Fadiran, A.O. Characterization of sewage sludge generated from wastewater treatment plants in Swaziland in relation to agricultural uses. Resour. Environ. 2014, 4, 190–199. [Google Scholar]
- Warman, P.R.; Termeer, W.C. Evaluation of sewage sludge, septic waste and sludge compost applications to corn and forage: Yields and N, P and K content of crops and soils. Bioresour. Technol. 2005, 96, 955–961. [Google Scholar] [CrossRef]
- World Bank. Fertilizer Consumption (Kilograms per Hectare of Arable Land); World Bank Group: Washington, DC, USA, 2020. [Google Scholar]
- Latosińska, J.; Kowalik, R.; Gawdzik, J. Risk Assessment of Soil Contamination with Heavy Metals from Municipal Sewage Sludge. Appl. Sci. 2021, 11, 548. [Google Scholar] [CrossRef]
- Dregulo, A.M.; Bobylev, N.G. Integrated Assessment of Groundwater Pollution from the Landfill of Sewage Sludge. J. Ecol. Eng. 2021, 22, 68–75. [Google Scholar] [CrossRef]
- Ecoinvent. Implementation of Life Cycle Impact Assessment Methods; Swiss Centre for Life Cycle Inventories: Dübendorf, Switzerland, 2007. [Google Scholar]
- OECD Circular Economy, Waste and Materials; Pascal: Paris, France, 2020.
- Persson, E.; Tinghög, G. Opportunity cost neglect in public policy. J. Econ. Behav. Organ. 2020, 170, 301–312. [Google Scholar] [CrossRef]
- Wolf, M.-A.; Schryver, A.D.; Hofstra, U.; Zampori, L.; Vroege, G.-J.; Wolf, K. Circular Footprint Formula: Webinar; Environmental Footprint (EF) Transition Phase; EC, Maki Consulting GmbH, Think step, SGS: Brussel, Belgium, 2019. [Google Scholar]
- Kerkhof, A.; Terlouw, W.; Vieira, M.; Alexandre, C.; Bagard, R. Evaluation Report: Technical Evaluation of the EU EF Pilot Phase; 2017. Available online: https://ec.europa.eu/environment/eussd/smgp/pdf/HD_pilot_eval_final.pdf (accessed on 8 January 2022).
- EC. Product Environmental Footprint Category 2 Rules Guidance; European Platform on Life Cycle Assessment: Bruxelles/Brussel, Belgium, 2018. [Google Scholar]
- Finnveden, G. Methodological aspects of life cycle assessment of integrated solid waste management systems. Resour. Conserv. Recycl. 1999, 26, 173–187. [Google Scholar] [CrossRef]
- ISO 14040, Environmental Management. Life Cycle Assessment. Requirements and Guidelines. Amendment 2; The International Organization for Standardization (ISO): Geneva, Switzerland, 2020. [Google Scholar]
| Publisher’s Note: MDPI stays neutral with regard to jurisdictional claims in published maps and institutional affiliations. |
© 2022 by the authors. Licensee MDPI, Basel, Switzerland. This article is an open access article distributed under the terms and conditions of the Creative Commons Attribution (CC BY) license (https://creativecommons.org/licenses/by/4.0/).


