Abstract
Greenhouse emissions and air pollutants pose a global threat to the environment and human health. Emission inventories are a valuable tool in understanding emission sources and their overall impact on the environment. Most cities and countries do not include non-road mobile machinery (NRMM) when compiling emission inventories. Furthermore, little effort has been made to understand better the impact of this source of emissions on the environment. For these reasons, this research examines the data from the existing NRMM emission inventories and other studies concerning NRMM emissions. After careful literature review, three main problems in creating a national NRMM emission inventory are identified and reviewed: lack of a comprehensive list of NRMM and their activity data, lack of emission factor data, and lack of research. The data from the existing inventories show that compared to some emissions, NRMM has a three times larger proportion of emissions compared to the proportion of energy consumption. Furthermore, there are significant differences in total emissions when comparing the same pollutants among different countries. A general lack of data is the common denominator for all these problems and can only be solved by creating national NRMM databases operated by a designated institution. This institution must be able to annually update relevant NRMM data through questionnaires and experimental research on the existing NRMM.
1. Introduction
Air pollution has become the most significant global environmental health risk factor [1,2]. According to European Environment Agency (EEA), exposure to air pollution can lead to a wide range of diseases like stroke, chronic obstructive pulmonary disease, trachea, bronchus and lung cancers, aggravated asthma, and lower respiratory infections [3].
Most environmental pollutants are emitted through large-scale human activities like industry, power production, or road transport [4]. With the growth of global emissions [5] and their harmful effect on human health [6,7], it is necessary to control and decrease the emissions. Much has been done in Europe, where emissions levels have been reduced during the last decades [8]. Still, a lot of European mid-sized [9] and larger [10] cities have problems with reducing emissions from various sources [11]. The European Union (EU) has set a 20% emission reduction goal by 2020 compared to 1990 [12]. Additional tasks have been set for a reduction of 40% by 2030 [13], with a proposal for a further reduction of 55% by 2030 [14]. A reduction of 80–95% is to be accomplished by 2050 [15], with a proposal for further emission reduction, by which the EU would reach climate neutrality by 2050 [14]. For the purpose of meeting these goals, further reductions in emissions from internal combustion engines have to be implemented, since only Sweden and Lithuania of all EU member states had a reduction in emissions from road traffic in the period from 1990 to 2017 [16]. In order to prepare a base for the emission reduction via legal restrictions, the EEA collects data from multiple sources [17].
More stringent legal restrictions on engine emissions are also implemented on engines used in non-road mobile machinery (NRMM) [18]. Similar regulations are in force in the United States of America (USA) [19], China [20] and India [21]. In the EU, the first emission standard (Stage 1) for NRMM emissions was introduced in 1999, and the fifth was proposed in 2014, which widened the scope of the regulated engines from small spark-ignition engines to large engines with the power of over 560 kW [22]. The main EU regulation concerning NRMM, the Regulation (EU) 2016/1628 of the European Parliament and of the Council, defines NRMM as transportable or mobile machines that are not intended to transport passengers or goods on roads. It also includes machines installed on passenger or transport vehicles. The regulation encompasses, among other machinery, construction machines, mobile industrial and commercial appliances, snow groomers or street cleaners, agricultural and forestry machines, household machinery, garden care appliances, inland water boats and locomotives [23]. To achieve the emission reduction stipulated by the Regulation (EU) 2016/1628, the engines should be replaced by a newer model or equipped with various emission reduction devices, which brings additional costs. The estimation of possible costs was done by [24], which showed that costs could vary from 229 USD per engine for small engines with engine power less than 19 kW, to over 10,000 USD per engine for larger engines with over 450 kW of engine power.
However, even more stringent emission standards for NRMM are still less strict than the standards for road vehicles. Rigorous road vehicles emission standards resulted in lower emissions from road vehicles, especially from passenger cars [25]. Additionally, NRMM is more durable and has a longer lifetime than road vehicles, so the impact on the environment will be longer [26,27]. Although there are no official data concerning the total NRMM emissions among the European countries, the 2019 edition of the EEA Air Pollutant Emission Inventory Guidebook states that NRMM emissions from a single source sector (e.g., construction machinery or handheld NRMM) range from 0.1 to 11% of the total emission, but are typically less than 5% of the total emission [27]. Furthermore, a Review of Directive 97/68/EC states that, in 2010, NRMM was responsible for 100 million tonnes of CO2 equivalent, which was 2% of the total EU greenhouse gas emissions [28]. A report from 2017 by [29] stated that in the EU, NRMM was responsible for 15% of the total NOX emissions and 5% of the total PM emissions.
When comparing energy consumption and emissions, research shows that the impact of NRMM emissions is greater than the one from road vehicles. The results in Switzerland showed that, in 2015, there were roughly 3 million pieces of NRMM. Although those machines consumed 17.9 PJ of energy, which accounted for 9% of the total energy expenditure, they were responsible for 28% of CO, 18% of HC, 19% of NOX, 33% of PM and 8% of CO2 in the total transport (road + non-road) [30]. In 2010, NRMM accounted for 20% of NOX emissions and 48% of PM emissions in Germany [31]. Another study by Faber et al., examined the impact of emissions from earthworks, road construction, and asphalt paving in Germany. The experiments were conducted in working conditions and under different weather conditions. It was concluded that construction site emissions contributed to 3% of total NOX emissions from traffic and 17% of total PM10 emissions from all sources in Germany [32], while NRMM only has a proportion of 9% of energy consumption compared to road vehicles only [33]. The Swedish inventory for 2019 shows that the major NRMM pollutants, compared to road vehicles, were PM and HC. Their numbers have fallen by 11.4% and 30.3%, respectively, compared to the values in 2010. However, their proportions compared to PM and HC emissions from road vehicles were 164.17% for PM emissions and 89.23% for HC emissions. This indicates that NRMM emitted more PM than road vehicles, which could be due to the slower fleet renewal of NRMM compared to road vehicles [34,35]. In Denmark, the results show that the agricultural sector had the largest proportion in 2016, but also the largest reduction in all pollutants from 1985 to 2016. Compared to road vehicles, the most significant pollutants were PM, CO, and NOX, with proportions of 174%, 92%, and 92%, respectively [36].
Research outside the European countries offers similar results. In China, in 2019, 56% of PM emissions from mobile sources were emitted by 40 million construction and agricultural machinery units, and 24% of PM emissions were from 340 million road vehicles [37]. In 2016, a study [38] concluded that NRMM was responsible for 1435.9 kt of CO, 345.1 kt of HC, 2426.6 kt of NOX and 188.2 kt of PM. Another study which focused on agricultural machinery concluded that this machinery was responsible for 1448.16 kt of CO, 1211.39 kt of HC, 2192.05 kt of NOX, 25.14 kt of SO2, 262.69 kt of PM10 and 249.25 kt of PM2.5 [39] (unfortunately, neither of these two studies compared the data to total emissions or emissions from road transport). Refined oil products account for 53% of China’s oil consumption, most of which is used in road vehicles and NRMM [40]. From 2015 to 2025, total emissions from construction and agricultural machinery are predicted to increase by 9% in the Beijing-Tianjin-Hebei region [41]. One study on emissions of construction machinery in Australia [42] focused on emissions from construction machinery powered by diesel engines. The emissions were higher than expected: this machinery was responsible for 50% of NOX, 24% of SO2, 76% of PM10, 99% of PM2.5, and 10% of volatile organic compounds (VOC) compared to road traffic.
More stringent NRMM emission limits positively impact the process of lowering overall NRMM emissions. This can be seen in the example of London. The London Atmospheric Emissions Inventory provides detailed data for NRMM. In 2013, in the Greater London Area, construction machinery was responsible for 7% of NOX, 8% of PM10, and 14.5% of PM2.5 of total emissions [43], and between 6 and 10% of toxic pollution in London [44]. The results for 2016 show that NRMM was responsible for 7.5% of NOX, 4.7% of PM10, 9.5% of PM2.5 and 0.9% of CO2. Compared to road traffic emissions, NRMM was responsible for 15.4% of NOX, 17.7% of PM10 31.4% of PM2.5 and 3.1% of CO2 [45]. As shown in Table 1, the results for 2016 present a decrease compared to the 2013 and 2010 results, except for CO2 emissions. This indicates that phasing out of older engines and replacing them with newer machines equipped with newer emission reduction technologies lowered the overall NOX, PM10, and PM2.5 emissions from NRMM. However, a study from 2020, carried out on 29 construction machines in London, showed that in working conditions 63% Stage III-A, 67% Stage III-B and 67% Stage IV NRMM exceeded the NOX limit values [46]. This indicates that the overall emissions rates could be higher than that which is estimated by the official Greater London Authority.

Table 1.
Emissions from non-road mobile machinery (NRMM) in the London area in 2010 [47], 2013 [48], and 2016 [45].
To further decrease the overall NRMM engine emissions, London authorities plan to lay down more stringent requirements for NRMM in the Greater London area. From 1 January 2025, the NRMM operating at all sites within Greater London will be required to meet Stage IV engine emission levels, while the NRMM fitted with constant speed engines will be required to meet Stage V. From 1 January 2030, the NRMM will have to meet Stage V engine emission levels, and the final aim for London is to be emission-free as of 1 January 2040 [44].
The first step in implementing the policies to reduce NRMM emissions is to develop an emission inventory, i.e., determine the total NRMM emissions in a specific area. A developed emission inventory offers a platform to track the main sources of emissions by pollutant type and quantity. Inventories are usually developed either by a bottom-up method, which estimates the emissions from statistical analyses of activity data together with country-specific emission factors, or by a top-down method, which collects data on a regional or national level and then distributes these based on ancillary data [49]. However, there can be significant discrepancies between top-down and bottom-up inventory results. A research on the Norwegian NRMM emission inventories [50] compared an NRMM emission inventory developed by bottom-up and top-down methods. The results indicated that the ratio of emissions calculated by the bottom-up approach in relation to the top-down method was 0.3–0.5 for NOX and around 0.2 for PM10. The 2019 edition of the EEA Air Pollutant Emission Inventory Guidebook is one of the most important documents concerning NRMM emission inventories. It lists three possible methods for estimating emissions: Tier 1, Tier 2 and Tier 3, depending on the available data [27]. The Tier 1 method uses only basic NRMM data, i.e., vehicle stock and fuel consumption. Tier 2 is more precise, as it uses data on fuel consumption for each equipment type and technology level. The Tier 3 method is the most detailed one and uses more specific data, e.g., annual hours of use, engine size, deterioration factor adjustment and load factor adjustment. However, estimating emissions from NRMM and compiling an emission inventory is still a difficult task for most countries due to the lack of data. Due to these significant data uncertainties, further research of NRMM emissions and inventories are needed.
2. Materials and Methods
This paper aims to give an overview of the main problems related to NRMM emissions and NRMM inventories. The literature review included scientific databases, such as Scopus, Web of Science, IEEE Explore, Google Scholar, Research Gate, Science Direct and SpringerLink. The Boolean operators “or” and “and” were combined with NRMM-related keywords, such as “NRMM”, “non road”, “machinery”, “inventory”, “scenario”, “emissions”, “mobile”, “regulations”, “methods” and “overview”. The literature search was conducted from January 2020 to June 2021, and it was last updated in February 2022.
Over 200 papers have been analysed, 40 of which had data or conclusions which pointed to the need for scientific research in order to develop national NRMM emission inventories and gave recommendations for the development of such inventories. The papers that were not taken into consideration:
- (a)
- did not have data or conclusions related to NRMM emission inventories;
- (b)
- did not have data or conclusions pointing to major differences between various engine working conditions (e.g., different fuels); and
- (c)
- did not refer to the fact that there was a lack of research in the field of NRMM.
Additionally, over 50 various governmental documents and databases were analysed, 36 of which are included in this review. These documents and databases provided additional data on NRMM or inventories and their relation to emissions of road vehicles. Special care was taken to ensure that the references are as up to date as possible; thus, only fifteen of all the references listed here are more than five years old.
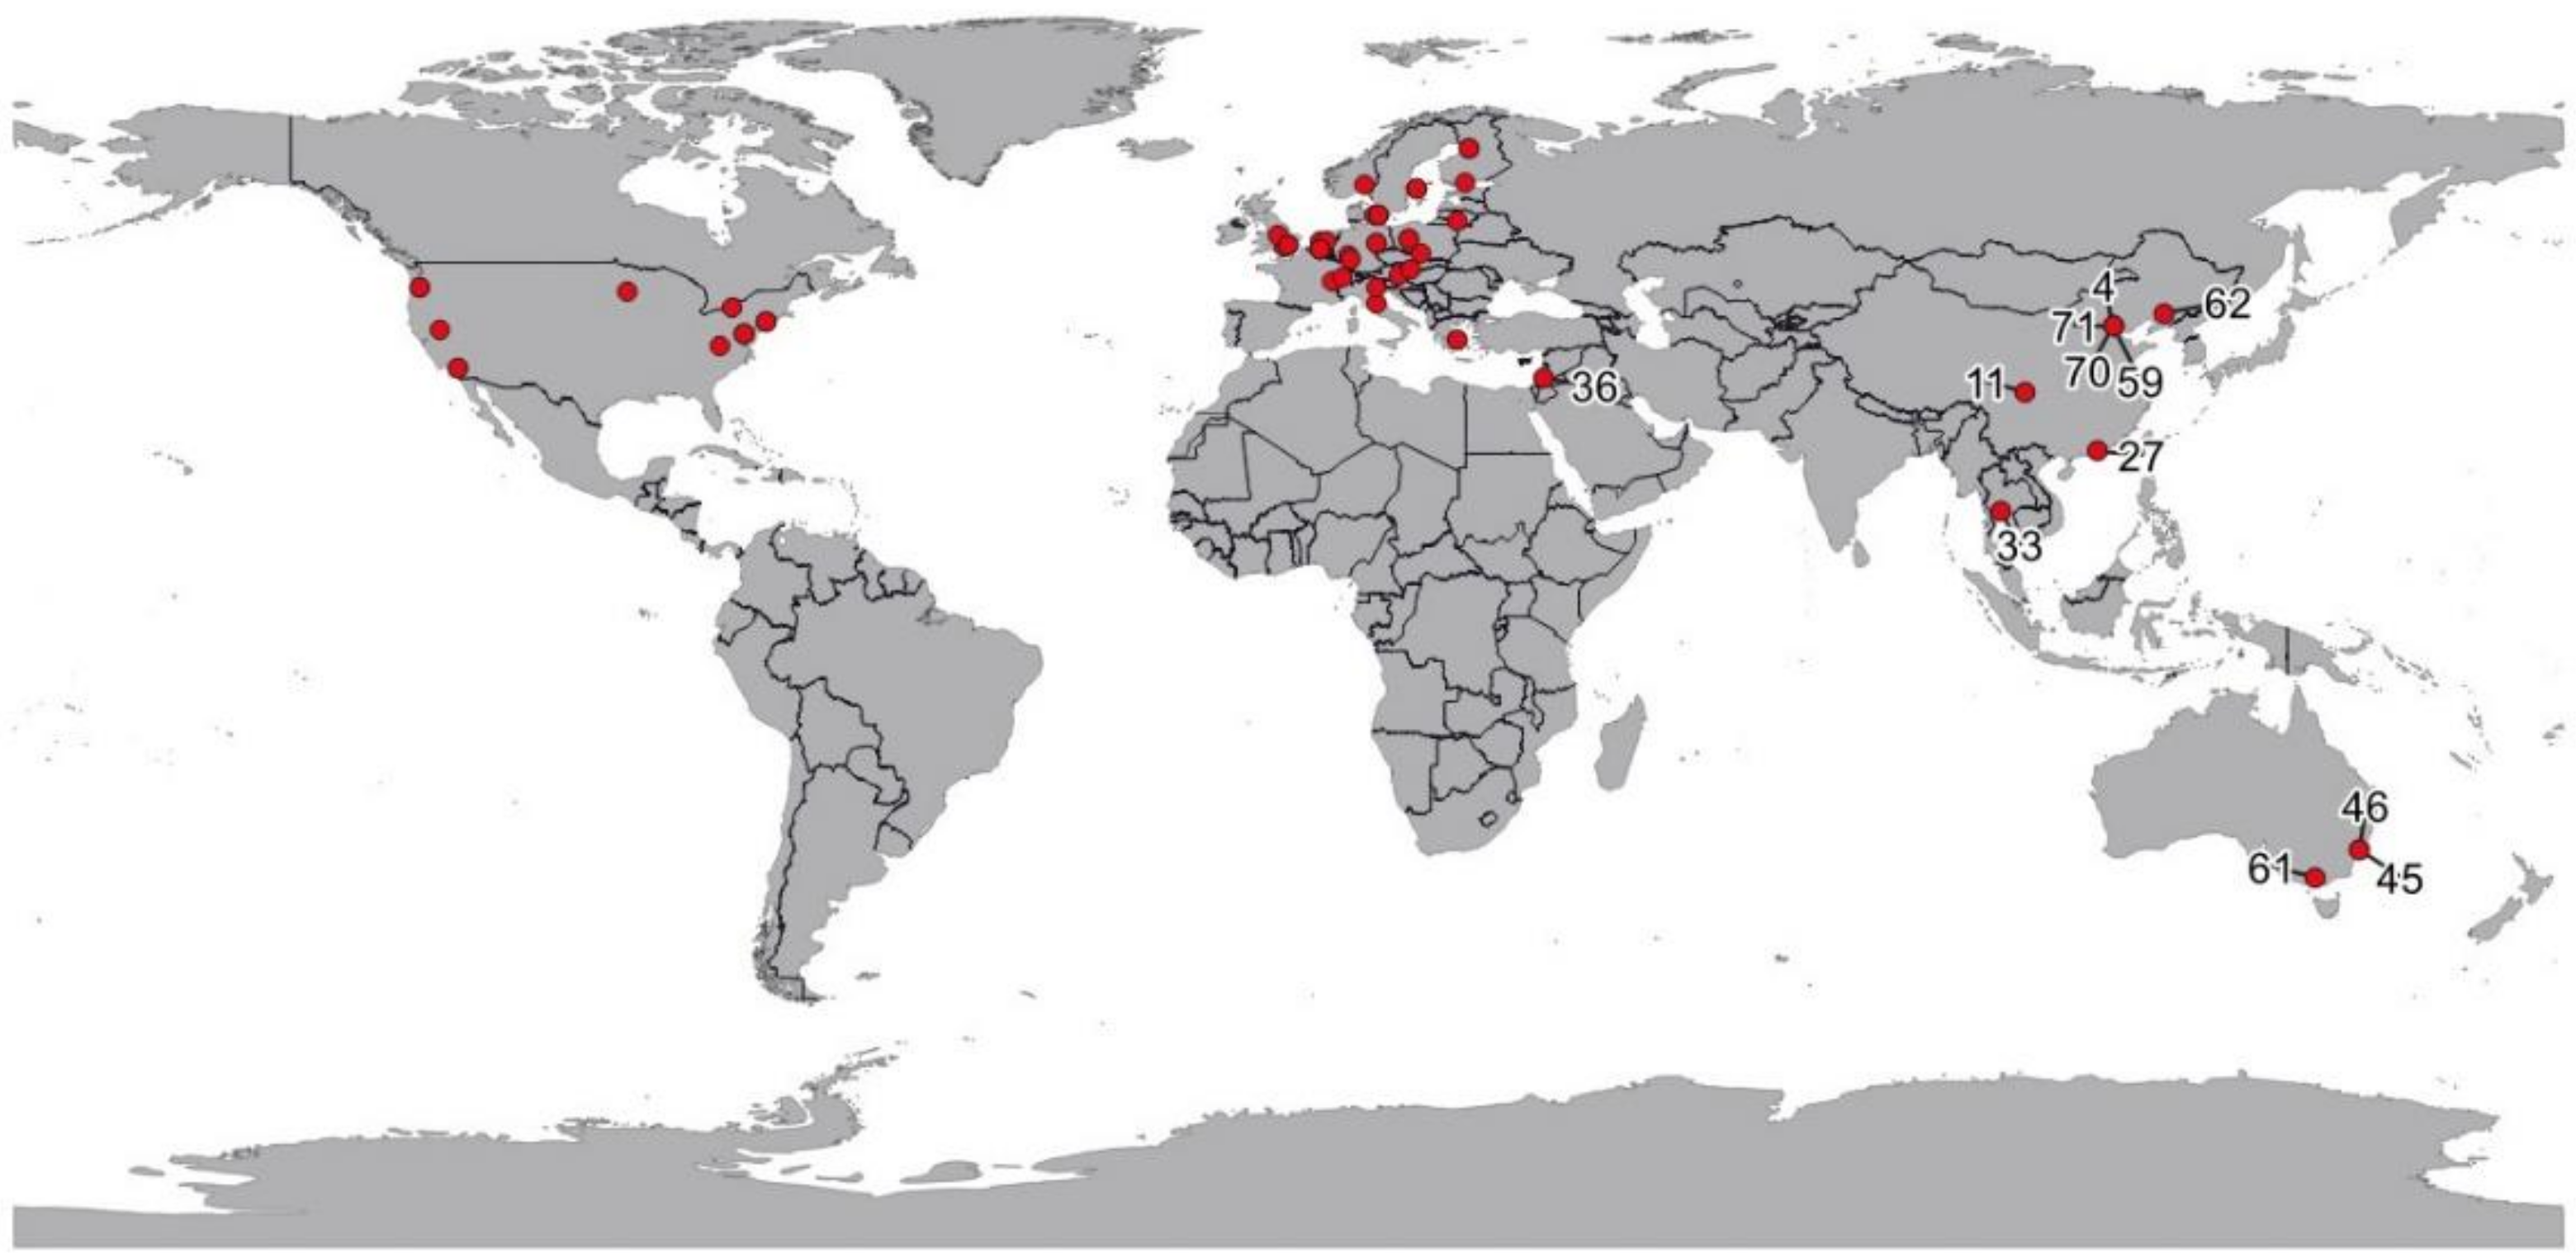
To gain a better insight, the countries of origin of publications (papers and other documents) are shown in Figure 1. The geographical locations related to journal papers are based on the information about the corresponding author’s affiliation. The numbers in the figure correspond to the numbers in references. In the case of other types of documents, the locations of headquarters of the publishing institutions are taken. It can be seen that most of the publications are from the USA, Europe and China.
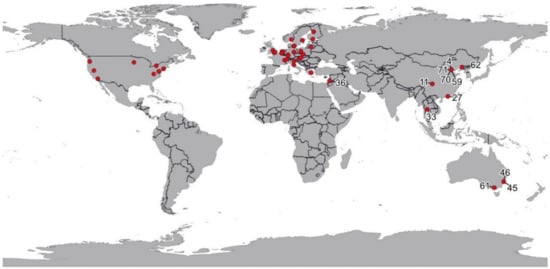
Figure 1.
Origin of publications globally.
Since it is difficult to see all the European publications and publications from the USA, they are additionally presented in Figure 2 in more detail. Furthermore, there are no publications found in the rest of the world, except in Australia, Thailand, and Jordan, which indicates a lack of research related to NRMM globally.
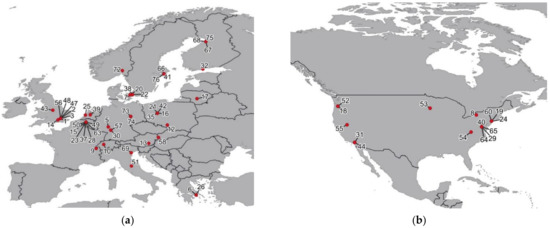
Figure 2.
Origin of publications marked with references: (a) from Europe; (b) from the USA.
Additionally, although the European Union is, besides the USA, at the forefront of NRMM legislation, most European countries still do not have a legally resolved NRMM sector. Publications at the EU level come from virtually only a few sources, mainly the developed countries, as can be seen in Figure 2a. Some of the countries are represented by several publications like the UK, Belgium, or Germany, while most are not covered at all.
An even worse situation is noticed in the USA, where the first federal standards (Tier 1) for the new non-road diesel engines were adopted in 1994. However, according to available sources, the number of scientific publications related to NRMM emissions is significantly lower than in the EU, which may imply that not enough importance has yet been given to emissions from the NRMM sector even in the developed countries, as shown in Figure 2b.
3. Results
After a comprehensive literature review, it was noticed that NRMM emissions and their impact on the environment were not given much importance as it should and there is globally a lack of research in this area. Scientific research and government institutions focused mainly on the emissions from road vehicles, which contributed to the enactment of more stringent emission regulations. In turn, this has further intensified research on emission reduction technologies, such as oxidation catalysts, selective catalytic reduction, NOX adsorbers, diesel particle filters, and gasoline particle filters [51]. Additionally, electrification and hybridization of IC engines have proven to reduce the road traffic carbon footprint [52,53]. These technologies and new technology approaches can be very useful in reducing emissions from NRMM as well. To apply stricter regulation and such modern emission control equipment in the NRMM, first it is necessary to analyze the current situation with NRMM emissions and their inventories.
3.1. Impact of NRMM Emissions Based on the Existing NRMM Emission Inventories
To better understand the impact of NRMM emissions, the current NRMM emission inventories from six European countries have been presented and compared with data for road vehicles. Exhaust emissions country-specific data emitted by the non-road mobile machinery sector and road vehicles powered by internal combustion engines are given in Table 2. The main pollutants restricted by legislation for both sectors and CO2 emission are presented.
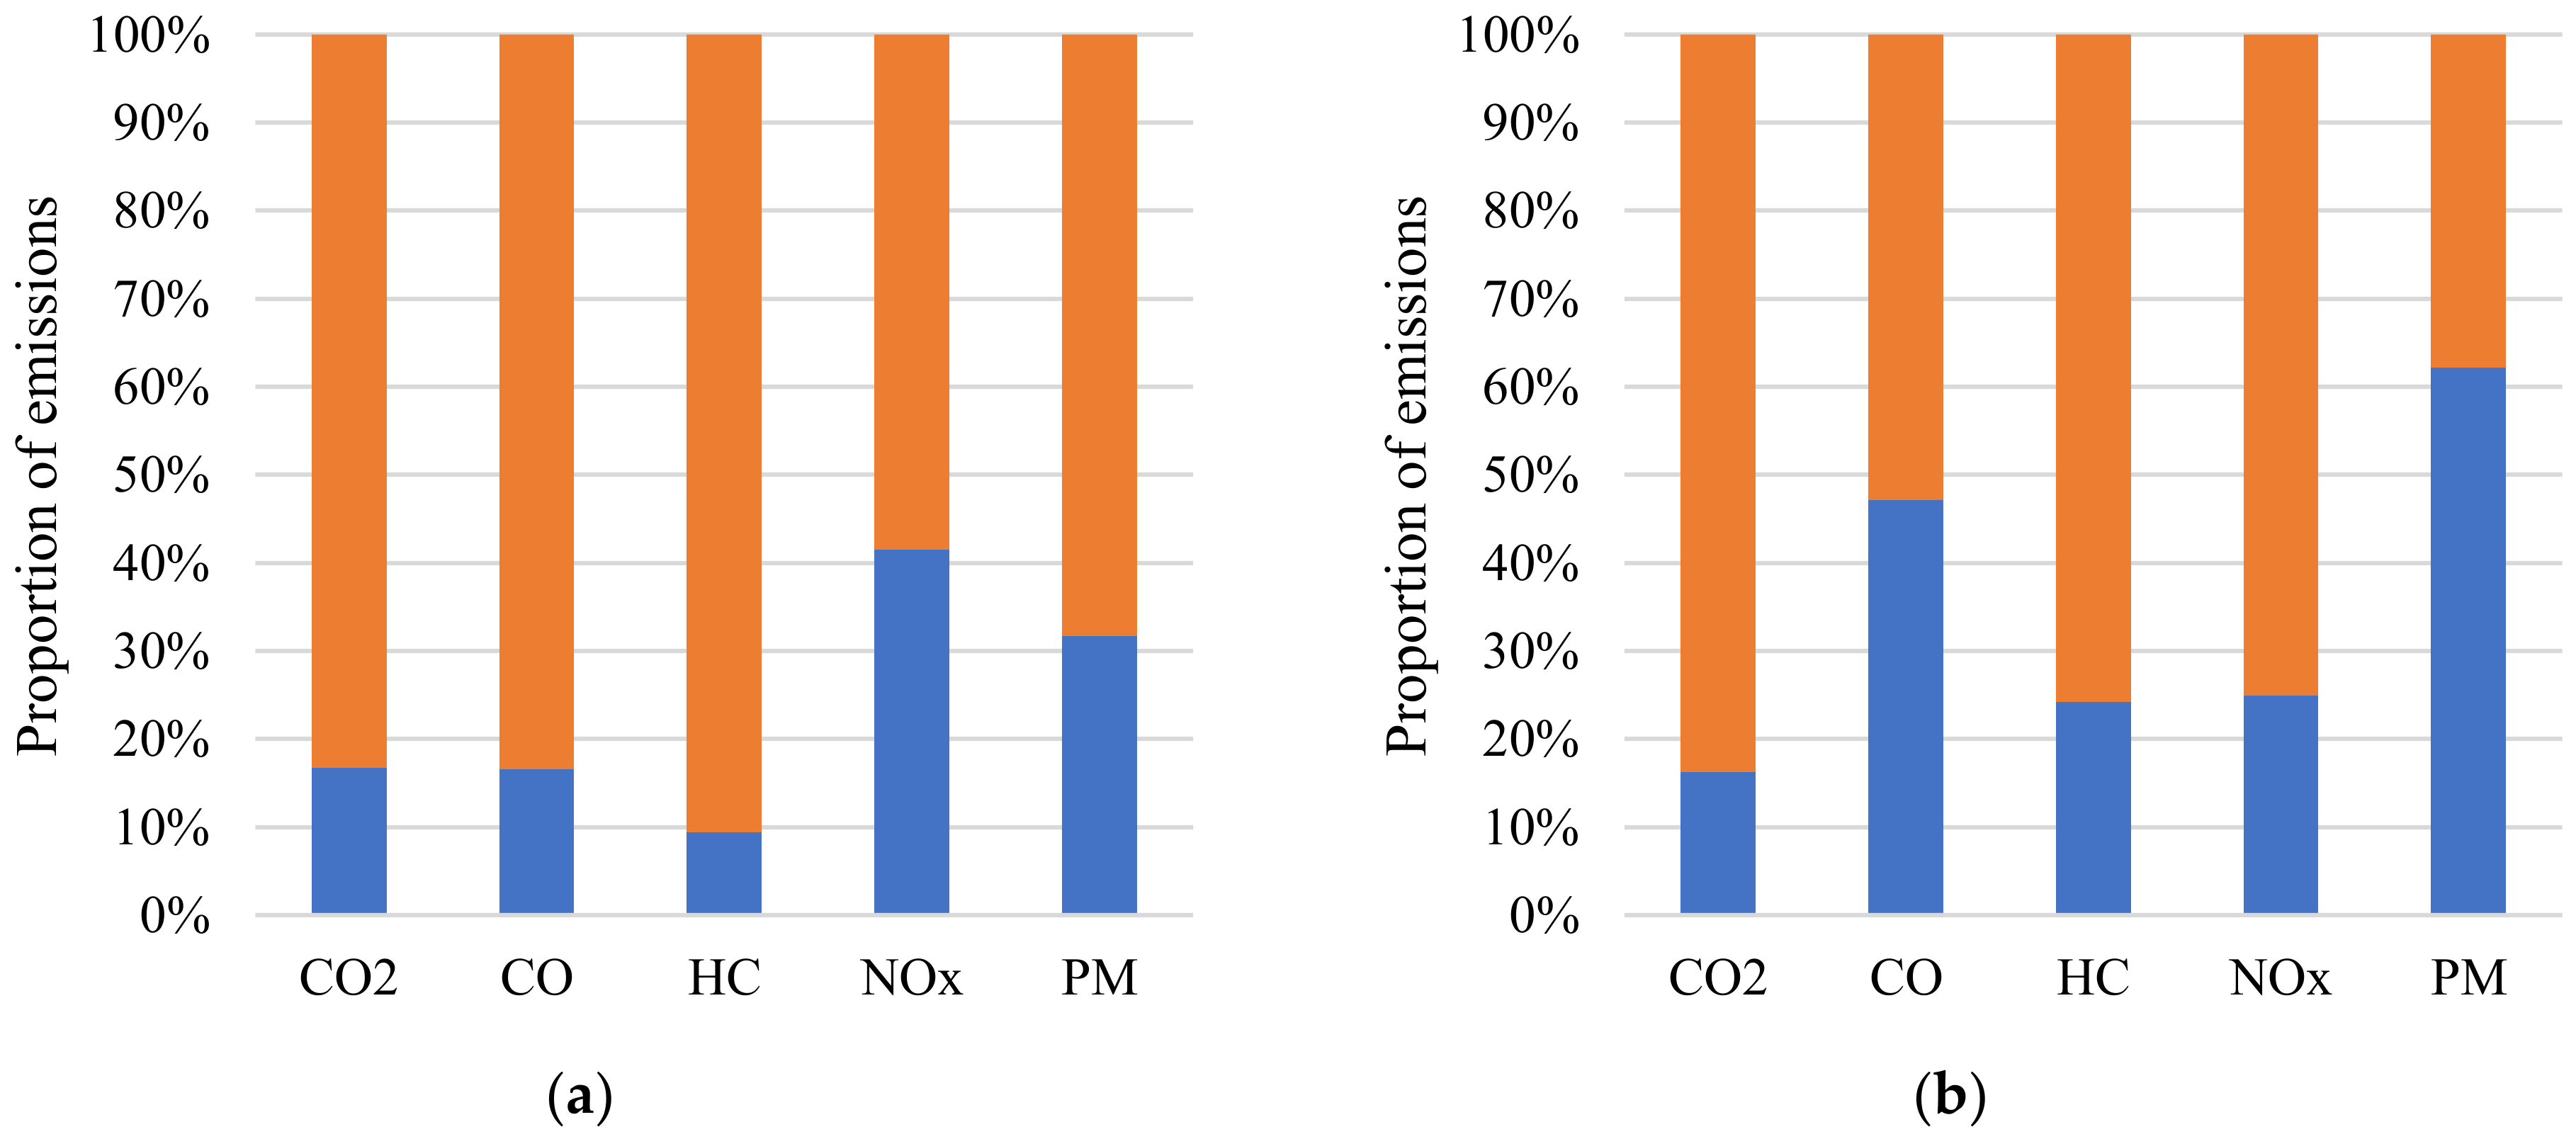
From Table 2 and Figure 3, Significant differences in emissions when comparing the same pollutants among different countries can be observed. Possible reasons can be found in different NRMM types on national levels, NRMM use, climatic and economic circumstances, etc. Further research could explain these differences.

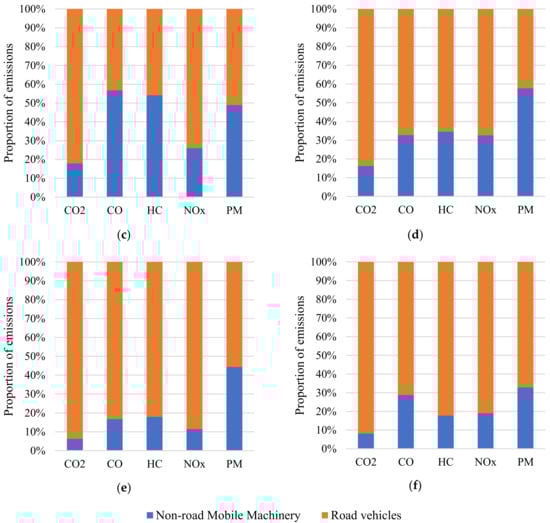
Figure 3.
Proportions of NRMM and road vehicle emissions in inventories of: (a) Netherlands; (b) Sweden; (c) Finland; (d) Denmark; (e) Germany; (f) Switzerland.
Assuming that the energy consumption is represented through CO2 emissions, according to data presented, in most countries, the energy consumption of the NRMM sector is around 17% of the total energy consumed by road vehicles and non-road mobile machinery. The lowest share of 6.25% is found in Germany. This could be a consequence of a significantly higher number of road vehicles compared to the number of NRMM. The ratio of the number of road vehicles to NRMM in Germany was 4.61 in 2019 [54,55], compared to 3.46 in Denmark [36], 1.72 in Switzerland [30], and 1.57 in Finland [56].
Table 2.
NRMM and road vehicle emissions for Finland, Denmark, Germany, Switzerland, the Netherlands, and Sweden [30,31,33,34,35,36,54,56,57,58].
Table 2.
NRMM and road vehicle emissions for Finland, Denmark, Germany, Switzerland, the Netherlands, and Sweden [30,31,33,34,35,36,54,56,57,58].
| Country | Sector | CO2 [kt] | CO [kt] | HC [kt] | NOX [kt] | PM [kt] |
|---|---|---|---|---|---|---|
| Netherlands | NRMM | 5707.90 | 76.80 | 0.25 | 51.90 | 1.90 |
| Road vehicles | 28,446.00 | 387.50 | 2.40 | 73.10 | 4.10 | |
| TOTAL | 34,153.90 | 464.30 | 2.65 | 125.00 | 6.00 | |
| NRMM share | 16.71% | 16.54% | 9.43% | 41.52% | 31.67% | |
| Sweden | NRMM | 2865.70 | 62.03 | 0.28 | 14.78 | 1.97 |
| Road vehicles | 14,813.70 | 69.51 | 0.88 | 44.46 | 1.20 | |
| TOTAL | 17,679.40 | 131.54 | 1.16 | 59.24 | 3.17 | |
| NRMM share | 16.21% | 47.15% | 24.19% | 24.95% | 62.15% | |
| Finland | NRMM | 2281.69 | 43.28 | 4.19 | 9.68 | 0.67 |
| Road vehicles | 10,448.00 | 33.05 | 3.54 | 27.63 | 0.70 | |
| TOTAL | 12,729.69 | 76.33 | 7.73 | 37.31 | 1.37 | |
| NRMM share | 17.92% | 56.70% | 54.16% | 25.95% | 48.93% | |
| Denmark | NRMM | 2393.00 | 29.59 | 0.20 | 14.77 | 0.73 |
| Road vehicles | 12,307.00 | 60.84 | 0.37 | 30.54 | 0.54 | |
| TOTAL | 14,700.00 | 90.43 | 0.57 | 45.31 | 1.27 | |
| NRMM share | 16.28% | 32.72% | 34.51% | 32.59% | 57.70% | |
| Germany | NRMM | 12,294.00 | 219.00 | 23.90 | 69.20 | 6.60 |
| Road vehicles | 184,540.00 | 1094.00 | 110.00 | 536.00 | 8.30 | |
| TOTAL | 196,834.00 | 1313.00 | 133.90 | 605.20 | 14.90 | |
| NRMM share | 6.25% | 16.68% | 17.85% | 11.43% | 44.30% | |
| Switzerland | NRMM | 1238.60 | 36.71 | 2.71 | 7.56 | 0.36 |
| Road vehicles | 14,132.70 | 90.80 | 12.58 | 32.24 | 0.74 | |
| TOTAL | 15,371.30 | 127.51 | 15.29 | 39.80 | 1.10 | |
| NRMM share | 8.06% | 28.79% | 17.71% | 19.00% | 32.76% |
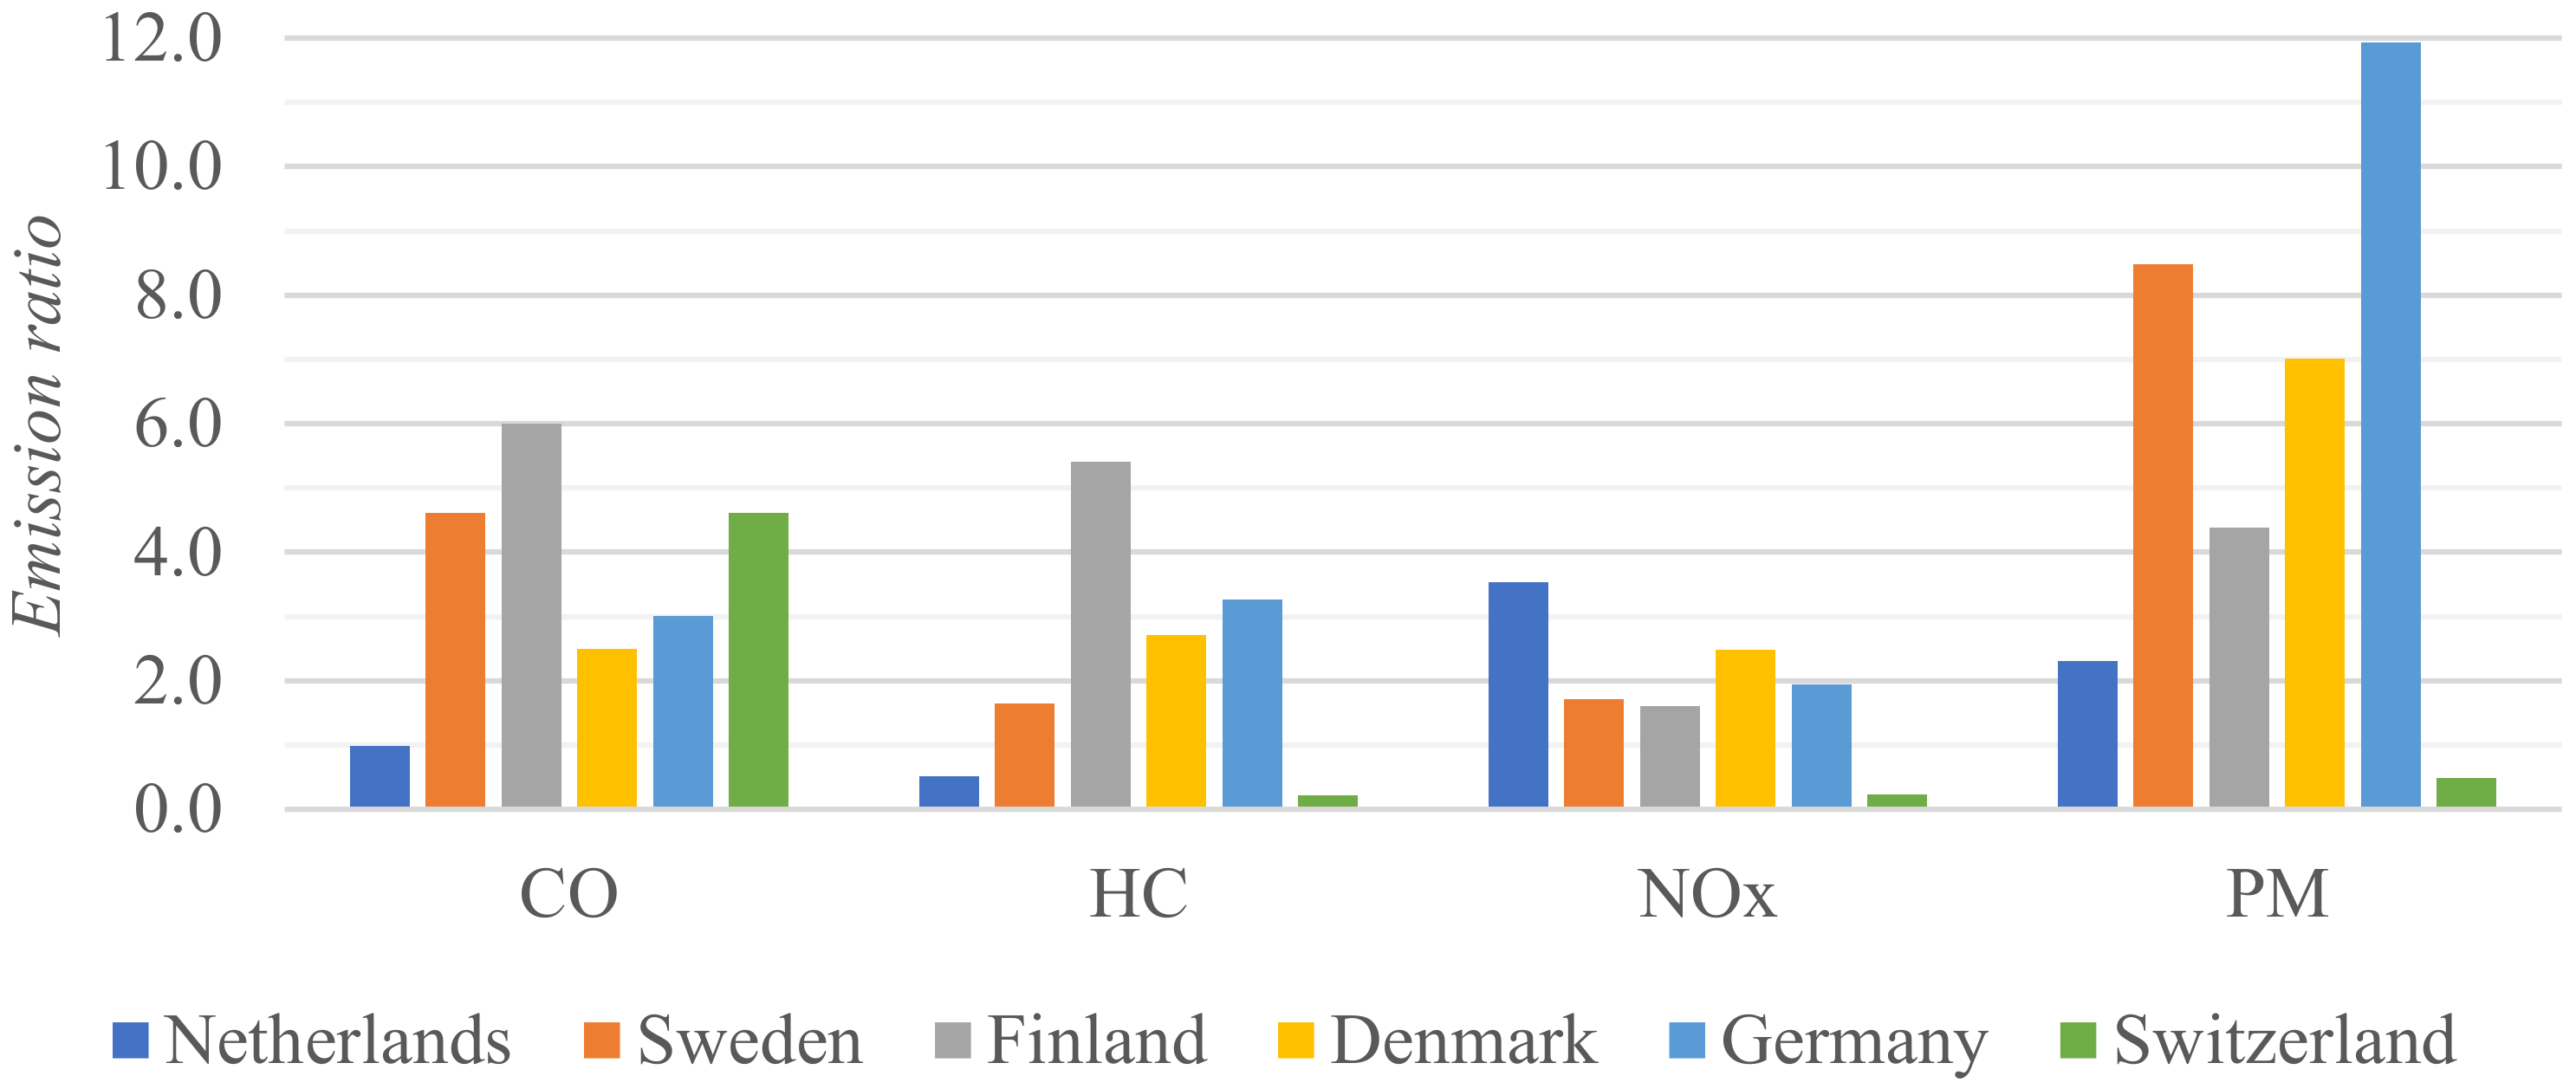
If emissions from both sectors are calculated in relation to the energy consumed, represented through CO2 emission, the influence of sectors on emissions can be additionally analysed. The emissions of pollutants, in relation to CO2 emission, from the NRMM sector and road vehicles, as well as their ratio, are given in Table 3 and presented in Figure 4.
Table 3.
NRMM and road vehicle emissions related to CO2 emissions.
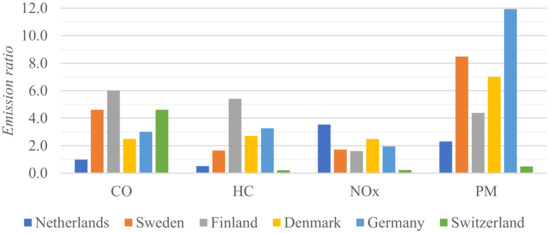
Figure 4.
Total NRMM emissions compared to road vehicle emissions for the Netherlands, Sweden, Finland, Denmark, Germany, and Switzerland.
In most countries, CO or HC emissions from the NRMM sector calculated in such a way are 2.5 to 6 times larger than emissions from road vehicles. Similarly, this is noticed with NOx emissions where the NRMM road vehicles ratio is from 1.5 to 3.5. The worst ratios are present with PM emissions, which are on average 5.8 times higher in the NRMM sector compared to road vehicles, with a particular concern in Germany, where the ratio is almost 12.
From the data presented it can be concluded that the proportion of NRMM emissions is much larger compared to the proportion of the energy consumed. This is the case for all the countries considered, and it is an indication of the overall technological obsolescence of the existing NRMM. To overcome this, the trends applied to road vehicles, such as stricter emission standards, or real driving emission tests, will have to be used in NRMM as well.
3.2. Main Causes of Difficulties in Developing NRMM Emissions
The quality and availability of data are especially important in the process of creating an emission inventory. However, for NRMM, there are mostly only partial or no data. It is complicated to determine the total emissions of NRMM, mainly due to the following three reasons:
- Lack of a comprehensive inventory of NRMM and activity data;
- Lack of emission factor data; and
- Lack of research in the field of NRMM, especially concerning emission factors.
3.2.1. Lack of a Comprehensive Inventory of NRMM and Activity Data
The most significant limiting factor in compiling an accurate NRMM emission inventory is that there is no repository of NRMM, especially of handheld devices in most countries, which makes it almost impossible to make an accurate inventory of NRMM emissions. Quantitative research on NRMM is rare, and when it is conducted, the results vary considerably [59]. There are also significant differences among studies [39]. Some studies give inaccurate estimations due to disparities in vehicle fleets or economic development [60]. Different calculation methods, sources of emission factors, activity data, types of machinery or base years can cause these differences.
The existing NRMM emission inventories are most often made using machine imports or vehicle sales data. Statistics Netherlands provides data on NRMM emissions via its Open Data StatLine platform, but only uses data on vehicle sales, and activity data are assessed from secondary sources from other countries [58,61]. For the inventory in Switzerland, custom correction factors to approximate real-world activity data regarding load factors or work dynamics are used. In addition, corrective factors for dynamic use, engine deterioration and diesel particulate filters are used depending on the engine age. This method of collecting data can be compared to the Tier 3 method in the 2019 EEA Air Pollutant Emission Inventory Guidebook. However, these data are not collected but based on assumptions and expert judgement [30]. The Federal German Environment Agency uses vehicle stock data, but these data are compiled using data from various resale platforms. The detailed data on stock are available only for tractors, while other data are calculated based on the sales numbers, while activity data are obtained by estimations [33]. In Denmark, there is partial collection of data on agricultural and construction machinery, but other data are based on assumptions [36].
Some NRMM inventories use more detailed data. Finland is an example of a country that has a detailed NRMM emission model. It uses the TYKO calculation model, consistent with the EEA Air Pollutant Emission Inventory Guidebook Tier 3 method [62], to estimate Finland’s NRMM emissions and energy consumption. The model includes information on the engine type, average power in the power class, median age, annual use, and average load factor based on type, number of units, and sales. The data collection is based on sales and registration figures, as well as on national and international research. The results are presented for five different NRMM types: diesel driveable machines, gasoline driveable machines, diesel moveable machines, gasoline moveable machines, and gasoline handheld machines. The inventory data have been collected from 1980 onwards, and the model predicts emissions until 2040. However, the activity data are only partially collected [56]. The Swedish NRMM emission inventory also uses data gathered on an annual basis, which includes information on vehicle type and average annual use. It also provides detailed emission data, such as data about real-world emissions [63]. There is also room for improvement, as only partial data are available, which are then extrapolated on a national level [64].
Even though each of the researched NRMM emission inventories can be compared to either the Tier 1, Tier 2, or Tier 3 method in the 2019 EEA Air Pollutant Emission Inventory Guidebook, most of the data are assumed, sometimes without any concrete numbers to back them up.
For an NRMM emission inventory to be developed, sufficient activity data must be collected. This includes primarily stock and operating hours, with small handheld machinery used in households being the exception since it is challenging to acquire those data. However, to obtain complete data, annual queries in households should be conducted by national statistical bureaus, in which questions about machinery type, fuel consumption and hours of work would be required. A lack of a comprehensive standard [65] which would provide a more accurate estimation of emission factors presents a limitation on how activity data should be collected depending on the machinery purpose and working conditions.
The main problem of all the methods as mentioned earlier is that they lack a platform by which detailed data could be collected. This could be solved with the introduction of a national NRMM fleet and emission inventories. The minimum information package should contain data about the manufacturer (brand, type, model), year, number of machinery units, fuel type, and regulation tier. Although this is quite difficult to establish, if at all possible, the data on hours of operation for each NRMM type should also be included. This can be adequately solved by conducting annual large-scale surveys and could provide more accurate data compared to the existing methods [39]. A designated institution responsible for the annual collection of data is needed to conduct such a survey.
3.2.2. Lack of Emission Factor Data
Every engine type sold on the EU market must undergo type approval tests. These tests are developed to determine the engine emissions to ensure that the engines meet relevant environmental and safety regulations. Standard ISO 8178 from the International Standard Organisation (ISO) is the most commonly used testing procedure.
The main problem with NRMM is the lack of a clear standard on how NRMM emission factor data should be determined, collected and documented, as well as the question of who should collect the data [29]. This requires a political decision which must be addressed for the essential data to be collected.
The lack of emission factor data makes it difficult to determine which NRMM categories have the most significant proportions in total NRMM emissions. However, some of the studies considered have shown that the construction and agricultural industries have the largest proportions of total NRMM emissions, although other machinery types represent large proportions of some emission types as well. An emission inventory in Switzerland [30] has shown that construction and agricultural machinery is responsible for the largest proportion of NRMM emissions. Garden care and hobby appliances were the second largest emission emitters of CO and HC compounds, which further strengthens the claim to collect more accurate activity data for such machinery. A study on non-road equipment emissions in China [38] showed that the emission factors vary by equipment type and between different studies. The highest to the lowest values ratio can be as much as 4.2 for HC emissions, 9.6 for CO, 3.5 for NOX, and 6.6 for PM emissions.
Data on emission factors should be collected under the operating conditions for the final NRMM emission inventory to represent actual emissions. The laboratory tests lead to unsatisfactory NRMM emission inventory results, as test procedures cannot represent the actual emission under the operating conditions [66]. This can lead to a lack of precise regulation and control concerning various NRMM. Ten-year research of emissions in the construction industry in Australia showed that the main difficulty in making an accurate emission inventory is the lack of data and considerable variability in the results due to different working conditions of NRMM. The results varied even when the project site area and size were similar. The research also showed a lack of publicly available data for NRMM emissions [42]. In Germany, the emission factors are calculated based on the fuel type, power class, and emissions standards. Due to the lack of data of NRMM emission factors, they are estimated by comparing literature values from other countries, emission limit values and expert judgement [33]. The NRMM emission inventory showed that, although NRMM accounted for 193 PJ of energy in 2014, which is 10% of energy consumption of road traffic, it was responsible for 123 kt of NOX and 13.5 kt of PM, which is more than 25% and 100%, respectively, compared to NOx and PM emissions produced by road traffic. These data are mostly the result of lower limit values set for NRMM and the lack of research on NRMM, which slowed down the introduction of regulatory restrictions, as opposed to the area of road traffic [31]. However, as in most inventories, the data availability is limited and varies between sectors.
3.2.3. Lack of Research concerning NRMM, Especially Emission Factors of Activity Data
As emissions from the NRMM were considered negligible in relation to road transport, all research activities were focused on road vehicles, and concerning NRMM they were quite lacking. Further government, professional, and especially scientific research would enable new approaches and methods to examine the impact of NRMM on the environment.
As shown in [67], the regulatory bodies should enable the collection and public access to the data on NRMM. Unfortunately, the current models for determining the emission factors lack representativeness. Furthermore, even if the NRMM emission data have already been calculated, in most emission inventories they are incorporated in other emission source categories instead of being shown separately as NRMM data. This is an essential step if emission factors are to be calculated more accurately and future research on this topic is to be enabled [68].
Research is mainly done on agricultural and construction machinery. Due to a large number of engine models which vary in size and working conditions, the research has been funded mostly to investigate the groups of machinery responsible for most of the emissions. In addition, conducting a study on NRMM is often harder than conducting a study on road vehicles. Measuring air quality in the area where NRMM is in use often requires a portable emission monitoring system (PEMS) as in [59,69,70], or a mobile aerosol research laboratory (MoLa) as in [32].
It is important for scientific research to collect and process data on NRMM emission factors based on the working conditions, various fuel types and mixtures, and propulsion type (engine, hybrid or electric) used in NRMM. Such research can provide unbiased and accurate data for estimating the total NRMM emissions in an emission inventory, as concluded in [26].
As mentioned in Section 3.2.2, the emission factors during the working conditions are an especially important research area. Due to many variations in engine models and even more variations in conditions during fieldwork, current models relying on laboratory-conducted experiments and expert assessments leave room for improvement [66]. This would also have an impact on the safety of the work environment, with new data on the real harmfulness for the workers operating the machinery [71] and people in general [9]. Different fieldwork studies do not apply the same procedures, complicating data and result comparison, as concluded by [72]. Applying a unified method for measuring NRMM emissions during real working conditions would result in much more accurate data [68]. Most research is done on construction machinery, but the results for agricultural machinery [73,74] and machinery used in forestry [75] also show that research during real working conditions is crucial. Unfortunately, current research rarely yields reliable results which could be compared to the results of other studies [76].
4. Conclusions and Recommendations
Although the contribution of NRMM to overall emissions is significant, there is a lack of a more serious approach towards acquiring and processing such data to fully understand the ecological and health risks posed by the emissions from NRMM. The data show significant disparities between NRMM emission proportions compared to their energy consumption. In most countries, CO or HC emissions from the NRMM sector are 2.5 to 6 times larger than those from road vehicles. NOX emissions are also up to several times higher, where the NRMM to road vehicles ratio is 1.5 to 3.5. The worst case is with the PM emissions, which are on average 5.8 times higher in NRMM sector compared to road vehicles. The ratio is the highest in Germany, where it is almost 12. For NRMM emissions to be understood and reduced, the emissions inventories with quality data must be developed. However, this is not the case in most countries. In this paper, the main problems have been recognised and described.
Firstly, there is a lack of a comprehensive list of NRMM. Creating and maintaining a solid repository of NRMM is the first step in compiling an emission inventory. Unfortunately, many countries do not have any type of NRMM emission inventory, and most of those who do create their inventories based mostly on assumptions with little to no data. As a more systematic approach in compiling an emission inventory is needed, this can be only done by regulatory bodies. Yearly questionnaires with the largest retailers organised by a regulatory body or a regulation requiring data on the NRMM put on the market in a country would solve this problem.
Secondly, data on NRMM activity are the missing link between the number of units of NRMM and their emission factors. The construction, agricultural and forestry machinery are the most important groups to collect these data from since research shows that they are responsible for most NOX and PM NRMM emissions. The examples of this can be found in four references in this paper. The 2019 EEA EMEP/EEA Air Pollutant Emission Inventory Guidebook [27] states that, based on the available results, agriculture and construction sectors/sub-sectors seem to be of the greatest importance for NOX and PM emissions. An NRMM emissions inventory in Switzerland shows that agriculture and construction machinery has the largest proportions in NOX and PM emissions [30]. In the document “The updated China IV non-road emission standards”, agricultural and construction machinery are recognised as the largest NOX and PM emitters [37]. The Danish Emission Inventories for Road Transport and Other Mobile Sources [36] also mentions agricultural machinery as the largest NOX emitter. The activity data of other NRMM subgroups, such as household machinery, could be collected via a questionnaire. However, there is still the problem with the validity of data, which would have to be collected only by trained officials to ensure that high-quality data are obtained for the inventory.
Thirdly, since emission factors play an important role in determining the overall NRMM emissions, special emphasis should be put on determining the accurate emission factors for various working conditions, especially during transient machinery activities. More accurate emission data can prevent overestimation or underestimation of a part of or of overall NRMM emissions. While fuel consumption data can be adequately collected via a survey, the emission factors require additional tests and research.
Fourthly, the aforementioned studies showed that the emission factors measured during work in real conditions differ significantly from those measured in laboratory conditions. More accurate data on emission factors measured during work in real conditions would improve the overall understanding of the impact on the environment and the machinery operators. Thus, further research is needed, especially new methods for collecting or estimating the emission factors. Due to a large variety of engine models and fieldwork conditions, a method which could group emission factors for several NRMM models would reduce the amount of work.
The common denominator in all the problems is the lack of data. Some of the data, such as a list of NRMM units and total fuel consumption, can only be adequately collected by government bodies. Countries which already have some form of an NRMM emission inventory, such as Finland, Sweden, or Germany, can share their experience with other countries. A lot of data could be collected automatically by using digital tools, but they can only be acquired constantly through government funding. The national statistical bureaus are usually best equipped and have the knowledge to take on this task. For most of the data, changes in the existing questionnaires would be sufficient to gather basic data about NRMM numbers and activity. Apart from the national statistical bureaus, an institution specially oriented on NRMM emissions could process the data and produce accurate and up to date NRMM emission inventories.
Author Contributions
Conceptualization, Z.L. and G.Š.; methodology, Š.L. and P.I.; investigation, Š.L.; resources, Š.L.; writing—original draft preparation, Š.L.; writing—review and editing, P.I.; supervision, Z.L. All authors have read and agreed to the published version of the manuscript.
Funding
This research received no external funding.
Institutional Review Board Statement
Not applicable.
Informed Consent Statement
Not applicable.
Data Availability Statement
Not applicable.
Conflicts of Interest
The authors declare no conflict of interest.
References
- Boogaard, H.; Walker, K.; Cohen, A.J. Air Pollution: The Emergence of a Major Global Health Risk Factor. Int. Health 2019, 11, 417–421. [Google Scholar] [CrossRef] [PubMed]
- World Health Organization. Ambient (Outdoor) Air Pollution. Available online: https://www.who.int/news-room/fact-sheets/detail/ambient-(outdoor)-air-quality-and-health (accessed on 23 December 2021).
- European Environment Agency. Air Pollution: How It Affects Our Health. Available online: https://www.eea.europa.eu/themes/air/health-impacts-of-air-pollution (accessed on 23 December 2021).
- Manisalidis, I.; Stavropoulou, E.; Stavropoulos, A.; Bezirtzoglou, E. Environmental and Health Impacts of Air Pollution: A Review. Front. Public Health 2020, 8, 14. [Google Scholar] [CrossRef] [PubMed] [Green Version]
- UNEP. United Nations Emissions Gap Report 2019; United Nations Environment Programme (UNEP): Gigiri Nairobi, Kenya, 2019. [Google Scholar]
- Najjar, Y. Gaseous Pollutants Formation and Their Harmful Effects on Health and Environment. Innov. Energy Policies 2011, 1, 101. [Google Scholar] [CrossRef]
- Zhou, L.; Li, Z.; Meng, L.; Li, T.; Domingos Raimundo Lopes, N. Environmental Risk Assessment for PM2.5 Pollution from Non-Point Sources in the Mining Area Based on Multi-Source Superposition and Diffusion. Sustainability 2021, 13, 6619. [Google Scholar] [CrossRef]
- Lackovičová, A.; Guttova, A.; Backor, M.; Pišút, P.; Pišút, I. Response of Evernia Prunastri to Urban Environmental Conditions in Central Europe after the Decrease of Air Pollution. Lichenologist 2013, 45, 89–100. [Google Scholar] [CrossRef]
- Squizzato, S.; Cazzaro, M.; Innocente, E.; Visin, F.; Hopke, P.K.; Rampazzo, G. Urban Air Quality in a Mid-Size City—PM2.5 Composition, Sources and Identification of Impact Areas: From Local to Long Range Contributions. Atmos. Res. 2017, 186, 51–62. [Google Scholar] [CrossRef] [Green Version]
- Sanidas, E.; Papadopoulos, D.P.; Grassos, H.; Velliou, M.; Tsioufis, K.; Barbetseas, J.; Papademetriou, V. Air Pollution and Arterial Hypertension. A New Risk Factor Is in the Air. J. Am. Soc. Hypertens. 2017, 11, 709–715. [Google Scholar] [CrossRef]
- Sgrigna, G.; Relvas, H.; Miranda, A.I.; Calfapietra, C. Particulate Matter in an Urban–Industrial Environment: Comparing Data of Dispersion Modeling with Tree Leaves Deposition. Sustainability 2022, 14, 793. [Google Scholar] [CrossRef]
- EU. Directive 2009/28/EC on the Promotion of the Use of Energy from Renewable Sources and Amending and Subsequently Repealing Directives 2001/77/EC and 2003/30/EC (Text with EEA Relevance) 2009. Off. J. Eur. Union 2009, 140, 16–62. [Google Scholar]
- European Commission. GREEN PAPER: A 2030 Framework for Climate and Energy Policies; European Commission: Brussels, Belgium, 2013. [Google Scholar]
- European Commission State of the Union: Commission Raises Climate Ambition. Available online: https://ec.europa.eu/commission/presscorner/detail/en/IP_20_1599 (accessed on 18 October 2020).
- European Commission. Communication from the Commission to the European Parliament, the Council, the European Economic and Social Committee and the Committee of the Regions: A Roadmap for Moving to a Competitive Low Carbon Economy in 2050; European Commission: Brussels, Belgium, 2011. [Google Scholar]
- European Environment Agency Greenhouse Gas Emissions from Transport in Europe. Available online: https://www.eea.europa.eu/data-and-maps/indicators/transport-emissions-of-greenhouse-gases/transport-emissions-of-greenhouse-gases-12 (accessed on 7 January 2020).
- Brodny, J.; Tutak, M. Analysis of the Diversity in Emissions of Selected Gaseous and Particulate Pollutants in the European Union Countries. J. Environ. Manag. 2019, 231, 582–595. [Google Scholar] [CrossRef]
- Walus, K.J.; Wargula, L.; Krawiec, P.; Adamiec, J.M. Legal Regulations of Restrictions of Air Pollution Made by Non-Road Mobile Machinery-the Case Study for Europe: A Review. Environ. Sci. Pollut. Res. 2018, 25, 3243–3259. [Google Scholar] [CrossRef] [Green Version]
- United States Environmental Protection Agency EPA Emission Standards for Nonroad Engines and Vehicles. Available online: https://www.epa.gov/emission-standards-reference-guide/epa-emission-standards-nonroad-engines-and-vehicles (accessed on 24 April 2020).
- Huanxing, C.; Gang, L.; Ying, Y.; Liang, J.; Shunli, L. Review and Outlook of China Non-Road Diesel Mobile Machinery Emission Standards. Johns. Matthey Technol. Rev. 2020, 64, 76–83. [Google Scholar] [CrossRef]
- Shao, Z. India Bharat Stage IV and V Non-Road Emission Standards; ICCT: Washington, DC, USA, 2018; Available online: https://theicct.org/publication/india-bharat-stage-iv-and-v-non-road-emission-standards/ (accessed on 7 January 2020).
- DieselNet Emission Standards Europe: Nonroad Engines. Available online: https://www.dieselnet.com/standards/eu/nonroad.php (accessed on 7 January 2020).
- EU. Regulation 2016/1628 on Requirements Relating to Gaseous and Particulate Pollutant Emission Limits and Type-Approval for Internal Combustion Engines for Non-Road Mobile Machinery, Amending Regulations (EU) No. 1024/2012 and (EU) No. 167/2013, and Amending and Repealing Directive 97/68/EC (Text with EEA Relevance); European Union: Brussels, Belgium, 2016. [Google Scholar]
- Dallmann, T. Costs of Emission Reduction Technologies for Diesel Engines Used in Non-Road Vehicles and Equipment; ICCT: Washington, DC, USA, 2018; p. 24. Available online: https://theicct.org/publication/costs-of-emission-reduction-technologies-for-diesel-engines-used-in-non-road-vehicles-and-equipment/ (accessed on 7 January 2020).
- Szymlet, N.; Lijewski, P.; Fuć, P.; Sokolnicka, B.; Siedlecki, M. Comparative Analysis of Passenger Car and Non-Road Machinery Specific Emission in Real Operating Conditions. In Proceedings of the 2018 International Interdisciplinary PhD Workshop (IIPhDW), Swinoujscie, Poland, 9–12 May 2018; pp. 226–230. [Google Scholar]
- Cao, T.; Durbin, T.D.; Russell, R.L.; Cocker, D.R.; Scora, G.; Maldonado, H.; Johnson, K.C. Evaluations of In-Use Emission Factors from off-Road Construction Equipment. Atmos. Environ. 2016, 147, 234–245. [Google Scholar] [CrossRef] [Green Version]
- EEA. EMEP/EEA Air Pollutant Emission Inventory Guidebook 2019; European Union: Brussels, Belgium, 2019. [Google Scholar]
- European Comission. Impact Assessment Accompanying the Document “Review of Directive 97/68/EC on Emissions from Engines in Non-Road Mobile Machinery in View of Establishing a New Legislative Instrument”; European Comission: Brussels, Belgium, 2010. [Google Scholar]
- Poulsen, T.S. Market Analysis for Non-Road Mobile Machinery Sector; Scandinavian GPP Alliance: Copenhagen, Denmark, 2017; p. 40. [Google Scholar]
- Notter, B.; Wüthrich, P.; Heldstab, J. An Emissions Inventory for Non-Road Mobile Machinery (NRMM) in Switzerland. J. Earth Sci. Geotech. Eng. 2016, 6, 273–292. [Google Scholar]
- Helms, H.; Heidt, C.; Lehmphul, K. Erarbeitung Eines Konzepts zur Minderung der Umweltbelastung aus NRMM (Non Road Mobile Machinery) unter Berücksichtigung Aktueller Emissionsfaktoren und Emissionsverminderungsoptionen für den Bestand; Umweltbundesamt: Dessau-Roßlau, Germany, 2014.
- Faber, P.; Drewnick, F.; Borrmann, S. Aerosol Particle and Trace Gas Emissions from Earthworks, Road Construction, and Asphalt Paving in Germany: Emission Factors and Influence on Local Air Quality. Atmos. Environ. 2015, 122, 662–671. [Google Scholar] [CrossRef]
- Helms, H.; Jamet, M.; Heidt, C. Renewable Fuel Alternatives for Mobile Machinery; Institut für Energie-und Umweltforschung: Heidelberg, Germany, 2017. [Google Scholar]
- Statistic Sweden Emissions of Air Pollutants from Off-Road Vehicles and Other Machinery by Subsector. 2018. Available online: http://www.statistikdatabasen.scb.se/pxweb/en/ssd/START__MI__MI0108/MI0108ArbMask/ (accessed on 10 April 2020).
- Statistic Sweden Total Emissions and Removals of Greenhouse Gases by Greenhouse Gas and Sector. 2018. Available online: http://www.statistikdatabasen.scb.se/pxweb/en/ssd/START__MI__MI0107/TotaltUtslappN/ (accessed on 10 April 2020).
- Winther, M. Danish Emission Inventories for Road Transport and Other Mobile Sources. Inventories until the Year 2018; Aarhus University, DCE—Danish Centre for Environment and Energy: Aarhus, Denmark, 2020; p. 132. [Google Scholar]
- Shao, Z. The Updated China IV Non-Road Emission Standards; ICCT: Washington, DC, USA, 2021. [Google Scholar]
- Wang, F.; Li, Z.; Zhang, K.; Di, B.; Hu, B. An Overview of Non-Road Equipment Emissions in China. Atmos. Environ. 2016, 132, 283–289. [Google Scholar] [CrossRef]
- Lang, J.; Tian, J.; Zhou, Y.; Li, K.; Chen, D.; Huang, Q.; Xing, X.; Zhang, Y.; Cheng, S. A High Temporal-Spatial Resolution Air Pollutant Emission Inventory for Agricultural Machinery in China. J. Clean Prod. 2018, 183, 1110–1121. [Google Scholar] [CrossRef]
- Wang, L.; Chen, X.; Tang, Q.; Sun, Q.; Wang, H.; Jin, L. A Study on Environmental Cost of China’s Oil Production and Utilization. IOP Conf. Ser. Mater. Sci. Eng. 2020, 730, 012057. [Google Scholar] [CrossRef]
- Guo, X.; Wu, H.; Chen, D.; Ye, Z.; Shen, Y.; Liu, J.; Cheng, S. Estimation and Prediction of Pollutant Emissions from Agricultural and Construction Diesel Machinery in the Beijing-Tianjin-Hebei (BTH) Region, China. Environ. Pollut. 2020, 260, 113973. [Google Scholar] [CrossRef]
- Sepasgozar, S.M.E.; Blair, J. Measuring Non-Road Diesel Emissions in the Construction Industry: A Synopsis of the Literature. Int. J. Constr. Manag. 2019, 21, 582–597. [Google Scholar] [CrossRef]
- Greater London Authority. Non-Road Mobile Machinery (NRMM) Practical Guide; Greater London Authority: London, UK, 2017.
- Greater London Authority. Non-Road Mobile Machinery (NRMM) Practical Guide v.4; Greater London Authority: London, UK, 2020.
- Greater London Authority. London Atmospheric Emissions Inventory. 2016. Available online: https://data.london.gov.uk/dataset/london-atmospheric-emissions-inventory--laei--2016 (accessed on 2 March 2020).
- Desouza, C.D.; Marsh, D.J.; Beevers, S.D.; Molden, N.; Green, D.C. Real-World Emissions from Non-Road Mobile Machinery in London. Atmos. Environ. 2020, 223, 117301. [Google Scholar] [CrossRef]
- Greater London Authority. London Atmospheric Emissions Inventory. 2010. Available online: https://data.london.gov.uk/dataset/london-atmospheric-emissions-inventory-2010 (accessed on 15 April 2020).
- Greater London Authority. London Atmospheric Emissions Inventory. 2013. Available online: https://data.london.gov.uk/dataset/london-atmospheric-emissions-inventory-2013 (accessed on 15 April 2020).
- Cheewaphongphan, P.; Chatani, S.; Saigusa, N. Exploring Gaps between Bottom-Up and Top-Down Emission Estimates Based on Uncertainties in Multiple Emission Inventories: A Case Study on CH4 Emissions in China. Sustainability 2019, 11, 2054. [Google Scholar] [CrossRef] [Green Version]
- Lopez-Aparicio, S.; Guevara, M.; Thunis, P.; Cuvelier, K.; Tarrason, L. Assessment of Discrepancies between Bottom-up and Regional Emission Inventories in Norwegian Urban Areas. Atmos. Environ. 2017, 154, 285–296. [Google Scholar] [CrossRef]
- Johnson, T.; Joshi, A. Review of Vehicle Engine Efficiency and Emissions. SAE Int. J. Engines 2018, 11, 1307–1330. [Google Scholar] [CrossRef]
- Streimikiene, D.; Baležentis, T.; Baležentienė, L. Comparative Assessment of Road Transport Technologies. Renew. Sustain. Energy Rev. 2013, 20, 611–618. [Google Scholar] [CrossRef]
- Zeiner, M.; Landgraf, M.; Knabl, D.; Antony, B.; Barrena Cárdenas, V.; Koczwara, C. Assessment and Recommendations for a Fossil Free Future for Track Work Machinery. Sustainability 2021, 13, 11444. [Google Scholar] [CrossRef]
- Örtl, E. Aktualisierung der Modelle TREMOD/TREMOD-MM für die Emissionsberichterstattung 2020 (Berichtsperiode 1990–2018); Umweltbundesamt: Dessau-Roßlau, Germany, 2020.
- Gniffke, P. National Inventory Report for the German Greenhouse Gas Inventory 1990–2018; Umweltbundesamt: Dessau-Roßlau, Germany, 2020; p. 997.
- VTT Technical Research Centre of Finland TYKO Calculation Model for Working Machines. Available online: http://lipasto.vtt.fi/en/tyko/index.htm (accessed on 28 March 2020).
- VTT Technical Research Centre of Finland LIISA Calculation Model for Road Traffic. Available online: http://lipasto.vtt.fi/en/liisa/all.htm (accessed on 14 April 2020).
- Statistics Netherlands Emissions in the Netherlands by Mobile Sources. Available online: https://opendata.cbs.nl/statline/portal.html?_la=en&_catalog=CBS&tableId=84735ENG&_theme=1128 (accessed on 24 April 2021).
- Frey, H.C.; Rasdorf, W.; Lewis, P. Comprehensive Field Study of Fuel Use and Emissions of Nonroad Diesel Construction Equipment. Transp. Res. Rec. 2010, 2158, 69–76. [Google Scholar] [CrossRef]
- Wen, Q.; Chen, Y.; Hong, J.; Chen, Y.; Ni, D.; Shen, Q. Spillover Effect of Technological Innovation on CO2 Emissions in China’s Construction Industry. Build. Environ. 2020, 171, 106653. [Google Scholar] [CrossRef]
- Ruyssenaars, P.; Coenen, P.; Rienstra, J.; Zijlema, P.; Arets, E.; Baas, K.; Dröge, R.; Geilenkirchen, G.; ’t Hoen, M.; Honig, E.; et al. Greenhouse Gas Emissions in the Netherlands 1990–2019; Rijksinstituut voor Volksgezondheid en Milieu: Utrecht, The Netherlands, 2021. [Google Scholar]
- VTT Technical Research Centre of Finland. TYKO Method Description; VTT Technical Research Centre of Finland: Espoo, Finland, 2017. [Google Scholar]
- Jerksjö, M.; Fridell, E.; Wisell, T. Non-Road Mobile Machinery Model—Updates 2015; Swedish Environmental Research Institute: Stockholm, Sweden, 2015; p. 50. [Google Scholar]
- Al-Hanbali, H.; Genberg Safont, J.; Josefsson Ortiz, C.; Guban, P.; Eklund, V.; Kellner, M.; Yaramenka, K.; Kindbom, K.; Helbig, T.; Danielsson, H.; et al. Informative Inventory Report Sweden 2021; Swedish Environmental Protection Agency: Stockholm, Sweden, 2021; p. 331. [Google Scholar]
- Zhang, G.; Sandanayake, M.; Setunge, S.; Li, C.; Fang, J. Selection of Emission Factor Standards for Estimating Emissions from Diesel Construction Equipment in Building Construction in the Australian Context. J. Environ. Manag. 2017, 187, 527–536. [Google Scholar] [CrossRef]
- Tan, D.; Tan, J.; Peng, D.; Fu, M.; Zhang, H.; Yin, H.; Ding, Y. Study on Real-World Power-Based Emission Factors from Typical Construction Machinery. Sci. Total Environ. 2021, 799, 149436. [Google Scholar] [CrossRef]
- Frey, H. Christopher; Bammi Sachin Probabilistic Nonroad Mobile Source Emission Factors. J. Environ. Eng. 2003, 129, 162–168. [Google Scholar] [CrossRef]
- Yuan, Q. Real World Duty Cycle Development Method for Non-Road Mobile Machinery (NRMM). SAE Int. J. Commer. Veh. 2016, 9, 306–312. [Google Scholar] [CrossRef]
- Heidari, B.; Marr, L.C. Real-Time Emissions from Construction Equipment Compared with Model Predictions. J. Air Waste Manag. Assoc. 2015, 65, 115–125. [Google Scholar] [CrossRef] [Green Version]
- Barth, M.; Durbin, T.; Miller, J.W.; Russell, L.R.; Scora, G. Measuring and Modeling PM Emissions from Heavy-Duty Construction Equipment; California Department of Transportation, Division of Research and Innovation: Sacramento, CA, USA, 2012; p. 47.
- Azarmi, F.; Kumar, P.; Marsh, D.; Fuller, G. Assessment of the Long-Term Impacts of PM10 and PM2.5 Particles from Construction Works on Surrounding Areas. Environ. Sci.-Process Impacts 2016, 18, 208–221. [Google Scholar] [CrossRef] [Green Version]
- Wang, X.; Chow, J.C.; Kohl, S.D.; Percy, K.E.; Legge, A.H.; Watson, J.G. Real-World Emission Factors for Caterpillar 797B Heavy Haulers during Mining Operations. Particuology 2016, 28, 22–30. [Google Scholar] [CrossRef]
- Pirjola, L.; Ronkko, T.; Saukko, E.; Parviainen, H.; Malinen, A.; Alanen, J.; Saveljeff, H. Exhaust Emissions of Non-Road Mobile Machine: Real-World and Laboratory Studies with Diesel and HVO Fuels. Fuel 2017, 202, 154–164. [Google Scholar] [CrossRef] [Green Version]
- Merkisz, J.; Lijewski, P.; Fuc, P.; Siedlecki, M.; Ziolkowski, A. Development of the Methodology of Exhaust Emissions Measurement under RDE (Real Driving Emissions) Conditions for Non-Road Mobile Machinery (NRMM) Vehicles. In Scientific Conference on Automotive Vehicles and Combustion Engines (Konmot 2016); Mitianiec, W., Ed.; Iop Publishing Ltd.: Bristol, UK, 2016; Volume 148, p. UNSP 012077. [Google Scholar]
- Lijewski, P.; Merkisz, J.; Fuć, P.; Ziółkowski, A.; Rymaniak, Ł.; Kusiak, W. Fuel Consumption and Exhaust Emissions in the Process of Mechanized Timber Extraction and Transport. Eur. J. For. Res. 2017, 136, 153–160. [Google Scholar] [CrossRef] [Green Version]
- Sepasgozar, S.M.E.; Li, H.; Shirowzhan, S.; Tam, V.W.Y. Methods for Monitoring Construction Off-Road Vehicle Emissions: A Critical Review for Identifying Deficiencies and Directions. Environ. Sci. Pollut. Res. 2019, 26, 15779–15794. [Google Scholar] [CrossRef]


Publisher’s Note: MDPI stays neutral with regard to jurisdictional claims in published maps and institutional affiliations. |
© 2022 by the authors. Licensee MDPI, Basel, Switzerland. This article is an open access article distributed under the terms and conditions of the Creative Commons Attribution (CC BY) license (https://creativecommons.org/licenses/by/4.0/).