
Priority Soil Pollution Management of Contaminated Site Based on Human Health Risk Assessment: A Case Study in Southwest China


Abstract
:1. Introduction
2. Materials and Methods
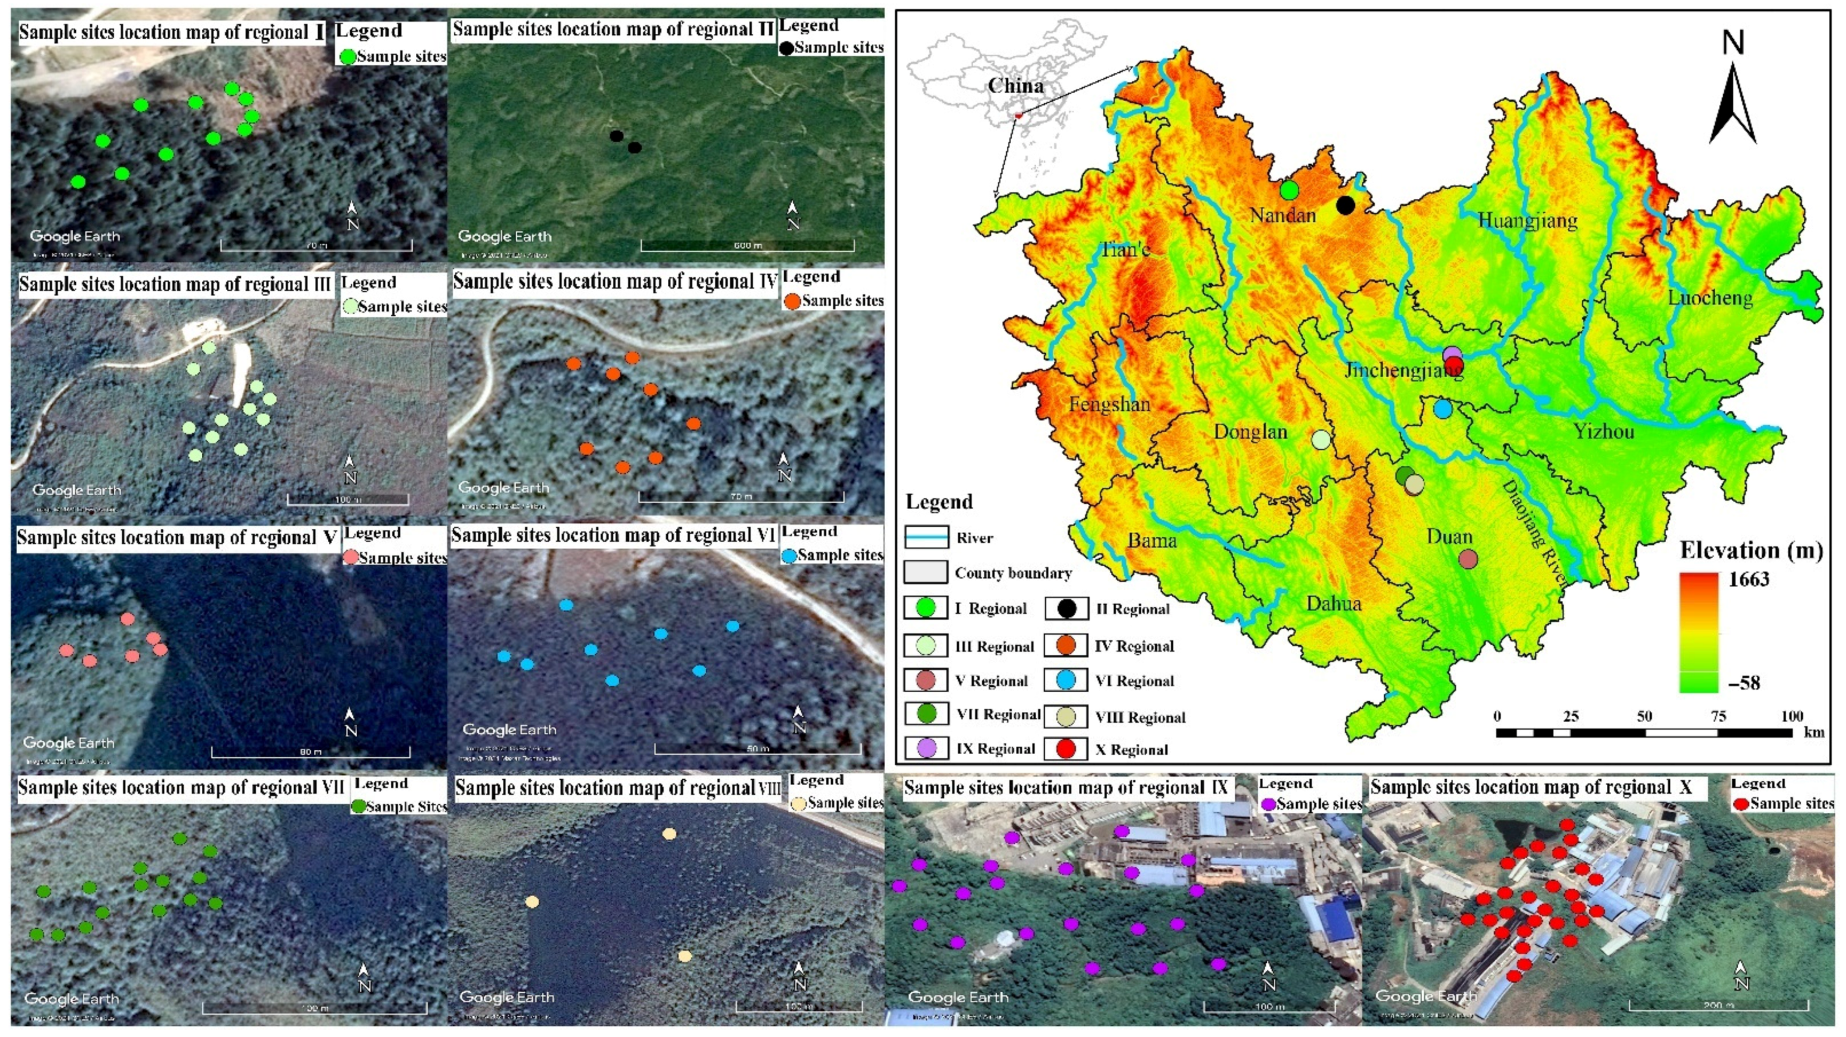
2.1. Study Area
2.2. Sample Collection and Analysis
2.3. Health Risk Assessment Model

| Parameter | Symbol | Units | Value |
|---|---|---|---|
| Body weight | BW | kg | 70 (adults); 15 (children) |
| Average time | AT | d | ED × 365 (noncarcinogenic), 25,550 (carcinogenic) |
| Exposure frequency | EF | d/y | 350 |
| Exposure duration | ED | y | 24 (adults), 6 (children) |
| Soil ingestion rate | IngR | mg/d | 100 (adults), 200 (children) |
| Conversion factor | CF | kg/mg | 1 × 10⁻⁶ |
| Surface area | SA | cm2/d | 5700 (adults), 2800 (children) |
| Adherence factor to skin | AFsoil | mg cm2 | 0.5 (trace metals), 0.2 (organic compounds) |
| Dermal absorption factor | ABS | Unitless | 0.03 (As), 0.001 (trace metals except As) |
| Gastrointestinal absorption factor | ABSGI | Unitless | 0.025 (Cd),1.0 (As), 1.0 (Cu), 1.0 (Pb), 0.025 (Cr), 1.0 (Zn), 0.07 (Hg) |
| Particle emission factor | PEF | m3/kg | 1.36 × 10⁹ |
| Ingestion reference value | Oral RfD | mg/kg d | 3.00 × 10⁻⁴ (As), 1.00 × 10⁻³ (Cd), 3.00 × 10⁻³ (Cr), 4.00 × 10⁻² (Cu), 3.00 × 10⁻⁴ (Hg), 3.5 × 10⁻³ (Pb), 3.00 × 10⁻¹ (Zn) |
| Dermal reference value | Dermal RfD | mg/kg d | 3.00 × 10⁻⁴ (As), 2.50 × 10⁻⁵ (Cd), 7.50 × 10⁻⁵ (Cr), 4.00 × 10⁻² (Cu), 2.10 × 10⁻⁵ (Hg), 3.50 × 10⁻³ (Pb), 3.00 × 10⁻¹ (Zn) |
| Inhalation reference value | Inhal RfD | mg/m3 | 1.50 × 10⁻⁵ (As), 1.00 × 10⁻⁵ (Cd), 1.00 × 10⁻⁴ (Cr), 4.02 × 10⁻² (Cu), 3.00 × 10⁻⁴ (Hg), 3.25 × 10⁻³ (Pb), 3.00 × 10⁻¹ (Zn) |
| Oral slope factor | SFO | (mg kg−1 d−1)−1 | 1.5 (As), ** (Cd), 5.0 (Cr), ** (Cu), ** (Hg), 8.50 × 10⁻³ (Pb), ** (Zn) |
| Dermal contact factor | SFO×ABSGI | (mg kg−1 d−1)−1 | 1.5 (As), ** (Cd), 2.0 (Cr), ** (Cu), ** (Hg), 8.50 × 10⁻³ (Pb), ** (Zn) |
| Inhalation unit risk | IUR | (mg/m−3)−1 | 4.3 × 10⁻³ (As), 1.80 × 10⁻³ (Cd), 8.40 × 10⁻² (Cr), ** (Cu), ** (Hg), 1.2 × 10⁻⁵ (Pb), ** (Zn) |
2.4. Development of Site-Specific Risk-Based Remedial Levels (RBRLs)
2.5. Special Case: Lead
3. Results and Discussion
3.1. Descriptive Statistics of Soil Heavy Metals
3.2. Human Health Risk Assessment
3.2.1. Noncarcinogenic Risk
3.2.2. Cancer Risk
3.3. Remedial Analysis of Site-Specific Risks
3.4. Priority Control Regions and Recommendations
4. Conclusions
Author Contributions
Funding
Institutional Review Board Statement
Informed Consent Statement
Data Availability Statement
Acknowledgments
Conflicts of Interest
Appendix A
| Region | Concentration | Cd | As | Cu | Pb | Cr | Zn | Hg |
|---|---|---|---|---|---|---|---|---|
| I | CV | 1.07 | 1.23 | 1.14 | 3.13 | 0.88 | 1.27 | 0.746 |
| Over Cg | 13.2 | 0.617 | 0.131 | 0.336 | 0.0005 | 0.348 | 0.0008 | |
| Over Cc | 2.11 | 0.567 | 0.120 | 0.243 | 0.0005 | 0.492 | 0.0010 | |
| II | CV | 0.527 | 0.935 | 0.929 | 0 | 0.538 | 0.277 | 0 |
| Over Cg | 0.409 | 0.053 | 0.015 | 0.003 | 0.0003 | 0.011 | 0.029 | |
| Over Cc | 0.066 | 0.048 | 0.014 | 0.002 | 0.0003 | 0.015 | 0.036 | |
| III | CV | 1.11 | 1.81 | - | 0.641 | - | 0.952 | 1.12 |
| Over Cg | 179 | 86.9 | - | 1.62 | - | 4.11 | 18.8 | |
| Over Cc | 28.7 | 79.9 | - | 1.17 | - | 5.81 | 23.4 | |
| IV | CV | 2.12 | 1.11 | - | 0.452 | - | 0.468 | 16.3 |
| Over Cg | 840 | 125 | - | 6.06 | - | 21.2 | 19.2 | |
| Over Cc | 134 | 115 | - | 4.38 | - | 30.1 | 23.9 | |
| V | CV | 1.27 | 1.29 | 1.18 | 1.66 | - | 1.20 | - |
| Over Cg | 922 | 925 | 11.6 | 22.6 | - | 34.8 | - | |
| Over Cc | 148 | 850 | 10.7 | 16.4 | - | 49.2 | - | |
| VI | CV | 0.525 | 2.14 | - | 1.25 | - | 0.514 | 1.03 |
| Over Cg | 757 | 2402 | - | 5.33 | - | 8.43 | 51.4 | |
| Over Cc | 121 | 2209 | - | 3.86 | - | 11.9 | 63.9 | |
| VII | CV | 0.839 | 1.17 | - | 0.603 | - | 0.633 | 1.52 |
| Over Cg | 34.9 | 29.5 | - | 1.06 | - | 1.36 | 29.4 | |
| Over Cc | 5.58 | 27.1 | - | 0.764 | - | 1.92 | 36.5 | |
| VIII | CV | 0.596 | 0.825 | - | 0.060 | - | 0.344 | 0.373 |
| Over Cg | 3.17 | 1.46 | - | 2.45 | - | 1.15 | 2.71 | |
| Over Cc | 0.507 | 1.34 | - | 1.77 | - | 1.63 | 3.36 | |
| IX | CV | 1.59 | 0.502 | 1.53 | 2.21 | 0.385 | 0.788 | 0.710 |
| Over Cg | 75 | 3.32 | 1.74 | 11.5 | 1.58 | 3.54 | 4.25 | |
| Over Cc | 12 | 3.05 | 1.599 | 8.32 | 1.52 | 5.01 | 5.29 | |
| X | CV | 2.22 | 1.35 | 1.16 | 3.32 | 0.606 | 1.32 | 1.97 |
| Over Cg | 356 | 7.26 | 4.06 | 24.0 | 0.807 | 3.78 | 6.62 | |
| Over Cc | 56.9 | 6.67 | 3.73 | 17.3 | 0.778 | 5.35 | 8.22 |
| Region I | Adults | Children | ||||||||||||||
|---|---|---|---|---|---|---|---|---|---|---|---|---|---|---|---|---|
| Noncancer Risk (Unitless) | Cancer Risk (Unitless) | Noncancer Risk (Unitless) | Cancer Risk (Unitless) | |||||||||||||
| Element | HIoral | HIdermal | HIinhalation | THI | CRoral | CRdermal | CRinhalation | TCR | HIoral | HIdermal | HIinhalation | THI | CRoral | CRdermal | CRinhalation | TCR |
| Cd | 3.29 × 10⁻⁴ | 2.88 × 10⁻⁴ | 1.48 × 10⁻⁵ | 6.32 × 10⁻⁴ | NA | NA | 9.16 × 10⁻¹⁴ | 9.16 × 10⁻¹⁴ | 7.53 × 10⁻³ | 2.69 × 10⁻³ | 1.48 × 10⁻⁵ | 1.02 × 10⁻² | NA | NA | 2.29 × 10⁻¹⁴ | 2.29 × 10⁻¹⁴ |
| As | 2.90 × 10⁻² | 2.48 × 10⁻² | 2.99 × 10⁻⁴ | 5.41 × 10⁻² | 4.48 × 10⁻⁶ | 3.83 × 10⁻⁶ | 6.61 × 10⁻¹² | 8.31 × 10⁻⁶ | 9.48 × 10⁻¹ | 2.71 × 10⁻¹ | 2.99 × 10⁻⁴ | 1.22 × 10 | 1.04 × 10⁻⁵ | 7.31 × 10⁻⁸ | 1.65 × 10⁻¹² | 1.05 × 10⁻⁵ |
| Cu | 9.28 × 10⁻⁵ | 2.65 × 10⁻⁶ | 4.75 × 10⁻⁸ | 9.55 × 10⁻⁵ | NA | NA | NA | NA | 8.66× 10⁻⁴ | 6.07 × 10⁻⁵ | 4.75 × 10⁻⁸ | 9.27 × 10⁻⁴ | NA | NA | NA | NA |
| Pb | 2.47 × 10⁻³ | 7.05 × 10⁻⁵ | 1.37 × 10⁻⁶ | 2.55 × 10⁻³ | 2.52 × 10⁻⁸ | NA | 1.83 × 10⁻¹⁴ | 2.52 × 10⁻⁸ | 2.31 × 10⁻² | 1.62 × 10⁻³ | 1.37 × 10⁻⁶ | 2.47 × 10⁻² | 5.89 × 10⁻⁸ | 4.12 × 10⁻¹⁰ | 4.58 × 10⁻¹⁵ | 5.93 × 10⁻⁸ |
| Cr | 1.45 × 10⁻⁵ | 1.27 × 10⁻⁵ | 1.96 × 10⁻⁷ | 2.74 × 10⁻⁵ | 6.54 × 10⁻⁹ | NA | 5.66 × 10⁻¹³ | 6.54 × 10⁻⁹ | 3.32 × 10⁻⁴ | 1.19 × 10⁻⁴ | 1.96 × 10⁻⁷ | 4.51 × 10⁻⁴ | 1.53 × 10⁻⁸ | 4.27 × 10⁻⁹ | 1.41 × 10⁻¹³ | 1.95 × 10⁻⁸ |
| Zn | 7.37 × 10⁻⁵ | 2.10 × 10⁻⁶ | 3.79 × 10⁻⁸ | 7.58 × 10⁻⁵ | NA | NA | NA | NA | 6.88 × 10⁻⁴ | 4.82 × 10⁻⁵ | 3.79 × 10⁻⁸ | 7.36 × 10⁻⁴ | NA | NA | NA | NA |
| Hg | 3.15 × 10⁻⁷ | 1.28 × 10⁻⁷ | 1.62 × 10⁻¹⁰ | 4.44 × 10⁻⁷ | NA | NA | NA | NA | 2.94 × 10⁻⁶ | 2.94 × 10⁻⁶ | 1.62 × 10⁻¹⁰ | 5.89 × 10⁻⁶ | NA | NA | NA | NA |
| Total | 3.20 × 10⁻² | 2.52 × 10⁻² | 3.15 × 10⁻⁴ | 5.75 × 10⁻² | 4.51 × 10⁻⁶ | 3.83 × 10⁻⁶ | 7.28 × 10⁻¹² | 8.34 × 10⁻⁶ | 9.80 × 10⁻¹ | 2.75 × 10⁻¹ | 3.15 × 10⁻⁴ | 1.26 × 10 | 1.05 × 10⁻⁵ | 7.78 × 10⁻⁸ | 1.82 × 10⁻¹² | 1.06 × 10⁻⁵ |
| Region II | ||||||||||||||||
| Cd | 1.02 × 10⁻⁵ | 8.97 × 10⁻⁶ | 4.62 × 10⁻⁷ | 1.97 × 10⁻⁵ | NA | NA | 2.85 × 10⁻¹⁵ | 2.85 × 10⁻¹⁵ | 2.34 × 10⁻⁴ | 8.37 × 10⁻⁵ | 4.62 × 10⁻⁷ | 3.19 × 10⁻⁴ | NA | NA | 7.13 × 10⁻¹⁶ | 7.13 × 10⁻¹⁶ |
| As | 2.48 × 10⁻³ | 2.12 × 10⁻³ | 2.55 × 10⁻⁵ | 4.62 × 10⁻³ | 3.82 × 10⁻⁷ | 3.27 × 10⁻⁷ | 5.64 × 10⁻¹³ | 7.09 × 10⁻⁷ | 8.09 × 10⁻² | 2.31 × 10⁻² | 2.55 × 10⁻⁵ | 1.04 × 10⁻¹ | 8.92 × 10⁻⁷ | 6.24 × 10⁻⁹ | 1.41 × 10⁻¹³ | 8.98 × 10⁻⁷ |
| Cu | 1.08 × 10⁻⁵ | 3.08 × 10⁻⁷ | 5.54 × 10⁻⁹ | 1.11 × 10⁻⁵ | NA | NA | NA | NA | 1.01 × 10⁻⁴ | 7.06 × 10⁻⁶ | 5.54 × 10⁻⁹ | 1.08 × 10⁻⁴ | NA | NA | NA | NA |
| Pb | 1.92 × 10⁻⁵ | 5.47 × 10⁻⁷ | 1.06 × 10⁻⁸ | 1.97 × 10⁻⁵ | 1.96 × 10⁻¹⁰ | NA | 1.42 × 10⁻¹⁶ | 1.96 × 10⁻¹⁰ | 1.79 × 10⁻⁴ | 1.25 × 10⁻⁵ | 1.06 × 10⁻⁸ | 1.92 × 10⁻⁴ | 4.56 × 10⁻¹⁰ | 3.20 × 10⁻¹² | 3.55 × 10⁻¹⁷ | 4.60 × 10⁻¹⁰ |
| Cr | 1.02 × 10⁻⁵ | 8.90 × 10⁻⁶ | 1.37 × 10⁻⁷ | 1.92 × 10⁻⁵ | 4.58 × 10⁻⁹ | NA | 3.96 × 10⁻¹³ | 4.58 × 10⁻⁹ | 2.33 × 10⁻⁴ | 8.31 × 10⁻⁵ | 1.37 × 10⁻⁷ | 3.16 × 10⁻⁴ | 1.07 × 10⁻⁸ | 2.99 × 10⁻⁹ | 9.90 × 10⁻¹⁴ | 1.37 × 10⁻⁸ |
| Zn | 2.28 × 10⁻⁶ | 6.50 × 10⁻⁸ | 1.17 × 10⁻⁹ | 2.35 × 10⁻⁶ | NA | NA | NA | NA | 2.13 × 10⁻⁵ | 1.49 × 10⁻⁶ | 1.17 × 10⁻⁹ | 2.28 × 10⁻⁵ | NA | NA | NA | NA |
| Hg | 1.14 × 10⁻⁵ | 4.65 × 10⁻⁶ | 5.88 × 10⁻⁹ | 1.61 × 10⁻⁵ | NA | NA | NA | NA | 1.07 × 10⁻⁴ | 1.07 × 10⁻⁴ | 5.88 × 10⁻⁹ | 2.13 × 10⁻⁴ | NA | NA | NA | NA |
| Total | 2.54 × 10⁻³ | 2.14 × 10⁻³ | 2.61 × 10⁻⁵ | 4.71 × 10⁻³ | 3.87 × 10⁻⁷ | 3.27 × 10⁻⁷ | 9.63 × 10⁻¹³ | 7.14 × 10⁻⁷ | 8.18 × 10⁻² | 2.34 × 10⁻² | 2.61 × 10⁻⁵ | 1.05 × 10⁻¹ | 9.03 × 10⁻⁷ | 9.24 × 10⁻⁹ | 2.41 × 10⁻¹³ | 9.12 × 10⁻⁷ |
| Region III | ||||||||||||||||
| Cd | 4.48 × 10⁻³ | 3.93 × 10⁻³ | 2.02 × 10⁻⁴ | 8.60 × 10⁻³ | NA | NA | 1.25 × 10⁻¹² | 1.25 × 10⁻¹² | 1.03 × 10⁻¹ | 3.66 × 10⁻² | 2.02 × 10⁻⁴ | 1.39 × 10⁻¹ | NA | NA | 3.12 × 10⁻¹³ | 3.12 × 10⁻¹³ |
| As | 4.09E × 10 | 3.50E × 10 | 4.21 × 10⁻² | 7.63E × 10 | 6.31 × 10⁻⁴ | 5.40 × 10⁻⁴ | 9.31 × 10⁻¹⁰ | 1.17 × 10⁻³ | 1.34E × 102 | 3.82E × 101 | 4.21 × 10⁻² | 1.72E × 102 | 1.47 × 10⁻³ | 1.03 × 10⁻⁵ | 2.33 × 10⁻¹⁰ | 1.48 × 10⁻³ |
| Cu | NA | NA | NA | NA | NA | NA | NA | NA | NA | NA | NA | NA | NA | NA | NA | NA |
| Pb | 1.19 × 10⁻² | 3.39 × 10⁻⁴ | 6.60 × 10⁻⁶ | 1.22 × 10⁻² | 1.21 × 10⁻⁷ | NA | 8.82 × 10⁻¹⁴ | 1.21 × 10⁻⁷ | 1.11E× 10−1 | 7.78 × 10⁻³ | 6.60 × 10⁻⁶ | 1.19 × 10⁻¹ | 2.83 × 10⁻⁷ | 1.98 × 10⁻⁹ | 2.21 × 10⁻¹⁴ | 2.85 × 10⁻⁷ |
| Cr | NA | NA | NA | NA | NA | NA | NA | NA | NA | NA | NA | NA | NA | NA | NA | NA |
| Zn | 8.70 × 10⁻⁴ | 2.48 × 10⁻⁵ | 4.48 × 10⁻⁷ | 8.95 × 10⁻⁴ | NA | NA | NA | NA | 8.12 × 10⁻³ | 5.68 × 10⁻⁴ | 4.48 × 10⁻⁷ | 8.69 × 10⁻³ | NA | NA | NA | NA |
| Hg | 7.49 × 10⁻³ | 3.05 × 10⁻³ | 3.85 × 10⁻⁶ | 1.05 × 10⁻² | NA | NA | NA | NA | 6.99 × 10⁻² | 6.99 × 10⁻² | 3.85 × 10⁻⁶ | 1.40 × 10⁻¹ | NA | NA | NA | NA |
| Total | 4.12E × 10 | 3.51× 10 | 4.23 × 10⁻² | 7.66 × 10 | 6.31 × 10⁻⁴ | 5.40 × 10⁻⁴ | 9.33 × 10⁻¹⁰ | 1.17 × 10⁻³ | 1.34 × 10² | 3.83 × 101 | 4.23 × 10⁻² | 1.72 × 10² | 1.47 × 10⁻³ | 1.03 × 10⁻⁵ | 2.33 × 10⁻¹⁰ | 1.48 × 10⁻³ |
| Region VI | ||||||||||||||||
| Cd | 2.10 × 10⁻² | 1.84 × 10⁻² | 9.47 × 10⁻⁴ | 4.03 × 10⁻² | NA | NA | 5.85 × 10⁻¹² | 5.85 × 10⁻¹² | 4.81 × 10⁻¹ | 1.72 × 10⁻¹ | 9.47 × 10⁻⁴ | 6.54 × 10⁻¹ | NA | NA | 1.46 × 10⁻¹² | 1.46 × 10⁻¹² |
| As | 5.89 × 10 | 5.03 × 10 | 6.06 × 10⁻² | 1.10E × 101 | 9.09 × 10⁻⁴ | 7.77 × 10⁻⁴ | 1.34 × 10⁻⁹ | 1.69 × 10⁻³ | 1.92 × 10² | 5.50 × 101 | 6.06 × 10⁻² | 2.47 × 10² | 2.12 × 10⁻³ | 1.48 × 10⁻⁵ | 3.35 × 10⁻¹⁰ | 2.13 × 10⁻³ |
| Cu | NA | NA | NA | NA | NA | NA | NA | NA | NA | NA | NA | NA | NA | NA | NA | NA |
| Pb | 4.46 × 10⁻² | 1.27 × 10⁻³ | 2.47 × 10⁻⁵ | 4.59 × 10⁻² | 4.55 × 10⁻⁷ | NA | 3.31 × 10⁻¹³ | 4.55 × 10⁻⁷ | 4.16 × 10⁻¹ | 2.91 × 10⁻² | 2.47 × 10⁻⁵ | 4.46 × 10⁻¹ | 1.06 × 10⁻⁶ | 7.43 × 10⁻⁹ | 8.27 × 10⁻¹⁴ | 1.07 × 10⁻⁶ |
| Cr | NA | NA | NA | NA | NA | NA | NA | NA | NA | NA | NA | NA | NA | NA | NA | NA |
| Zn | 4.50 × 10⁻³ | 1.28 × 10⁻⁴ | 2.31 × 10⁻⁶ | 4.63 × 10⁻³ | NA | NA | NA | NA | 4.20 × 10⁻² | 2.94 × 10⁻³ | 2.31 × 10⁻⁶ | 4.49 × 10⁻² | NA | NA | NA | NA |
| Hg | 7.62 × 10⁻³ | 3.10 × 10⁻³ | 3.92 × 10⁻⁶ | 1.07 × 10⁻² | NA | NA | NA | NA | 7.12 × 10⁻² | 7.12 × 10⁻² | 3.92 × 10⁻⁶ | 1.42 × 10⁻¹ | NA | NA | NA | NA |
| Total | 5.97 × 10 | 5.06 × 10 | 6.16 × 10⁻² | 1.11 × 101 | 9.09 × 10⁻⁴ | 7.77 × 10⁻⁴ | 1.35 × 10⁻⁹ | 1.69 × 10⁻³ | 1.93E × 102 | 5.52 × 101 | 6.16 × 10⁻² | 2.49 × 10² | 2.12 × 10⁻³ | 1.48 × 10⁻⁵ | 3.37 × 10⁻¹⁰ | 2.14 × 10⁻³ |
| Region V | ||||||||||||||||
| Cd | 2.30 × 10⁻² | 2.02 × 10⁻² | 1.04 × 10⁻³ | 4.43 × 10⁻² | NA | NA | 6.42 × 10⁻¹² | 6.42 × 10⁻¹² | 5.28 × 10⁻¹ | 1.89 × 10⁻¹ | 1.04 × 10⁻³ | 7.18 × 10⁻¹ | NA | NA | 1.61 × 10⁻¹² | 1.61 × 10⁻¹² |
| As | 4.35 × 101 | 3.72 × 101 | 4.48 × 10⁻¹ | 8.11 × 101 | 6.71 × 10⁻³ | 5.74 × 10⁻³ | 9.90 × 10⁻⁹ | 1.24 × 10⁻² | 1.42 × 10³ | 4.06 × 10² | 4.48 × 10⁻¹ | 1.83 × 10³ | 1.57 × 10⁻² | 1.10 × 10⁻⁴ | 2.48 × 10⁻⁹ | 1.58 × 10⁻² |
| Cu | 8.26 × 10⁻³ | 2.35 × 10⁻⁴ | 4.23 × 10⁻⁶ | 8.50 × 10⁻³ | NA | NA | NA | NA | 7.71 × 10⁻² | 5.40 × 10⁻³ | 4.23 × 10⁻⁶ | 8.25 × 10⁻² | NA | NA | NA | NA |
| Pb | 1.67 × 10⁻¹ | 4.75 × 10⁻³ | 9.23 × 10⁻⁵ | 1.71 × 10⁻¹ | 1.70 × 10⁻⁶ | NA | 1.23 × 10⁻¹² | 1.70 × 10⁻⁶ | 1.55 × 10 | 1.09 × 10⁻¹ | 9.23 × 10⁻⁵ | 1.66 × 10 | 3.96 × 10⁻⁶ | 2.77 × 10⁻⁸ | 3.09 × 10⁻¹³ | 3.99 × 10⁻⁶ |
| Cr | NA | NA | NA | NA | NA | NA | NA | NA | NA | NA | NA | NA | NA | NA | NA | NA |
| Zn | 7.38 × 10⁻³ | 2.10 × 10⁻⁴ | 3.80 × 10⁻⁶ | 7.59 × 10⁻³ | NA | NA | NA | NA | 6.88 × 10⁻² | 4.82 × 10⁻³ | 3.80 × 10⁻⁶ | 7.37 × 10⁻² | NA | NA | NA | NA |
| Hg | NA | NA | NA | NA | NA | NA | NA | NA | NA | NA | NA | NA | NA | NA | NA | NA |
| Total | 4.37 × 101 | 3.72 × 101 | 4.49 × 10⁻¹ | 8.14 × 101 | 6.71 × 10⁻³ | 5.74 × 10⁻³ | 9.91 × 10⁻⁹ | 1.24 × 10⁻² | 1.42 × 10³ | 4.06 × 10² | 4.49 × 10⁻¹ | 1.83 × 10³ | 1.57 × 10⁻⁶ | 1.10 × 10⁻⁴ | 2.48 × 10⁻⁹ | 1.58 × 10⁻² |
| Region VI | ||||||||||||||||
| Cd | 1.89 × 10⁻² | 1.66 × 10⁻² | 8.54 × 10⁻⁴ | 3.64 × 10⁻² | NA | NA | 5.27 × 10⁻¹² | 5.27 × 10⁻¹² | 4.34 × 10⁻¹ | 1.55 × 10⁻¹ | 8.54 × 10⁻⁴ | 5.89 × 10⁻¹ | NA | NA | 1.32 × 10⁻¹² | 1.32 × 10⁻¹² |
| As | 1.13 × 10² | 9.66 × 101 | 1.16E × 10 | 2.11 × 10² | 1.74 × 10⁻² | 1.49 × 10⁻² | 2.57 × 10⁻⁸ | 3.23 × 10⁻² | 3.69 × 10³ | 1.05 × 10³ | 1.16 × 10 | 4.74 × 10³ | 4.07 × 10⁻² | 2.85 × 10⁻⁴ | 6.43 × 10⁻⁹ | 4.09 × 10⁻² |
| Cu | NA | NA | NA | NA | NA | NA | NA | NA | NA | NA | NA | NA | NA | NA | NA | NA |
| Pb | 3.92 × 10⁻² | 1.12 × 10⁻³ | 2.17 × 10⁻⁵ | 4.04 × 10⁻² | 4.00 × 10⁻⁷ | NA | 2.91 × 10⁻¹³ | 4.00 × 10⁻⁷ | 3.66 × 10⁻¹ | 2.56 × 10⁻² | 2.17 × 10⁻⁵ | 3.92 × 10⁻¹ | 9.34 × 10⁻⁷ | 6.54 × 10⁻⁹ | 7.27 × 10⁻¹⁴ | 9.40 × 10⁻⁷ |
| Cr | NA | NA | NA | NA | NA | NA | NA | NA | NA | NA | NA | NA | NA | NA | NA | NA |
| Zn | 1.79 × 10⁻³ | 5.09 × 10⁻⁵ | 9.19 × 10⁻⁷ | 1.84 × 10⁻³ | NA | NA | NA | NA | 1.67 × 10⁻² | 1.17 × 10⁻³ | 9.19 × 10⁻⁷ | 1.78 × 10⁻² | NA | NA | NA | NA |
| Hg | 2.04 × 10⁻² | 8.32 × 10⁻³ | 1.05 × 10⁻⁵ | 2.88 × 10⁻² | NA | NA | NA | NA | 1.91 × 10⁻¹ | 1.91 × 10⁻¹ | 1.05 × 10⁻⁵ | 3.82 × 10⁻¹ | NA | NA | NA | NA |
| Total | 1.13 × 10² | 9.66 × 101 | 1.16 × 10 | 2.11× 10² | 1.74 × 10⁻² | 1.49 × 10⁻² | 2.57 × 10⁻⁸ | 3.23 × 10⁻² | 3.69 × 10³ | 1.05 × 10³ | 1.16 × 10 | 4.75 × 10³ | 4.07 × 10⁻² | 2.85 × 10⁻⁴ | 6.43 × 10⁻⁹ | 4.09 × 10⁻² |
| Region VII | ||||||||||||||||
| Cd | 7.75 × 10⁻⁴ | 7.64 × 10⁻⁴ | 3.93 × 10⁻⁵ | 1.58 × 10⁻³ | NA | NA | 2.43 × 10⁻¹³ | 2.43 × 10⁻¹³ | 1.78 × 10⁻² | 7.13 × 10⁻³ | 3.93 × 10⁻⁵ | 2.49 × 10⁻² | NA | NA | 6.07 × 10⁻¹⁴ | 6.07 × 10⁻¹⁴ |
| As | 1.39 × 10 | 4.40 × 10⁻¹ | 1.43 × 10⁻² | 1.84E × 10 | 2.14 × 10⁻⁴ | 6.79 × 10⁻⁵ | 3.15 × 10⁻¹⁰ | 2.82 × 10⁻⁴ | 1.68 × 101 | 1.29 × 101 | 1.43 × 10⁻² | 2.98 × 101 | 4.99 × 10⁻⁴ | 1.30 × 10⁻⁶ | 7.88 × 10⁻¹¹ | 5.00 × 10⁻⁴ |
| Cu | NA | NA | NA | NA | NA | NA | NA | NA | NA | NA | NA | NA | NA | NA | NA | NA |
| Pb | 3.63 × 10⁻³ | 8.56 × 10⁻⁵ | 2.01 × 10⁻⁶ | 3.71 × 10⁻³ | 3.70 × 10⁻⁸ | NA | 2.69 × 10⁻¹⁴ | 3.70 × 10⁻⁸ | 3.38 × 10⁻² | 1.96 × 10⁻³ | 2.01 × 10⁻⁶ | 3.58 × 10⁻² | 8.63 × 10⁻⁸ | 5.01 × 10⁻¹⁰ | 6.72 × 10⁻¹⁵ | 8.68 × 10⁻⁸ |
| Cr | NA | NA | NA | NA | NA | NA | NA | NA | NA | NA | NA | NA | NA | NA | NA | NA |
| Zn | 2.87 × 10⁻⁴ | 8.03 × 10⁻⁶ | 1.48 × 10⁻⁷ | 2.95 × 10⁻⁴ | NA | NA | NA | NA | 2.68 × 10⁻³ | 1.84 × 10⁻⁴ | 1.48 × 10⁻⁷ | 2.87 × 10⁻³ | NA | NA | NA | NA |
| Hg | 1.17 × 10⁻² | 3.88 × 10⁻³ | 6.01 × 10⁻⁶ | 1.55 × 10⁻² | NA | NA | NA | NA | 1.09 × 10⁻¹ | 8.88 × 10⁻² | 6.01 × 10⁻⁶ | 1.98 × 10⁻¹ | NA | NA | NA | NA |
| Total | 1.40 × 10 | 4.45 × 10⁻¹ | 1.43 × 10⁻² | 1.86 × 10 | 2.14 × 10⁻⁴ | 6.79 × 10⁻⁵ | 3.16 × 10⁻¹⁰ | 2.82 × 10⁻⁴ | 1.70 × 101 | 1.30 × 101 | 1.43 × 10⁻² | 3.00 × 101 | 4.99 × 10⁻⁴ | 1.30 × 10⁻⁶ | 7.89 × 10⁻¹¹ | 5.00 × 10⁻⁴ |
| Region VIII | ||||||||||||||||
| Cd | 3.78 × 10⁻⁴ | 6.94 × 10⁻⁵ | 3.57 × 10⁻⁶ | 4.51 × 10⁻⁴ | NA | NA | 2.20 × 10⁻¹⁴ | 2.20 × 10⁻¹⁴ | 6.48 × 10⁻⁴ | 8.67 × 10⁻³ | 3.57 × 10⁻⁶ | 9.32 × 10⁻³ | NA | NA | 5.51 × 10⁻¹⁵ | 5.51 × 10⁻¹⁵ |
| As | 2.89 × 10⁻¹ | 6.87 × 10⁻² | 7.07 × 10⁻⁴ | 3.58 × 10⁻¹ | 1.06 × 10⁻⁵ | 4.46 × 10⁻⁵ | 1.56 × 10⁻¹¹ | 5.52 × 10⁻⁵ | 6.41 × 10⁻¹ | 1.10 × 101 | 7.07 × 10⁻⁴ | 1.17 × 101 | 2.47 × 10⁻⁵ | 8.52 × 10⁻⁷ | 3.91 × 10⁻¹² | 2.56 × 10⁻⁵ |
| Cu | NA | NA | NA | NA | NA | NA | NA | NA | NA | NA | NA | NA | NA | NA | NA | NA |
| Pb | 1.80 × 10⁻² | 2.89 × 10⁻⁴ | 9.98 × 10⁻⁶ | 1.83 × 10⁻² | 1.84 × 10⁻⁷ | NA | 1.33 × 10⁻¹³ | 1.84 × 10⁻⁷ | 1.68 × 10⁻¹ | 6.62 × 10⁻³ | 9.98 × 10⁻⁶ | 1.75 × 10⁻¹ | 4.28 × 10⁻⁷ | 1.69 × 10⁻⁹ | 3.34 × 10⁻¹⁴ | 4.30 × 10⁻⁷ |
| Cr | NA | NA | NA | NA | NA | NA | NA | NA | NA | NA | NA | NA | NA | NA | NA | NA |
| Zn | 2.44 × 10⁻⁴ | 6.69 × 10⁻⁶ | 1.25 × 10⁻⁷ | 2.50 × 10⁻⁴ | NA | NA | NA | NA | 2.27 × 10⁻³ | 1.53 × 10⁻⁴ | 1.25 × 10⁻⁷ | 2.43 × 10⁻³ | NA | NA | NA | NA |
| Hg | 1.07 × 10⁻³ | 1.06 × 10⁻³ | 5.52 × 10⁻⁷ | 2.13 × 10⁻³ | NA | NA | NA | NA | 1.00 × 10⁻² | 2.42 × 10⁻² | 5.52 × 10⁻⁷ | 3.42 × 10⁻² | NA | NA | NA | NA |
| Total | 3.09 × 10⁻¹ | 7.01 × 10⁻² | 7.21 × 10⁻⁴ | 3.80 × 10⁻¹ | 1.08 × 10⁻⁵ | 4.46 × 10⁻⁵ | 1.58 × 10⁻¹¹ | 5.54 × 10⁻⁵ | 8.22 × 10⁻¹ | 1.11 × 101 | 7.21 × 10⁻⁴ | 1.19 × 101 | 2.51 × 10⁻⁵ | 8.54 × 10⁻⁷ | 3.95 × 10⁻¹² | 2.60 × 10⁻⁵ |
| Region IX | ||||||||||||||||
| Cd | 1.87 × 10⁻³ | 1.64 × 10⁻³ | 8.46 × 10⁻⁵ | 3.60 × 10⁻³ | NA | NA | 5.22 × 10⁻¹³ | 5.22 × 10⁻¹³ | 4.30 × 10⁻² | 1.53 × 10⁻² | 8.46 × 10⁻⁵ | 5.84 × 10⁻² | NA | NA | 1.31 × 10⁻¹³ | 1.31 × 10⁻¹³ |
| As | 1.56 × 10⁻¹ | 1.33 × 10⁻¹ | 1.61 × 10⁻³ | 2.91 × 10⁻¹ | 2.41 × 10⁻⁵ | 2.06 × 10⁻⁵ | 3.55 × 10⁻¹¹ | 4.47 × 10⁻⁵ | 5.10 × 10 | 1.46 × 10 | 1.61 × 10⁻³ | 6.56 × 10 | 5.62 × 10⁻⁵ | 3.93 × 10⁻⁷ | 8.88 × 10⁻¹² | 5.66 × 10⁻⁵ |
| Cu | 1.24 × 10⁻³ | 3.53 × 10⁻⁵ | 6.34 × 10⁻⁷ | 1.27 × 10⁻³ | NA | NA | NA | NA | 1.16 × 10⁻² | 8.09 × 10⁻⁴ | 6.34 × 10⁻⁷ | 1.24 × 10⁻² | NA | NA | NA | NA |
| Pb | 8.47 × 10⁻² | 2.41 × 10⁻³ | 4.70 × 10⁻⁵ | 8.72 × 10⁻² | 8.64 × 10⁻⁷ | NA | 6.28 × 10⁻¹³ | 8.64 × 10⁻⁷ | 7.91 × 10⁻¹ | 5.53 × 10⁻² | 4.70 × 10⁻⁵ | 8.46 × 10⁻¹ | 2.02 × 10⁻⁶ | 1.41 × 10⁻⁸ | 1.57 × 10⁻¹³ | 2.03 × 10⁻⁶ |
| Cr | 4.23 × 10⁻² | 4.83 × 10⁻² | 6.54 × 10⁻⁴ | 9.13 × 10⁻² | 2.18 × 10⁻⁵ | NA | 1.88 × 10⁻⁹ | 2.18 × 10⁻⁵ | 1.11 × 10 | 3.95 × 10⁻¹ | 6.54 × 10⁻⁴ | 1.50 × 10 | 5.08 × 10⁻⁵ | 1.42 × 10⁻⁵ | 4.71 × 10⁻¹⁰ | 6.50 × 10⁻⁵ |
| Zn | 7.50 × 10⁻⁴ | 2.14 × 10⁻⁵ | 3.86 × 10⁻⁷ | 7.72 × 10⁻⁴ | NA | NA | NA | NA | 7.00 × 10⁻³ | 4.90 × 10⁻⁴ | 3.86 × 10⁻⁷ | 7.49 × 10⁻³ | NA | NA | NA | NA |
| Hg | 1.69 × 10⁻³ | 6.88 × 10⁻⁴ | 8.70 × 10⁻⁷ | 2.38 × 10⁻³ | NA | NA | NA | NA | 1.58 × 10⁻² | 1.58 × 10⁻² | 8.70 × 10⁻⁷ | 3.15 × 10⁻² | NA | NA | NA | NA |
| Total | 2.89 × 10⁻¹ | 1.86 × 10⁻¹ | 2.39 × 10⁻³ | 4.78 × 10⁻¹ | 4.67 × 10⁻⁵ | 2.06 × 10⁻⁵ | 1.92 × 10⁻⁹ | 6.73 × 10⁻⁵ | 7.07 × 10 | 1.94 × 10 | 2.39 × 10⁻³ | 9.01 × 10 | 1.09 × 10⁻⁴ | 1.46 × 10⁻⁵ | 4.80 × 10⁻¹⁰ | 1.24 × 10⁻⁴ |
| Region X | ||||||||||||||||
| Cd | 8.88 × 10⁻³ | 7.79 × 10⁻³ | 4.01 × 10⁻⁴ | 1.71 × 10⁻² | NA | NA | 2.48 × 10⁻¹² | 2.48 × 10⁻¹² | 2.04 × 10⁻¹ | 7.27 × 10⁻² | 4.01 × 10⁻⁴ | 2.77 × 10⁻¹ | NA | NA | 6.19 × 10⁻¹³ | 6.19 × 10⁻¹³ |
| As | 3.41 × 10⁻¹ | 2.92 × 10⁻¹ | 3.51 × 10⁻³ | 6.37 × 10⁻¹ | 5.26 × 10⁻⁵ | 4.50 × 10⁻⁵ | 7.77 × 10⁻¹¹ | 9.77 × 10⁻⁵ | 1.11 × 101 | 3.18 × 10 | 3.51 × 10⁻³ | 1.43 × 101 | 1.23 × 10⁻⁴ | 8.60 × 10⁻⁷ | 1.94 × 10⁻¹¹ | 1.24 × 10⁻⁴ |
| Cu | 2.89 × 10⁻³ | 8.24 × 10⁻⁵ | 1.48 × 10⁻⁶ | 2.97 × 10⁻³ | NA | NA | NA | NA | 2.70 × 10⁻² | 1.89 × 10⁻³ | 1.48 × 10⁻⁶ | 2.89 × 10⁻² | NA | NA | NA | NA |
| Pb | 1.76 × 10⁻¹ | 5.03 × 10⁻³ | 9.78 × 10⁻⁵ | 1.82 × 10⁻¹ | 1.80 × 10⁻⁶ | NA | 1.31 × 10⁻¹² | 1.80 × 10⁻⁶ | 1.65 × 10 | 1.15 × 10⁻¹ | 9.78 × 10⁻⁵ | 1.76 × 10 | 4.20 × 10⁻⁶ | 2.94 × 10⁻⁸ | 3.27 × 10⁻¹³ | 4.23 × 10⁻⁶ |
| Cr | 2.47 × 10⁻² | 2.17 × 10⁻² | 3.35 × 10⁻⁴ | 4.67 × 10⁻² | 1.11 × 10⁻⁵ | NA | 9.64 × 10⁻¹⁰ | 1.11 × 10⁻⁵ | 2.02 × 10⁻¹ | 5.66 × 10⁻¹ | 3.35 × 10⁻⁴ | 7.69 × 10⁻¹ | 2.60 × 10⁻⁵ | 7.28 × 10⁻⁶ | 2.41 × 10⁻¹⁰ | 3.33 × 10⁻⁵ |
| Zn | 8.02 × 10⁻⁴ | 2.29 × 10⁻⁵ | 4.13 × 10⁻⁷ | 8.25 × 10⁻⁴ | NA | NA | NA | NA | 7.48 × 10⁻³ | 5.24 × 10⁻⁴ | 4.13 × 10⁻⁷ | 8.01 × 10⁻³ | NA | NA | NA | NA |
| Hg | 2.63 × 10⁻³ | 1.07 × 10⁻³ | 1.35 × 10⁻⁶ | 3.70 × 10⁻³ | NA | NA | NA | NA | 2.45 × 10⁻² | 2.45 × 10⁻² | 1.35 × 10⁻⁶ | 4.91 × 10⁻² | NA | NA | NA | NA |
| Total | 5.58 × 10⁻¹ | 3.27 × 10⁻¹ | 4.35 × 10⁻³ | 8.89 × 10⁻¹ | 6.56 × 10⁻⁵ | 4.50 × 10⁻⁵ | 1.05 × 10⁻⁹ | 1.11 × 10⁻⁴ | 1.33 × 101 | 3.97 × 10 | 4.35 × 10⁻³ | 1.72 × 101 | 1.53 × 10⁻⁴ | 8.17 × 10⁻⁶ | 2.61 × 10⁻¹⁰ | 1.61 × 10⁻⁴ |
References
- Wcisło, E.; Bronder, J.; Bubak, A.; Rodríguez-Valdés, E.; Gallego, J.L.R. Human health risk assessment in restoring safe and productive use of abandoned con-taminated sites. Environ. Int. 2016, 94, 436–448. [Google Scholar] [CrossRef] [PubMed]
- Xia, Y.; Gao, T.; Liu, Y.; Wang, Z.; Liu, C.; Wu, Q.; Qi, M.; Lv, Y.; Li, F. Zinc isotope revealing zinc’s sources and transport processes in karst region. Sci. Total Environ. 2020, 724, 138191. [Google Scholar] [CrossRef]
- Chen, H.; Teng, Y.; Lu, S.; Wang, Y.; Wang, J. Contamination features and health risk of soil heavy metals in China. Sci. Total Environ. 2015, 512, 143–153. [Google Scholar] [CrossRef] [PubMed]
- Pu, W.; Sun, J.; Zhang, F.; Wen, X.; Liu, W.; Huang, C. Effects of copper mining on heavy metal contamination in a rice agrosystem in the Xiaojiang River Basin, southwest China. Acta Geochim. 2019, 38, 753–773. [Google Scholar] [CrossRef]
- Wang, Y.; Guo, G.; Zhang, D.; Lei, M. An integrated method for source apportionment of heavymetal(loid)s in agricultural soils andmodel uncertainty analysis. Environ. Pollut. 2021, 276, 116666. [Google Scholar] [CrossRef] [PubMed]
- Greenpeace; Lishui Institute of Ecology and Environment of Nanjing University (LIEEN). Problems and Countermeasures in the Development and Utilization of Polluted Urban Land in China. Report. 2019. Available online: https://www.greenpeace.org.cn/redeveloping-the-polluted-land-under-chinas-cities-problems-and-solutions-report (accessed on 10 September 2021).
- Wu, J.; Xiong, Y.; Ge, Y.; Yuan, W. A sustainability assessment-based methodology for the prioritization of contaminated site risk management options. Environ. Sci. Pollut. Res. 2021, 29, 7503–7513. [Google Scholar] [CrossRef]
- Zhang, Y.; Guo, Z.; Peng, C.; Deng, H.; Xiao, X. A questionnaire based probabilistic risk assessment (PRA) of heavy metals in urban and suburban soils under different land uses and receptor populations. Sci. Total Environ. 2021, 793, 148525. [Google Scholar] [CrossRef]
- Wang, X.; Zhang, C.; Wang, C.; Zhu, Y.; Cui, Y. Probabilistic-fuzzy risk assessment and source analysis of heavy metals in soil considering uncertainty: A case study of Jinling Reservoir in China. Ecotoxicol. Environ. Saf. 2021, 222, 112537. [Google Scholar] [CrossRef]
- State Council of the People’s Republic of China (SCC). The National Soil Pollution Prevention and Treatment Action Plan of China. 2016. Available online: http://www.gov.cn/zhengce/content/2016-05/31/content_5078377.htm (accessed on 27 August 2017). (In Chinese)
- Ministry of Environmental Protection (MEP) and Ministry of Land and Resources (MLR) of P. R. China. The National Soil Pollution Survey Bulletin; 2014. Available online: http://www.sdpc.gov.cn/fzgggz/ncjj/zhdt/201404/t20140418_607888.html (accessed on 17 April 2021). (In Chinese)
- Ministry of Environmental Protection (MEP). Announcements on the Release of Five National Environmental Protection Standards. 2014. Available online: http://www.mee.gov.cn/gkml/hbb/bgg/201402/t20140224_268193.htm (accessed on 25 January 2022). (In Chinese)
- Teng, Y.; Wu, J.; Lu, S.; Wang, Y.; Jiao, X.; Song, L. Soil and soil environmental quality monitoring in China: A review. Environ. Int. 2014, 69, 177–199. [Google Scholar] [CrossRef]
- Wu, J.; Li, J.; Teng, Y.; Chen, H.; Wang, Y. A partition computing-based positive matrix factorization (PC-PMF) approach for the source apportionment of agricultural soil heavy metal contents and associated health risks. J. Hazard. Mater. 2020, 388, 121766. [Google Scholar] [CrossRef]
- Alvarez-Guerra, M.; Viguri, J.R.; Voulvoulis, N. A multicriteria-based methodology for site prioritisation in sediment management. Environ. Int. 2009, 35, 920–930. [Google Scholar] [CrossRef] [PubMed]
- Wu, J.; Teng, Y.; Lu, S.; Wang, Y.; Jiao, X. Evaluation of soil contamination indices in a mining area of Jiangxi, China. PLoS ONE 2014, 9, e112917. [Google Scholar] [CrossRef] [PubMed]
- Li, P.; Lin, C.; Cheng, H.; Duan, X.; Lei, K. Contamination and health risks of soil heavy metals around a lead/zinc smelter in southwestern China. Ecotoxicol. Environ. Saf. 2015, 113, 391–399. [Google Scholar] [CrossRef] [PubMed]
- Teng, Y.; Li, J.; Wu, J.; Lu, S.; Wang, Y.; Chen, H. Environmental distribution and associated human health risk due to trace elements and organic compounds in soil in Jiangxi province, China. Ecotoxicol. Environ. Saf. 2015, 122, 406–416. [Google Scholar] [CrossRef]
- Wu, Q.; Leung, J.Y.S.; Geng, X.; Chen, S.; Huang, X.; Li, H.; Huang, Z.; Zhu, L.; Chen, J.; Lu, Y. Heavy metal contamination of soil and water in the vicinity of an abandoned e-waste recycling site: Implications for dissemination of heavy metals. Sci. Total Environ. 2015, 506, 217–225. [Google Scholar] [CrossRef]
- Song, Y.; Hou, D.; Zhang, J.; O’Connor, D.; Li, G.; Gu, Q.; Li, S.; Liu, P. Environmental and socio-economic sustainability appraisal of contaminated land remediation strategies: A case study at a mega-site in China. Sci. Total Environ. 2018, 610, 391–401. [Google Scholar] [CrossRef]
- Huang, J.; Wu, Y.; Sun, J.; Li, X.; Geng, X.; Zhao, M.; Sun, T.; Fan, Z. Health risk assessment of heavy metal(loid)s in park soils of the largest megacity in China by using Monte Carlo simulation coupled with Positive matrix factorization model. J. Hazard. Mater. 2021, 415, 125629. [Google Scholar] [CrossRef]
- Świdwa-Urbańska, J.; Batlle-Sales, J. Data quality oriented procedure, for detailed mapping of heavy metals in urban topsoil as an approach to human health risk assessment. J. Environ. Manag. 2021, 295, 113019. [Google Scholar] [CrossRef]
- Wang, S.; Gao, Z.; Zhang, Y.; Zhang, H.; Wu, Z.; Jiang, B.; Liu, Y.; Dong, H. Source and Health Risk Assessment of Heavy Metals in Soil–Ginger System in the Jing River Basin of Shandong Province, North China. Int. J. Environ. Res. Public Health 2021, 18, 6749. [Google Scholar] [CrossRef]
- Ekosse, G.I.; Nkeng, G.E.; Bukalo, N.; Oyebanjo, O. Geophagic clays from Cameroon: Provenance, metal contamination and health risk assessment. Int. J. Environ. Res. Public Health 2021, 18, 8315. [Google Scholar] [CrossRef]
- Zhang, B.; Liu, L.; Huang, Z.; Hou, H.; Zhao, L.; Sun, Z. Application of stochastic model to assessment of heavy metal(loid)s source apportionment and bio-availability in rice fields of karst area. Sci. Total Environ. 2021, 793, 148614. [Google Scholar] [CrossRef] [PubMed]
- China National Environmental Monitoring Centre (CNEMC). The Background Values of Chinese Soil; Environmental Science Press of China: Beijing, China, 1990. [Google Scholar]
- Zhao, Y.; Deng, Q.; Lin, Q.; Zeng, C.; Zhong, C. Cadmium source identification in soils and high-risk regions predicted by geographical detector method. Environ. Pollut. 2020, 263, 114338. [Google Scholar] [CrossRef] [PubMed]
- Cao, S.; Duan, X.; Ma, Y.; Zhao, X.; Qin, Y.; Liu, Y.; Li, S.; Zheng, B.; Wei, F. Health benefit from decreasing exposure to heavy metals and metalloid after strict pollution control measures near a typical river basin area in China. Chemosphere 2017, 184, 866–878. [Google Scholar] [CrossRef] [PubMed]
- Liang, J.; Feng, C.; Zeng, G.; Gao, X.; Zhong, M.; Li, X.; Li, X.; He, X.; Fang, Y. Spatial distribution and source identification of heavy metals in surface soils in a typical coal mine city, Lianyuan, China. Environ. Pollut. 2017, 225, 681–690. [Google Scholar] [CrossRef] [PubMed]
- USEPA. Inductively Coupled Plasma-Mass Spectrometry; USEPA: Washington, DC, USA, 1998.
- USEPA. Risk Assessment Guidance for Superfund; Human Health Evaluation Manual Part A, Volume I; Office of Emergency and Remedial Response, US Environmental Protection Agency: Washington, DC, USA, 1989; p. 1.
- USEPA. Risk Assessment Guidance for Superfund; Volume I: Human Health Evaluation Manual, Part E, Supplemental Guidance for Dermal Risk Assessment; Office of Superfund Remediation and Technology Innovation, U.S. Environmental Protection Agency: Washington, DC, USA, 2004. Available online: https://nepis.epa.gov/Exe/ZyNET.exe/P1002UOM.TXT?ZyActionD=ZyDocument&Client=EPA&Index=2006+Thru+2010&Docs=&Query=&Time=&EndTime=&SearchMethod=1&TocRestrict=n&Toc=&TocEntry=&QField=&QFieldYear=&QFieldMonth=&QFieldDay=&IntQFieldOp=0&ExtQFieldOp=0&XmlQuery=&File=D%3A%5Czyfiles%5CIndex%20Data%5C06thru10%5CTxt%5C00000006%5CP1002UOM.txt&User=ANONYMOUS&Password=anonymous&SortMethod=h%7C-&MaximumDocuments=1&FuzzyDegree=0&ImageQuality=r75g8/r75g8/x150y150g16/i425&Display=hpfr&DefSeekPage=x&SearchBack=ZyActionL&Back=ZyActionS&BackDesc=Results%20page&MaximumPages=1&ZyEntry=1&SeekPage=x&ZyPURL (accessed on 25 January 2022).
- USEPA. Risk Assessment Guidance for Superfund; Volume I: Human Health Evaluation Manual, Part F, Supplemental Guidance for Inhalation Risk Assessment; Office of Superfund Remediation and Technology Innovation, U.S. Environmental Protection Agency: Washington, DC, USA, 2009; p. 1.
- USEPA. Risk Assessment Guidance for Superfund (RAGS); Volume I: Human Health Evaluation Manual, Part E, Supplemental Guidance for Dermal Risk Assessment; Office of Superfund Remediation and Technology Innovation, U.S. Environmental Protection Agency: Washington, DC, USA, 2009; p. 1. Available online: https://www.epa.gov/risk/risk-assessment-guidance-superfund-rags-part-e (accessed on 25 January 2022).
- Li, J.; Fan, J.; Jiang, J.; Zhai, Y.; Luo, Z.; Zhang, Z.; Wu, J. Human health risk assessment of soil in an abandoned arsenic plant site: Implications for contaminated site remediation. Environ. Earth Sci. 2019, 78, 673. [Google Scholar] [CrossRef]
- USEPA. Superfund Supplemental Guidance to RAGS: Region 4 Bulletins, Human Health Risk Assessment Bulletins; USEPA: Washington, DC, USA, 2000.
- CEHT. Technical Report: Development of Cleanup Target Levels (CTLs) for Chapter 62–777, F.A.C; Division of Waste Management Florida Department of Environmental Protection, Center for Environmental & Human Toxicology, University of Florida: Gainesville, FL, USA, 2005. [Google Scholar]
- USEPA. Supplemental Guidance for Developing Soil Screening Levels for Superfund Sites; OSWER 9355.4-24; Office of Solid Waste and Emergency Response: Washington DC, USA, 2002.
- USEPA (United States Environmental Protection Agency). Regional Screening Levels Frequent Questions. 2015. Available online: https://www.epa.gov/risk/regional-screening-levelsfrequent-questions-november-2015#FQ13 (accessed on 11 November 2015).
- USEPA. Recommendations of the Technical Review Workgroup for Lead for an Approach to Assessing Risks Associated with Adult Exposure to Lead in Soil; EPA-540-R-03-001; Technical Review Workgroup for Lead: Washington, DC, USA, 2003.
- USEPA. Update of the Adult Lead Methodology’s Default Baseline Blood Lead Concentration and Geometric Standard Deviation Parameters; OSWER 9200.2-82; Office of Waste and Emergency Response: Washington, DC, USA, 2009.
- Chinese Ministry of Environmental Protection (CMEP). Environmental Quality Standard for Soils; (GB15618–1995); CMEP: Beijing, China, 1995. (In Chinese)
- Chinese Ministry of Environmental Protection (CMEP). Technical Guidelines for Risk Assessment of Contaminated Sites; HJ 25.3—2014; CMEP: Beijing, China, 2014. (In Chinese)
- Jacinthe, P.-A.; Lal, R. Spatial variability of soil properties and trace gas fluxes in reclaimed mine land of southeastern Ohio. Geoderma 2006, 136, 598–608. [Google Scholar] [CrossRef]
- Guan, X.; Yang, P.; Lv, Y. Analysis on spatial variability of soil properties based on multifractal theory. J. Basic Sci. Eng. 2011, 19, 712–720. [Google Scholar]
- Yang, Q.; Li, Z.; Lu, X.; Duan, Q.; Huang, L.; Bi, J. A review of soil heavy metal pollution from industrial and agricultural regions in China: Pollution and risk assessment. Sci. Total Environ. 2018, 642, 690–700. [Google Scholar] [CrossRef]
- Fernández-Caliani, J.C. Risk-based assessment of multimetallic soil pollution in the industrialized peri-urban area of Huelva, Spain. Environ. Geochem. Health 2012, 34, 123–139. [Google Scholar] [CrossRef]
- Ordóñez, A.; Álvarez, R.; Loredo, J. Asturian mercury mining district (Spain) and the environment: A review. Environ. Sci. Pollut. Res. 2013, 20, 7490–7508. [Google Scholar] [CrossRef]
- Li, Z.; Ma, Z.; van der Kuijp, T.J.; Yuan, Z.; Huang, L. A review of soil heavy metal pollution from mines in China: Pollution and health risk assessment. Sci. Total Environ. 2014, 468–469, 843–853. [Google Scholar] [CrossRef] [PubMed]
- Km, M.L.K.; Tu, C.; Zhang, W.H.; Cai, Y.; Kennelley, E.D. A fern that hyperaccumulates arsenic: A hardy, versatile, fast-growing plant helps to remove arsenic contaminated soil. Nature 2001, 409, 579. [Google Scholar]

| Region | n | Concentration | Cd | As | Cu | Pb | Cr | Zn | Hg |
|---|---|---|---|---|---|---|---|---|---|
| I | 11 | Max | 0.78 | 25.20 | 8.78 | 68.90 | 0.10 | 62.20 | 2.30 × 10⁻⁴ |
| Min | 0.02 | 0.25 | 0.01 | 0.05 | 0.01 | 0.09 | 5.00 × 10⁻⁵ | ||
| Median | 0.14 | 2.80 | 1.02 | 0.05 | 0.02 | 8.73 | 5.00 × 10⁻⁵ | ||
| 33II | 2 | Max | 0.01 | 1.05 | 0.61 | 0.05 | 0.03 | 0.64 | 3.00 × 10⁻³ |
| Min | 3.00 × 10⁻³ | 0.04 | 0.02 | 0.05 | 0.01 | 0.36 | 2.50 × 10⁻³ | ||
| Median | 0.01 | 0.54 | 0.32 | 0.05 | 0.02 | 0.50 | 3.00 × 10⁻³ | ||
| 3III | 11 | Max | 10.80 | 5810.00 | - | 74.40 | - | 653.00 | 6.46 |
| Min | 0.10 | 12.50 | - | 10.80 | - | 49.50 | 0.39 | ||
| Median | 1.17 | 151.00 | - | 22.90 | - | 131.00 | 0.71 | ||
| IV | 8 | Max | 17.30 | 3915.00 | - | 165.00 | - | 1554.00 | 5.02 |
| Min | 4.49 | 52.50 | - | 73.30 | - | 682.00 | 0.73 | ||
| Median | 13.40 | 1290.00 | - | 114.00 | - | 985.00 | 1.67 | ||
| V | 6 | Max | 14.60 | 530.00 | - | 116.00 | - | 882.00 | 1.19 |
| Min | 0.90 | 527.00 | 32.40 | 23.80 | - | 113.00 | - | ||
| Median | 4.86 | 1526.00 | 63.90 | 79.60 | - | 445.00 | - | ||
| VI | 8 | Max | 22.50 | 164,000.00 | - | 429.00 | - | 833.00 | 15.50 |
| Min | 3.66 | 377.00 | - | 24.30 | - | 129.00 | 0.43 | ||
| Median | 12.40 | 3895.00 | - | 53.90 | - | 368.00 | 3.29 | ||
| VII | 15 | Max | 1.98 | 1350.00 | - | 43.60 | - | 192.00 | 12.70 |
| Min | 0.08 | 11.50 | - | 8.81 | - | 22.90 | 0.14 | ||
| Median | 0.38 | 184.00 | - | 14.30 | - | 49.50 | 1.02 | ||
| VIII | 3 | Max | 0.09 | 32.40 | - | 49.50 | - | 70.20 | 0.33 |
| Min | 0.01 | 4.39 | - | 42.80 | - | 27.80 | 0.12 | ||
| Median | 0.05 | 8.28 | - | 45.70 | - | 62.10 | 0.25 | ||
| IX | 20 | Max | 9.10 | 78.00 | 269.00 | 2030.00 | 212.00 | 611.00 | 1.40 |
| Min | 0.10 | 14.70 | 3.10 | 2.70 | 50.30 | 43.80 | 0.10 | ||
| Median | 0.65 | 25.40 | 18.10 | 18.40 | 85.00 | 121.50 | 0.30 | ||
| X | 28 | Max | 56.00 | 463.00 | 484.00 | 7600.00 | 151.00 | 978.00 | 6.27 |
| Min | 0.17 | 10.50 | 4.00 | 2.80 | 20.00 | 18.80 | 0.10 | ||
| Median | 1.67 | 38.00 | 76.50 | 30.20 | 39.00 | 105.50 | 0.29 | ||
| Total | 112 | Max | 56.00 | 164,000.00 | 776.00 | 7600.00 | 212.00 | 5078.00 | 15.50 |
| Min | 3.00 × 10⁻³ | 0.04 | 0.01 | 0.05 | 0.01 | 0.09 | 5.00 × 10⁻⁵ |
| Regions I–X | Adults | Children | ||||||||||
|---|---|---|---|---|---|---|---|---|---|---|---|---|
| RBRLs for Noncancer Risk | RBRLs for Cancer Risk | RBRLs for Noncancer Risk | RBRLs for Cancer Risk | |||||||||
| Element | Oral | Dermal | Inhalation | Oral | Dermal | Inhalation | Oral | Dermal | Inhalation | Oral | Dermal | Inhalation |
| Cd | 1.75 × 10⁴ | 1.60 × 10³ | 1.42 × 10⁴ | 3.38 × 101 | NA | 6.57 × 10⁴ | 7.82 × 101 | 3.43 × 10 | 1.42 × 10⁴ | 1.45 × 101 | NA | 2.63 × 10⁵ |
| As | 5.26 × 10³ | 6.40 × 10² | 2.13 × 10⁴ | 1.42 × 10² | 1.70 × 10² | 2.74 × 10⁴ | 2.35 × 101 | 3.65 × 101~8.61 × 101 | 2.13 × 10⁴ | 6.08 × 101 | 5.10 × 10³ | 1.10 × 10⁵ |
| Cu | 7.01 × 10⁵ | 7.68 × 10⁵ | 5.70 × 10⁷ | NA | NA | NA | 3.13 × 10³ | 4.12 × 10³ | 5.70 × 10⁷ | NA | NA | NA |
| Cr | 5.26 × 10⁴ | 3.84 × 10³ | 4.06 × 10⁴ | 5.07 × 10 | NA | 9.85 × 10³ | 2.35 × 10² | 2.06 × 101 | 4.06 × 10⁴ | 2.17 × 10 | NA | 3.94 × 10⁴ |
| Zn | 5.26 × 10⁶ | 1.92 × 10⁷ | 4.25 × 10⁸ | NA | NA | NA | 2.35 × 10⁴ | 2.06 × 10⁴ | 4.25 × 10⁸ | NA | NA | NA |
| Hg | 5.26 × 10³ | 1.34 × 10³ | 4.25 × 10⁵ | NA | NA | NA | 2.35E × 101 | 7.20 × 10 | 4.25 × 10⁵ | NA | NA | NA |
Publisher’s Note: MDPI stays neutral with regard to jurisdictional claims in published maps and institutional affiliations. |
© 2022 by the authors. Licensee MDPI, Basel, Switzerland. This article is an open access article distributed under the terms and conditions of the Creative Commons Attribution (CC BY) license (https://creativecommons.org/licenses/by/4.0/).
Share and Cite
Wu, J.; Jia, R.; Xuan, H.; Zhang, D.; Zhang, G.; Xiao, Y. Priority Soil Pollution Management of Contaminated Site Based on Human Health Risk Assessment: A Case Study in Southwest China. Sustainability 2022, 14, 3663. https://doi.org/10.3390/su14063663
Wu J, Jia R, Xuan H, Zhang D, Zhang G, Xiao Y. Priority Soil Pollution Management of Contaminated Site Based on Human Health Risk Assessment: A Case Study in Southwest China. Sustainability. 2022; 14(6):3663. https://doi.org/10.3390/su14063663
Chicago/Turabian StyleWu, Jin, Ruitao Jia, Hao Xuan, Dasheng Zhang, Guoming Zhang, and Yuting Xiao. 2022. "Priority Soil Pollution Management of Contaminated Site Based on Human Health Risk Assessment: A Case Study in Southwest China" Sustainability 14, no. 6: 3663. https://doi.org/10.3390/su14063663