Review

Urban Ventilation in the Compact City: A Critical Review and a Multidisciplinary Methodology for Improving Sustainability and Resilience in Urban Areas

1
Department of Civil, Construction and Environmental Engineering, Sapienza University of Rome, 00184 Rome, Italy
2
Building Physics and Services, Department of the Built Environment, Eindhoven University of Technology, 5600 MB Eindhoven, The Netherlands
*
Author to whom correspondence should be addressed.
Sustainability 2022, 14(7), 3948; https://doi.org/10.3390/su14073948
Submission received: 28 February 2022 / Revised: 18 March 2022 / Accepted: 22 March 2022 / Published: 26 March 2022

Abstract

:
In the last decades, a tendency towards urban tissue densification has been observed to counteract the urban sprawl. Densification may be achieved through more compact built areas, preferring the vertical to the horizontal development of buildings but avoiding bulky high-rise building blocks. This strategy significantly affects several aspects of the microclimate and produces direct and indirect effects on human health and well-being. In this regard, air pollution and heat stress constitute two increasing threats to human health and well-being that need to be faced immediately. The involved phenomena are various, intertwined, and may lead to conflicting results. Hence, regenerating existing, well-structured, and stratified urban areas by densification is not an easy challenge. Urban ventilation may favor the mitigation of detrimental effects of air pollution and heat stress on human life. Therefore, a multidisciplinary methodology is presented for embedding urban ventilation performance evaluation into urban management and planning processes. The scope is to propose a framework for urban renewal plans that is citizens-centered and aims at improving their health and well-being in existing urban areas. The methodology builds upon the performance-based approach and is supported by the conceptual framework and the literature reviews provided through the paper.

1. Introduction

The world population has chosen the urban environment as its habitat. Worldwide, 4.2 billion people live in cities [1] as a result of a gradual and inexorable movement of the population from rural to urban areas, that started during the industrial revolution, accelerated in the 1950s, and is still ongoing despite substantial differences across continents [1] (Figure 1). For decades, cities have been the synonym for progress, wealth, and possibilities, driving economic development and providing public services, e.g., education, transport, and healthcare [2]. Cities have represented attractive poles in human life and have become places where population, activities, and consumptions are concentrated. Consequently, urban areas have severely modified and enlarged their ecological footprint and have been increasingly associated with environmental degradation, social and economic exclusion, heavy traffic, and pollution [3]. Besides this, as attractive poles, cities appear as vulnerable elements of human life, exposing most of the population, infrastructures, and activities to the threat of extreme meteorological events and climate changes, phenomena that are becoming increasingly frequent even in mild or temperate climates, e.g., in the Mediterranean basin and Europe [4,5]. The challenge towards a more sustainable and resilient built environment appears urgent, especially in existing cities that seem unprepared to tackle increasing threats due to climate changes and multifaceted stresses.
Many efforts are being made worldwide, as demonstrated, for example, by the adoption in 2015 of the 2030 Agenda for Sustainable Development by all United Nations Member States. The Agenda presents seventeen Sustainable Development Goals (SDGs) and explicitly recommends to “ensure healthy lives and promote well-being for all at all ages” (SDG #3) and to “make cities and human settlements inclusive, safe, resilient and sustainable” (SDG #11) [8]. Existing urban areas need to be regenerated, implementing their resilience and sustainability to improve the human conditions, present and future. In this regard, air pollution and heat stress constitute two increasing threats to human health and well-being that need to be faced immediately, especially in Europe [3,9,10,11,12]. More than 74% of the European population lives in urban areas [13], and the large majority is exposed to pollutant concentrations that exceed the values recommended by the World Health Organization, despite the reduction in emissions and ambient concentrations registered in the last years [3]. It is worth noting that improvements in air quality have been registered due to measures introduced to reduce COVID-19 transmission [3]. This characteristic emphasizes the impact of nowadays lifestyle on the environment and the urgency about balancing human activity with environmental preservation [3].
Air pollution and heat stress have been associated with poor air conditions [14,15,16,17,18] and linked to increased morbidity, mortality, and economic loss [3,10,19,20,21,22,23,24,25,26]. Poor air conditions significantly impact the outdoors and indoor places, worsening human health and comfort, limiting the use of open spaces, making ineffective passive solutions, e.g., building natural ventilation, and causing the increase in energy consumption for air cleaning and cooling [27]. The detrimental effects of poor air conditions can be partly mitigated, exploiting urban ventilation [15,28]. Urban ventilation represents the capacity of urban areas for introducing fresh air within their tissues and diluting pollutants and heat within their canyons. This phenomenon results from the interaction between urban areas and airflows and may improve air quality and thermal comfort. To exploit this interaction favorably, the relationship between the physical structure of urban areas, i.e., urban morphology, and local wind conditions, i.e., speed and direction, should be investigated in detail. Urban morphology becomes a passive strategy for curbing air pollution and heat stress in urban areas.
The interaction between urban morphology and airflows is a primary topic that needs to be considered in urban renewal plans since their effects on human life may be beneficial or detrimental. The character of the effects does not depend only on the characteristics of the synoptic wind as a natural phenomenon, e.g., gust, speed, and direction, but also on the features of the obstacles and environments that the wind encounters along its path. Hereunto, Baruch Givoni states that “Of all the climatic elements the wind conditions are modified to the greatest extent by urbanization” [29]. Wind may contribute to the fulfillment of requirements for indoor and outdoor thermal comfort and air quality, promote passive strategies for building ventilation, and facilitate the integration of micro-wind turbines in the urban landscape for electricity production. Therefore, adequate wind conditions within urban areas represent an environmental and economic resource to be exploited. Conversely, high wind speed, vortices, and turbulence may be responsible for wind discomfort and nuisance for pedestrians and cause damages to buildings, infrastructures, and vegetation. It is well known that these detrimental effects are enhanced by specific characteristics of urban areas. The presence of tall buildings facing open spaces introduces high wind speed from high altitudes and vortices at the pedestrian level [30,31,32,33]. Moreover, alignments of specific morphological configurations with prevailing wind directions have been identified as responsible for accelerations in the wind speed caused by pressure short-circuiting [34]. It appears evident that these features significantly affect the use of open spaces and should be avoided. Nevertheless, if adequately investigated during the renovation planning phase, these phenomena may be exploited for meliorating wind conditions locally, improving the urban ventilation performance of urban areas.
In the framework of the global challenge towards more sustainable and resilient urban areas, it appears evident that the interaction between air flows and urban morphology is a fundamental topic to investigate, aiming at assessing the ventilation performance of urban tissues. It entails many issues and phenomena [35], at different scales, with direct and indirect repercussions on human life, health, and wellbeing. It appears clear that the involved phenomena are complex and multifaceted. Hence, it is necessary to reconsider the management and planning processes of urban areas, going beyond traditional approaches and towards performance-based planning, to grasp the complexity [36].
Urban ventilation is essential to curb the exposure of citizens to polluted air and guarantee thermal comfort, contributing to the challenge towards more resilient and sustainable urban areas. Despite its importance, the assessment of the urban ventilation performance, and, more in general, the study of the interaction between urban morphology and airflows, are not yet commonly embedded in urban planning and management processes with a few exceptions. The exceptions found in the literature include procedures for conducting analyses to ensure pedestrian comfort and safety due to high wind speed, e.g., the Dutch Wind Nuisance Standard NEN8100 [37], and the air ventilation assessment (AVA) system adopted by the government of Hong Kong in 2006 [15]. To the best of the authors’ knowledge, the AVA system, commissioned after the outbreak of the severe acute respiratory syndrome in Hong Kong in 2003 for improving the quality of the urban environment, is the only guideline focused on weak wind conditions. The scarcity of methodologies for evaluating urban ventilation embedded in urban planning and management may lie in the nature of the phenomena involved, complex and multi-faceted, and in the consequent difficulty of carrying out these investigations that require both a high specialism and a multidisciplinary approach. Note that the attention of this paragraph is on procedures or guidelines already embedded in the urban management and planning processes. However, several studies have been conducted in the past, aiming at evaluating pedestrian wind comfort, therefore focusing on high wind speed [33,34,38,39,40,41,42]. Conversely, studies aiming at analyzing weak or poor wind conditions are rare. In this regard, the works by Ng [15] and Du et al. [43] for the city of Hong Kong should be mentioned.
To fill this gap and promote a new approach to the regeneration of urban areas, this paper presents a conceptual framework and a multidisciplinary methodology to embed the urban ventilation performance assessment into renewal plans of existing urban areas. Therefore, the article is structured as follows. Section 2 describes the theoretical background focusing on the concepts of urban morphology and the performance-based approach to urban planning. Following this overview, Section 3 outlines the conceptual framework for implementing sustainability in existing urban areas, highlighting the need for the performance evaluation of urban tissues and outlining a general workflow for urban renewal plans. Section 4 presents an in-depth systematic review of studies conducted for analyzing the relationship between urban morphology and performances of urban areas. Then, in greater detail, Section 5 focuses on a critical examination of the urban ventilation concept, reporting morphological parameters, investigation methods, and performance indicators adopted in the literature. As a result of the comprehensive reviews and considerations presented in the previous sections, Section 6 outlines the methodology applied to a significant case study, i.e., a compact urban area in Rome, Italy, to test its feasibility. Finally, Section 7 reports the conclusions and an outlook for future developments.

2. Theoretical Background

“The physical dimensions of urban form may include its size, shape, land uses, configuration and distribution of open space—a composite of a multitude of characteristics, including a city’s transportation system and urban design features. However, its sustainability depends on more abstract issues—environmental (including transport), social and economic”.
[44]
The sustainability and the resilience of urban areas are complex concepts as they pertain to different dimensions of human life. Diverse disciplines are involved, and various aspects should be investigated using specific methods and tools. Hence, a holistic and multidisciplinary approach is essential to implement sustainability and resilience in the management and planning of urban areas. In this regard, the objective and quantitative description of the characteristics of the urban physical dimension appears as necessary but not sufficient [44]. It is fundamental to highlight and investigate the relationships between the physical dimension and the environmental, social, and economic contexts, analyzing the effects and the repercussions of these relationships on citizens’ health and wellbeing.

2.1. The Performance-Based Approach

According to this approach, cities may be considered living organisms or open systems formed by a visible part, i.e., the physical dimension and the elements that constitute it, and an invisible part, i.e., the relationships that the diverse components establish between them and with the environment. Arguably, cities may be considered open systems because, using the definition of the “School of non-equilibrium thermodynamics”, they receive inputs, i.e., resources, from the surrounding environment and dispose of outputs into it, determining evident stress for the environment [45]. As complex metabolic systems, cities need to adapt to changes in the boundary conditions, mitigate the impacts of these changes on their constitutive elements, and anticipate possible scenarios [45]. Endorsing this vision, the physical dimension is inseparable from the processes taking place in it, the actors that live in it, and the relationships established by the different constitutive elements between them and with the environment.
Systems and processes are the keywords for a new approach applied in building design, urban planning, and urban management. This approach should be holistic, systematic, and analytic, considering various stresses often conflicting. It should be guided by clear strategies and oriented to achievable goals and objectives measured by employing performance indicators [46]. The complexity reveals the need for a change in the management and planning of urban areas, going beyond traditional approaches. Traditional planning models based on the Euclidean zoning and land use prescriptions have been proven inadequate to tackle this complex phase [47] and have been criticized for being inflexible and unable to adapt to environmental, social, and economic changes [48,49]. They are regarded as not able to consider the dynamic relationships of the physical dimension of urban areas with surroundings and functions and, therefore, the effects on citizens’ health and wellbeing. Conversely, performance-based planning (PBP), or performance-based approach (PBA) to planning, involves the allocation of human activities and land uses based on quantifiable performance indicators [50] and aims to optimize land uses and resources, mitigating impacts [51]. PBP implies the passing of classic planning instruments regarded as inadequate for the task and advocates for more flexible tools that may better represent the complex, uncertain, and dynamic processes in play and are open to adaptation and transformation [52]. In this regard, modeling, as a simplified representation of the real world [53,54], proves to be an effective tool to support PBA, allowing to investigate different phenomena, consider possible scenarios, and assess impacts ex ante [36]. Early attempts of PBP can be traced back to the early 1950s when performance standards were employed to control the negative impacts of industries, while the systematic application began in the early 1970s in the United States [51]. Nevertheless, the difficulties encountered and the level of support and effort required for implementing and applying PBP need to be considered [46,51]. However, it is already acknowledged that new paradigms and approaches need to be adopted nowadays to manage complexity. PBP reveals to be a suitable and adequate tool, and building a common base of knowledge among different disciplines seems a feasible and valuable way to overcome this issue. Hence, the quantitative description of the physical dimension of urban areas seems a fundamental first step in this direction because it allows the aggregation of results and the comparison of different scenarios. Figure 2 shows four examples of compact urban tissues in Europe. To objectively describe similarities and differences amongst urban tissues, various morphological parameters can be used.

2.2. The Typo-Morphological Approach

To quantitatively describe an urban area, it is necessary first to define the term “physical dimension” and then identify its fundamental elements. The physical dimension of an urban area is usually described in terms of urban morphology. The word morphology is composed by the two Ancient Greek words μορφή, morphḗ, meaning form, and λόγος, logos, meaning study, and means the study of the form. The term was coined by Goethe in 1785, in German Morphologie, to indicate comparative anatomy. By extension, urban morphology is the study of the structure of urban areas, and the term is generally used not only to denote the analyses but also the form itself. Studying urban morphology means to read and analyze the evolution of a city, or part of it, through the physical structure. The qualitative description is not sufficient and needs to be supported by the quantitative description of urban tissues. For this purpose, the work of the three Schools of typo-morphology, i.e., the Italian, the English, and the French Schools, is considered significant.
According to the Italian School, building type is the fundamental element of the city structure and the basis for analyzing it. The concept of building typology includes the description of the characteristics of the single building and its relations with the open space. In fact, the type determines the dimension and shape of a building and affects its location in the lot, influencing the relationship between built and open spaces. The Italian School has in Saverio Muratori its leading figure. His work was inspirational for several outstanding architects, e.g., Aldo Rossi and Carlo Aymonino, and his approach and theoretical framework to typo-morphology was continued by Gianfranco Caniggia. The English School, identified by the work of Conzen, recognizes three fundamental components of a town plan: buildings, or more precisely their block plans, plots, aggregated in street blocks, and streets, arranged in street systems [55]. Regarding the English School, also the work by Leslie Martin and Lionel March is fundamental. Their work focused on investigating the relationships between building types and urban structures, analyzing their impact on land use efficiency [56]. Finally, the French School was established in the early 1970s as a critical analysis of the effects of the Modern Movement on the French landscape [57]. The main characteristic of this School is the focus on the social repercussions. Despite differences in their approaches and aims, the three Schools may integrate into a holistic approach to urban morphology, and this is the approach adopted in the present work. A detailed description of the work of the three Schools can be found in [57,58].

2.3. The Quantitative Description of the Urban Environment

Building types, lots, and streets are three constitutive elements of the urban physical dimension. Consequently, the morphology of an area derives from the relations of these three components, and its description should consider their relations at different scales. The typology of the building and its locations within the lot shapes the relation between built and open areas, private and public spaces. For instance, building setbacks determine the width of urban canyons (UC), while building typologies determine if UCs are formed by only public spaces or if there are also private areas to consider, with evident impacts on the management. Therefore, the term urban morphology is employed to characterize the three-dimensional urban structure generated by a group of buildings and the open spaces entrapped between them [59]. In Figure 3, possible relations of two building typologies, i.e., slab and pavilion, with open spaces are explored, and diverse UC configurations are presented, i.e., continuous, discontinuous, or mixed. The orientation and location of the building determine different configurations of the open spaces within the lot, determining different UC configurations outside the lot. In Figure 3, d refers to the distance between buildings within the same lot or island, s refers to the setback, while W refers to the distance between buildings belonging to different islands, i.e., the width of the resulting UC. At larger scales, the arrangements of the lots within the islands and the arrangements of the islands forming the different urban tissues shape districts and neighborhoods and consequently urban areas (Figure 4). Hence, adopting a typo-morphological approach means adopting a multiscale approach, from the building to the neighborhood scale.
Furthermore, morphological analyses are based on three concepts, i.e., form, time, and scale or level of resolution. The form is influenced by building types and their related open spaces. Therefore, the characteristics of interest are associated with the description of the individual buildings and the arrangement of groups of buildings, e.g., the width, length, and height of a building, distance between buildings within and outside the same island, street length, and layout type. The temporal factor is a primary concept because a city, as a metabolic system, changes and transforms. Performing morphological analyses means investigating the processes dictated by cultural, normative, legislative, and economic reasons that influenced the constitutive elements throughout the centuries. Finally, the scale or level of resolution is a fundamental concept because it determines which characteristics of the three components are of interest. The resolution levels commonly identified are building, lot, island, tissue, and neighborhood or district (Figure 4). It appears evident that to describe the urban morphology of a specific area objectively, the parameters of all the three fundamental elements and their aggregation in different levels of resolution are necessary. Note that in this way, it is possible to measure and quantify built surfaces and volumes as well as the open areas enclosed by them being private or public. From this point of view, the analytical and objective analysis of urban morphology proves to be very promising and offers opportunities and inspiration for new, detailed, and multidisciplinary analyses. Starting from specific case studies, it is possible to extrapolate parameters and indices, valid also in other contexts, that allow comparing the performances of morphologies developed in different eras and contexts. For this purpose, it is useful to introduce the concept of density.

2.4. The Concept of Density

Dealing with the quantitative description of urban morphologies, the concept of density proves to be fundamental. Density is commonly used in urban planning to describe the relationship between a specific area and the entities belonging to that area [60]. It is a key concept in urban planning and building design for managing sustainability in the long term because it helps to describe, predict, and control land uses, urban morphology, and soil consumption, the nonrenewable resource par excellence. Density proves to be a promising concept for these types of analyses because it is objective, quantifiable, and neutral; neutral because it does not involve an a priori judgment, and as a ratio, it does not entail a positive or negative meaning [61]. Nevertheless, density represents a complex concept [62] since it is context-related and defined and applied differently for different sectors, disciplines, and countries [60,63]. The main criticalities that may be encountered while measuring densities of urban areas are due to ambiguities in (i) the definition, i.e., the type of density we are interested in measuring; consequently, (ii) the indices, i.e., the quantities that form the numerator and denominator of the ratio; and (iii) the data collection, since different disciplines and countries work with different density measures. Another issue associated with the definition of density is the presumed weak relationship between density and building type [63]. However, Berghauser Pont and Haupt have demonstrated that this problem may be eased with the use of a set of selected indices [60]. A similar conclusion has been reported by Palusci et al. [64]. Another issue that needs to be addressed is the concept of average that links density with resolution levels. Density is a ratio and, therefore, depending on the adopted scale, its value may be too blurred by statistical averages when larger scales are considered, e.g., district and region, or too specific to represent the selected area when small scales are considered [60]. In conclusion, the concept of density may be a helpful investigation and operational tool; however, it is necessary to consider the criticalities, especially in comparative and multidisciplinary studies. Consequently, it is suggested to define resolution levels, parameters, and indices preliminarily.

3. The Conceptual Framework

Cities face a wide range of stresses due to both natural and human agents and often appear unprepared to tackle the increasing threats due to climate changes and rapid urbanization. Implementing resilience and sustainability in the built environment by regenerating existing urban areas emerges as urgent. A resilient city is a city that responds, adapts, and continues to exist, maintaining all its characteristics despite the stresses it must face. A sustainable city ensures health and comfort to its inhabitants, present and future. The two concepts are linked and intertwined, and, arguably, it is possible to conclude that resilience is one of the characteristics that a sustainable city must have.
In the last two decades, the debate about the characteristics and dimensions of the sustainable city has been central among researchers, planners, and policymakers [44]. The discussion is still ongoing since the achievement of sustainability in the urban environment hinges upon many different factors that often lead to conflicting solutions. Furthermore, implementing sustainability means addressing site-specific issues; therefore, it is impossible to achieve a unique answer to the sustainable urban model question, valid in every climate. Nevertheless, there is a broad consensus in assuming the compact European city as a model of a sustainable city, also in stressful climates [65]. This model involves the density of urban tissues, functional mixité, social vitality, and economic diversity [66], limiting, on the one hand, the urban expansion and soil consumption—the so-called urban sprawl—and, on the other, avoiding excessive densities and overcrowding.
From an environmental point of view, the compact city is considered more sustainable because it involves fewer emissions due to individual transport and less surface area per inhabitant to heat or cool [67]. Consequently, to reduce soil consumption, to optimize transport and energy supply in a district, solutions that entail densification of urban tissues and the introduction of economic and production facilities within residential areas may be regarded as favorable during the regeneration of existing urban areas. However, these actions may significantly impact human health and wellbeing if not adequately investigated since the early stages. Possible consequences may be augmented production of heat and pollution, decreased solar access, and reduced wind conditions. In other words, urban ventilation in the renewed area may prove reduced and, consequently, air quality and citizen thermal comfort worsen. It is evident the need for addressing a multitude of issues since the early stages of urban renewal plans, and it is significant the role that specialist and multidisciplinary analyses play in it. Therefore, designers, planners, and policymakers need new operating methodologies for sharing knowledge from different scientific sectors, allowing a holistic approach. These methodologies should start from the analysis of the physical structure of the built environment and relate it to expected environmental performance levels, allowing the investigation of the phenomena at different scales. Hereunto, PBP reveals to be a suitable and adequate tool.
Based on the theoretical background provided in the previous section, a general workflow consisting of six steps for the regeneration of existing urban areas is presented. The first step is to translate the agenda into quantifiable objectives. The second step involves the definition of a clear strategy. The strategy determines performances and potential risks. In turn, the achievement of certain performance levels and the reduction, or avoidance, of potential risks determine the success of a strategy in achieving the identified objectives. Key indicators should be identified to measure performance levels analytically, and evaluation procedures should be adopted. Finally, monitoring systems, providing periodic feedback, should be specified; these systems may be based on the procedures established for evaluating the strategy. The scope is to propose a framework for urban renewal plans that is citizens-centered and aims at improving their health and well-being in existing urban areas (Figure 5). Therefore, the objective should be formulated, once the site has been identified. The choice of the strategies depends on the characteristics of the specific area. Since the planning policies in many countries have been oriented recently towards more compact urban tissues, densification may be a possible strategy. As reported earlier, densification of existing urban tissues implicates many consequences potentially detrimental for human health and well-being. Therefore, potential risks to human health and well-being should be identified. Figure 5 reports some risks that may be faced while promoting denser urban tissues. Hence, performances to counteract the detrimental effects should be individuated. Specifically, it is necessary to (i) identify key indicators and (ii) adopt evaluation procedures for assessing the achievement of specific performance levels. The indicators should be easily related to comfort assessment.
The performance evaluation of urban areas appears essential, and, specifically, the investigation of the differences due to diverse morphologies emerges as fundamental. Different performances result from the many processes caused by the interaction of urban morphologies with multiple phenomena. The number and nature of the phenomena hinge upon the indicated objectives and strategies. It is necessary to assess the effects of the interaction between urban morphologies and different phenomena in terms of performances. For this purpose, it is advantageous to describe the urban morphology of the selected area using a set of morphological parameters (hereafter MPs) because employing MPs allows comparing scenarios and results. Figure 6 presents two possible strategies that can be adopted while regenerating the physical dimension of urban areas. The first strategy implies maintaining the same building coverage ratio, while the second aims at providing the same floor space index and volume-to-site ratio. For the definitions of the different MPs, the readers should refer to Figure 7. The effects of the two strategies are explored for five building typologies, i.e., pavilion-towers, pavilion-palazzina, slabs, courts, terraced houses, extrapolated from an existing compact area in Rome. Depending on the strategy, the various typologies present differences in the amount, position, and orientation of built volumes and surfaces. Differences in the built and unbuilt exchanging surfaces may cause different levels of urban tissue performances according to the phenomena of interest. Hence, to assess the performance, it is essential to identify the phenomena of interest and investigate the effects of their interactions with urban morphology.
The stimulus to the quantitative description of urban areas and the evaluation of their performances may be due to the development of the geographic information system (GIS). These software tools allow storing the spatial characteristics of urban areas and linking the spatial attributes to qualitative and quantitative data. In this way, the physical dimension can be measured and analyzed in relation to environmental performances or linked to socio-economic forces [68,69,70,71]. Thus, the tools offer the ability to coordinate activities of fields traditionally apart and allow studying large areas [58]. Therefore, GIS tools have been used increasingly in both scientific and professional fields.
Since urban sustainability hinges upon many factors of different nature, the performance evaluation entails many dimensions and may be expressed using various indicators. In the following section, a systematic review of studies conducted for analyzing the relationship between urban morphology and performances of urban areas is presented.

4. Urban Morphology and Performance

The evaluation of the performance of urban tissues has gained popularity in the last few years within the scientific community (Figure 8). A literature review is reported in this section to provide an overview of studies in this field. The review was conducted in the Scopus database [72] using “urban morphology” and performance combined with the Boolean operator AND, as terms for the search query. The identified documents should contain the specified query in the following search fields: title, abstract, or keywords. Only research papers, review papers, and book chapters published in English until 2021 have been considered. The total amount of identified manuscripts is 144, and Figure 8a reports the yearly distribution. The first works were published in 1997, and the topic has gained popularity amongst researchers in the last decade. The increased interest is particularly evident in the last three years since half of the total amount of manuscripts has been published from 2018. It is interesting to note that a similar trend may be found in the yearly distribution of published works retrieved from the Scopus database using “urban morphologyAND sustainability as terms for the search query (Figure 8b). In fact, the first work was published in 1997, and an augmented interest is evident in correspondence with 2018. This similarity may be interpreted as a sign of the increased awareness of the issues connected to urban sustainability and may also highlight the connection between the two topics, i.e., performance and sustainability if related to urban morphology.
The aim of the present review is twofold: on the one hand, to identify how the performance of urban tissues has been evaluated, in terms of methods, topics, and indicators; on the other hand, to analyze how urban morphology has been considered, in terms of scale and parameters. Figure 9 outlines the review process consisting of three phases, i.e., the collection, the examination, and, finally, the classification. Of the 144 identified documents, 10 manuscripts were excluded because they are not accessible to the authors. The remaining 134 manuscripts were downloaded and further examined. The examination consists of two steps. Initially, only the abstract was considered for verifying the relevance of the study. After the abstract screening, 5 documents were excluded because they are out of the scope of the present review, while 37 required further analyses of the adopted methodology and obtained results for the classification. After the detailed examination, another 4 documents were excluded: a manuscript found not relevant [73], and three manuscripts that were excluded because they focus on the parameterization of trees and not on the description of urban morphology [74,75]. Afterward, the remaining 125 manuscripts were examined thoroughly, focusing on methodology, results, and conclusions for (i) identifying the methodology adopted, (ii) classifying the performance evaluated, and (iii) analyzing the urban morphology parameterization. Hence, the reviewed documents were classified into 10 categories according to the topic investigated, i.e., energy, microclimate, economics, assessment, indoor, morphology modeling, urban model, transport, design, and combinations of the previous topics.
Specifically, the term energy has been used to characterize studies aiming at evaluating the energy performances of buildings in terms of energy consumption for cooling, energy consumption for heating, and energy production potential. The term microclimate has been used in this review to represent studies investigating one or more parameters that may be considered for describing the local microclimatic conditions, e.g., air temperature, solar access, and wind speed. Note that pollution has been included in this group because its dispersion is driven by microclimatic conditions. The term economics has been employed to denote studies that investigate the economic performance of urban areas in both a strict sense [76,77,78,79] and a broader sense taking into account the vibrancy [80] and the livability [81,82] of urban areas. The term assessment has been used to identify the studies that present assessment metrics to evaluate sustainability [83,84,85] and resilience [86] of urban areas. The term indoor identifies studies focused on the investigation of the performances in terms of indoor thermal comfort [87,88,89]. The expression morphology modeling represents studies aiming at (i) a better parameterization of the urban morphology [90,91,92], (ii) the classification of urban structures [93,94,95], (iii) data extraction from imagery [96,97], and (iv) urban area modeling [98]. The expression urban model has been used to characterize studies focused on the analyses of urban dynamics, i.e., urban complexity [99]; pedestrian flows [100,101,102]; urban intensity [103,104]; city model as polycentric cities [105,106], compact cities [107], and concentric cities [108]; urban evolution [109,110,111,112,113,114,115,116,117,118]. The term transport denotes studies investigating the impact of urban morphology on the intersection traffic [119], goods movement [120], and multi-mode transport [121]. Finally, the term design indicates studies dealing with design strategies for mitigating flood risk [122], environmentally sustainable design [123], and optimized form generation [124]. It is worth noticing that this classification has been proposed for sorting the large number of documents that has been reviewed and identifying the documents in line with the scope of the present manuscript. The identified topics should not be interpreted as separated but intertwined, e.g., energy and microclimate [125,126,127,128,129,130,131], energy and indoor [132], energy and design [133], energy and assessment [134], and microclimate and design [135].
In line with the aim of this review, it was decided to focus further analyses on documents belonging to the following topics: energy, microclimate, indoor, and combinations of at least one of the previous topics. Table 1 reports the selected 79 manuscripts further analyzed highlighting (i) the reference, (ii) the authors, (iii) the topic investigated, (iv) the performance evaluated, (v) the methodology adopted, (vi) the morphology parameterization, (vii) the scale of investigation, and (viii) the document type. Regarding the studies conducted using simulations, also the employed tools have been indicated. Furthermore, the term energy has been used to denote documents that consider as performance both energy consumption or demand and energy production or potential. Overall, 17 documents are related to the topic energy and 10 manuscripts address combinations when the topic energy is present. In addition, 3 documents entail the topic indoor, and a manuscript addresses the combination of indoor with energy. The remaining 49 documents involve the topic microclimate (48), including combinations when the former is present. Of these 49 manuscripts, the majority (27) investigate in different ways wind flows in urban areas.
From the literature review, in the last ten years, urban ventilation established as a popular performance to be investigated in connection with urban morphology. Although a new concept since the first work was published only in 2011, amongst the 79 documents analyzed, 17 manuscripts investigate the relationship between urban morphology and ventilation. Specifically, 8 documents explicitly refer to urban ventilation performance, while 9 manuscripts address pollution. Bearing the definition of urban ventilation reported in the introduction and further analyzed in the following section, studies on pollutant dispersion and concentration may be included in this topic. However, to give more information to the readers about the performance indicators employed, it has been decided to report them separately in the table. As aforementioned, the first document, aiming at evaluating the urban ventilation performance, was published in 2011 [136]. This work aimed to improve the urban roughness parametrization in mesoscale models by expressing the ground coverage ratio as a function of the frontal area. The wind velocity ratio, i.e., the wind velocity in the area of interest and the wind velocity at a fixed position established as the reference, was chosen as the performance indicator. The wind velocity ratio was selected for the performance evaluation in other studies, mainly when the chosen case studies were actual urban areas. He et al. investigated the ventilation performance of the Greater Sydney Area, performing field measurements on two sunny days in 2019 [137]. Information about urban morphology has been provided in terms of building coverage ratio, street width, sky view factor; however, these parameters have been employed for describing the overall characteristics of the area, not for evaluating their impact on the ventilation performance. Zhao et al. evaluated the ventilation in Shenyang, China, by analyzing the data from 16 weather stations [138]. In this work, the urban morphology has been described using the Local Climate Zone (LCZ) classification [139]. The aim was not to correlate LCZs to ventilation performances but rather to evaluate the suitability of this classification for ventilation studies. Yuan performed numerical simulations for assessing the ventilation performance of an urban area in Hong Kong [140]. Finally, Wang et al. investigated the impact of different MPs on urban ventilation, performing numerical simulations using idealized urban models for investigating the impact of different MPs on urban ventilation [141]. The urban morphologies have been quantified using four parameters, i.e., the ground coverage ratio, the frontal area density, the plot ratio, and the building height differential.
The ventilation of urban tissues has also been assessed using as performance indicators indoor indices. Mei et al. explored the impact of building height variability, performing numerical simulations over simplified urban models using two indices, i.e., the air exchange rate per hour and the pollutant retention time [142]. Peng et al. performed numerical simulations in idealized urban models, whose morphology has been described using two parameters, i.e., the floor area ratio, and the building site coverage [143]. The ventilation performance has been assessed through six indices, i.e., the airflow rate, the mean age of air, the net escape velocity, the purging flow rate, the visitation frequency, and the resident time. Finally, another indicator used for urban ventilation performance is pollutant concentration. This indicator has been employed in two articles belonging to pollution in the performance category. In the first study, published in 2012, the pollutant transport from the ground level to the urban atmospheric boundary layer of idealized two-dimensional UC was explored by conducting wind tunnel experiments and numerical simulations and evaluating the scaled overall pollutant removal coefficient [144]. In the second work, the ventilation performance of four design scenarios has been investigated by conducting numerical simulations using simplified models of residential blocks in Port Said city, Egypt [145]. The ventilation performance has been assessed evaluating PM10 concentrations, while urban morphology has been quantified using several parameters, i.e., the absolute rugosity, the occlusivity factor, the plot area ratio, the volume area ratio, the plan area density, and the frontal area density. Unfortunately, the definition of the different morphological parameters is not provided. Urban ventilation has also been addressed at a larger scale, i.e., the city scale, for improving urban morphology parametrization in mesoscale models implementing a new method for calculating the frontal area density from annual wind probability data [146]. Finally, additional 10 manuscripts refer to the urban wind environment in different ways:
  • Investigating how to improve the urban canopy models coupled with mesoscale models to enhance the simulation of the wind speed and air temperature in complex urban environments, i.e., using high-spatial-resolution urban fraction [147]; developing a database for Beijing based on several parameters, i.e., the building height characteristics, the building plan area fraction, the frontal area density, the height-to-width ratio, and the sky view factor, [148]; implementing observational information of the sky view factor [149]; proposing a categorization of the building height based on the fractal dimension [150]; suggesting a formulation for the drag coefficient [127]; corroborating the causality between the accuracy of the parameterized urban morphometry and the reliability of the results of urban boundary layer simulations [151];
  • Evaluating the performance of the adopted simulation tools for analyzing the performance of two design scenarios in terms of solar irradiance, wind airflows, building indoor temperatures, and energy demand [128];
  • Applying parametric design optimization processes over conventional urban design processes to achieve more sustainable urban environments [135];
  • Providing a critical review on the properties influencing energy and airflows in urban neighborhoods [126];
  • Stressing the importance of identifying which urban morphology characteristics have the most significant impact on thermal comfort and how to mitigate the urban heat island effect [152].

Main Findings

The literature review provided in this section focus on two aspects:
  • The evaluation of the performance, in terms of methods, topics, and indicators.
  • The parameterization of the morphology, in terms of scale and parameters.
The following main conclusions may be drawn for each of the analyzed aspects.
Regarding performance, the most popular topics are energy and microclimate, and, in this regard, urban ventilation has gained popularity, especially in the last years. Ventilation is a fundamental topic to be addressed and involves a variety of phenomena [35]. The methods adopted for conducting the investigations are various, i.e., numerical simulations, laboratory experiments, and field measurements. Moreover, three main indicator categories may be identified, i.e., the mean velocity ratio, the pollutant concentration, and indoor indices.
Although it is widely recognized that urban morphology is fundamental in determining the performance of urban tissues [153], studies conducted using actual urban areas are rare due to the difficulties in modeling the phenomena and the high degree of specialization required [154]. Moreover, it emerges that tools for investigating the phenomena at the neighborhood scale are too specialized, and often they do not allow information exchange [155]. It is considered necessary to provide a critical literature review regarding urban ventilation studies to identify morphological parameters, investigation methods, and performance indicators applicable to the neighborhood scale in compact areas.
Table 1. Overview of studies aiming at evaluating the performance of urban tissues belonging to the topics: energy, microclimate, indoor, and combinations of the previous.
#RefsAuthorsYearTopicPerformanceMethodToolMorph.ScaleType
1[156]Palme et al.2020energycooling demandsim.BESnolotart.
2[157]Othman and Alshboul2020microcl.out. thermal comfortsim.Envimet AND Raymanyesislandart.
3[158]Ronchi et al.2020microcl.cooling capacitysim.InVESTyescityart.
4[159]Battisti2020microcl.out. thermal comfortsim.Envimet AND Raymannoislandart.
5[160]Uçlar and
Buldurur
2020energyheating consumptionstat.
analysis
-yesneighb.art.
6[131]Natanian et al.2020comb.1energy performance + out. thermal comfort + solar accesssim.Rhino + Grasshopper + pluginsyesneighb.art.
7[161]Leng et al.2020energyheating consumptionsim. + stat.
analysis
EnergyPlusyesneighb.art.
8[162]Apreda et al.2020microcl.air temp.sim.Envimetyesislandart.
9[137]He et al.2020microcl.urb. ventilation + out.
thermal comfort
meas. + sim.Raymanyesneighb.art.
10[163]Poon et al.2020energysolar energy potentialsim.Rhino + Grasshopper + pluginsyesneighb.art.
11[164]Liu and
Morawska
2020microcl.surface temp.sim.WRFyescityart.
12[89]Sadeghi et al.2020indoorind. comfortmeas. + sim.EnergyPlusno-art.
13[138]Zhao et al.2020microcl.urb. ventilationmeas.-yesneighb.art.
14[165]Nikoloudakis et al.2020microcl.air temp.mod. + meas.-yescityart.
15[166]Yuan et al.2020microcl.air temp.sim.ANSYS Fluentyesneighb.art.
16[167]Carpio-Pinedo et al.2020microcl.solar accessmod.-noislandart.
17[145]Hassan et al.2020microcl.pollutionsim.ANSYS Fluentyesislandart.
18[168]Salvati et al.2020energyenergy demandsim.UWG + TRNSYSyesneighb.art.
19[169]Zonato et al.2020microcl.air temp.mod. + sim.WRFyescityart.
20[170]Chokhachian et al.2020microcl.air temp. + solar access ind./out.sim.Rhino + Grasshopper + pluginsyesneighb.art.
21[171]Yoseph2020microcl.ind. comfortsim.Revit 2015-Ecotect + Grasshopper + pluginsnoislandbook
22[130]Javanroodi and Nik2019comb.1energy performancesim.ANSYS Fluent + EnergyPlusyesneighb.art.
23[172]Xu et al.2019bmicrocl.out. thermal comfortsim.OpenFOAM + Rhino + Grasshopper + pluginsyesneighb.art.
24[173]Ghassoun et al.2019microcl.pollutionmeas. + mod.-yescityart.
25[174]Xu et al.2019amicrocl.out. thermal comfortsim.Rhino + Grasshopper + pluginsnoneighb.art.
26[147]Shen et al.2019microcl.wind speed + air temp. + humiditysim.WRFyescityart.
27[175]He et al.2019microcl.urb. ventilationrev. + meth.-yesneighb.art.
28[176]Chatterjee et al.2019microcl.air temp.sim.Envimetyesneighb.art.
29[177]Salvati et al.2019microcl.air temp.sim.UWGyesneighb.art.
30[142]Mei et al.2019microcl.pollutionsim.OpenFOAMyesneighb.art.
31[148]X. He et al.2019microcl.air temp. + wind speedsim.WRFyescityart.
32[143]Peng et al.2019microcl.urb. ventilationsim.ANSYS Fluentyesneighb.art.
33[88]Claude et al.2019indoormold growthsim.EnergyPlusyesbuildingart.
34[129]Javanroodi et al.2018comb.1energy performancesim.Fluent + Rhino + Grashopper + EnergyPlusyesneighb.art.
35[178]Li et al.2018microcl.CO2 emissionsmod.-nocityart.
36[179]Amaral et al.2018energyenergy performancerev.-no-rev.
37[87]Chan and Liu2018indoorind. comfortsurvey-yesneighb.art.
38[180]Cody et al.2018energyenergy performancesim.IESVEyesbuildingart.
39[149]de Morais et al.2018microcl.wind speed + surf. temp.sim.TEByescityart.
40[181]Moraitis et al.2018energysolar energy potentialmod.-yesnationart.
41[182]Costanzo et al.2018energyenergy performancesim.Rhino + Grasshopper + pluginsnoneighb.art.
42[134]García-Pérez et al.2018comb.4global warming potentialstat. analysis-yescityart.
43[183]Hammerberg et al.2018microcl.air temp.sim.WRFyescityart.
44[140]Yuan2018microcl.urb. ventilationsim.ANSYS Fluentnoneighb.book
45[146]Yuan2018bmicrocl.urb. ventilationsim.MM5/CALMETyescitybook
46[184]Pili et al.2018energysolar energy potentialmod.GISnocityart.
47[185]Pacifici et al.2017microcl.air/surf. temp. +
humidity + illuminance
meas.-yesneighb.art.
48[186]Thouron et al.2017microcl.pollutionsim.WRF + POLAIR3Dyescityart.
49[187]Shi et al.2017energyform generationrev.-yes-rev.
50[188]Saratsis et al.2017microcl.solar accesssim.UrbanDaylight-DAYSIMyesislandart.
51[189]Palme et al.2017energycooling demandsim.UWG + TRNSYSyesneighb.art.
52[150]Li et al.2017microcl.air temp. + wind speedsim.WRFyescityart.
53[141]Wang et al.2017microcl.urb. ventilationsim.PALMyesneighb.art.
54[190]Perišić et al.2017microcl.pollutionmod.-nocityart.
55[191]Demuzere et al.2017energyenergy balancesim.ULSMs TERRA URB, CLM, SURFEX and SUEWSyescityart.
56[132]Braulio-Gonzalo et al.2016comb.2energy performance + ind. comfortsim.Design Builder + EnergyPlusyesneighb. + cityart.
57[192]Perišić et al.2016microcl.solar accesssim.Radianceyesislandart.
58[193]Guo et al.2016microcl.surface temp.mod.-yescityart.
59[194]Rodríguez Algeciras et al.2016microcl.out. thermal comfortsim.RayManyesislandart.
60[195]Taki and Alabid2016energyind. comfortsurvey + sim.EnergyPlusnobuildingbook
61[196]Jurelionis and Bouris2016energyenergy consumptionsim.CFD *yesneighb.art.
62[128]Gros et al.2016comb.1wind speed + surf. temp. + ind. temp. + cooling demandsim.EnviBatE + SOLENE-Microclimate + SATURNEnoneighb.art.
63[127]Gutiérrez et al.2015comb.1air temp. + wind speedsim.WRFyescityart.
64[126]Srebric et al.2015comb.1wind speed + energy consumptionrev.-yes-rev.
65[135]Taleb and Musleh2015comb.5wind speed + solar irradiationsim.CFX + Grasshopperyesneighb.art.
66[197]Oertel et al.2015microcl.out. thermal comfortmeas. + sim. + surveyRayMan Proyesneighb.art.
67[198]Sarralde et al.2015energysolar energy potentialmod.GISyesneighb.art.
68[199]Pay et al.2014microcl.pollutionsim.CALIOPE Air Quality Forecast Systemnocityart.
69[200]Bueno et al.2014microcl.air temp.sim.UWGyesneighb.art.
70[201]Hofman et al.2014microcl.pollutionmeas. + sim.AURORA + MIMOSA4yescityart.
71[125]Zhun Min Adrian et al.2013comb.1solar radiation + energy
consumption
meas. + sim.IESVEyesneighb.art.
72[151]Chan et al.2013microcl.wind speed + TKEsim.MM5yescityart.
73[152]Pattacini2012microcl.wind speedsim.Envimetyesneighb.art.
74[144]Leung et al.2012microcl.pollutionmeas. + sim.Fluentyesislandart.
75[202]Gros et al.2011microcl.solar radiationrev.-yes-rev.
76[136]Ng et al.2011microcl.urb. ventilationsim.MM5/CALMETyescityart.
77[133]Vahabzadeh Manesh et al.2011comb.3energy consumptionsim.*yesneighb.book-rev.
78[203]Salat2009energyheating consumptionsim.APURyesneighb.art.
79[204]Al-Maiyah and Elkadi2007microcl.solar accesssim.TOWNSCOPEnoislandart.
* The authors did not mention explicitly the employed software tool. Abbreviations: Regarding the topic: microcl. microclimate; comb. = combination; comb. 1 = energy + microclimate; comb. 2 = energy + indoor; comb. 3 = energy + design; comb. 4 = energy + assessment; comb. 5 = microclimate + design. Regarding the performance: ind. = indoor; out. = outdoor; surf. = surface; temp. = temperature; urb. = urban; TKE = turbulent kinetic energy. Regarding the method: meas. = measurements; meth. = methodology; mod. = models; rev. = review; sim. = simulations; stat. = statistical. Regarding the scale: neighb. = neighborhood. Regarding the type: art. = article; rev. = review.

5. Urban Ventilation

“The outdoor temperature, wind speed and solar radiation to which an individual building is exposed is not the regional “synoptic” climate, but the local micro-climate as modified by the “structure” of the city, mainly of the neighborhood where the building is located. … However, special details of the individual buildings can have significant impact on the exposure conditions and comfort of pedestrians in the streets. … the actual wind speed and turbulence in the streets, can vary significantly over very short distances, depending on some design details of the building along the street”.
[29]

5.1. Definition

Although studies of wind effects on the built environment established as a branch of civil engineering in the early 1960s [205], it is in the last two decades that the investigation of the interactions between airflow and urban morphology has gained popularity within the scientific community. Figure 10 reports the yearly distribution of manuscripts available in the Scopus database published between 1960 and 2021. Only research papers, review papers, books, and book chapters published in English have been considered. The terms used in the search query are: (i) “urban ventilation”, (ii) “wind flow” AND “urban area”, (iii) wind AND “urban morphology”, and (iv) “urban ventilation” AND “urban morphology”. The upward trends indicate the increased popularity of the topics, particularly notable in the second decades of the 2000s. Particularly evident is the increase in popularity of urban ventilation in the last four years. The reasons for such popularity may be identified in (i) the growing awareness among public opinion of the urgency of the sustainability in the urban environment; (ii) the increasing concern about the effects on human health of the exposure to high levels of pollutant concentrations [206] and poor wind conditions in the built environment [15]; and (iii) the progress made in the fields of computational power and instrument availability.
Addressing urban ventilation means considering cities as living organisms that breathe, introducing clean and fresh air within their tissues diluting in this way heat and pollution trapped in the urban canyons (Figure 11). Carrying on the analogy with other branches of science, e.g., anatomy and biology, terms like breathability introduced by Neophytou and Britter [207], and inhale and exhale effects introduced by Hang et al. [16] have started being used in the scientific literature for describing the urban ventilation and outdoor air exchange. Since urban ventilation results from the interaction between urban areas and airflows, it is essential to thoroughly investigate the relationship between urban morphology and local wind conditions. In this regard, many studies have been conducted and, although characterized by different approaches, methodologies, and parameters, a common theoretical background may be identified. The hypothesis is that urban tissues are polluted while the air coming from rural or marine surroundings is clean [208]. This hypothesis appears relevant and applicable to the reality of our cities, which are the places where people, activities, and structures concentrate. In fact, urban areas inevitably alter the radiative, thermo-hygrometric, and aerodynamic characteristics of the environment where they are located [209]. The consequence is a reduction in wind speed within and right above the urban tissues. It is a well-known phenomenon that contributes to the Urban Heat Island (UHI) effect and produces a reduction in the ability to remove heat and pollutants from urban canyons [14], compromising the beneficial effects of urban ventilation. In other words, an urban area exerts a resistance on the air mass, reducing its velocity and, consequently, the ability to wash out urban canyons. Since buildings are sharp-edged bluff bodies, the driving mechanism in the interaction between buildings and airflows is the form drag. Hence, the aerodynamic response of an urban area is influenced by its form, its morphology, which depends on (i) the characteristics of individual buildings, (ii) their mutual arrangements, and (iii) the characteristics of the area at larger scales. It is evident that an accurate description of urban morphology plays a primary role in urban ventilation investigations.

5.2. Morphological Parameters

Given the importance of urban morphology, many efforts have been devoted to identifying the parameters that could represent the aerodynamic response of urban areas at the neighborhood scale. Initially, urban morphology was described in wind engineering applications and pollutant dispersion studies employing parameters representative of the urban roughness [210]. The most common parameters are the aerodynamic roughness length, z0 [211,212,213], the displacement length, d [212,214], the zero-plane displacement height, zd [210,215,216,217,218], the drag coefficient, cd(z) [213,215,216,218,219], the exponent p of the power-law wind profile [212], the frontal area density, λf [220], the plan area density, λp [215,217,219], the layout pattern, i.e., aligned or staggered [215,219], and the building height or height variation [215,219]. Apart from the last four parameters that depend only on the physical characteristics of urban areas, the others have been derived from empirical relations obtained conducting wind tunnel experiments [220], mainly using idealized and simplified urban configurations, i.e., arrangements of cube-like buildings. Albeit useful to describe the overall effects of urban morphology on wind conditions, these parameters are highly sector-based and do not ease the knowledge sharing between two specialistic sectors, i.e., wind engineering and urban planning. Other parameters commonly used in these studies are the height-to-width ratio H/W, or UC aspect ratio, where H is the mean building height and W is the distance between two opposing buildings, and the length-to-height ratio, where L is the length of the canyon and H is the mean building height [221]. The former was commonly used for considering the effect of building density on flow regimes [209,215,222,223]. Finally, attempts have been made to obtain the aerodynamic parameters using morphometric methods in real cities [220]. Figure 12 reports examples of the abovementioned studies.
As the topic’s popularity grew, many efforts have been made to analyze the effects of urban morphology on urban ventilation. The morphological parameters adopted for the investigations are various and depend on the phenomena under investigation and the scale of interest. Excluding studies focused only on single buildings as beyond the scope of the present research, three different urban models may be identified, i.e., two-dimensional (2D) and three-dimensional (3D) UCs and 3D urban arrays. Urban models are selected to investigate the effects of certain morphological parameters on specific phenomena at the relevant scale [224,225]. Therefore, studies performed using 2D UCs mainly aim at investigating the impact of the UC aspect ratio [223,226,227,228], the roof shape [229,230], and the height or height variation [229,231] (Figure 13). Studies performed using 3D UCs are mainly focused on the UC aspect ratio [232], the roof shape [233], the height or height variation [234]; the L/H or UC length-to-height ratio [221,235], and the orientation of the UC compared to the direction of the approaching wind [234] (Figure 14). Finally, studies performed using 3D urban arrays generally aim at investigating the effects of the UC aspect ratio [236,237], L/H [237], array layout types [238], building height or building height variation [237,239,240,241], plan area density λp [219,242,243,244,245,246,247], frontal area density λf [242,243,245,246,248,249], and orientation [27,250,251] (Figure 15). Note that this classification has been proposed only for the sake of clarity. Single MPs should not be regarded as exhaustive to represent the investigated phenomena. In many studies, various MPs have been considered. A comprehensive overview of morphological parameters used in urban ventilation studies may be found in [64].
Studies aiming at assessing the impact of morphological parameters on urban ventilation are usually performed on idealized case studies. The idealized urban models are composed of simplified building geometries, usually comprising cubes or rectangular parallelepipeds, grouped to typify the area of interest. Albeit useful to investigate specific features of the phenomenon, idealized urban models may not represent the complexity of actual urban areas. Hence, investigations of the relationship between urban morphology and ventilation in actual urban tissues are of paramount importance. However, studies that aim at investigating correlations between MPs and urban ventilation performances are rare [64,252,253,254]. Each of the previous studies focused on sets of MPs: the plan area density and the floor space index [252]; the plan area density, the sky view factor, the tree view factor, and the green plot ratio [253]; the plan area density, the mean building height, the maximum building height, the standard deviation of the building height, and the façade area ratio [254]; and the plan area density, the mean building height, the root mean square of the building heights, the median of the building heights, the area-weighted mean building height, the volume density, and the façade area density [64]. Actual urban areas are used as case studies mainly for describing phenomena in specific contexts or for verifying the accuracy of computational setups [41,143,224,255,256,257,258,259,260,261,262,263,264,265,266,267,268,269,270,271].

5.3. Investigation Methods

Urban ventilation is a phenomenon belonging to the so-called urban physics, i.e., an applied discipline, inherently multidisciplinary, aiming to investigate the physical processes in urban areas [17]. Overall, these processes can be described as heat and mass transfers in outdoor and indoor urban environments studied at different observation scales [17]. Variables and parameters in play are various and intertwined, ranging from the human scale, less than 1 m, to the meteorological microscale, up to 2 km (Figure 16a). Therefore, the complexity characterizing urban physics studies is evident and affects methods and tools available for the investigations that are usually highly specialized and little interconnected. Focusing on the investigation of urban ventilation, the main phenomena of interest are (i) turbulence, (ii) building wakes, (iii) plumes, (iv) heat transfer, (v) convective flows, and (vi) advective flows (Figure 16b). The investigation methods usually employed to analyze these phenomena are three: (i) in situ measurements [253], (ii) laboratory measurements [242,252,272], and (iii) numerical simulations [64,142,143,254]. This feature is supported by the outcomes of the literature review presented in Section 4. Each method offers advantages and disadvantages that should be carefully considered, before starting the investigation, to select the appropriate approach and tool [224].
Regarding in situ measurements, the main advantage is that they can capture the complexity of the phenomena under investigation since the boundary conditions are real; however, this characteristic also determines the main disadvantages of the method. Firstly, measurements are not performed in a controlled environment and, therefore, they are subject to meteorological conditions and cannot be replicated. Secondly, the measurements are usually performed point by point, especially for air temperatures and wind speed and direction, due to the specific characteristics of the instruments (e.g., thermometers, Light Detection and Ranging, and anemometers). Hence, it is not possible to have data for the entire area under investigation. Using many instruments simultaneously could provide an amount of data sufficient to be representative of larger areas. Nevertheless, this affects the cost of the campaign and requires careful calibration of the devices to ensure consistency of the results. Finally, in situ measurements are possible only for existing case studies; consequently, they cannot be used for parametric or feasibility studies.
Another investigation method is represented by laboratory measurements that are usually performed using wind tunnels or water channels. Laboratory measurements allow a high control over the boundary conditions and may be employed for conducting parametric studies and analyses preliminary to the construction phase. However, the most common techniques involve measurements performed point by point. Despite the existence of techniques that allow obtaining information on planes or entire volumes, e.g., Particle Image Velocimetry (PIV) and Laser-Induced Fluorescence (LIF), these methods are not yet frequently used because of the costs and the limitations for complex geometries due to the mutual obstructions caused by building models. Finally, another issue is the adherence to the so-called similitude theory, i.e., the geometric, kinematic, dynamic, and thermodynamic similarities, that need to be considered when experiments with scaled models are conducted.
Finally, numerical simulations prove to be a powerful investigation method because they may overcome the main disadvantages of the previous methods. Numerical simulations provide detailed information of all simulated variables in the entire computational domain, allow full control over the boundary conditions, and can be performed also for parametric and feasibility studies. Nevertheless, this method presents potential disadvantages typical of numerical techniques. Consequently, scrupulous attention must be paid to building the model, generating the computational grid, selecting the turbulence model, and setting the boundary conditions that need to be realistic to obtain meaningful results. In this regard, several guidelines have been developed in the last fifteen years to assist researchers and professionals [273,274,275,276]. Nevertheless, it is fundamental to stress the necessity to conduct validation studies of the computational settings prior to the actual investigation to verify the reliability of the results. In this case, there are guidelines helpful for identifying validation metrics [277] and grid-convergence procedure [278]. Regarding numerical simulations, urban ventilation is usually investigated employing two approaches, i.e., Large Eddy Simulation (LES) and Reynolds-averaged Navier–Stokes (RANS) approaches. Although the LES approach yields more accurate results, the RANS approach is still widely used in both research and engineering practice [279]. In fact, despite the remarkable progress achieved in computational power, LES simulations are still computationally expensive and, at the moment, hardly embedded into the design process. In Figure 16b the wide range of atmospheric phenomena that can be simulated using the RANS approach is reported.
Figure 16. (a) Schematic representation of the spatial of interest in urban ventilation studies highlighting their typical maximum horizontal length scales and models, modified from [17]; and (b) spatial and temporal scales of atmospheric phenomena and their parameterization in RANS model, modified from [280].
Sustainability 14 03948 g016

5.4. Performance Indicators

Regardless of the investigation method adopted, urban ventilation performance is assessed using different indicators. Initially, the aerodynamic response of urban areas has been evaluated in terms of drag coefficient to assess the resistance exerted by buildings on wind flows [215,216,218,219,242,248,249,273,281,282,283,284] and pressure coefficient to estimate the load induced by wind flows on building surfaces [215,223]. Recently, two new indicators have been introduced for considering the resistance exerted on airflows, i.e., the friction factor [284] and friction coefficient [230]. Another approach adopted to investigate urban ventilation is to focus on the exchange between in-canyon and above-canyon areas [245,260,285]. For this purpose, Bentham and Britter introduced two models: the spatially and temporally averaged advection velocity within the urban canopy, constant across the height of the canyon, UC, and the spatially averaged exchange velocity between in-canopy and above-canopy flow, UE [286]. Similarly, indicators like flow rate [287] and pollutant flux or pollutant transport rates [240,288] have been used to quantify the exchange of the area of interest with the surroundings. In addition, the evaluation of pollutant concentration fields has also been considered useful for exploring the ventilation performance of urban areas [289,290,291,292]. Pollutant concentrations can be evaluated both on surfaces and as the bulk concentration in the whole canyon [223]. Nevertheless, disadvantages in analyzing pollutant concentration distributions have been pointed out, as pollutant concentrations are dependent on the location and the type of the source [293]. Specifically, Bady, Kato, and Huang remarked on the necessity to set indices for evaluating air quality. For this purpose, indices developed for indoor ventilation studies started being used since a similarity between the processes involved in urban and indoor ventilation [294] has been recognized. Generally, the indices used in these analyses are the Visitation Frequency (VF), the Purging Flow Rate (PFR), the average staying time (TP), the age of air (τ), and the air exchange rate (ACH). VF represents the average frequency with which pollutants generated in the local domain return to the local domain after being transported outside; PFR is the effective airflow rate required to remove the pollutant from the local domain; TP represents the time the pollutant takes from once entering into or being generated in the domain until its leaving; and τ represents the time a particle of external air takes to replace a particle of air in a specific location inside the domain. Incidentally, Hang et al. proposed using the concept of local age of air adapting the homogeneous emission method, originally developed for indoor experiments using the tracer gas techniques [294,295], to overcome the disadvantages related to the dependence on the pollutant source and for focusing the causes of the concentration [208]. The work by Huang et al. represents the first attempt in English at employing VF, PFR, TP, ACH for evaluating the ventilation within an actual urban area in Japan [296]. In the last years, many studies using ventilation indices have been performed for analyzing the impact of urban morphologies on ventilation [16,27,234,236,237,240,241,264,285,287,288,297,298,299,300,301,302]. It is worth noting that most of the studies employing ventilation indices have been performed using idealized urban models. This characteristic is due to the difficulties encountered in applying the indices in actual urban areas, where morphologies are often irregular and inhomogeneous, and boundaries are difficult to be defined. To overcome these issues, a new index has been introduced recently, i.e., the air delay τ d ¯ [264]. A complete review of ventilation indices is provided by Peng et al. [303]. Finally, another indicator for evaluating urban ventilation is the spatially averaged wind velocity ratio (mWVR). This indicator has been proven as useful in both idealized [238,239,241,243,304,305] and actual urban areas [64,252,253,254]. Moreover, this indicator is very useful because it has been used also for studying pedestrian comfort related to low wind speed [43]; for evaluating computational settings [232]; and for supporting optimization procedures [306,307,308,309]. It is worth noticing that the abovementioned parameters may be used in combination.

5.5. Main Findings

From the literature review provided in this section, the following main conclusions may be drawn for each of the analyzed aspects, i.e., morphological parameters (MPs), investigation methods, and performance indicators.
Regarding the MPs, the main features to consider for describing a single building are the building plan area or footprint (AB), the shape, the building height (HB), the building volume (VB), the building façade area (SB), and the orientation in relation to wind direction. From the viewpoint of urban arrangements, the morphological characteristics to consider are the layout type, the orientation in relation to the wind direction, the mean building height (HMB), building height variation (σB), the plan area density (λp), and frontal area density (λf). Note that λf is the ratio between the total projected area of building vertical surfaces facing the approaching wind direction and the total land area; therefore, it is possible to compute this parameter only when information about the direction of the approaching wind is available. Since urban ventilation studies conducted using actual case studies employ the façade area density (λfac), it has been decided to replace λf with λfac. Figure 17 reports the graphical definitions of the MPs selected for conducting urban ventilation investigations in actual urban areas.
Regarding the investigation method, it is possible to claim that numerical simulations performed using the RANS approach represent a valid and versatile method for investigating the relationship between urban ventilation and urban morphology.
Regarding the performance indicator, mWVR proves to be a versatile indicator. Therefore, it has been identified as useful to investigate the impact of morphological parameters on urban ventilation in actual urban areas. Finally, it is suggested also to employ τ because it may provide information about the level of entrapment of exhausted air within the UCs. This index may be valid for comparing different scenarios.

6. Urban Ventilation Performance Assessment Methodology

Air pollution and heat stress constitute two increasing threats to human health and well-being that need to be faced immediately. Urban ventilation may favor the mitigation of detrimental effects of air pollution and heat stress on human life. In the last decades, a tendency towards urban tissue densification may be observed to counteract the indefinite development of low-density urban areas into natural surroundings and implement sustainability in the urban environment. Urban tissue densification may be achieved through more compact built areas, preferring the vertical to the horizontal development of buildings. This strategy affects the urban wind environment and may reduce urban ventilation performances significantly, compromising its beneficial effects. Hence, regenerating existing, well-structured, and stratified urban areas by densification is not an easy challenge. Therefore, a multidisciplinary methodology is presented in this section for embedding urban ventilation performance evaluation into urban management and planning processes. This methodology builds upon the performance-based approach and is supported by the conceptual framework and the literature reviews provided through the paper.
Figure 18 reports the workflow for urban renewal plans that aim at improving urban ventilation performance. The potential risks associated with the densification of urban tissues are pollution, stagnant air, and thermal discomfort. Consequently, adequate levels of urban ventilation have been identified as the desired performance. The mean wind speed ratio, the mean wind field, i.e., mean wind speed and direction, and the age of air have been identified as valid performance indicators to assess ventilation performance and, therefore, the success of the planned strategy. The evaluation may be carried out by comparing different scenarios, highlighting, for instance, the improvements achieved compared to the current state. In addition, regulations and comfort criteria may be employed. Besides the standards mentioned in the introduction, several wind comfort criteria may be found in the literature [252,310,311,312]. In this regard, Table 2 reports the criteria for highlighting wind speed ranges that cause thermal discomfort. These criteria appear particularly effective in the case of compact urban areas, where low wind conditions are usually found. Finally, the proposed procedure may be used for both monitoring the ventilation performance and identifying possible hot spots during heatwaves in the area of interest.
After the workflow description, it is possible to present the multidisciplinary methodology for assessing urban ventilation in existing urban areas (Figure 19). This methodology consists of three phases: the physical structure quantification, the wind environment simulation, and the performance evaluation. In Figure 19, an additional preliminary step comprising area selection and data collection has been reported. The data to collect pertain to urban morphology and microclimatic conditions, including air quality reports. This information is fundamental for generating 2D and 3D models of the area and setting the boundary conditions for the numerical simulations. In this regard, data measured at a nearby airport or rural surroundings are essential. It is worth noting that data collection is crucial since the availability and genuineness of the data affect the results of the investigations. However, it has been described as an additional preliminary phase to remark the need for available databases. These databases should be comprehensive, reliable, and fully accessible by planners and policymakers to guarantee the homogeneity of the data and the reliability of the results.
Once the data related to the physical structure have been collected, it is possible to create the GIS model of the area if this is not available. In this regard, national and international efforts and resources have been devoted recently to creating databases and GIS models. A GIS model is advantageous for performing morphological analyses, calculating MPs, and storing data of different nature, i.e., qualitative and quantitative. This phase is also significant for setting effective strategies considering the climatic conditions. As concluded in Section 5, the MPs of interest are plan area density, area-weighted mean building height, volume density, and façade area density. It is suggested to consider also other parameters related to building height, e.g., the mean building height, the root mean square of the building heights, the median of the building heights. Albeit employed mainly in studies conducted using idealized urban models, these parameters have been regarded as relevant in the literature. Figure 20 reports examples of morphological analyses performed using GIS software. The compact area selected for the study is the Tuscolano–Don Bosco district in Rome, Italy. The investigations have been carried out using the open-source GIS software QGIS [313]. The open-source GIS software proves to be very useful because it allows:
  • Checking the feature topologies on point, line, and polygon layers automatically by setting specific rules;
  • Cleaning topology errors automatically;
  • Adding missing details and features;
  • Extracting information from raw data;
  • Combining information for calculating MPs employing algorithms and scripts.
Figure 20. Examples of morphological analyses performed using GIS tools: (a) building plan, (b) building construction age, (c) building height, (d) perspective view of selected areas (modified from Google Maps), (e) building typologies, and (f) morphological parameters.
Sustainability 14 03948 g020
These characteristics offer the ability to study vast areas and handle a large amount of data, making the methodology particularly valuable for policymakers. In this work, the primary data have been retrieved from the open database provided by the regional authority [314]. The selected MPs have been calculated from three sets of data: the building footprint area, the elevation above sea level of the foot and the top of every building, and details on the street network. Furthermore, information about building construction age and building typology has been added by the authors.
Once information about urban morphology and microclimatic conditions have been collected and checked, it is possible to start the second phase, i.e., the wind environment simulation. In the previous section, it has been reported that 3D RANS simulations prove to be a valid investigation method. Therefore, starting from the 2D GIS model, the computational domain and the grid should be generated. Meticulous attention should be paid because the accuracy of the results depends amongst many other factors on the resolution and quality of the grid. Nevertheless, these characteristics influence the computational cost of the simulations. Therefore, a compromise between the simplification of the model and the feasibility of the simulations should be reached. Figure 21 shows the high-resolution grid generated for evaluating the ventilation performance of the selected case study. After the grid generation, it is possible to define computational setup and solver setting. To accurately represent the surroundings of the area of interest while setting inflow and boundary conditions, a land-use map [315] may be used for estimating the aerodynamic roughness length according to the Davenport–Wieringa roughness classification [212]. Once the computational setup has been defined, it is possible to perform the simulations and compute the selected performance indicators.
Finally, phase three entails the performance evaluation using data analysis. This phase may be conducted using datasheets or creating scripts in programming and numeric computing platforms, e.g., MATLAB, that can process data automatically. Afterward, results may be processed employing GIS software to generate maps that ease monitoring and may also be used by no specialists.

7. Conclusions

Albeit essential for curbing heat stress and pollution in existing urban areas, the investigation of urban ventilation is not yet commonly embedded into the management and planning of urban areas. Through literature review and discussion, this paper proposes a workflow for urban renewal plans that aim at improving urban ventilation performance and builds up a multidisciplinary methodology for assessing the urban ventilation performance in existing urban areas. The methodology consists of three main phases: the physical structure quantification, the wind environment simulation, and the performance evaluation. Regarding the physical structure, morphological parameters valid for its quantification and tools for the data aggregation are provided. Regarding the wind environment, 3D RANS simulations are suggested as valid methods for analyzing the wind environment and computing the performance indicators. Regarding the performance evaluation, three possibilities have been indicated.
The proposed methodology may be applied to both research and professional purposes. As a research tool, this methodology may be used for investigating the correlation between urban ventilation and morphology improving prediction models for estimating ventilation performances without running simulations. In addition, the methodology may be employed for implementing comfort criteria and regulations that are scarce in the case of weak wind conditions. As a professional tool, this methodology may be applied: (i) in case of renewal plans, for assessing the achievement of objectives and prioritizing actions, and (ii) in case of urban management, for identifying areas exposed potentially to poor air conditions, and, therefore, vulnerable to pollution and heat stress.
Further developments may imply the integration of the methodology into generation and optimization design processes. Finally, the methodology may be further improved by employing transient simulations for solar radiation and heat transfer calculation. Nevertheless, preliminary results suggest that this may significantly affect the computational cost and time of the simulations, undermining the integration of the analyses into the urban management and planning processes.

Author Contributions

Conceptualization, O.P. and C.C.; methodology, O.P.; writing—original draft preparation, O.P.; writing—review and editing, O.P. and C.C.; supervision, C.C. All authors have read and agreed to the published version of the manuscript.

Funding

This research received no external funding.

Conflicts of Interest

The authors declare no conflict of interest.

References

  1. United Nations, Department of Economic and Social Affairs, Population Division. World Urbanization Prospects: The 2018 Revision; United Nations: New York, NY, USA, 2019. [Google Scholar] [CrossRef] [Green Version]
  2. Eurpoean Commission. Making Our Cities Attractive How the EU Contributes to Improving the Urban Environment; Publications Office of the European Union: Luxembourg, 2010; ISBN 9789279162985. [Google Scholar]
  3. EEA. Air Quality in Europe—2020 Report; EEA: Copenhagen, Denmark, 2020; ISBN 978-92-9480-292-7. [Google Scholar]
  4. Giorgi, F. Climate Change Hot-Spots. Geophys. Res. Lett. 2006, 33, 1–4. [Google Scholar] [CrossRef]
  5. Giorgi, F.; Lionello, P. Climate Change Projections for the Mediterranean Region. Glob. Planet. Change 2008, 63, 90–104. [Google Scholar] [CrossRef]
  6. United Nations, Department of Economic and Social Affairs, Population Division. World Population Prospects 2019: Highlights; United Nations: New York, NY, USA, 2019; ISBN 9789211483161. [Google Scholar]
  7. World Development Indicators|DataBank. Available online: https://databank.worldbank.org/reports.aspx?source=world-development-indicators (accessed on 2 April 2021).
  8. United Nations. Transforming Our World: The 2030 Agenda for Sustainable Development; United Nations: Manhattan, NY, USA, 2015. [Google Scholar]
  9. EEA. Air Quality in Europe—2017 Report; EEA: Copenhagen, Denmark, 2017; ISBN 9789292139216. [Google Scholar]
  10. Watts, N.; Amann, M.; Arnell, N.; Ayeb-Karlsson, S.; Beagley, J.; Belesova, K.; Boykoff, M.; Byass, P.; Cai, W.; Campbell-Lendrum, D.; et al. The 2020 Report of The Lancet Countdown on Health and Climate Change: Responding to Converging Crises. Lancet 2021, 397, 129–170. [Google Scholar] [CrossRef]
  11. EASAC. The Imperative of Climate Action to Protect Human Health in Europe. Opportunities for Adaptation to Reduce the Impacts, and for Mitigation to Capitalise on the Benefits of Decarbonisation; EASAC: Halle, Germany, 2019; ISBN 9783804740112. [Google Scholar]
  12. Heat and Health—European Climate and Health Observatory. Available online: https://climate-adapt.eea.europa.eu/observatory/evidence/health-effects/heat-and-health/heat-and-health (accessed on 5 January 2021).
  13. United Nations. World Urbanization Prospects: The 2014 Revision; United Nations: New York, NY, USA, 2014; ISBN 9789211515176. [Google Scholar]
  14. Oke, T.R.; Maxwell, G.B. Urban Heat Island Dynamics in Montreal and Vancouver. Atmos. Environ. 1975, 9, 191–200. [Google Scholar] [CrossRef]
  15. Ng, E. Policies and Technical Guidelines for Urban Planning of High-Density Cities—Air Ventilation Assessment (AVA) of Hong Kong. Build. Environ. 2009, 44, 1478–1488. [Google Scholar] [CrossRef] [PubMed]
  16. Hang, J.; Li, Y.; Buccolieri, R.; Sandberg, M.; Di Sabatino, S. On the Contribution of Mean Flow and Turbulence to City Breathability: The Case of Long Streets with Tall Buildings. Sci. Total Environ. 2012, 416, 362–373. [Google Scholar] [CrossRef] [PubMed]
  17. Blocken, B. Computational Fluid Dynamics for Urban Physics: Importance, Scales, Possibilities, Limitations and Ten Tips and Tricks towards Accurate and Reliable Simulations. Build. Environ. 2015, 91, 219–245. [Google Scholar] [CrossRef] [Green Version]
  18. Toparlar, Y.; Blocken, B.; Maiheu, B.; van Heijst, G.J.F. A Review on the CFD Analysis of Urban Microclimate. Renew. Sustain. Energy Rev. 2017, 80, 1613–1640. [Google Scholar] [CrossRef]
  19. D’ippoliti, D.; Michelozzi, P.; Marino, C.; De’donato, F.; Menne, B.; Katsouyanni, K.; Kirchmayer, U.; Analitis, A.; Medina-Ramón, M.; Paldy, A.; et al. The Impact of Heat Waves on Mortality in 9 European Cities: Results from the EuroHEAT Project. Environ. Health 2010, 9, 37. [Google Scholar] [CrossRef] [Green Version]
  20. Ward, K.; Lauf, S.; Kleinschmit, B.; Endlicher, W. Heat Waves and Urban Heat Islands in Europe: A Review of Relevant Drivers. Sci. Total Environ. 2016, 569–570, 527–539. [Google Scholar] [CrossRef]
  21. Seaton, A.; Godden, D.; MacNee, W.; Donaldson, K. Particulate Air Pollution and Acute Health Effects. Lancet 1995, 345, 176–178. [Google Scholar] [CrossRef]
  22. Gasparrini, A.; Guo, Y.; Hashizume, M.; Lavigne, E.; Zanobetti, A.; Schwartz, J.; Tobias, A.; Tong, S.; Rocklöv, J.; Forsberg, B.; et al. Mortality Risk Attributable to High and Low Ambient Temperature: A Multicountry Observational Study. Lancet 2015, 386, 369–375. [Google Scholar] [CrossRef]
  23. Cárdenas Rodríguez, M.; Dupont-Courtade, L.; Oueslati, W. Air Pollution and Urban Structure Linkages: Evidence from European Cities. Renew. Sustain. Energy Rev. 2016, 53, 1–9. [Google Scholar] [CrossRef]
  24. WHO. WHO Expert Consultation: Available Evidence for the Future Update of the WHO Global Air Quality Guidelines (AQGs). Meeting Report. Bonn, Germany, 29 September–1 October 2015. Available online: https://www.euro.who.int/__data/assets/pdf_file/0013/301720/Evidence-future-update-AQGs-mtg-report-Bonn-sept-oct-15.pdf (accessed on 10 December 2021).
  25. Watts, N.; Amann, M.; Arnell, N.; Ayeb-Karlsson, S.; Belesova, K.; Berry, H.; Bouley, T.; Boykoff, M.; Byass, P.; Cai, W.; et al. The 2018 Report of the Lancet Countdown on Health and Climate Change: Shaping the Health of Nations for Centuries to Come. Lancet 2018, 392, 2479–2514. [Google Scholar] [CrossRef]
  26. Mitchell, D.; Kornhuber, K.; Huntingford, C.; Uhe, P. The Day the 2003 European Heatwave Record Was Broken. Lancet Planet. Health 2019, 3, e290–e292. [Google Scholar] [CrossRef] [Green Version]
  27. Ramponi, R.; Blocken, B.; de Coo, L.B.; Janssen, W.D. CFD Simulation of Outdoor Ventilation of Generic Urban Configurations with Different Urban Densities and Equal and Unequal Street Widths. Build. Environ. 2015, 92, 152–166. [Google Scholar] [CrossRef] [Green Version]
  28. Yim, S.H.L.; Fung, J.C.H.; Ng, E.Y.Y. An Assessment Indicator for Air Ventilation and Pollutant Dispersion Potential in an Urban Canopy with Complex Natural Terrain and Significant Wind Variations. Atmos. Environ. 2014, 94, 297–306. [Google Scholar] [CrossRef]
  29. Givoni, B. Urban Design in Different Climates; World Meteorological Organization: Geneva, Switzerland, 1989. [Google Scholar]
  30. Stathopoulos, T. Pedestrian Level Winds and Outdoor Human Comfort. J. Wind Eng. Ind. Aerodyn. 2006, 94, 769–780. [Google Scholar] [CrossRef]
  31. Mochida, A.; Lun, I.Y.F. Prediction of Wind Environment and Thermal Comfort at Pedestrian Level in Urban Area. J. Wind Eng. Ind. Aerodyn. 2008, 96, 1498–1527. [Google Scholar] [CrossRef]
  32. Blocken, B.; Stathopoulos, T. CFD Simulation of Pedestrian-Level Wind Conditions around Buildings: Past Achievements and Prospects. J. Wind Eng. Ind. Aerodyn. J. 2013, 121, 138–145. [Google Scholar] [CrossRef]
  33. van Druenen, T.; van Hooff, T.; Montazeri, H.; Blocken, B. CFD Evaluation of Building Geometry Modifications to Reduce Pedestrian-Level Wind Speed. Build. Environ. 2019, 163, 106293. [Google Scholar] [CrossRef]
  34. Blocken, B.; Carmeliet, J. Pedestrian Wind Environment around Buildings: Literature Review and Practical Examples. J. Therm. Envel. Build. Sci. 2004, 28, 107–159. [Google Scholar] [CrossRef]
  35. Ratti, C.; Di Sabatino, S.; Britter, R. Urban Texture Analysis with Image Processing Techniques: Winds and Dispersion. Theor. Appl. Clim. 2006, 84, 77–90. [Google Scholar] [CrossRef]
  36. Pelorosso, R. Modeling and Urban Planning: A Systematic Review of Performance-Based Approaches. Sustain. Cities Soc. 2020, 52, 101867. [Google Scholar] [CrossRef]
  37. NEN. Netherlands Normalisation Institute Wind Comfort and Wind Danger in the Built Environment; NEN: Delft, The Netherlands, 2006. [Google Scholar]
  38. Ratcliff, M.A.; Peterka, J.A. Comparison of Pedestrian Wind Acceptability Criteria. J. Wind Eng. Ind. Aerodyn. 1990, 36, 791–800. [Google Scholar] [CrossRef]
  39. Murakami, S.; Uehara, K.; Komine, H. Amplification of Wind Speed at Ground Level Due to Construction of High-Rise Building in Urban Area. J. Wind Eng. Ind. Aerodyn. 1979, 4, 343–370. [Google Scholar] [CrossRef]
  40. Sanz-Andres, A.; Cuerva, A. Pedestrian Wind Comfort: Feasibility Study of Criteria Homogenisation. J. Wind Eng. Ind. Aerodyn. 2006, 94, 799–813. [Google Scholar] [CrossRef] [Green Version]
  41. Blocken, B.; Janssen, W.D.; van Hooff, T. CFD Simulation for Pedestrian Wind Comfort and Wind Safety in Urban Areas: General Decision Framework and Case Study for the Eindhoven University Campus. Environ. Model. Softw. 2012, 30, 15–34. [Google Scholar] [CrossRef]
  42. Blocken, B.; Stathopoulos, T.; van Beeck, J.P.A.J. Pedestrian-Level Wind Conditions around Buildings: Review of Wind-Tunnel and CFD Techniques and Their Accuracy for Wind Comfort Assessment. Build. Environ. 2016, 100, 50–81. [Google Scholar] [CrossRef]
  43. Du, Y.; Mak, C.M.; Kwok, K.; Tse, K.T.; Lee, T.C.; Ai, Z.; Liu, J.; Niu, J. New Criteria for Assessing Low Wind Environment at Pedestrian Level in Hong Kong. Build. Environ. 2017, 123, 23–36. [Google Scholar] [CrossRef] [Green Version]
  44. Jenks, M.; Jones, C. Issues and Concepts. In Dimensions of the Sustainable City; Jenks, M., Jones, C., Eds.; Springer Science+Business Media: Berlin, Germany, 2010; pp. 1–20. ISBN 978-1-4020-8646-5. [Google Scholar]
  45. Ripoll Bosch, R.; Giampietro, M. Report on EU Socio-Ecological systems. MAGIC (H2020–GA 689669) Project Deliverable 4.2, Revision. 2019. Available online: https://magic-nexus.eu/documents/d42-report-eu-socio-ecological-systems (accessed on 16 January 2020).
  46. Neumann, L.A.; Markow, M.J. Performance-Based Planning and Asset Management. Public Work. Manag. Policy 2004, 8, 156–161. [Google Scholar] [CrossRef]
  47. Ronchi, S.; Arcidiacono, A.; Pogliani, L. Integrating Green Infrastructure into Spatial Planning Regulations to Improve the Performance of Urban Ecosystems. Insights from an Italian Case Study. Sustain. Cities Soc. 2020, 53, 101907. [Google Scholar] [CrossRef]
  48. Kendig, L. Performance Zoning; Planners Press (American Planning Association): Chicago, IL, USA, 1980; ISBN 978-0918286185. [Google Scholar]
  49. Porter, D.R.; Phillips, P.L.; Lassar, T.J. Flexible Zoning: How It Works; Urban Land Institute: Washington, DC, USA, 1988. [Google Scholar]
  50. Frew, T.; Baker, D.; Donehue, P. Performance Based Planning in Queensland: A Case of Unintended Plan-Making Outcomes. Land Use Policy 2016, 50, 239–251. [Google Scholar] [CrossRef]
  51. Baker, D.C.; Sipe, N.G.; Gleeson, B.J. Performance-Based Planning. Perspectives from the United States, Australia, and New Zealand. J. Plan. Educ. Res. 2006, 25, 396–409. [Google Scholar] [CrossRef]
  52. Botequilha-Leitão, A.; Díaz-Varela, E.R. Performance Based Planning of Complex Urban Social-Ecological Systems: The Quest for Sustainability through the Promotion of Resilience. Sustain. Cities Soc. 2020, 56, 102089. [Google Scholar] [CrossRef]
  53. Menner, W.A. Introduction to Modeling and Simulation Techniques. 1995. Available online: https://www.jhuapl.edu/TechDigest/Archives (accessed on 16 January 2020).
  54. Maria, A. Introduction to Modeling and Simulation. In Proceedings of the Winter Simulation Conference, Atlanta, GA, USA, 7–10 December 1997. [Google Scholar] [CrossRef]
  55. Conzen, M.R.G. Alnwick, Northumberland: A Study in Town-Plan Analysis; Wiley on behalf of The Royal Geographical Society (with the Institute of British Geographers): London, UK, 1960. [Google Scholar]
  56. Martin, L.; March, L. Urban Space and Structures; Cambridge University Press: Cambridge, UK, 1972. [Google Scholar]
  57. Moudon, A.V. Getting to Know the Building Landscape: Typomorphology. Type Ordering Space 1994, 16, 289–311. [Google Scholar]
  58. Moudon, A.V. Urban Morphology as an Emerging Interdisciplinary Field. Urban Morphol. 1997, 1, 3–10. [Google Scholar]
  59. Steemers, K.; Ramos, M.; Sinou, M. Urban Morphology. In Design Open Spaces in the Urban Environment: A Bioclimatic Approach; Centre for Renewable Energy Sources: Athens, Greece, 2004; pp. 17–22. ISBN 9789896540821. [Google Scholar]
  60. Berghauser Pont, M.; Haupt, P. Space, Density and Urban Form; Technische Universiteit Delft: Delft, The Netherlands, 2009; Volume 29. [Google Scholar]
  61. Churchman, A. Disentangling the Concept of Density. J. Plan. Lit. 1999, 13, 389–411. [Google Scholar] [CrossRef]
  62. Alexander, E.R. Density Measures: A Review and Analysis. J. Archit. Plann. Res. 1993, 10, 181–203. [Google Scholar] [CrossRef]
  63. Lozano, E. Density in Communities, or the Most Important Factor in Building Urbanity. In The Urban Design Reader; Routledge: London, UK, 2012; pp. 399–414. ISBN 9781136205668. [Google Scholar]
  64. Palusci, O.; Monti, P.; Cecere, C.; Montazeri, H.; Blocken, B. Impact of Morphological Parameters on Urban Ventilation in Compact Cities: The Case of the Tuscolano-Don Bosco District in Rome. Sci. Total Environ. 2021, 807, 150490. [Google Scholar] [CrossRef]
  65. Golany, G.S. Urban Design Morphology and Thermal Performance. Atmos. Environ. 1996, 30, 455–465. [Google Scholar] [CrossRef]
  66. Jenks, M.; Burton, E.; Williams, K. The Compact City A Sustainable Urban Form; Oxford Brookes University: Oxford, UK, 1996; ISBN 0203362373. [Google Scholar]
  67. Reale, L. La Città Compatta; Gangemi, Ed: Roma, Italy, 2012; ISBN 978-88-492-2322-4. [Google Scholar]
  68. Li, C. GIS for Urban Energy Analysis. In Comprehensive Geographic Information Systems; Elsevier: Amsterdam, The Netherlands, 2018; pp. 187–195. [Google Scholar]
  69. Yuan, C.; Ren, C.; Ng, E. GIS-Based Surface Roughness Evaluation in the Urban Planning System to Improve the Wind Environment—A Study in Wuhan, China. Urban Clim. 2014, 10, 585–593. [Google Scholar] [CrossRef]
  70. Morano, P.; Tajani, F.; Locurcio, M. GIS Application and Econometric Analysis for the Verification of the Financial Feasibility of Roof-Top Wind Turbines in the City of Bari (Italy). Renew. Sustain. Energy Rev. 2017, 70, 999–1010. [Google Scholar] [CrossRef]
  71. Wong, M.S.; Nichol, J.; Ng, E. A Study of the “Wall Effect” Caused by Proliferation of High-Rise Buildings Using GIS Techniques. Landsc. Urban Plan. 2011, 102, 245–253. [Google Scholar] [CrossRef]
  72. Scopus–Document Search. Available online: https://www.scopus.com (accessed on 2 July 2021).
  73. Rosser, J.F.; Boyd, D.S.; Long, G.; Zakhary, S.; Mao, Y.; Robinson, D. Predicting Residential Building Age from Map Data. Comput. Environ. Urban Syst. 2019, 73, 56–67. [Google Scholar] [CrossRef] [Green Version]
  74. Simon, H.; Sinsel, T.; Bruse, M. Introduction of Fractal-Based Tree Digitalization and Accurate in-Canopy Radiation Transfer Modelling to the Microclimate Model ENVI-Met. Forests 2020, 11, 869. [Google Scholar] [CrossRef]
  75. Jim, C.Y.; Chen, S. Variations of the Treescape in Relation to Urban Development in a Chinese City: The Case of Nanjing. Prof. Geogr. 2003, 55, 70–82. [Google Scholar] [CrossRef]
  76. Tapiador, F.J.; Avelar, S.; Tavares-Corrêa, C.; Zah, R. Deriving Fine-Scale Socioeconomic Information of Urban Areas Using Very High-Resolution Satellite Imagery. Int. J. Remote Sens. 2011, 32, 6437–6456. [Google Scholar] [CrossRef]
  77. Delgado-García, J.B.; de Quevedo-Puente, E.; Blanco-Mazagatos, V. The Impact of City Reputation on City Performance. Reg. Stud. 2018, 52, 1098–1110. [Google Scholar] [CrossRef]
  78. Saraiva, M.; Sá Marques, T.; Pinho, P. Vacant Shops in a Crisis Period–A Morphological Analysis in Portuguese Medium-Sized Cities. Plan. Pract. Res. 2019, 34, 255–287. [Google Scholar] [CrossRef]
  79. Thai, H.M.H.; Stevens, Q.; Rogers, J. The Influence of Organic Urban Morphologies on Opportunities for Home-Based Businesses within Inner-City Districts in Hanoi, Vietnam. J. Urban Des. 2019, 24, 926–946. [Google Scholar] [CrossRef]
  80. Meng, Y.; Xing, H. Exploring the Relationship between Landscape Characteristics and Urban Vibrancy: A Case Study Using Morphology and Review Data. Cities 2019, 95, 13. [Google Scholar] [CrossRef]
  81. de Holanda, F. Inserting Urbanity in a Modern Environment; Springer International Publishing: Cham, Switzerland, 2018; ISBN 9783319761268. [Google Scholar]
  82. Lang, W.; Chen, T.; Chan, E.H.W.; Yung, E.H.K.; Lee, T.C.F. Understanding Livable Dense Urban Form for Shaping the Landscape of Community Facilities in Hong Kong Using Fine-Scale Measurements. Cities 2019, 84, 34–45. [Google Scholar] [CrossRef]
  83. Marrone, P.; Orsini, F.; Asdrubali, F.; Guattari, C. Environmental Performance of Universities: Proposal for Implementing Campus Urban Morphology as an Evaluation Parameter in Green Metric. Sustain. Cities Soc. 2018, 42, 226–239. [Google Scholar] [CrossRef]
  84. Kotharkar, R.; Pallapu, A.V.; Bahadure, P. Urban Cluster-Based Sustainability Assessment of an Indian City: Case of Nagpur. J. Urban Plan. Dev. 2019, 145, 17. [Google Scholar] [CrossRef]
  85. Tadi, M.; Zadeh, M.H.; Biraghi, C.A. The Integrated Modification Methodology. In Environmental Performance and Social Inclusion in Informal Settlements; Masera, G., Tadi, M., Eds.; Springer International Publishing: Cham, Switzerland, 2020; pp. 15–37. ISBN 9783030443528. [Google Scholar]
  86. Fischer, K.; Hiermaier, S.; Riedel, W.; Häring, I. Morphology Dependent Assessment of Resilience for Urban Areas. Sustainablity 2018, 10, 1800. [Google Scholar] [CrossRef] [Green Version]
  87. Chan, I.Y.S.; Liu, A.M.M. Effects of Neighborhood Building Density, Height, Greenspace, and Cleanliness on Indoor Environment and Health of Building Occupants. Build. Environ. 2018, 145, 213–222. [Google Scholar] [CrossRef]
  88. Claude, S.; Ginestet, S.; Bonhomme, M.; Escadeillas, G.; Taylor, J.; Marincioni, V.; Korolija, I.; Altamirano, H. Evaluating Retrofit Options in a Historical City Center: Relevance of Bio-Based Insulation and the Need to Consider Complex Urban Form in Decision-Making. Energy Build. 2019, 182, 196–204. [Google Scholar] [CrossRef] [Green Version]
  89. Sadeghi, M.; Wood, G.; Samali, B.; de Dear, R. Effects of Urban Context on the Indoor Thermal Comfort Performance of Windcatchers in a Residential Setting. Energy Build. 2020, 219, 110010. [Google Scholar] [CrossRef]
  90. Adolphe, L. A Simplified Model of Urban Morphology: Application to an Analysis of the Environmental Performance of Cities. Environ. Plan. B Plan. Des. 2001, 28, 183–200. [Google Scholar] [CrossRef]
  91. Ye, Y.; Van Nes, A. Quantitative Tools in Urban Morphology: Combining Space Syntax, Spacematrix and Mixed-Use Index in a GIS Framework. Urban Morphol. 2014, 18, 97–118. [Google Scholar]
  92. Berghauser Pont, M. An Analytical Approach to Urban Form; Springer International Publishing: Berlin/Heidelberg, Germany, 2018; ISBN 9783319761268. [Google Scholar]
  93. Steiniger, S.; Lange, T.; Burghardt, D.; Weibel, R. An Approach for the Classification of Urban Building Structures Based on Discriminant Analysis Techniques. Trans. GIS 2008, 12, 31–59. [Google Scholar] [CrossRef]
  94. Bechtel, B.; Daneke, C. Classification of Local Climate Zones Based on Multiple Earth Observation Data. IEEE J. Sel. Top. Appl. Earth Obs. Remote Sens. 2012, 5, 1191–1202. [Google Scholar] [CrossRef]
  95. Serna, A.; Marcotegui, B. Detection, Segmentation and Classification of 3D Urban Objects Using Mathematical Morphology and Supervised Learning. ISPRS J. Photogramm. Remote Sens. 2014, 93, 243–255. [Google Scholar] [CrossRef] [Green Version]
  96. Zhang, T.; Huang, X.; Wen, D.; Li, J. Urban Building Density Estimation From High-Resolution Imagery Using Multiple Features and Support Vector Regression. IEEE J. Sel. Top. Appl. Earth Obs. Remote Sens. 2017, 10, 3265–3280. [Google Scholar] [CrossRef]
  97. Tian, D.; Wang, Y.; Wang, Z.; Wang, F.; Gao, H. Long Integral Time Continuous Panorama Scanning Imaging Based on Bilateral Control with Image Motion Compensation. Remote Sens. 2019, 11, 1924. [Google Scholar] [CrossRef] [Green Version]
  98. Biljecki, F.; Ledoux, H.; Stoter, J. Generating 3D City Models without Elevation Data. Comput. Environ. Urban Syst. 2017, 64, 1–18. [Google Scholar] [CrossRef] [Green Version]
  99. Salvati, L. The “niche” City: A Multifactor Spatial Approach to Identify Local-Scale Dimensions of Urban Complexity. Ecol. Indic. 2018, 94, 62–73. [Google Scholar] [CrossRef]
  100. Noyman, A.; Doorley, R.; Xiong, Z.; Alonso, L.; Grignard, A.; Larson, K. Reversed Urbanism: Inferring Urban Performance through Behavioral Patterns in Temporal Telecom Data. Environ. Plan. B Urban Anal. City Sci. 2019, 46, 1480–1498. [Google Scholar] [CrossRef]
  101. Berghauser Pont, M.; Stavroulaki, G.; Marcus, L. Development of Urban Types Based on Network Centrality, Built Density and Their Impact on Pedestrian Movement. Environ. Plan. B Urban Anal. City Sci. 2019, 46, 1549–1564. [Google Scholar] [CrossRef]
  102. Peimani, N.; Kamalipour, H. Access and Forms of Urbanity in Public Space: Transit Urban Design beyond the Global North. Sustainablity 2020, 12, 3495. [Google Scholar] [CrossRef] [Green Version]
  103. Guan, C.H.; Rowe, P.G. The Concept of Urban Intensity and China’s Townization Policy: Cases from Zhejiang Province. Cities 2016, 55, 22–41. [Google Scholar] [CrossRef] [Green Version]
  104. Qiang, Y.; Xu, J.; Zhang, G. The Shapes of US Cities: Revisiting the Classic Population Density Functions Using Crowdsourced Geospatial Data. Urban Stud. 2020, 57, 2147–2162. [Google Scholar] [CrossRef]
  105. Yue, W.; Wang, T.; Liu, Y.; Zhang, Q.; Ye, X. Mismatch of Morphological and Functional Polycentricity in Chinese Cities: An Evidence from Land Development and Functional Linkage. Land Use Policy 2019, 88, 10. [Google Scholar] [CrossRef]
  106. Sun, B.; Li, W.; Zhang, Z.; Zhang, T. Is Polycentricity a Promising Tool to Reduce Regional Economic Disparities? Evidence from China’s Prefectural Regions. Landsc. Urban Plan. 2019, 192, 11. [Google Scholar] [CrossRef]
  107. Thinh, N.X.; Arlt, G.; Heber, B.; Hennersdorf, J.; Lehmann, I. Evaluation of Urban Land-Use Structures with a View to Sustainable Development. Environ. Impact Assess. Rev. 2002, 22, 475–492. [Google Scholar] [CrossRef]
  108. Meyer, W.B. The Other Burgess Model. Urban Geogr. 2000, 21, 261–270. [Google Scholar] [CrossRef]
  109. Hadjri, K. Appropriate Urban Design Approaches for Algeria Achievable with the No-Fines Method. Urban Des. Int. 1997, 2, 109–122. [Google Scholar] [CrossRef]
  110. Siksna, A. The Effects of Block Size and Form in North American and Australian City Centres. Urban Morphol. 1997, 1, 19–33. [Google Scholar]
  111. Webster, C.J.; Wu, F. Regulation, Land-Use Mix, and Urban Performance. Part 1: Theory. Environ. Plan. A 1999, 31, 1433–1442. [Google Scholar] [CrossRef]
  112. Filion, P.; Hammond, K. Neighbourhood Land Use and Performance: The Evolution of Neighbourhood Morphology over the 20th Century. Environ. Plan. B Plan. Des. 2003, 30, 271–296. [Google Scholar] [CrossRef]
  113. Wheeler, S.M. The Evolution of Urban Form in Portland and Toronto: Implications for Sustainability Planning. Local Environ. 2003, 8, 317–336. [Google Scholar] [CrossRef]
  114. Kombe, W.J. Land Use Dynamics in Peri-Urban Areas and Their Implications on the Urban Growth and Form: The Case of Dar Es Salaam, Tanzania. Habitat Int. 2005, 29, 113–135. [Google Scholar] [CrossRef]
  115. Banai, R.; Rapino, M.A. Urban Theory since a Theory of Good City Form (1981)—A Progress Review. J. Urban. 2009, 2, 259–276. [Google Scholar] [CrossRef]
  116. Brzenczek, K.; Wiegandt, C.C. Peculiarities in the Visual Appearance of German Cities—About Locally Specific Routines and Practices in Urban Design Related Governance. Erdkunde 2009, 63, 245–255. [Google Scholar] [CrossRef]
  117. Li, X.; Liu, X.; Yu, L. A Systematic Sensitivity Analysis of Constrained Cellular Automata Model for Urban Growth Simulation Based on Different Transition Rules. Int. J. Geogr. Inf. Sci. 2014, 28, 1317–1335. [Google Scholar] [CrossRef]
  118. Salvati, L.; Carlucci, M.; Serra, P. Unraveling Latent Dimensions of the Urban Mosaic: A Multi-Criteria Spatial Approach to Metropolitan Transformations. Environ. Plan. A 2018, 50, 93–110. [Google Scholar] [CrossRef] [Green Version]
  119. Alobaydi, D.; Al-Mosawe, H.; Lateef, I.M.; Albayati, A.H. Impact of Urban Morphological Changes on Traffic Performance of Jadriyah Intersection. Cogent Eng. 2020, 7, 1772946. [Google Scholar] [CrossRef]
  120. Wygonik, E.; Goodchild, A.V. Urban Form and Last-Mile Goods Movement: Factors Affecting Vehicle Miles Travelled and Emissions. Transp. Res. Part D Transp. Environ. 2018, 61, 217–229. [Google Scholar] [CrossRef]
  121. Dovey, K.; Woodcock, I.; Pike, L. Isochrone Mapping of Urban Transport: Car-Dependency, Mode-Choice and Design Research. Plan. Pract. Res. 2017, 32, 402–416. [Google Scholar] [CrossRef]
  122. Kozak, D.; Henderson, H.; de Castro Mazarro, A.; Rotbart, D.; Aradas, R. Blue-Green Infrastructure (BGI) in Dense Urban Watersheds. The Case of the Medrano Stream Basin (MSB) in Buenos Aires. Sustainability 2020, 12, 2163. [Google Scholar] [CrossRef] [Green Version]
  123. Maretto, M. Teaching Urban Morphology in a Sustainable Perspective; Springer: Cham, Switzerland, 2018. [Google Scholar]
  124. Swaid, B.; Bilotta, E.; Pantano, P.; Lucente, R. Emergence Nonlinear Multifractal Architecture by Hypervolume Estimation Algorithm for Evolutionary Multi-Criteria Optimisation. Int. J. Parallel Emergent Distrib. Syst. 2017, 32, S101–S113. [Google Scholar] [CrossRef]
  125. Zhun Min Adrian, C.; Nyuk Hien, W.; Marcel, I.; Steve Kardinal, J. Predicting the Envelope Performance of Commercial Office Buildings in Singapore. Energy Build. 2013, 66, 66–76. [Google Scholar] [CrossRef]
  126. Srebric, J.; Heidarinejad, M.; Liu, J. Building Neighborhood Emerging Properties and Their Impacts on Multi-Scale Modeling of Building Energy and Airflows. Build. Environ. 2015, 91, 246–262. [Google Scholar] [CrossRef]
  127. Gutiérrez, E.; Martilli, A.; Santiago, J.L.; González, J.E. A Mechanical Drag Coefficient Formulation and Urban Canopy Parameter Assimilation Technique for Complex Urban Environments. Bound.-Layer Meteorol. 2015, 157, 333–341. [Google Scholar] [CrossRef]
  128. Gros, A.; Bozonnet, E.; Inard, C.; Musy, M. Simulation Tools to Assess Microclimate and Building Energy—A Case Study on the Design of a New District. Energy Build. 2016, 114, 112–122. [Google Scholar] [CrossRef]
  129. Javanroodi, K.; Mahdavinejad, M.; Nik, V.M. Impacts of Urban Morphology on Reducing Cooling Load and Increasing Ventilation Potential in Hot-Arid Climate. Appl. Energy 2018, 231, 714–746. [Google Scholar] [CrossRef]
  130. Javanroodi, K.; Nik, V.M. Impacts of Microclimate Conditions on the Energy Performance of Buildings in Urban Areas. Buildings 2019, 9, 189. [Google Scholar] [CrossRef] [Green Version]
  131. Natanian, J.; Kastner, P.; Dogan, T.; Auer, T. From Energy Performative to Livable Mediterranean Cities: An Annual Outdoor Thermal Comfort and Energy Balance Cross-Climatic Typological Study. Energy Build. 2020, 224, 110283. [Google Scholar] [CrossRef]
  132. Braulio-Gonzalo, M.; Bovea, M.D.; Ruá, M.J.; Juan, P. A Methodology for Predicting the Energy Performance and Indoor Thermal Comfort of Residential Stocks on the Neighbourhood and City Scales. A Case Study in Spain. J. Clean. Prod. 2016, 139, 646–665. [Google Scholar] [CrossRef] [Green Version]
  133. Vahabzadeh Manesh, S.; Tadi, M.; Zanni, F. Integrated Sustainable Urban Design: Neighbourhood Design Proceeded by Sustainable Urban Morphology Emergence. WIT Trans. Ecol. Environ. 2011, 155, 631–642. [Google Scholar] [CrossRef] [Green Version]
  134. García-Pérez, S.; Sierra-Pérez, J.; Boschmonart-Rives, J. Environmental Assessment at the Urban Level Combining LCA-GIS Methodologies: A Case Study of Energy Retrofits in the Barcelona Metropolitan Area. Build. Environ. 2018, 134, 191–204. [Google Scholar] [CrossRef] [Green Version]
  135. Taleb, H.; Musleh, M.A. Applying Urban Parametric Design Optimisation Processes to a Hot Climate: Case Study of the UAE. Sustain. Cities Soc. 2015, 14, 236–253. [Google Scholar] [CrossRef]
  136. Ng, E.; Yuan, C.; Chen, L.; Ren, C.; Fung, J.C.H. Improving the Wind Environment in High-Density Cities by Understanding Urban Morphology and Surface Roughness: A Study in Hong Kong. Landsc. Urban Plan. 2011, 101, 59–74. [Google Scholar] [CrossRef]
  137. He, B.J.; Ding, L.; Prasad, D. Relationships among Local-Scale Urban Morphology, Urban Ventilation, Urban Heat Island and Outdoor Thermal Comfort under Sea Breeze Influence. Sustain. Cities Soc. 2020, 60, 102289. [Google Scholar] [CrossRef]
  138. Zhao, Z.; Shen, L.; Li, L.; Wang, H.; He, B.-J. Local Climate Zone Classification Scheme Can Also Indicate Local-Scale Urban Ventilation Performance: An Evidence-Based Study. Atmosphere 2020, 11, 776. [Google Scholar] [CrossRef]
  139. Stewart, I.D.; Oke, T.R. Local Climate Zones for Urban Temperature Studies. Bull. Am. Meteorol. Soc. 2012, 93, 1879–1900. [Google Scholar] [CrossRef]
  140. Yuan, C. Natural Ventilation Modeling and Analysis for Climate-Sensitive Architecture Design; Springer: Singapore, 2018; pp. 101–114. [Google Scholar] [CrossRef]
  141. Wang, W.; Ng, E.; Yuan, C.; Raasch, S. Large-Eddy Simulations of Ventilation for Thermal Comfort—A Parametric Study of Generic Urban Configurations with Perpendicular Approaching Winds. Urban Clim. 2017, 20, 202–227. [Google Scholar] [CrossRef]
  142. Mei, S.-J.; Hu, J.-T.; Liu, D.; Zhao, F.-Y.; Li, Y.; Wang, H.-Q. Airborne Pollutant Dilution inside the Deep Street Canyons Subjecting to Thermal Buoyancy Driven Flows: Effects of Representative Urban Skylines. Build. Environ. 2019, 149, 592–606. [Google Scholar] [CrossRef]
  143. Peng, Y.; Gao, Z.; Buccolieri, R.; Ding, W. An Investigation of the Quantitative Correlation between Urban Morphology Parameters and Outdoor Ventilation Efficiency Indices. Atmosphere 2019, 10, 33. [Google Scholar] [CrossRef] [Green Version]
  144. Leung, K.K.; Liu, C.-H.; Wong, C.C.C.; Lo, J.C.Y.; Ng, G.C.T. On the Study of Ventilation and Pollutant Removal over Idealized Two-Dimensional Urban Street Canyons. Build. Simul. 2012, 5, 359–369. [Google Scholar] [CrossRef]
  145. Hassan, A.M.; ELMokadem, A.A.; Megahed, N.A.; Abo Eleinen, O.M. Urban Morphology as a Passive Strategy in Promoting Outdoor Air Quality. J. Build. Eng. 2020, 29, 101204. [Google Scholar] [CrossRef]
  146. Yuan, C. Empirical Morphological Model to Evaluate Urban Wind Permeability in High-Density Cities; Springer: Singapore, 2018; pp. 19–42. [Google Scholar] [CrossRef]
  147. Shen, C.; Chen, X.; Dai, W.; Li, X.; Wu, J.; Fan, Q.; Wang, X.; Zhu, L.; Chan, P.; Hang, J.; et al. Impacts of High-Resolution Urban Canopy Parameters within the WRF Model on Dynamical and Thermal Fields over Guangzhou, China. J. Appl. Meteorol. Climatol. 2019, 58, 1155–1176. [Google Scholar] [CrossRef]
  148. He, X.; Li, Y.; Wang, X.; Chen, L.; Yu, B.; Zhang, Y.; Miao, S. High-Resolution Dataset of Urban Canopy Parameters for Beijing and Its Application to the Integrated WRF/Urban Modelling System. J. Clean. Prod. 2019, 208, 373–383. [Google Scholar] [CrossRef]
  149. de Morais, M.V.B.; de Freitas, E.D.; Marciotto, E.R.; Guerrero, V.V.U.; Martins, L.D.; Martins, J.A. Implementation of Observed Sky-View Factor in a Mesoscale Model for Sensitivity Studies of the Urban Meteorology. Sustainability 2018, 10, 2183. [Google Scholar] [CrossRef] [Green Version]
  150. Li, Y.; Miao, S.; Chen, F.; Liu, Y. Introducing and Evaluating a New Building-Height Categorization Based on the Fractal Dimension into the Coupled WRF/Urban Model. Int. J. Climatol. 2017, 37, 3111–3122. [Google Scholar] [CrossRef]
  151. Chan, A.; Fung, J.C.H.; Lau, A.K.H. Influence of Urban Morphometric Modification on Regional Boundary-Layer Dynamics. J. Geophys. Res. Atmos. 2013, 118, 2729–2747. [Google Scholar] [CrossRef]
  152. Pattacini, L. Climate and Urban Form. Urban Des. Int. 2012, 17, 106–114. [Google Scholar] [CrossRef]
  153. Ratti, C.; Baker, N.; Steemers, K. Energy Consumption and Urban Texture. Energy Build. 2005, 37, 762–776. [Google Scholar] [CrossRef]
  154. Sanaieian, H.; Tenpierik, M.; Van Den Linden, K.; Mehdizadeh Seraj, F.; Mofidi Shemrani, S.M. Review of the Impact of Urban Block Form on Thermal Performance, Solar Access and Ventilation. Renew. Sustain. Energy Rev. 2014, 38, 551–560. [Google Scholar] [CrossRef]
  155. Ratti, C.; Richens, P. Raster Analysis of Urban Form. Environ. Plan. B Plan. Des. 2004, 31, 297–309. [Google Scholar] [CrossRef]
  156. Palme, M.; Privitera, R.; La Rosa, D. The Shading Effects of Green Infrastructure in Private Residential Areas: Building Performance Simulation to Support Urban Planning. Energy Build. 2020, 229, 110531. [Google Scholar] [CrossRef]
  157. Othman, H.A.S.; Alshboul, A.A. The Role of Urban Morphology on Outdoor Thermal Comfort: The Case of Al-Sharq City—Az Zarqa. Urban Clim. 2020, 34, 100706. [Google Scholar] [CrossRef]
  158. Ronchi, S.; Salata, S.; Arcidiacono, A. Which Urban Design Parameters Provide Climate-Proof Cities? An Application of the Urban Cooling InVEST Model in the City of Milan Comparing Historical Planning Morphologies. Sustain. Cities Soc. 2020, 63, 102459. [Google Scholar] [CrossRef]
  159. Battisti, A. Bioclimatic Architecture and Urban Morphology. Studies on Intermediate Urban Open Spaces. Energies 2020, 13, 5819. [Google Scholar] [CrossRef]
  160. Uçlar, S.; Buldurur, M.A. Relation between Urban Form and Heating Energy Consumption. A/Z ITU J. Fac. Archit. 2020, 17, 89–101. [Google Scholar] [CrossRef]
  161. Leng, H.; Chen, X.; Ma, Y.; Wong, N.H.; Ming, T. Urban Morphology and Building Heating Energy Consumption: Evidence from Harbin, a Severe Cold Region City. Energy Build. 2020, 224, 110143. [Google Scholar] [CrossRef]
  162. Apreda, C.; Reder, A.; Mercogliano, P. Urban Morphology Parameterization for Assessing the Effects of Housing Blocks Layouts on Air Temperature in the Euro-Mediterranean Context. Energy Build. 2020, 223, 110171. [Google Scholar] [CrossRef]
  163. Poon, K.H.; Kämpf, J.H.; Tay, S.E.R.; Wong, N.H.; Reindl, T.G. Parametric Study of URBAN Morphology on Building Solar Energy Potential in Singapore Context. Urban Clim. 2020, 33, 100624. [Google Scholar] [CrossRef]
  164. Liu, N.; Morawska, L. Modeling the Urban Heat Island Mitigation Effect of Cool Coatings in Realistic Urban Morphology. J. Clean. Prod. 2020, 264, 121560. [Google Scholar] [CrossRef]
  165. Nikoloudakis, N.; Stagakis, S.; Mitraka, Z.; Kamarianakis, Y.; Chrysoulakis, N. Spatial Interpolation of Urban Air Temperatures Using Satellite-Derived Predictors. Theor. Appl. Climatol. 2020, 141, 657–672. [Google Scholar] [CrossRef]
  166. Yuan, C.; Adelia, A.S.; Mei, S.; He, W.; Li, X.X.; Norford, L. Mitigating Intensity of Urban Heat Island by Better Understanding on Urban Morphology and Anthropogenic Heat Dispersion. Build. Environ. 2020, 176, 106876. [Google Scholar] [CrossRef]
  167. Carpio-Pinedo, J.; Ramírez, G.; Montes, S.; Lamiquiz, P.J. New Urban Forms, Diversity, and Computational Design: Exploring the Open Block. J. Urban Plan. Dev. 2020, 146, 04020002. [Google Scholar] [CrossRef]
  168. Salvati, A.; Palme, M.; Chiesa, G.; Kolokotroni, M. Built Form, Urban Climate and Building Energy Modelling: Case-Studies in Rome and Antofagasta. J. Build. Perform. Simul. 2020, 13, 209–225. [Google Scholar] [CrossRef]
  169. Zonato, A.; Martilli, A.; Di Sabatino, S.; Zardi, D.; Giovannini, L. Evaluating the Performance of a Novel WUDAPT Averaging Technique to Define Urban Morphology with Mesoscale Models. Urban Clim. 2020, 31, 100584. [Google Scholar] [CrossRef]
  170. Chokhachian, A.; Perini, K.; Giulini, S.; Auer, T. Urban Performance and Density: Generative Study on Interdependencies of Urban Form and Environmental Measures. Sustain. Cities Soc. 2020, 53, 101952. [Google Scholar] [CrossRef]
  171. Yoseph, W.E.S. Parametric Assessment for Achieving Indoor Environmental Quality (Ieq) in Egypt’s New Urban Communities: Considering New Borg El-Arab City Urban Morphology and Openings’ Specifications; Springer International Publishing: Cham, Switzerland, 2020; ISBN 9783030173081. [Google Scholar]
  172. Xu, X.; Yin, C.; Wang, W.; Xu, N.; Hong, T.; Li, Q. Revealing Urban Morphology and Outdoor Comfort through Genetic Algorithm-Driven Urban Block Design in Dry and Hot Regions of China. Sustainability 2019, 11, 3683. [Google Scholar] [CrossRef] [Green Version]
  173. Ghassoun, Y.; Löwner, M.-O.; Weber, S. Wind Direction Related Parameters Improve the Performance of a Land Use Regression Model for Ultrafine Particles. Atmos. Pollut. Res. 2019, 10, 1180–1189. [Google Scholar] [CrossRef]
  174. Xu, X.; Wu, Y.; Wang, W.; Hong, T.; Xu, N. Performance-Driven Optimization of Urban Open Space Configuration in the Cold-Winter and Hot-Summer Region of China. Build. Simul. 2019, 12, 411–424. [Google Scholar] [CrossRef] [Green Version]
  175. He, B.-J.; Ding, L.; Prasad, D. Enhancing Urban Ventilation Performance through the Development of Precinct Ventilation Zones: A Case Study Based on the Greater Sydney, Australia. Sustain. Cities Soc. 2019, 47, 101472. [Google Scholar] [CrossRef]
  176. Chatterjee, S.; Khan, A.; Dinda, A.; Mithun, S.; Khatun, R.; Akbari, H.; Kusaka, H.; Mitra, C.; Bhatti, S.S.; Van Doan, Q.; et al. Simulating Micro-Scale Thermal Interactions in Different Building Environments for Mitigating Urban Heat Islands. Sci. Total Environ. 2019, 663, 610–631. [Google Scholar] [CrossRef] [PubMed]
  177. Salvati, A.; Monti, P.; Coch Roura, H.; Cecere, C. Climatic Performance of Urban Textures: Analysis Tools for a Mediterranean Urban Context. Energy Build. 2019, 185, 162–179. [Google Scholar] [CrossRef]
  178. Li, S.; Zhou, C.; Wang, S.; Hu, J. Dose Urban Landscape Pattern Affect CO2 Emission Efficiency? Empirical Evidence from Megacities in China. J. Clean. Prod. 2018, 203, 164–178. [Google Scholar] [CrossRef]
  179. Amaral, A.R.; Rodrigues, E.; Rodrigues Gaspar, A.; Gomes, Á. Review on Performance Aspects of Nearly Zero-Energy Districts. Sustain. Cities Soc. 2018, 43, 406–420. [Google Scholar] [CrossRef]
  180. Cody, B.; Loeschnig, W.; Eberl, A. Operating Energy Demand of Various Residential Building Typologies in Different European Climates. Smart Sustain. Built Environ. 2018, 7, 226–250. [Google Scholar] [CrossRef] [Green Version]
  181. Moraitis, P.; Kausika, B.B.; Nortier, N.; Van Sark, W. Urban Environment and Solar PV Performance: The Case of the Netherlands. Energies 2018, 11, 1333. [Google Scholar] [CrossRef] [Green Version]
  182. Costanzo, V.; Yao, R.; Essah, E.; Shao, L.; Shahrestani, M.; Oliveira, A.C.; Araz, M.; Hepbasli, A.; Biyik, E. A Method of Strategic Evaluation of Energy Performance of Building Integrated Photovoltaic in the Urban Context. J. Clean. Prod. 2018, 184, 82–91. [Google Scholar] [CrossRef]
  183. Hammerberg, K.; Brousse, O.; Martilli, A.; Mahdavi, A. Implications of Employing Detailed Urban Canopy Parameters for Mesoscale Climate Modelling: A Comparison between WUDAPT and GIS Databases over Vienna, Austria. Int. J. Climatol. 2018, 38, e1241–e1257. [Google Scholar] [CrossRef] [Green Version]
  184. Pili, S.; Desogus, G.; Melis, D. A GIS Tool for the Calculation of Solar Irradiation on Buildings at the Urban Scale, Based on Italian Standards. Energy Build. 2018, 158, 629–646. [Google Scholar] [CrossRef]
  185. Pacifici, M.; de Castro Marins, K.R.; Catto, V.d.M.; Rama, F.; Lamour, Q. Morphological and Climate Balance: Proposal for a Method to Analyze Neighborhood Urban Forms by Way of Densification. Sustain. Cities Soc. 2017, 35, 145–156. [Google Scholar] [CrossRef]
  186. Thouron, L.; Seigneur, C.; Kim, Y.; Legorgeu, C.; Roustan, Y.; Bruge, B. Simulation of Trace Metals and PAH Atmospheric Pollution over Greater Paris: Concentrations and Deposition on Urban Surfaces. Atmos. Environ. 2017, 167, 360–376. [Google Scholar] [CrossRef]
  187. Shi, Z.; Fonseca, J.A.; Schlueter, A. A Review of Simulation-Based Urban Form Generation and Optimization for Energy-Driven Urban Design. Build. Environ. 2017, 121, 119–129. [Google Scholar] [CrossRef]
  188. Saratsis, E.; Dogan, T.; Reinhart, C.F. Simulation-Based Daylighting Analysis Procedure for Developing Urban Zoning Rules. Build. Res. Inf. 2017, 45, 478–491. [Google Scholar] [CrossRef]
  189. Palme, M.; Inostroza, L.; Villacreses, G.; Lobato-Cordero, A.; Carrasco, C. From Urban Climate to Energy Consumption. Enhancing Building Performance Simulation by Including the Urban Heat Island Effect. Energy Build. 2017, 145, 107–120. [Google Scholar] [CrossRef]
  190. Perišić, M.; Maletić, D.; Stojić, S.S.; Rajšić, S.; Stojić, A. Forecasting Hourly Particulate Matter Concentrations Based on the Advanced Multivariate Methods. Int. J. Environ. Sci. Technol. 2017, 14, 1047–1054. [Google Scholar] [CrossRef]
  191. Demuzere, M.; Harshan, S.; Järvi, L.; Roth, M.; Grimmond, C.S.B.; Masson, V.; Oleson, K.W.; Velasco, E.; Wouters, H. Impact of Urban Canopy Models and External Parameters on the Modelled Urban Energy Balance in a Tropical City. Q. J. R. Meteorol. Soc. 2017, 143, 1581–1596. [Google Scholar] [CrossRef]
  192. Perišić, A.; Lazić, M.; Obradović, R.; Galić, I. Daylight and Urban Morphology: A Model for Analysing the Average Annual Illumination of Residential Housing. Teh. Vjesn. 2016, 23, 1343–1350. [Google Scholar] [CrossRef] [Green Version]
  193. Guo, G.; Zhou, X.; Wu, Z.; Xiao, R.; Chen, Y. Characterizing the Impact of Urban Morphology Heterogeneity on Land Surface Temperature in Guangzhou, China. Environ. Model. Softw. 2016, 84, 427–439. [Google Scholar] [CrossRef]
  194. Rodríguez Algeciras, J.A.; Gómez Consuegra, L.; Matzarakis, A. Spatial-Temporal Study on the Effects of Urban Street Configurations on Human Thermal Comfort in the World Heritage City of Camagüey-Cuba. Build. Environ. 2016, 101, 85–101. [Google Scholar] [CrossRef]
  195. Taki, A.; Alabid, J. Learning from Bioclimatic Desert Architecture: A Case Study of Ghadames, Libya. In Research Methodology in the Built Environment: A Selection of Case Studies; Routledge: London, UK, 2016; Volume 1, pp. 169–185. ISBN 9781317534259. [Google Scholar]
  196. Jurelionis, A.; Bouris, D.G. Impact of Urban Morphology on Infiltration-Induced Building Energy Consumption. Energies 2016, 9, 177. [Google Scholar] [CrossRef] [Green Version]
  197. Oertel, A.; Emmanuel, R.; Drach, P. Assessment of Predicted versus Measured Thermal Comfort and Optimal Comfort Ranges in the Outdoor Environment in the Temperate Climate of Glasgow, UK. Build. Serv. Eng. Res. Technol. 2015, 36, 482–499. [Google Scholar] [CrossRef]
  198. Sarralde, J.J.; Quinn, D.J.; Wiesmann, D.; Steemers, K. Solar Energy and Urban Morphology: Scenarios for Increasing the Renewable Energy Potential of Neighbourhoods in London. Renew. Energy 2015, 73, 10–17. [Google Scholar] [CrossRef] [Green Version]
  199. Pay, M.T.; Martínez, F.; Guevara, M.; Baldasano, J.M. Air Quality Forecasts on a Kilometer-Scale Grid over Complex Spanish Terrains. Geosci. Model Dev. 2014, 7, 1979–1999. [Google Scholar] [CrossRef] [Green Version]
  200. Bueno, B.; Roth, M.; Norford, L.; Li, R. Computationally Efficient Prediction of Canopy Level Urban Air Temperature at the Neighbourhood Scale. Urban Clim. 2014, 9, 35–53. [Google Scholar] [CrossRef] [Green Version]
  201. Hofman, J.; Lefebvre, W.; Janssen, S.; Nackaerts, R.; Nuyts, S.; Mattheyses, L.; Samson, R. Increasing the Spatial Resolution of Air Quality Assessments in Urban Areas: A Comparison of Biomagnetic Monitoring and Urban Scale Modelling. Atmos. Environ. 2014, 92, 130–140. [Google Scholar] [CrossRef]
  202. Gros, A.; Bozonnet, E.; Inard, C. Modelling the Radiative Exchanges in Urban Areas: A Review. Adv. Build. Energy Res. 2011, 5, 163–206. [Google Scholar] [CrossRef]
  203. Salat, S. Energy Loads, CO2 Emissions and Building Stocks: Morphologies, Typologies, Energy Systems and Behaviour. Build. Res. Inf. 2009, 37, 598–609. [Google Scholar] [CrossRef]
  204. Al-Maiyah, S.; Elkadi, H. The Role of Daylight in Preserving Identities in Heritage Context. Renew. Sustain. Energy Rev. 2007, 11, 1544–1557. [Google Scholar] [CrossRef]
  205. Blocken, B. 50 Years of Computational Wind Engineering: Past, Present and Future. J. Wind Eng. Ind. Aerodyn. 2014, 129, 69–102. [Google Scholar] [CrossRef]
  206. WHO Air Quality Guidelines for Europe. Environ. Sci. Pollut. Res. 2000, 3, 23. [CrossRef]
  207. Neophytou, M.K.-A.; Britter, R.E. Modelling the Wind Flow in Complex Urban Topographies: A Computational-Fluid-Dynamics Simulation of the Central London Area. In Proceedings of the 5th GRACM International Congress on Comput Mech, Limassol, Cyprus, 29 June–1 July 2005; pp. 967–974. [Google Scholar]
  208. Hang, J.; Sandberg, M.; Li, Y. Age of Air and Air Exchange Efficiency in Idealized City Models. Build. Environ. 2009, 44, 1714–1723. [Google Scholar] [CrossRef]
  209. Oke, T.R. Boundary Layer Climates, 2nd ed.; Methuen: London, UK; New York, NY, USA, 1987. [Google Scholar]
  210. Bottema, M. Urban roughness modelling in relation to pollutant dispersion. Atmos. Environ. 1997, 31, 3059–3075. [Google Scholar] [CrossRef]
  211. Lettau, H. Note on Aerodynamic Roughness-Parameter Estimation on the Basis of Roughness-Element Description. J. Appl. Meteorol. Climatol. 1969, 8, 828–832. [Google Scholar] [CrossRef] [Green Version]
  212. Wieringa, J. Updating the Davenport Roughness Classification. J. Wind. Eng. Ind. Aerodyn. 1992, 41, 357–368. [Google Scholar] [CrossRef]
  213. Wieringa, J. Representative Roughness Parameters for Homogeneous Terrain. Bound.-Layer Meteorol. 1993, 63, 323–363. [Google Scholar] [CrossRef]
  214. Raupach, M.R.; Thom, A.S.; Edwards, I. A Wind-Tunnel Study of Turbulent Flow Close to Regularly Arrayed Rough Surfaces. Bound.-Layer Meteorol. 1980, 18, 373–397. [Google Scholar] [CrossRef]
  215. Hussain, M.; Lee, B.E. A Wind Tunnel Study of the Mean Pressure Forces Acting on Large Groups of Low-Rise Buildings. J. Wind Eng. Ind. Aerodyn. 1980, 6, 207–225. [Google Scholar] [CrossRef]
  216. Cheng, H.; Castro, I.P. Near wall flow over urban-like roughness. Bound.-Layer Meteorol. 2002, 104, 229–259. [Google Scholar] [CrossRef]
  217. Kanda, M.; Moriwaki, R.; Kasamatsu, F. Large-Eddy Simulation of Turbulent Organized Structures within and above Explicitly Resolved Cube Arrays. Bound.-Layer Meteorol. 2004, 112, 343–368. [Google Scholar] [CrossRef]
  218. Coceal, O.; Thomas, T.G.; Castro, I.P.; Belcher, S.E. Mean Flow and Turbulence Statistics over Groups of Urban-like Cubical Obstacles. Bound.-Layer Meteorol. 2006, 121, 491–519. [Google Scholar] [CrossRef]
  219. Kanda, M. Large-Eddy Simulations on the Effects of Surface Geometry of Building Arrays on Turbulent Organized Structures. Bound.-Layer Meteorol. 2006, 118, 151–168. [Google Scholar] [CrossRef]
  220. Grimmond, C.S.B.; Oke, T.R. Aerodynamic Properties of Urban Areas Derived from Analysis of Surface Form. J. Appl. Meteorol. 1999, 38, 1262–1292. [Google Scholar] [CrossRef]
  221. Hunter, L.J.; Johnson, G.T.; Watson, I.D. An Investigation of Three-Dimensional Characteristics of Flow Regimes within the Urban Canyon. Atmos. Environ. 1992, 26, 425–432. [Google Scholar] [CrossRef]
  222. Oke, T.R. Street Design and Urban Canopy Layer Climate. Energy Build. 1988, 11, 103–113. [Google Scholar] [CrossRef]
  223. Sini, J.F.; Anquetin, S.; Mestayer, P.G. Pollutant Dispersion and Thermal Effects in Urban Street Canyons. Atmos. Environ. 1996, 30, 2659–2677. [Google Scholar] [CrossRef]
  224. Di Bernardino, A.; Palusci, O.; Pini, A.; Leuzzi, G.; Cacciani, M.; Pelliccioni, A.; Monti, P. Air Circulation in Urban Areas. In Urban Microclimate Modelling for Comfort and Energy Studies; Palme, M., Salvati, A., Eds.; Springer: Cham, Switzerland, 2021; pp. 195–221. ISBN 978-3-030-65421-4. [Google Scholar]
  225. Britter, R.E.; Hanna, S.R. Flow and Dispersion in Urban Areas. Annu. Rev. Phys. Chem. 2000, 51, 275–296. [Google Scholar] [CrossRef]
  226. Xiaomin, X.; Zhen, H.; Jiasong, W. The Impact of Urban Street Layout on Local Atmospheric Environment. Build. Environ. 2006, 41, 1352–1363. [Google Scholar] [CrossRef]
  227. Di Bernardino, A.; Monti, P.; Leuzzi, G.; Querzoli, G. Water-Channel Estimation of Eulerian and Lagrangian Time Scales of the Turbulence in Idealized Two-Dimensional Urban Canopies. Bound.-Layer Meteorol. 2017, 165, 251–276. [Google Scholar] [CrossRef]
  228. Di Bernardino, A.; Monti, P.; Leuzzi, G.; Querzoli, G. Pollutant Fluxes in Two-Dimensional Street Canyons. Urban Clim. 2018, 24, 80–93. [Google Scholar] [CrossRef]
  229. Xie, X.; Huang, Z.; Wang, J.S. Impact of Building Configuration on Air Quality in Street Canyon. Atmos. Environ. 2005, 39, 4519–4530. [Google Scholar] [CrossRef]
  230. Badas, M.G.; Ferrari, S.; Garau, M.; Querzoli, G. On the Effect of Gable Roof on Natural Ventilation in Two-Dimensional Urban Canyons. J. Wind. Eng. Ind. Aerodyn. 2017, 162, 24–34. [Google Scholar] [CrossRef]
  231. Xie, X.; Huang, Z.; Wang, J.; Xie, Z. The Impact of Solar Radiation and Street Layout on Pollutant Dispersion in Street Canyon. Build. Environ. 2005, 40, 201–212. [Google Scholar] [CrossRef]
  232. Ai, Z.T.; Mak, C.M. CFD Simulation of Flow in a Long Street Canyon under a Perpendicular Wind Direction: Evaluation of Three Computational Settings. Build. Environ. 2017, 114, 293–306. [Google Scholar] [CrossRef]
  233. Llaguno-Munitxa, M.; Bou-Zeid, E. Shaping Buildings to Promote Street Ventilation: A Large-Eddy Simulation Study. Urban Clim. 2018, 26, 76–94. [Google Scholar] [CrossRef]
  234. Hang, J.; Li, Y.; Sandberg, M.; Claesson, L. Wind Conditions and Ventilation in High-Rise Long Street Models. Build. Environ. 2010, 45, 1353–1365. [Google Scholar] [CrossRef] [Green Version]
  235. Hunter, L.J.; Watson, I.D.; Johnson, G.T. Modelling Air Flow Regimes in Urban Canyons. Energy Build. 1990, 91, 15–16. [Google Scholar] [CrossRef]
  236. Hang, J.; Li, Y.; Sandberg, M. Experimental and Numerical Studies of Flows through and within High-Rise Building Arrays and Their Link to Ventilation Strategy. J. Wind Eng. Ind. Aerodyn. 2011, 99, 1036–1055. [Google Scholar] [CrossRef]
  237. Hang, J.; Li, Y. Age of Air and Air Exchange Efficiency in High-Rise Urban Areas and Its Link to Pollutant Dilution. Atmos. Environ. 2011, 45, 5572–5585. [Google Scholar] [CrossRef]
  238. Hu, T.; Yoshie, R. Indices to Evaluate Ventilation Efficiency in Newly-Built Urban Area at Pedestrian Level. J. Wind Eng. Ind. Aerodyn. 2013, 112, 39–51. [Google Scholar] [CrossRef]
  239. Yim, S.H.L.; Fung, J.C.H.; Lau, A.K.H.; Kot, S.C. Air Ventilation Impacts of the “Wall Effect” Resulting from the Alignment of High-Rise Buildings. Atmos. Environ. 2009, 43, 4982–4994. [Google Scholar] [CrossRef]
  240. Hang, J.; Li, Y.; Sandberg, M.; Buccolieri, R.; Di Sabatino, S. The Influence of Building Height Variability on Pollutant Dispersion and Pedestrian Ventilation in Idealized High-Rise Urban Areas. Build. Environ. 2012, 56, 346–360. [Google Scholar] [CrossRef]
  241. Lin, M.; Hang, J.; Li, Y.; Luo, Z.; Sandberg, M. Quantitative Ventilation Assessments of Idealized Urban Canopy Layers with Various Urban Layouts and the Same Building Packing Density. Build. Environ. 2014, 79, 152–167. [Google Scholar] [CrossRef]
  242. Hagishima, A.; Tanimoto, J.; Nagayama, K.; Meno, S. Aerodynamic Parameters of Regular Arrays of Rectangular Blocks with Various Geometries. Bound.-Layer Meteorol. 2009, 132, 315–337. [Google Scholar] [CrossRef]
  243. Razak, A.A.; Hagishima, A.; Ikegaya, N.; Tanimoto, J. Analysis of Airflow over Building Arrays for Assessment of Urban Wind Environment. Build. Environ. 2013, 59, 56–65. [Google Scholar] [CrossRef]
  244. Cantelli, A.; Monti, P.; Leuzzi, G. Numerical Study of the Urban Geometrical Representation Impact in a Surface Energy Budget Model. Environ. Fluid Mech. 2015, 15, 251–273. [Google Scholar] [CrossRef]
  245. Chen, L.; Hang, J.; Sandberg, M.; Claesson, L.; Sabatino, S.D.; Wigo, H. The Impacts of Building Height Variations and Building Packing Densities on Flow Adjustment and City Breathability in Idealized Urban Models. Build. Environ. 2017, 118, 344–361. [Google Scholar] [CrossRef]
  246. Di Bernardino, A.; Monti, P.; Leuzzi, G.; Querzoli, G. Turbulent Schmidt Number Measurements Over Three-Dimensional Cubic Arrays. Bound.-Layer Meteorol. 2020, 174, 231–250. [Google Scholar] [CrossRef] [Green Version]
  247. Conigliaro, E.; Monti, P.; Leuzzi, G.; Cantelli, A. Urban Climate A Three-Dimensional Urban Canopy Model for Mesoscale Atmospheric Simulations and Its Comparison with a Two-Dimensional Urban Canopy Model in an Idealized Case. Urban Clim. 2021, 37, 100831. [Google Scholar] [CrossRef]
  248. Santiago, J.L.; Coceal, O.; Martilli, A.; Belcher, S.E. Variation of the Sectional Drag Coefficient of a Group of Buildings with Packing Density. Build. Vent. Theory Meas. 2008, 128, 445–457. [Google Scholar] [CrossRef]
  249. Ikegaya, N.; Ikeda, Y.; Hagishima, A.; Razak, A.A.; Tanimoto, J. A Prediction Model for Wind Speed Ratios at Pedestrian Level with Simplified Urban Canopies. Theor. Appl. Climatol. 2017, 127, 655–665. [Google Scholar] [CrossRef]
  250. Soulhac, L.; Garbero, V.; Salizzoni, P.; Mejean, P.; Perkins, R.J. Flow and Dispersion in Street Intersections. Atmos. Environ. 2009, 43, 2981–2996. [Google Scholar] [CrossRef]
  251. Amicarelli, A.; Salizzoni, P.; Leuzzi, G.; Monti, P.; Soulhac, L.; Cierco, F.-X.; Leboeuf, F. Sensitivity Analysis of a Concentration Fluctuation Model to Dissipation Rate Estimates. Int. J. Environ. Pollut. 2012, 48, 164–173. [Google Scholar] [CrossRef]
  252. Kubota, T.; Miura, M.; Tominaga, Y.; Mochida, A. Wind Tunnel Tests on the Relationship between Building Density and Pedestrian-Level Wind Velocity: Development of Guidelines for Realizing Acceptable Wind Environment in Residential Neighborhoods. Build. Environ. 2008, 43, 1699–1708. [Google Scholar] [CrossRef]
  253. Yang, F.; Qian, F.; Lau, S.S.Y. Urban Form and Density as Indicators for Summertime Outdoor Ventilation Potential: A Case Study on High-Rise Housing in Shanghai. Build. Environ. 2013, 70, 122–137. [Google Scholar] [CrossRef]
  254. Tsichritzis, L.; Nikolopoulou, M. The Effect of Building Height and Façade Area Ratio on Pedestrian Wind Comfort of London. J. Wind Eng. Ind. Aerodyn. 2019, 191, 63–75. [Google Scholar] [CrossRef]
  255. Blocken, B.; Stathopoulos, T.; Carmeliet, J.; Hensen, J.L.M. Application of Computational Fluid Dynamics in Building Performance Simulation for the Outdoor Environment: An Overview. J. Build. Perform. Simul. 2011, 157–184. [Google Scholar] [CrossRef]
  256. Gousseau, P.; Blocken, B.; Stathopoulos, T.; van Heijst, G.J.F. CFD Simulation of Near-Field Pollutant Dispersion on a High-Resolution Grid: A Case Study by LES and RANS for a Building Group in Downtown Montreal. Atmos. Environ. 2011, 45, 428–438. [Google Scholar] [CrossRef] [Green Version]
  257. Nozu, T.; Tamura, T. LES of Turbulent Wind and Gas Dispersion in a City. J. Wind Eng. Ind. Aerodyn. 2012, 104–106, 492–499. [Google Scholar] [CrossRef]
  258. Tominaga, Y. Visualization of City Breathability Based on CFD Technique: Case Study for Urban Blocks in Niigata City. J. Vis. 2012, 15, 269–276. [Google Scholar] [CrossRef]
  259. Janssen, W.D.; Blocken, B.; van Hooff, T. Pedestrian Wind Comfort around Buildings: Comparison of Wind Comfort Criteria Based on Whole-Flow Field Data for a Complex Case Study. Build. Environ. 2013, 59, 547–562. [Google Scholar] [CrossRef]
  260. Panagiotou, I.; Neophytou, M.K.-A.; Hamlyn, D.; Britter, R.E. City Breathability as Quantified by the Exchange Velocity and Its Spatial Variation in Real Inhomogeneous Urban Geometries: An Example from Central London Urban Area. Sci. Total Environ. 2013, 442, 466–477. [Google Scholar] [CrossRef] [PubMed]
  261. Toparlar, Y.; Blocken, B.; Vos, P.; Van Heijst, G.J.F.; Janssen, W.D.; van Hooff, T.; Montazeri, H.; Timmermans, H.J.P. CFD Simulation and Validation of Urban Microclimate: A Case Study for Bergpolder Zuid, Rotterdam. Build. Environ. 2015, 83, 79–90. [Google Scholar] [CrossRef] [Green Version]
  262. Blocken, B.; Vervoort, R.; van Hooff, T. Reduction of Outdoor Particulate Matter Concentrations by Local Removal in Semi-Enclosed Parking Garages: A Preliminary Case Study for Eindhoven City Center. J. Wind Eng. Ind. Aerodyn. 2016, 159, 80–98. [Google Scholar] [CrossRef]
  263. Pelliccioni, A.; Monti, P.; Leuzzi, G. An Alternative Wind Profile Formulation for Urban Areas in Neutral Conditions. Environ. Fluid Mech. 2015, 15, 135–146. [Google Scholar] [CrossRef] [Green Version]
  264. Antoniou, N.; Montazeri, H.; Wigo, H.; Neophytou, M.K.A.; Blocken, B.; Sandberg, M. CFD and Wind-Tunnel Analysis of Outdoor Ventilation in a Real Compact Heterogeneous Urban Area: Evaluation Using “Air Delay”. Build. Environ. 2017, 126, 355–372. [Google Scholar] [CrossRef]
  265. Ricci, A.; Kalkman, I.; Blocken, B.; Burlando, M.; Freda, A.; Repetto, M.P. Local-Scale Forcing Effects on Wind Flows in an Urban Environment: Impact of Geometrical Simplifications. J. Wind Eng. Ind. Aerodyn. 2017, 170, 238–255. [Google Scholar] [CrossRef]
  266. Liu, S.; Pan, W.; Zhao, X.; Zhang, H.; Cheng, X.; Long, Z.; Chen, Q. Influence of Surrounding Buildings on Wind Flow around a Building Predicted by CFD Simulations. Build. Environ. 2018, 140, 1–10. [Google Scholar] [CrossRef]
  267. Vervoort, R.; Blocken, B.; van Hooff, T. Reduction of Particulate Matter Concentrations by Local Removal in a Building Courtyard: Case Study for the Delhi American Embassy School. Sci. Total Environ. 2019, 686, 657–680. [Google Scholar] [CrossRef]
  268. Longo, R.; Bellemans, A.; Derudi, M.; Parente, A. A Multi-Fidelity Framework for the Estimation of the Turbulent Schmidt Number in the Simulation of Atmospheric Dispersion. Build. Environ. 2020, 185, 107066. [Google Scholar] [CrossRef]
  269. Pelliccioni, A.; Monti, P.; Cattani, G.; Boccuni, F.; Cacciani, M.; Canepari, S.; Capone, P.; Catrambone, M.; Cusano, M.; D’Ovidio, M.C.; et al. Integrated Evaluation of Indoor Particulate Exposure: The VIEPI Project. Sustainability 2020, 12, 9758. [Google Scholar] [CrossRef]
  270. Lauriks, T.; Longo, R.; Baetens, D.; Derudi, M.; Parente, A.; Bellemans, A.; van Beeck, J.; Denys, S. Application of Improved CFD Modeling for Prediction and Mitigation of Traffic-Related Air Pollution Hotspots in a Realistic Urban Street. Atmos. Environ. 2021, 246, 118127. [Google Scholar] [CrossRef]
  271. Iannarelli, A.M.; Di Bernardino, A.; Casadio, S.; Bassani, C.; Cacciani, M.; Campanelli, M.; Casasanta, G.; Cadau, E.; Diémoz, H.; Mevi, G.; et al. The Boundary Layer Air Quality-Analysis Using Network of Instruments (BAQUNIN) Supersite for Atmospheric Research and Satellite Validation over Rome Area. Bull. Am. Meteorol. Soc. 2021, 103, E599–E618. [Google Scholar] [CrossRef]
  272. Buccolieri, R.; Wigö, H.; Sandberg, M.; Di Sabatino, S. Direct Measurements of the Drag Force over Aligned Arrays of Cubes Exposed to Boundary-Layer Flows. Environ. Fluid Mech. 2017, 17, 373–394. [Google Scholar] [CrossRef]
  273. Franke, J.; Hellsten, A.; Schlünzen, H.; Carissimo, B. Best Practice Guideline for the CFD Simulation of Flows in the Urban Environment; University of Hamburg: Hamburg, Germany, 2007; Volume 44, ISBN 3000183124. [Google Scholar]
  274. Tominaga, Y.; Mochida, A.; Yoshie, R.; Kataoka, H.; Nozu, T.; Yoshikawa, M.; Shirasawa, T. AIJ Guidelines for Practical Applications of CFD to Pedestrian Wind Environment around Buildings. J. Wind Eng. Ind. Aerodyn. 2008, 96, 1749–1761. [Google Scholar] [CrossRef]
  275. Blocken, B.; Stathopoulos, T.; Carmeliet, J. CFD Simulation of the Atmospheric Boundary Layer: Wall Function Problems. Atmos. Environ. 2007, 41, 238–252. [Google Scholar] [CrossRef]
  276. van Hooff, T.; Blocken, B. Coupled Urban Wind Flow and Indoor Natural Ventilation Modelling on a High-Resolution Grid: A Case Study for the Amsterdam ArenA Stadium. Environ. Model. Softw. 2010, 25, 51–65. [Google Scholar] [CrossRef]
  277. Schatzmann, M.; Olesen, H.; Franke, J. Cost 732 Model Evaluation Case Studies: Approach and Results; University of Hamburg: Hamburg, Germany, 2010; ISBN 3000183124. [Google Scholar]
  278. Roache, P.J. Quantification of Uncertainty in Computational Fluid Dynamics. Annu. Rev. Fluid Mech. 1997, 29, 123–160. [Google Scholar] [CrossRef] [Green Version]
  279. Blocken, B. LES over RANS in Building Simulation for Outdoor and Indoor Applications: A Foregone Conclusion? Build. Simul. 2018, 11, 821–870. [Google Scholar] [CrossRef] [Green Version]
  280. Heinke Schlunzen, K.; Grawe, D.; Bohnenstengel, S.I.; Schï Uter, C.I.; Koppmann, R. Joint Modelling of Obstacle Induced and Mesoscale Changes-Current Limits and Challenges. Jnl. Wind Eng. Ind. Aerodyn. 2011, 99, 217–225. [Google Scholar] [CrossRef]
  281. Morris, H.M.J. Flow in Rough Conduits. Trans. Am. Soc. Civ. Eng. 1955, 120, 373–398. [Google Scholar] [CrossRef]
  282. Lee, B.E.; Soliman, B.F. An Investigation of the Forces on Three Dimensional Bluff Bodies in Lough Wall Turbulent Boundary Layers. Fluids Eng. 1977, 99, 503–509. [Google Scholar] [CrossRef]
  283. Grosso, M.; Parisi, E.; D’Elia, I.C. The Effect of Urban Form on Wind Pressure Drag. In Proceedings of the World Renewable Energy Congress VI, Pergamon, Germany, 1 January 2000; pp. 444–449. [Google Scholar]
  284. Ho, Y.-K.; Liu, C.-H.; Wong, M.S. Preliminary Study of the Parameterisation of Street-Level Ventilation in Idealised Two-Dimensional Simulations. Build. Environ. 2015, 89, 345–355. [Google Scholar] [CrossRef]
  285. Buccolieri, R.; Salizzoni, P.; Soulhac, L.; Garbero, V.; Di Sabatino, S. The Breathability of Compact Cities. Urban Clim. 2015, 13, 73–93. [Google Scholar] [CrossRef]
  286. Bentham, T.; Britter, R.E. Spatially Averaged Flow within Obstacle Arrays. Atmos. Environ. 2003, 37, 2037–2043. [Google Scholar] [CrossRef]
  287. Buccolieri, R.; Sandberg, M.; Di Sabatino, S. City Breathability and Its Link to Pollutant Concentration Distribution within Urban-like Geometries. Atmos. Environ. 2010, 44, 1894–1903. [Google Scholar] [CrossRef]
  288. Hang, J.; Wang, Q.; Chen, X.; Sandberg, M.; Zhu, W.; Buccolieri, R.; Di Sabatino, S. City Breathability in Medium Density Urban-like Geometries Evaluated through the Pollutant Transport Rate and the Net Escape Velocity. Build. Environ. 2015, 94, 166–182. [Google Scholar] [CrossRef]
  289. Skote, M.; Sandberg, M.; Westerberg, U.; Claesson, L.; Johansson, A.V. Numerical and Experimental Studies of Wind Environment in an Urban Morphology. Atmos. Environ. 2005, 39, 6147–6158. [Google Scholar] [CrossRef]
  290. Di Sabatino, S.; Buccolieri, R.; Pulvirenti, B.; Britter, R.E. Simulations of Pollutant Dispersion within Idealised Urban-Type Geometries with CFD and Integral Models. Atmos. Environ. 2007, 41, 8316–8329. [Google Scholar] [CrossRef]
  291. Hang, J.; Sandberg, M.; Li, Y.; Claesson, L. Pollutant Dispersion in Idealized City Models with Different Urban Morphologies. Atmos. Environ. 2009, 43, 6011–6025. [Google Scholar] [CrossRef]
  292. Hang, J.; Sandberg, M.; Li, Y. Effect of Urban Morphology on Wind Condition in Idealized City Models. Atmos. Environ. 2009, 43, 869–878. [Google Scholar] [CrossRef]
  293. Bady, M.; Kato, S.; Huang, H. Towards the Application of Indoor Ventilation Efficiency Indices to Evaluate the Air Quality of Urban Areas. Build. Environ. 2008, 43, 1991–2004. [Google Scholar] [CrossRef]
  294. Sandberg, M. What Is Ventilation Efficiency? Build. Environ. 1981, 16, 123–135. [Google Scholar] [CrossRef]
  295. Etheridge, D.W.; Sandberg, M. Building Ventilation: Theory and Measurement; John Wiley & Sons: Hoboken, NJ, USA, 1996; ISBN 9780471960874. [Google Scholar]
  296. Huang, H.; Kato, S.; Ooka, R.; Jiang, T. CFD Analysis of Ventilation Efficiency around an Elevated Highway Using Visitation Frequency and Purging Flow Rate. Wind Struct. Int. J. 2006, 9, 297–313. [Google Scholar] [CrossRef]
  297. Cheng, W.C.; Liu, C.H.; Leung, D.Y.C. Computational Formulation for the Evaluation of Street Canyon Ventilation and Pollutant Removal Performance. Atmos. Environ. 2008, 42, 9041–9051. [Google Scholar] [CrossRef]
  298. Bu, Z.; Kato, S.; Ishida, Y.; Huang, H. New Criteria for Assessing Local Wind Environment at Pedestrian Level Based on Exceedance Probability Analysis. Build. Environ. 2009, 44, 1501–1508. [Google Scholar] [CrossRef]
  299. Hang, J.; Li, Y. Ventilation Strategy and Air Change Rates in Idealized High-Rise Compact Urban Areas. Build. Environ. 2010, 45, 2754–2767. [Google Scholar] [CrossRef]
  300. Hang, J.; Sandberg, M.; Li, Y.; Claesson, L. Flow Mechanisms and Flow Capacity in Idealized Long-Street City Models. Build. Environ. 2010, 45, 1042–1053. [Google Scholar] [CrossRef]
  301. Hang, J.; Luo, Z.; Sandberg, M.; Gong, J. Natural Ventilation Assessment in Typical Open and Semi-Open Urban Environments under Various Wind Directions. Build. Environ. 2013, 70, 318–333. [Google Scholar] [CrossRef]
  302. Mei, S.-J.; Hu, J.-T.; Liu, D.; Zhao, F.-Y.; Li, Y.; Wang, Y.; Wang, H.-Q. Wind Driven Natural Ventilation in the Idealized Building Block Arrays with Multiple Urban Morphologies and Unique Package Building Density. Energy Build. 2017, 155, 324–338. [Google Scholar] [CrossRef]
  303. Peng, Y.; Buccolieri, R.; Gao, Z.; Ding, W. Indices Employed for the Assessment of “Urban Outdoor Ventilation”—A Review. Atmos. Environ. 2020, 223, 117211. [Google Scholar] [CrossRef]
  304. Bady, M.; Kato, S.; Takahashi, T.; Huang, H. An Experimental Investigation of the Wind Environment and Air Quality within a Densely Populated Urban Street Canyon. J. Wind Eng. Ind. Aerodyn. 2011, 99, 857–867. [Google Scholar] [CrossRef]
  305. Carpentieri, M.; Robins, A.G. Influence of Urban Morphology on Air Flow over Building Arrays. J. Wind Eng. Ind. Aerodyn. 2015, 145, 61–74. [Google Scholar] [CrossRef] [Green Version]
  306. Juan, Y.-H.; Yang, A.-S.; Wen, C.-Y.; Lee, Y.-T.; Wang, P.-C. Optimization Procedures for Enhancement of City Breathability Using Arcade Design in a Realistic High-Rise Urban Area. Build. Environ. 2017, 121, 247–261. [Google Scholar] [CrossRef]
  307. Wen, C.-Y.; Juan, Y.-H.; Yang, A.-S. Enhancement of City Breathability with Half Open Spaces in Ideal Urban Street Canyons. Build. Environ. 2017, 112, 322–336. [Google Scholar] [CrossRef]
  308. Du, Y.; Mak, C.M.; Li, Y. Application of a Multi-Variable Optimization Method to Determine Lift-up Design for Optimum Wind Comfort. Build. Environ. 2018, 131, 242–254. [Google Scholar] [CrossRef]
  309. Du, Y.; Mak, C.M.; Li, Y. A Multi-Stage Optimization of Pedestrian Level Wind Environment and Thermal Comfort with Lift-up Design in Ideal Urban Canyons. Sustain. Cities Soc. 2019, 46, 101424. [Google Scholar] [CrossRef]
  310. Melbourne, W.H. Criteria for Environmental Wind Conditions. J. Wind Eng. Ind. Aerodyn. 1978, 3, 241–249. [Google Scholar] [CrossRef]
  311. Williams, C.J.; Hunter, M.A.; Waechter, W.F. Criteria for Assessing the Pedestrian Wind Environment. J. Wind Eng. Ind. Aerodyn. 1990, 36, 811–815. [Google Scholar] [CrossRef]
  312. Lawson, T.V. The Wind Content of the Built Environment. J. Wind Eng. Ind. Aerodyn. 1978, 3, 93–105. [Google Scholar] [CrossRef]
  313. QGIS Documentation. Available online: https://docs.qgis.org/3.16/en/docs/training_manual (accessed on 9 June 2021).
  314. Carta Tecnica Regionale. Available online: http://dati.lazio.it/catalog/it/dataset/carta-tecnica-regionale-2002-2003-5k-roma/resource/ee089059-bdec-499c-a91c-a3f2a71f32ce (accessed on 28 November 2016).
  315. Urban Atlas. 2006. Available online: https://land.copernicus.eu/local/urban-atlas (accessed on 31 July 2014).
Figure 1. (a) World population, modified from [6]; (b) urban vs. rural population, data source [7]. Figure 1a: from [6] and Copyright © 2019 by United Nations, made available under a Creative Commons license (CC BY 3.0 IGO). Figure 1b has been produced by the authors with data from [7].
Sustainability 14 03948 g001
Figure 2. Examples of compact urban tissues in (a) Amsterdam, (b) Barcelona, (c) Paris, and (d) Rome. Modified from Google Maps.
Sustainability 14 03948 g002
Figure 3. Possible relations between two different building typologies and open spaces at different scales: (a) slab and (b) pavilion. Diverse configurations of urban canyons: (c) continuous, (d) discontinuous, and (e) mixed.
Sustainability 14 03948 g003
Figure 4. Main observation scales or resolution levels adopted in morphological analyses.
Sustainability 14 03948 g004
Figure 5. General workflow for urban renewal plans.
Sustainability 14 03948 g005
Figure 6. The effects of two possible strategies to adopt while regenerating the physical dimension of urban areas are explored for five different building typologies. The diverse configurations were quantified using six MPs commonly employed in typo-morphological analyses. (a) Same building coverage ratio and (b) same floor space index and volume-to-site-ratio.
Sustainability 14 03948 g006
Figure 7. Graphical definitions of the morphological indices employed in Figure 6.
Sustainability 14 03948 g007
Figure 8. (a) The yearly distribution of the reviewed documents; and (b) the yearly distribution of published documents. Legends report the search queries.
Sustainability 14 03948 g008
Figure 9. Literature review methodology.
Sustainability 14 03948 g009
Figure 10. The yearly distribution of published documents. The legend reports the search queries.
Sustainability 14 03948 g010
Figure 11. Graphical representation of the concept of urban ventilation.
Sustainability 14 03948 g011
Figure 12. Examples of morphological parameters used in wind engineering applications and pollutant dispersion studies: (a) z0 and d; (b) relation between height-to-width ratio and the length-to-height ratio of UCs, modified from [221]; and (c) the aspect ratio, modified from [222]. Figure 12a has been made by the Authors; Figure 12b has been modified after [221]. Copyright © 1992 Published by Elsevier Ltd; Figure 12c has been modified after [222]. Copyright © 1988 Published by Elsevier B.V.
Sustainability 14 03948 g012
Figure 13. Examples of studies using 2D urban canyon models for investigating the impact of (a) the aspect ratio on streamlines, modified from [226]; (b) the aspect ratio on instantaneous velocity (vectors) and concentration (colors) fields for aspect ratio equal to 1 and 2, modified from [228]; (c) the roof shape on streamlines, modified from [229]; (d) the roof shape on the mean wind velocity ratio and streamlines, modified from [230]; (e) the building height variation on streamlines, modified from [229]; and (f) the building height variation on streamlines, modified from [231]. Figure 13a: modified from [226] Copyright © 2005 Elsevier Ltd. All rights reserved; Figure 13b: modified from [228] © 2018 Elsevier B.V. All rights reserved; Figure 13c: modified from [229] © 2005 Elsevier Ltd. All rights reserved; Figure 13d: modified from [230] © 2017 Published by Elsevier Ltd; Figure 13e: modified from [229] © 2005 Elsevier Ltd. All rights reserved. Figure 13f: modified from [231] Copyright © 2004 Elsevier Ltd. All rights reserved.
Sustainability 14 03948 g013
Figure 14. Examples of studies using 3D urban canyon models for investigating the impact of (a) the aspect ratio on wind velocity, modified from [232]; and (b) the roof shape on the time-averaged velocity (vectors) and vertical turbulence intensity (contours), modified from [233].
Sustainability 14 03948 g014
Figure 15. Examples of studies using 3D urban arrangement models for investigating the impact of (a) the height variation on 3D streamlines and the velocity ratio [241]; and (b) the orientation on velocity field and pollutant concentration [250]. Figure 15a: modified from [241] Copyright © 2014 Elsevier Ltd. All rights reserved; Figure 15b: modified from [250] Copyright © 2009 Elsevier Ltd. All rights reserved.
Sustainability 14 03948 g015
Figure 17. Graphical definitions of the morphological parameters identified as relevant to characterize urban areas in urban ventilation performance studies.
Sustainability 14 03948 g017
Figure 18. Workflow for urban renewal plans that aim at improving urban ventilation performance.
Sustainability 14 03948 g018
Figure 19. Phases of the process for the assessment of the ventilation performance of an urban area.
Sustainability 14 03948 g019
Figure 21. Perspective view of (a) the area of interest (modified from Google Maps), (b) the computational grid, (c) enlargement of the computational grid, and (d) enlargement of the computational grid. The total cell count is about 86 million. Modified from [64]. Copyright © 2021 The Authors. Published by Elsevier B.V.
Sustainability 14 03948 g021
Table 2. Criteria for assessing wind-induced discomfort considering temperature effect at the pedestrian level [252]. Reprinted with permission from ref. [252]. Copyright 2022 Elsevier.
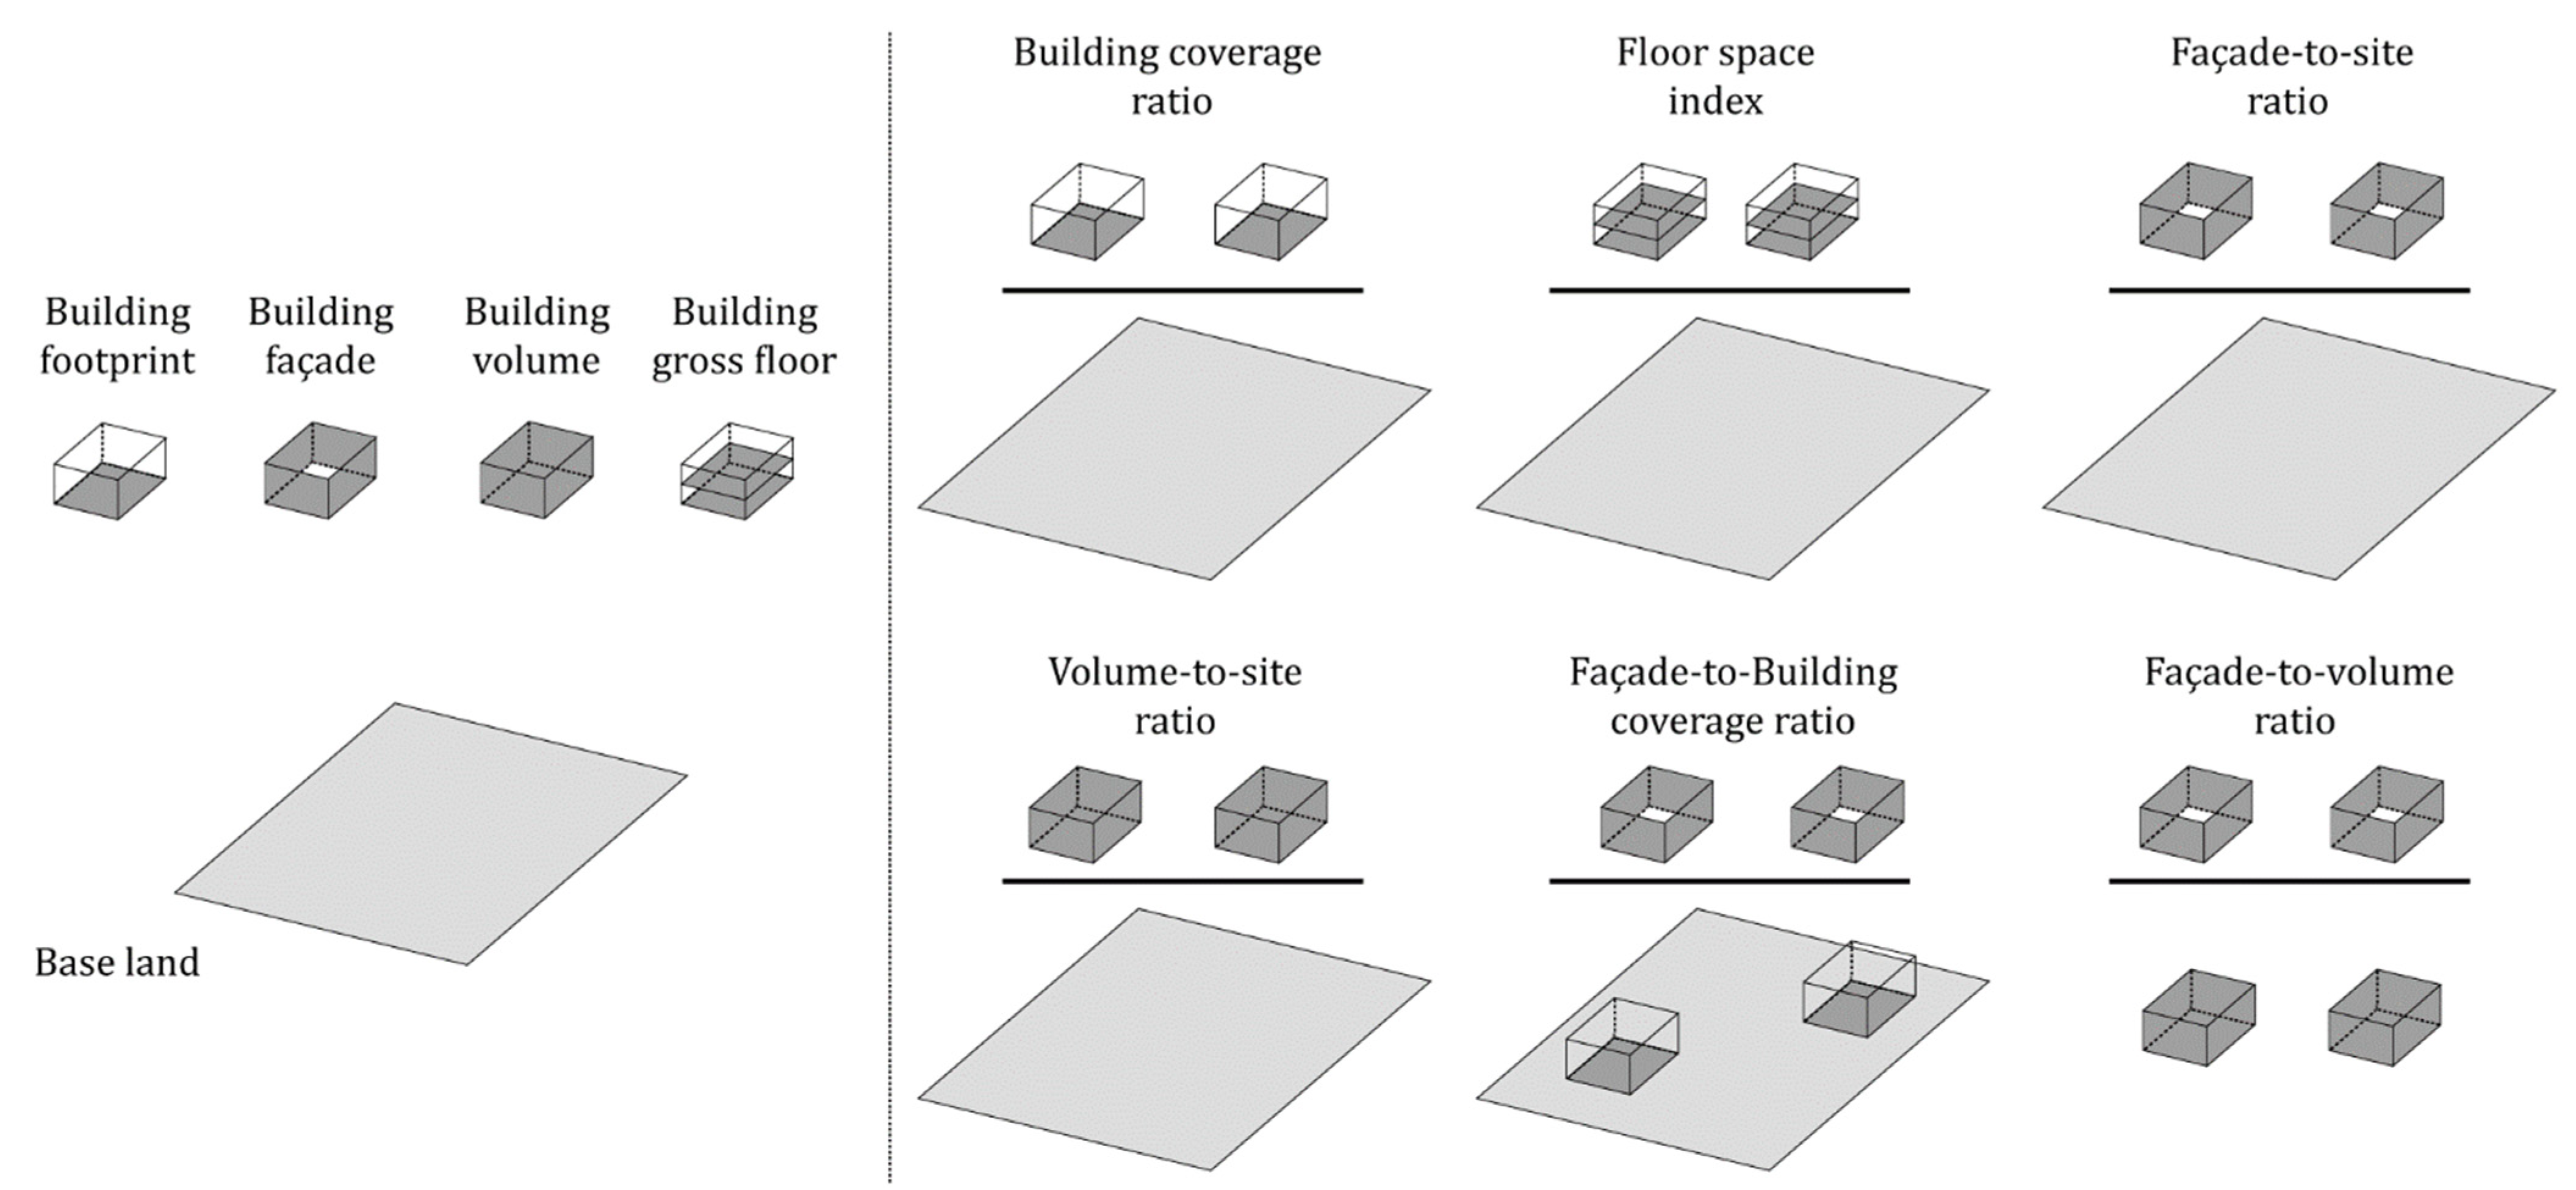
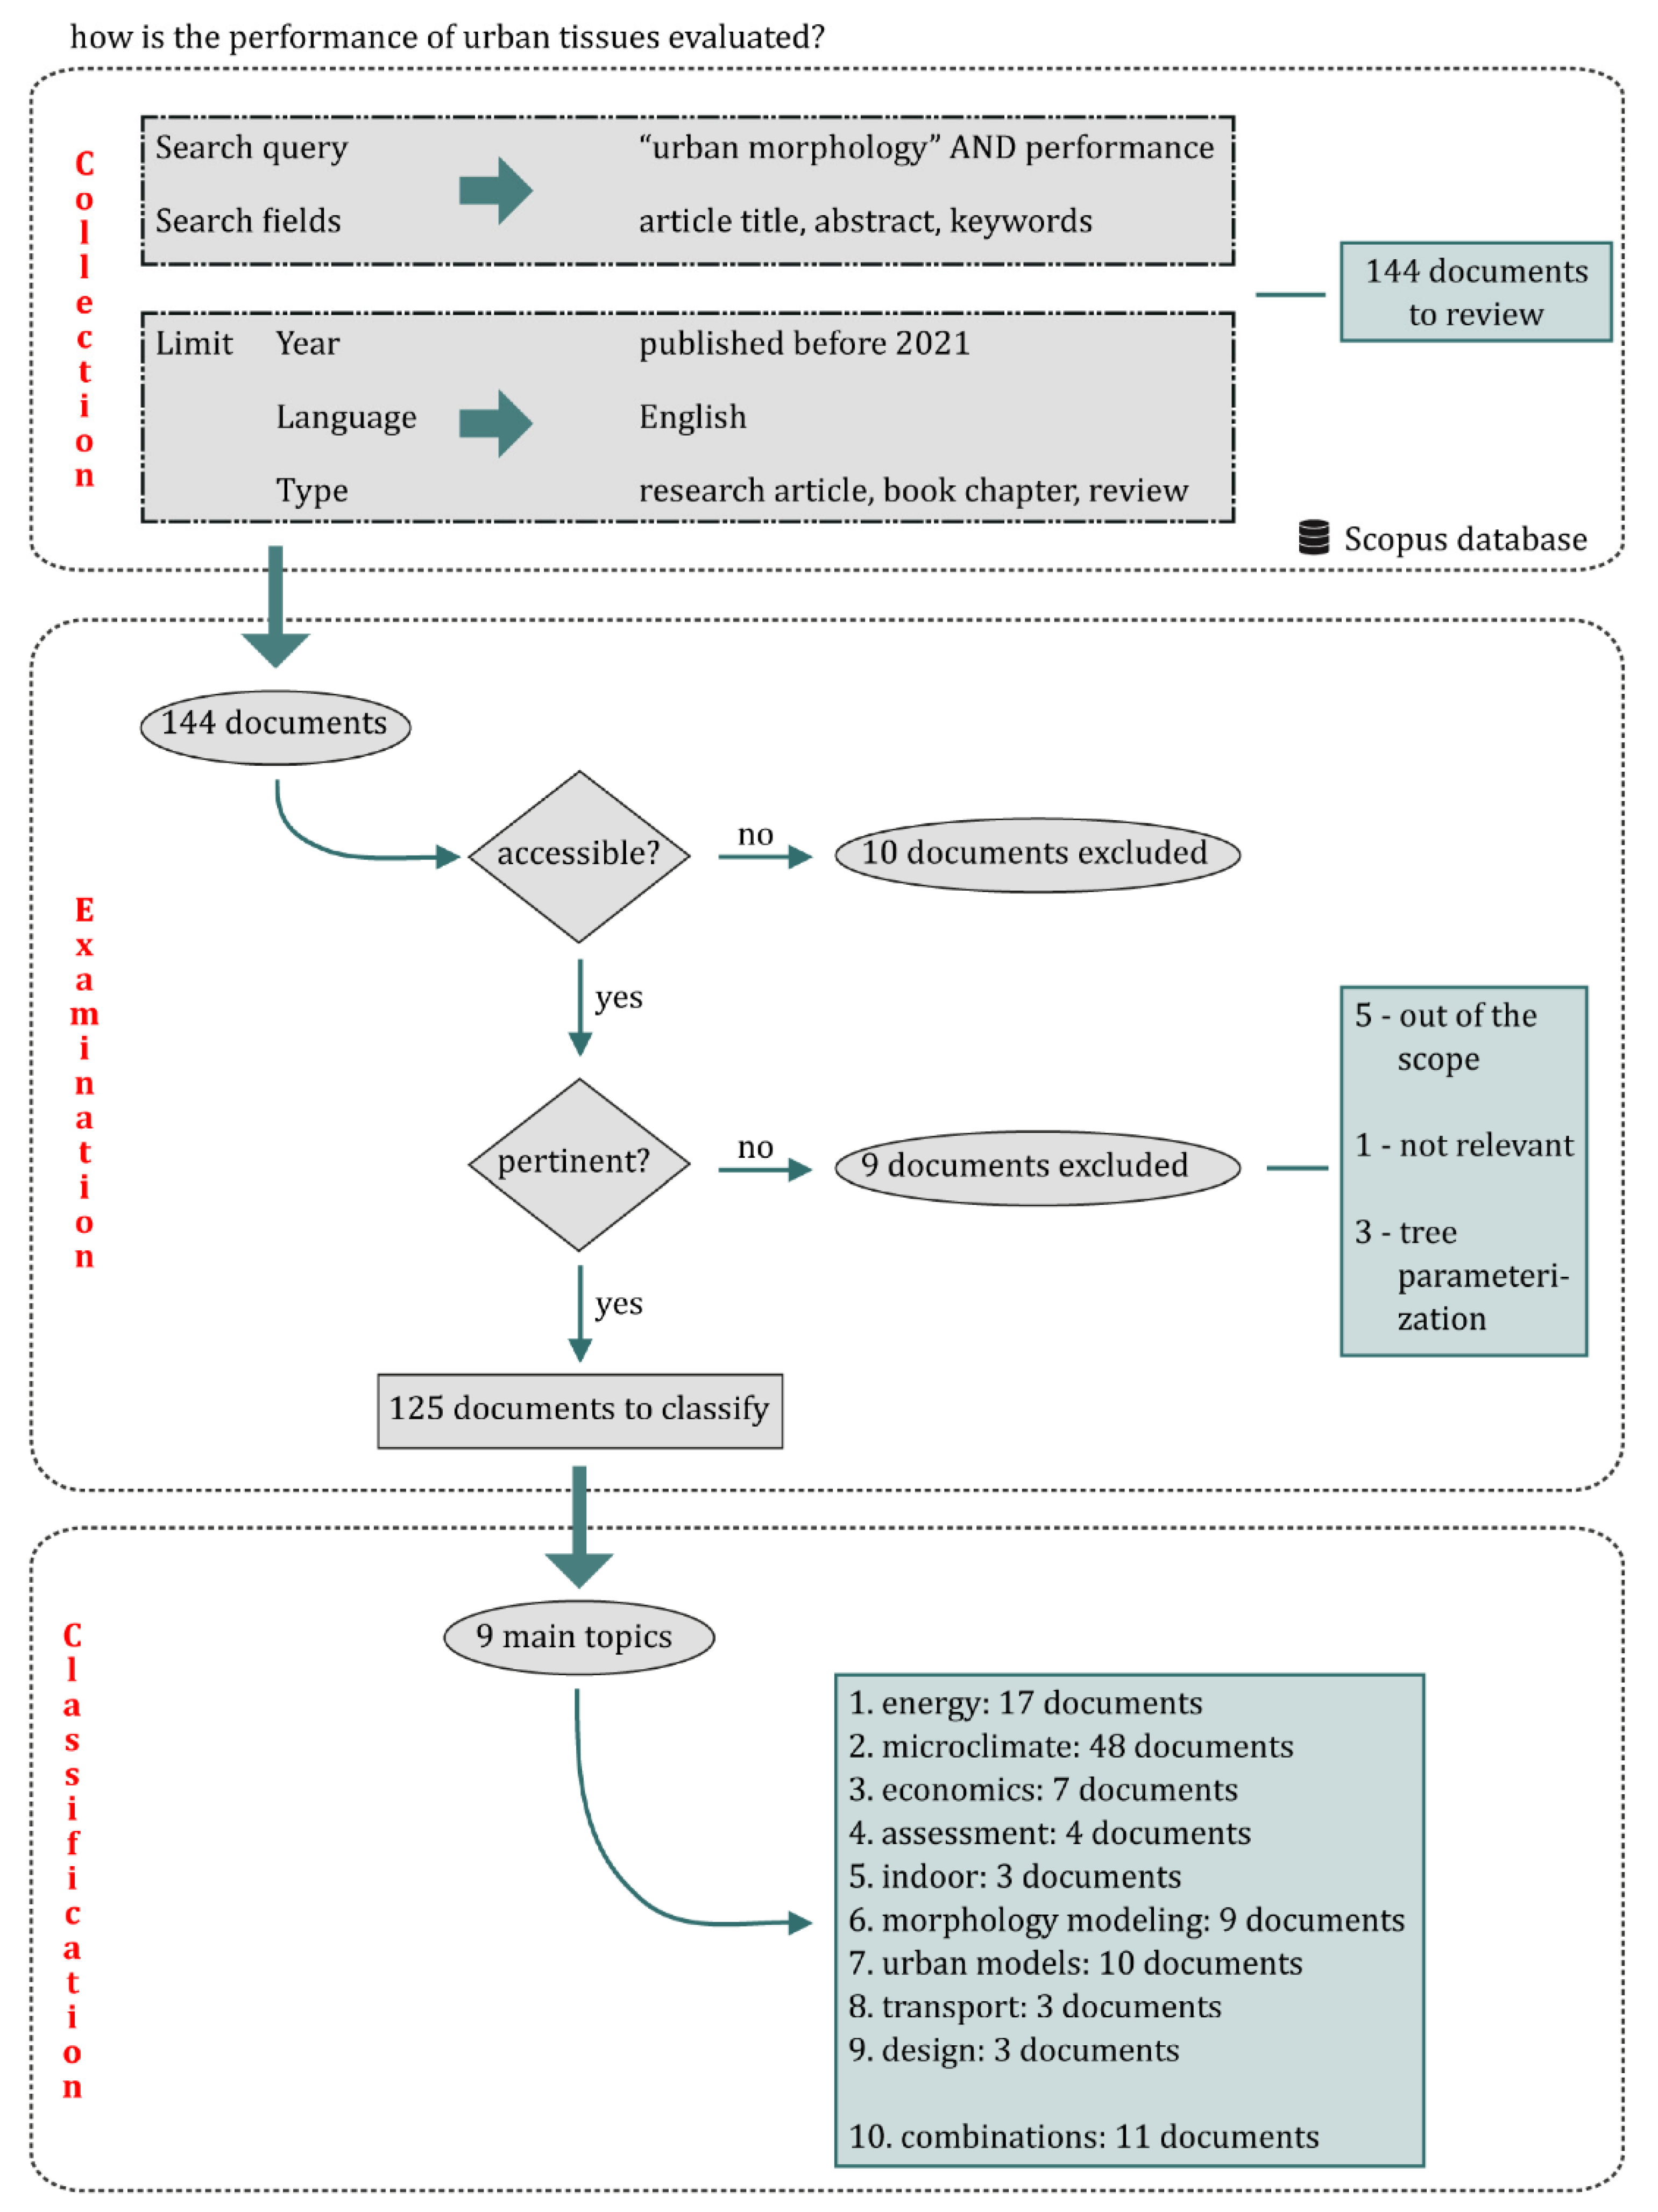
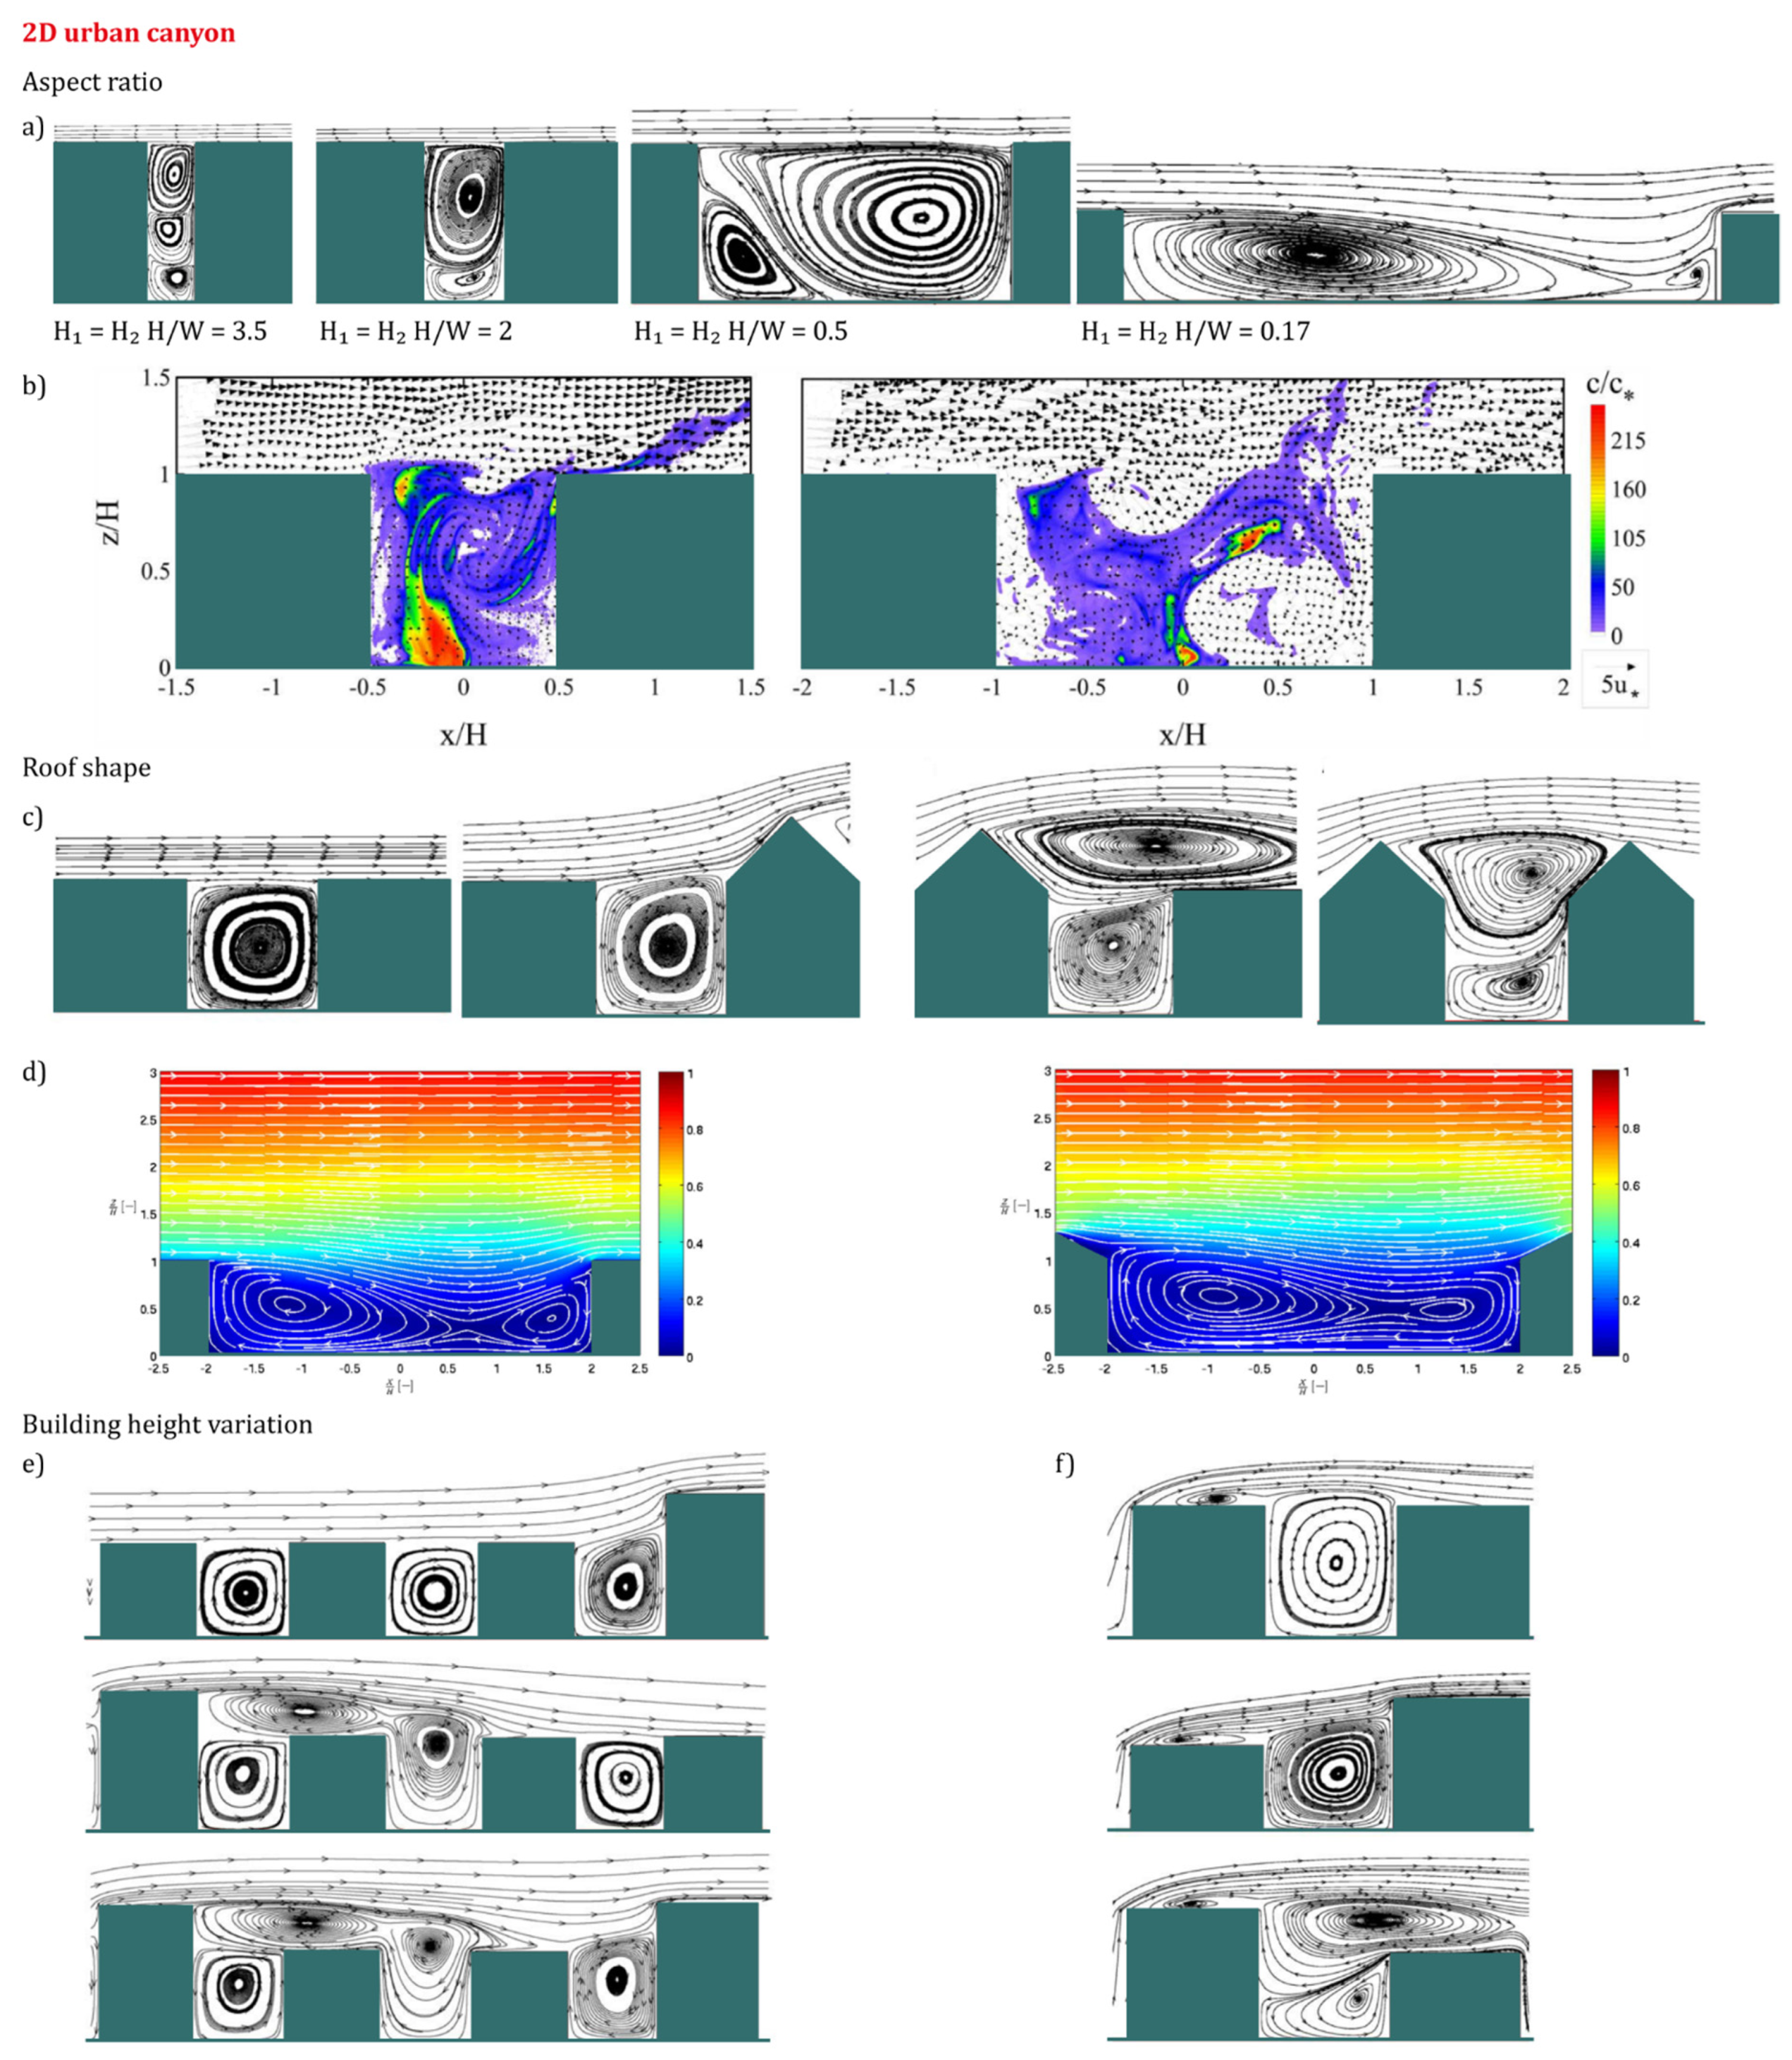
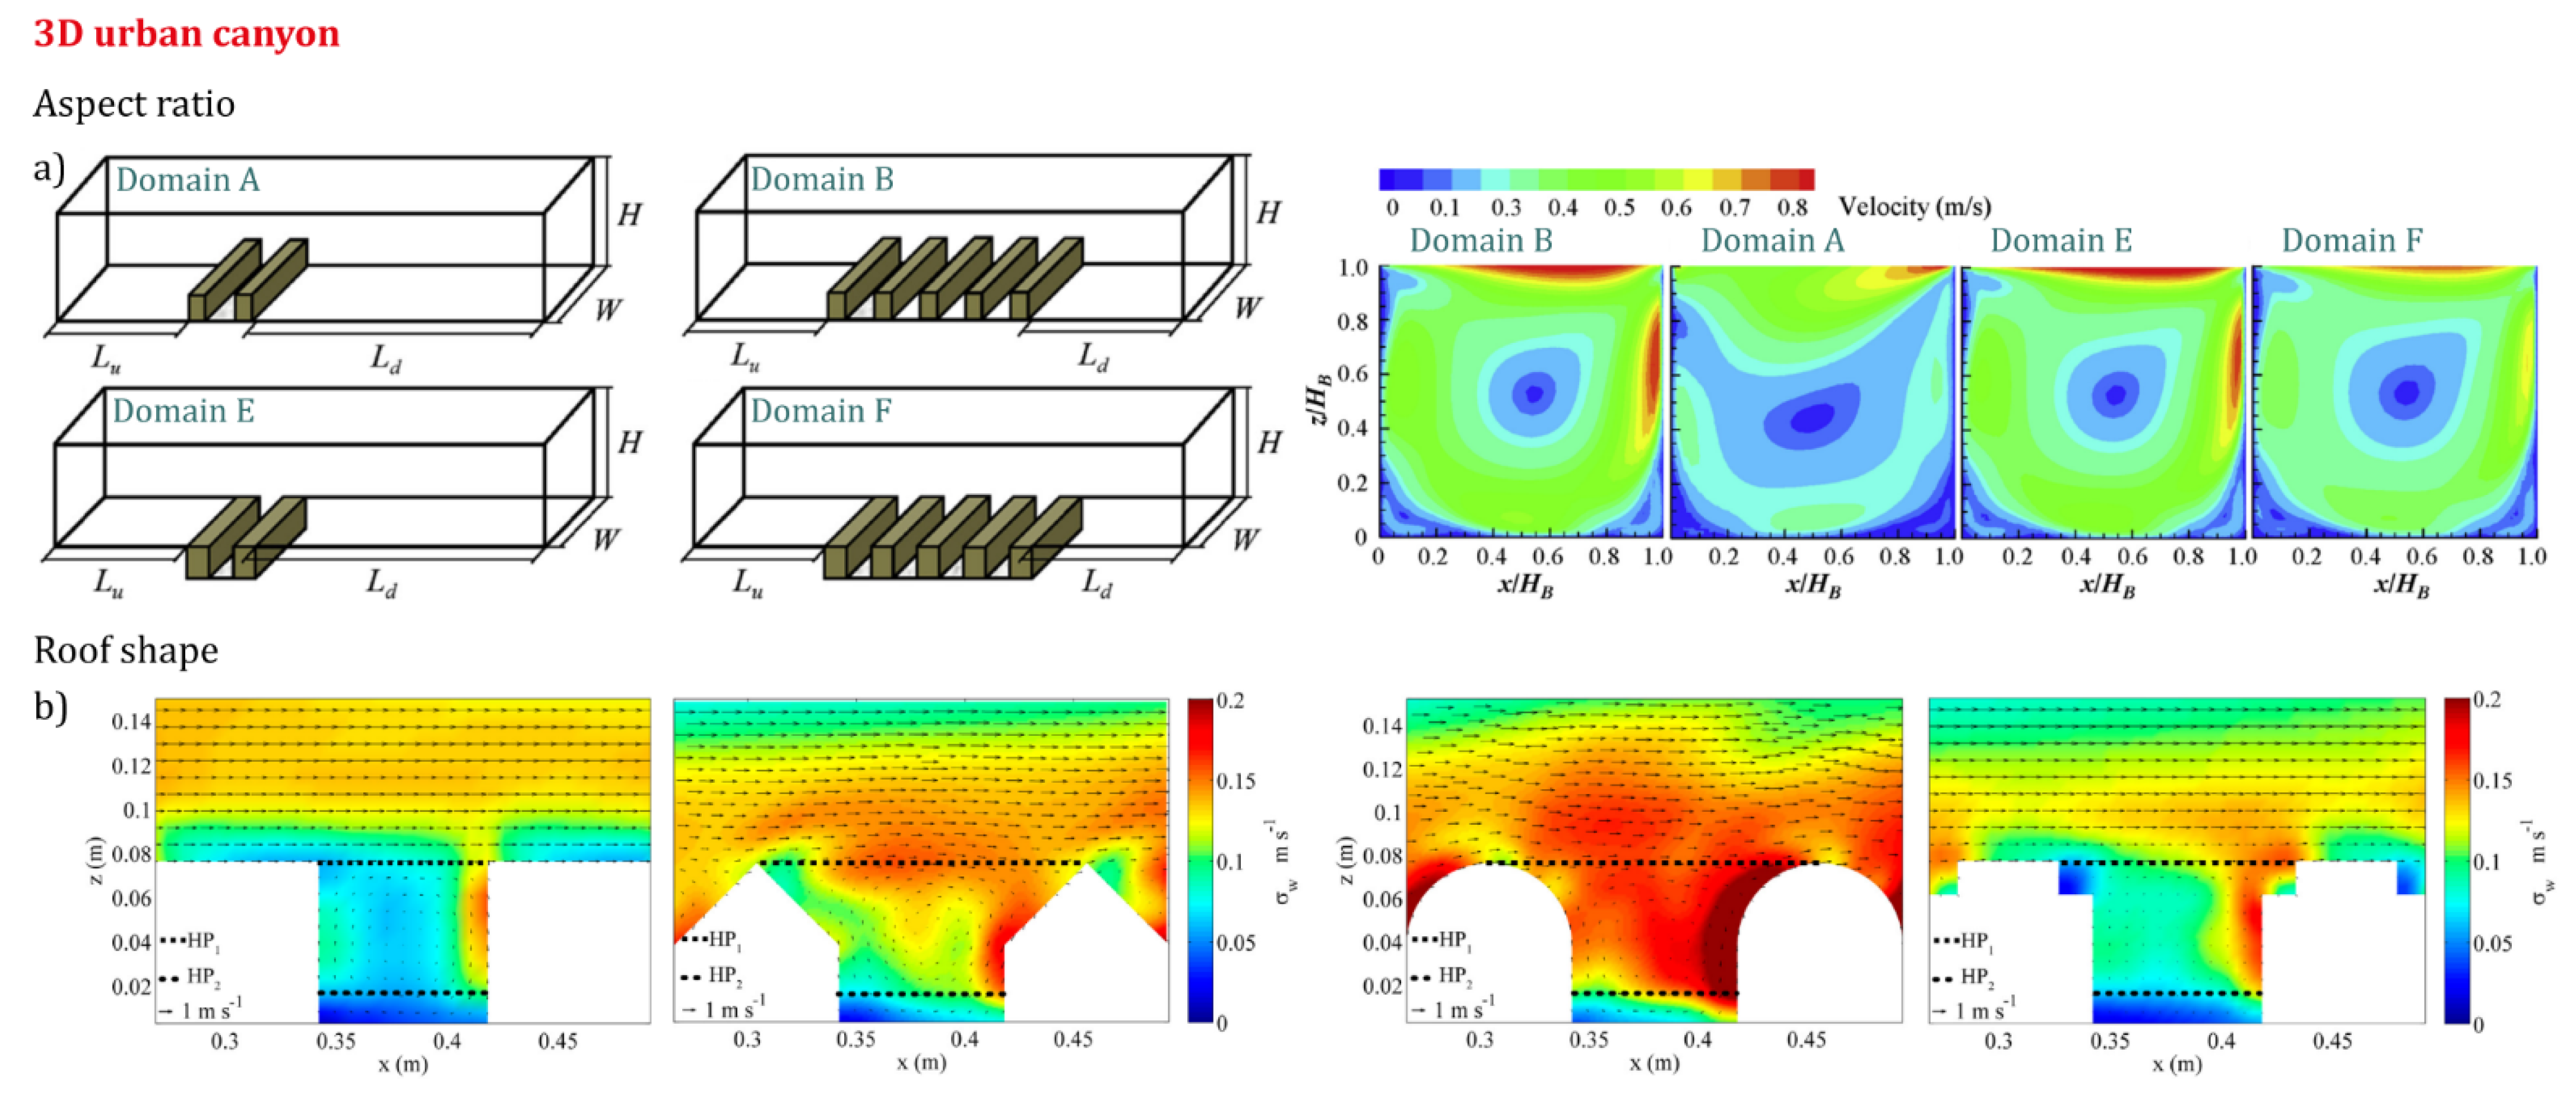
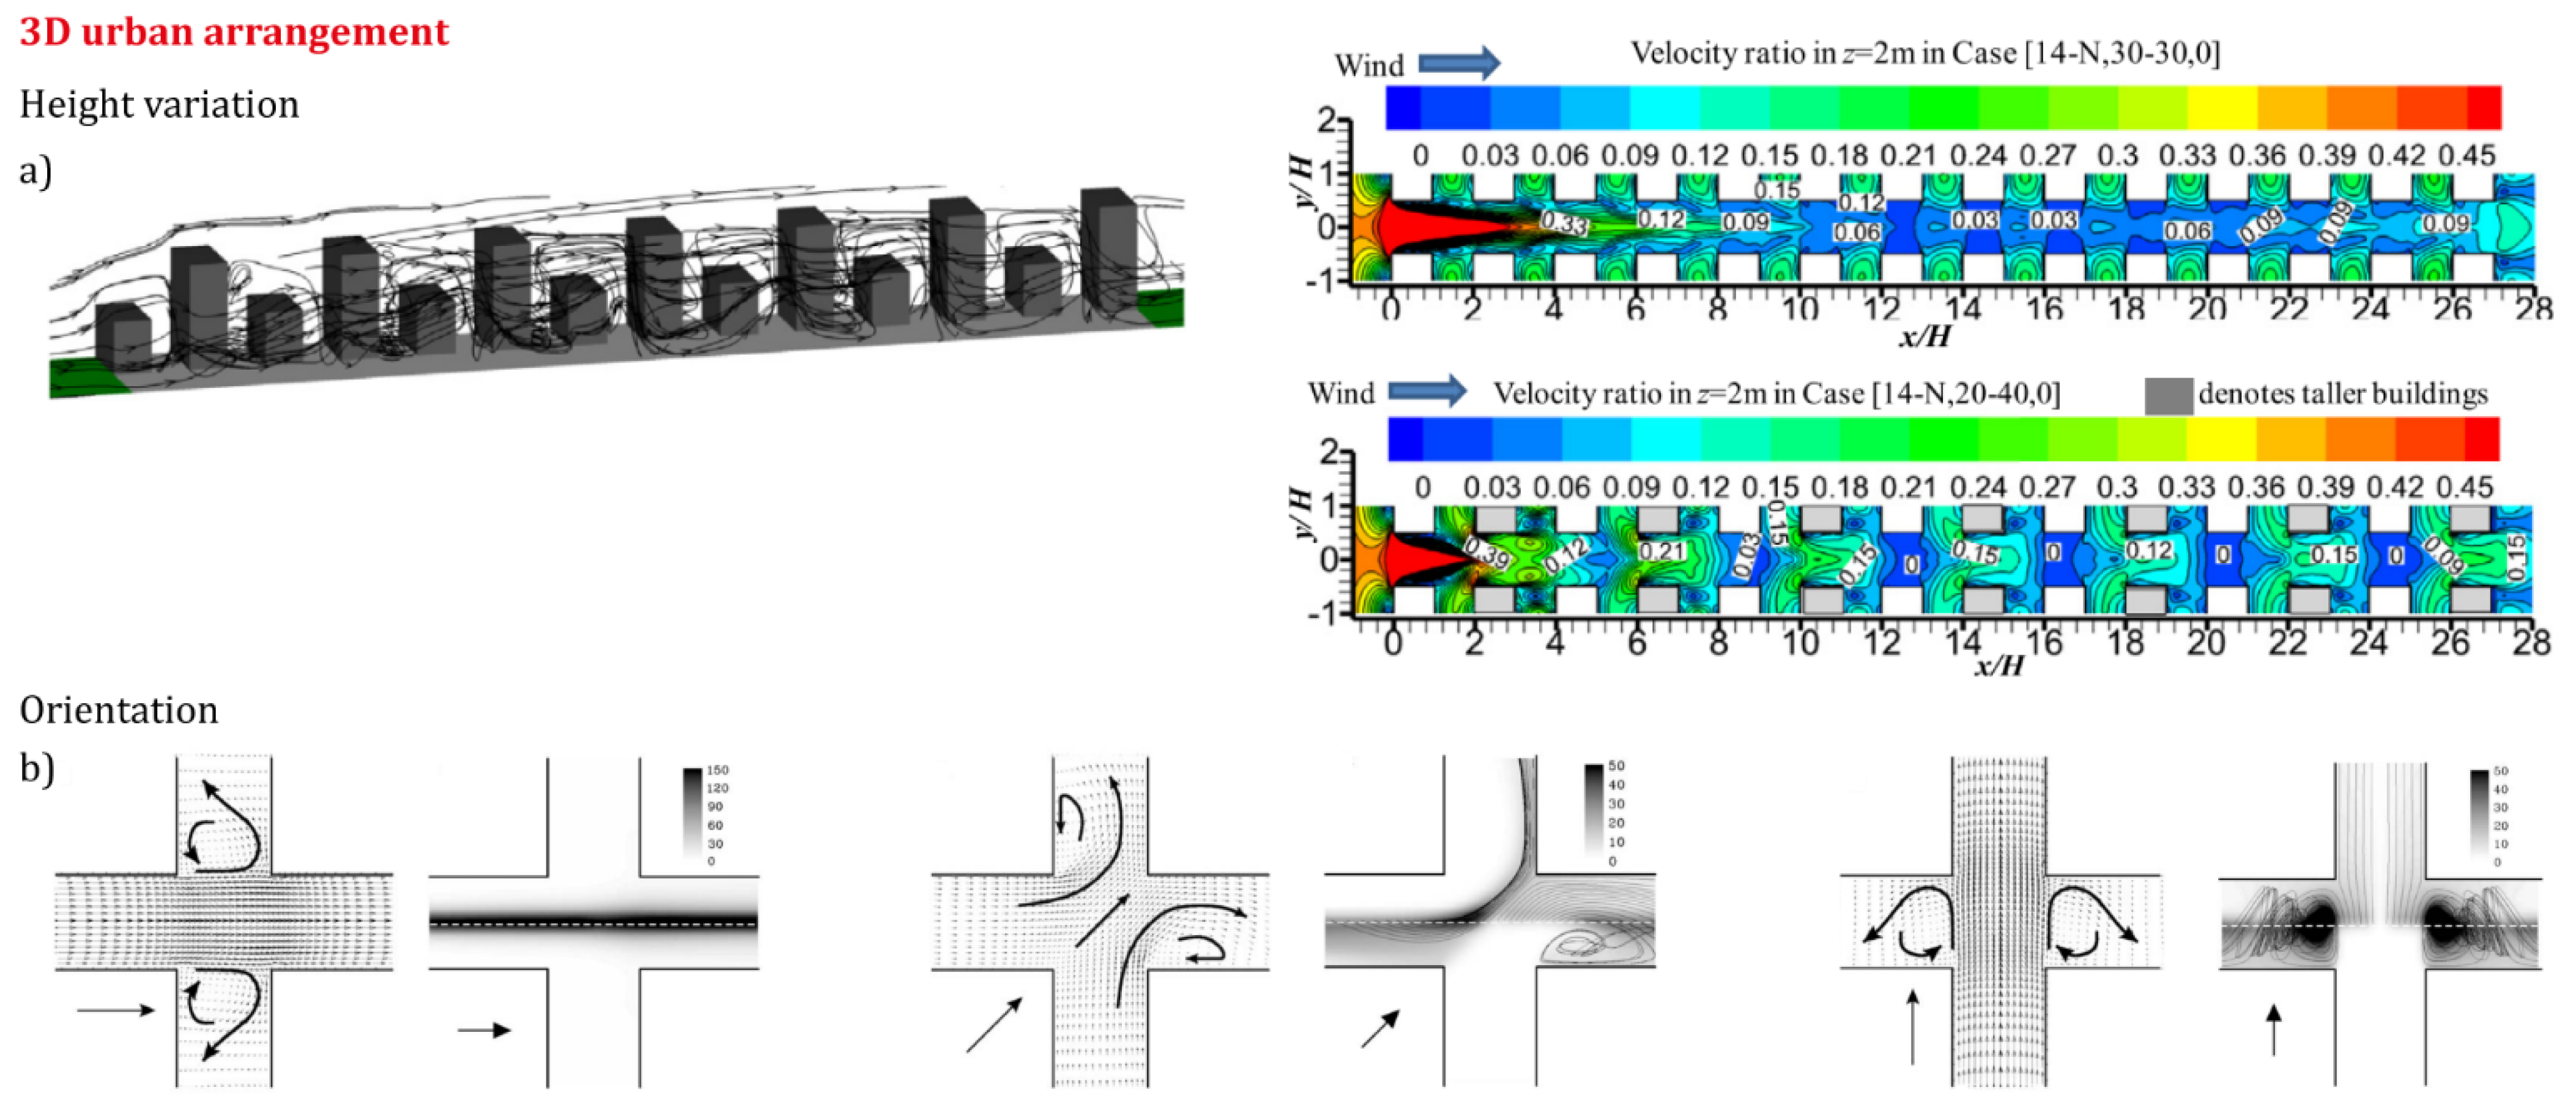
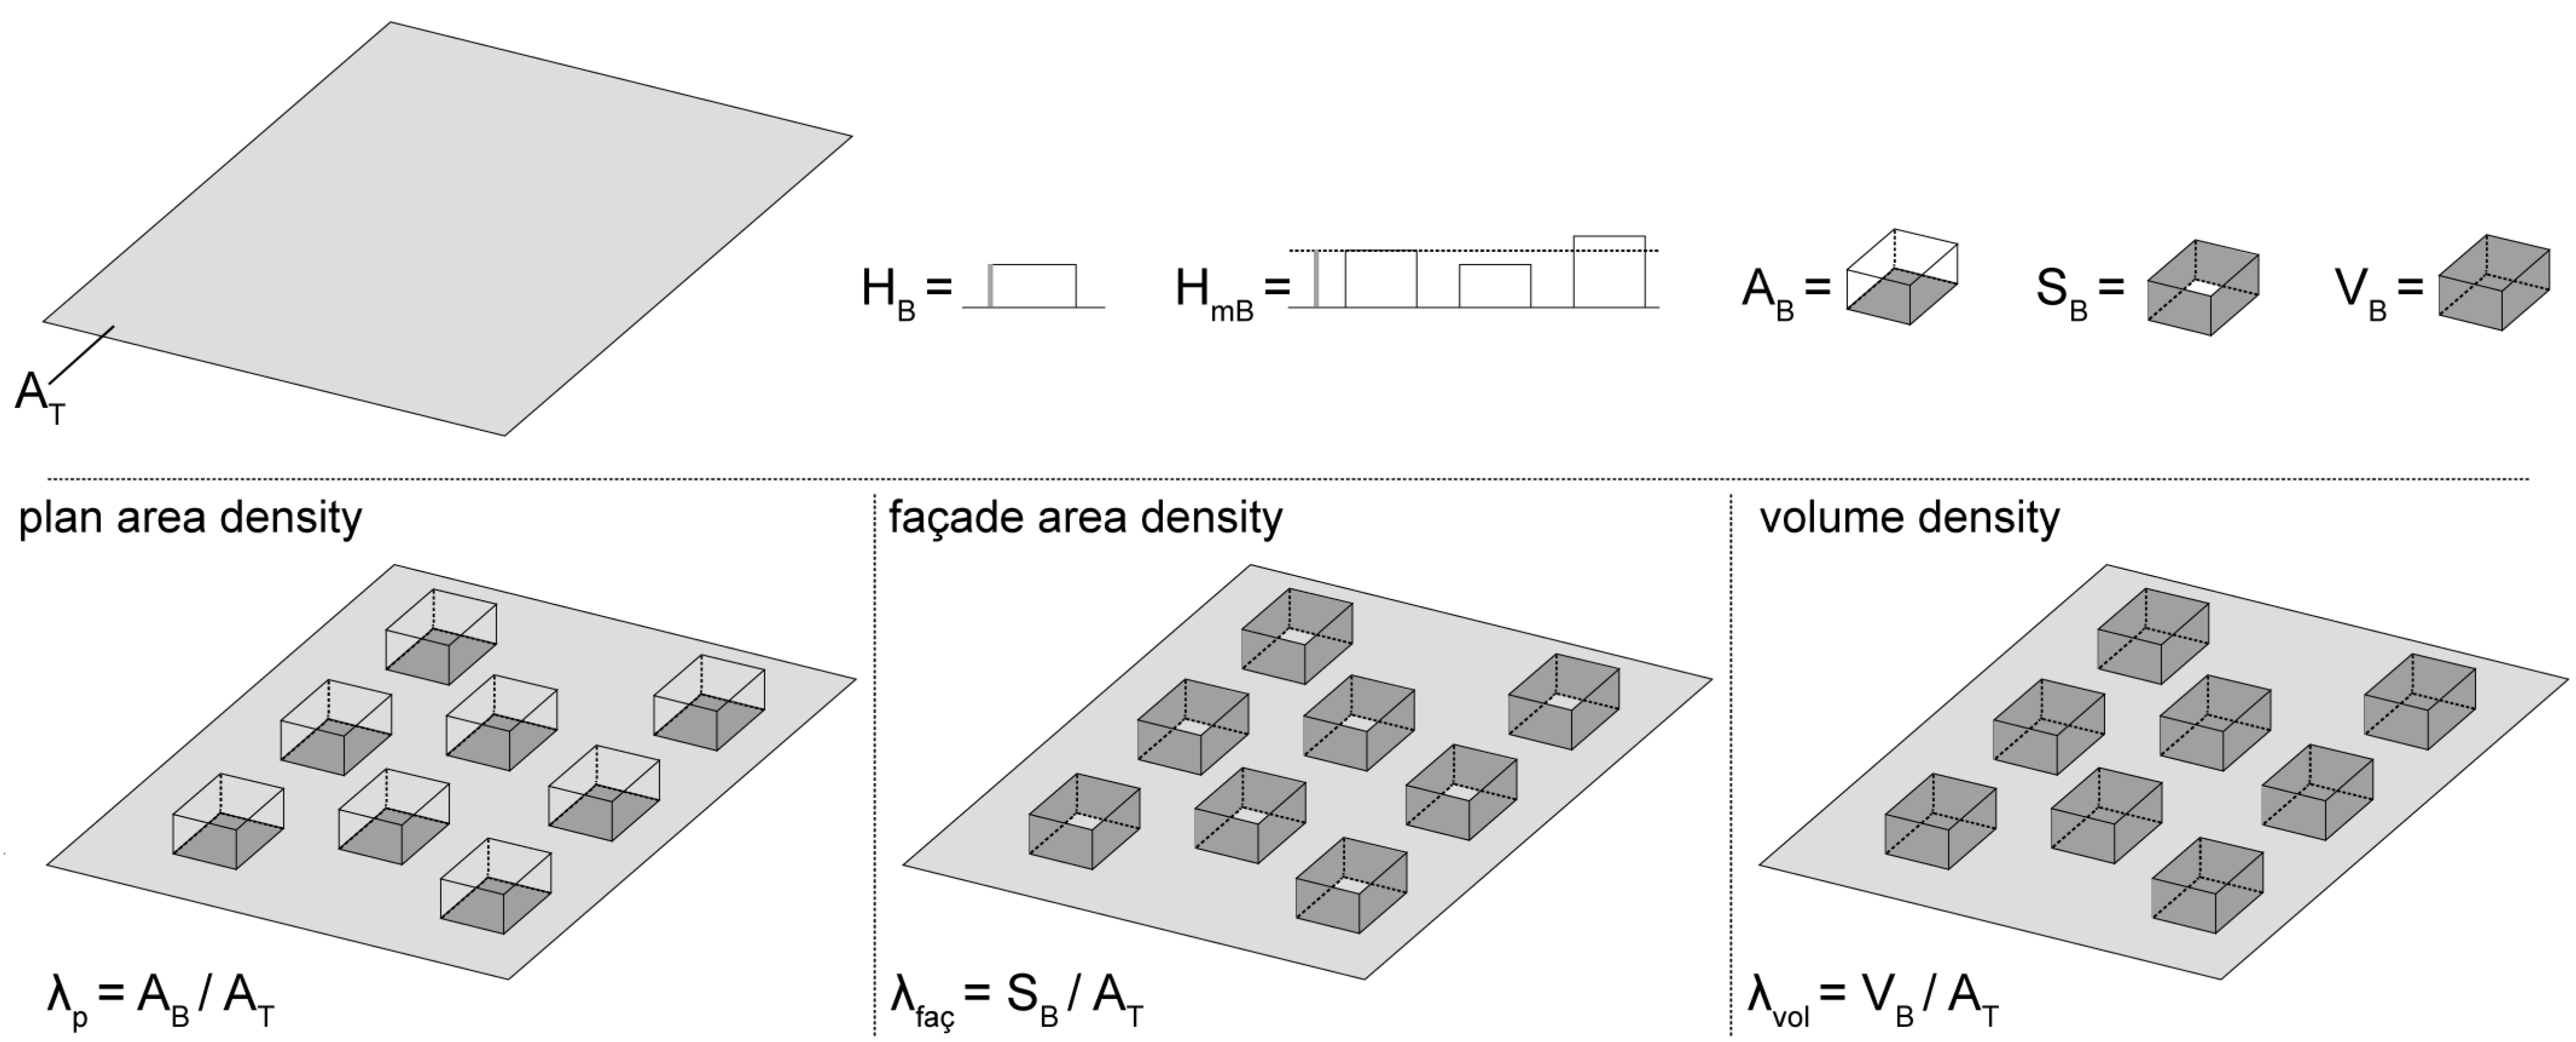
Daily Mean Temperature (°C)
<1010–25>25
Daily mean wind velocity range causing thermal discomfort due to insufficient wind speed (m/s)--<0.7
Daily mean wind velocity range realizing acceptable wind environment (m/s)<1.3<1.50.7–1.7
Transition range of daily mean wind velocity from acceptable wind to strong wind (m/s)1.3–2.01.5–2.31.7–2.9
Daily mean wind velocity range causing strong wind-inducted discomfort (m/s)>2.0>2.3>2.9
Publisher’s Note: MDPI stays neutral with regard to jurisdictional claims in published maps and institutional affiliations.

