Abstract
Coatings for filtration applications based on epoxy resin mixtures with isopropanol were synthesized using the dip-coating technique. The nanomaterials used were carbon nanospheres (CNS) synthesized by chemical vapor deposition (CVD) and commercially obtained Vulcan XC-72 (VC). The permeation flux and permeability of the coatings were determined by vacuum filtration of pure water applying different working pressures obtaining maximum values of 0.5555 cm3/s and 1.19 × 10⁻⁹ m2, respectively, for the CNS6 coating at 26,664 Pa. The minimum values obtained for the permeation flux and permeability were 0.0011 cm3/s and 1.21 × 10⁻¹¹ m2, for the coating CNS3 at 39,996 Pa. This study analyzed the effect of nanomaterials and the addition of isopropanol at different volumes on the permeability of the coatings. The results show that the permeability was influenced by the number of pores present rather than by their diameter. The number of pores were obtained between the ranges 1–12 μm for all the coatings. The study of computational fluid dynamics (CFD) through a free and porous medium, showed that it is possible to accurately determine flow velocities (m/s) through and inside the composite coatings. Understanding the flow behavior is a practical strategy to predict the performance of new nanocomposite coatings.
1. Introduction
Water shortage caused by population growth, industrial activity, and increased energy demand is one of today’s most important problems [1]. Optimizing existing water treatment technologies is the key to ensuring a sufficient supply of clean water in the future [2,3]. However, the production of plenty and adequate drinking water is a great challenge since conventional water treatments are not effective enough to remove all contaminants and require high energy consumption, which represents a high impact on the environment [2,4,5]. Filtration processes are considered one of the most effective and viable technologies to address today’s challenges related to water treatment. Agriculture is a sector where it is of great importance to generate water cleaning and reuse systems since it consumes approximately 70% of the available fresh water [6,7].
However, one of the biggest problems with filtration technologies is the decreased flow due to fouling of the membranes which implies a limitation in applying these technologies in sectors such as agriculture, by causing an increase in costs and energy consumption [8]. To mitigate the above problems in filtration processes, the use of polymeric-based composite materials has proven to be a very effective alternative to improve permeability, selectivity, and reduce fouling in techniques such as microfiltration (MF), ultrafiltration (UF) and nanofiltration (NF). Such filtration technologies work with the application of pressure, and their selectivity is highly dependent on pore size [9,10,11,12,13]. The high permeability of filter materials is directly related to their good performance and is also a crucial factor in reducing energy consumption [14,15,16]. The selection of the suitable material and manufacturing process is crucial, as they directly affect the internal structure, porosity, hydrophilic nature, and charge properties. These properties impact the performance by determining how they interact with contaminants and whether they require high or low pressures to function properly [11,17,18,19,20].
Recent studies report that CNS has increasingly been used in a wide range of applications, such as catalysis processes, lithium-ion batteries, oxygen reduction, supercapacitors, water treatment, corrosion inhibitors and energy storage and conversion [21,22,23,24,25,26]. CNS are spherical carbon structures with sizes between 50 nm and 1 µm [26,27]. CNS being simple to synthesize, and relatively inexpensive, also has advantages such as non-toxicity, chemical stability, and electrical conductivity [22,28]. CNS produced by a hydrothermal process form a great variety of oxygen-containing functional groups on their surface, which serve as hydrophilic sites that generate a better affinity with water and a higher facility for mixing with polymers [29,30,31,32,33,34]. These characteristics mean that the CNS do not require chemical activation to increase their hydrophilicity, which avoids high consumption of chemical reagents and makes them a profitable material for the manufacture of filtration materials [30,32,33,35].
One polymer used to make homogeneous and stable mixtures with CNS is epoxy resin [36,37,38]. Epoxy resin is an insulating material with high mechanical resistance, high dielectric strength, and can generate a very stable and moldable support [28]. With this polymer has been possible to obtain mixtures with CNS that present good dispersion and mechanical resistance. Epoxy resin can adapt to different forms of molding and shows high chemical resistance without losing the properties of interest of the CNS [22,23,28,39]. In this study, chemical and mechanical stability properties on materials improved through epoxy resin mixtures with CNS (Epoxy-CNS) to manufacture thin filtration coatings for water treatment purposes. These composite coating materials were designed for agricultural irrigation water cleaning and reuse systems in order to remove suspended solids and fine particles which are undesirable due to clogging of irrigation systems [40].
To better understand the effect of the CNS on the mixture with the epoxy resin, the performance of the filtrations through coatings was compared against the performance of coatings based on the mixture of epoxy resin with carbon Vulcan XC-72. Vulcan XC-72 is a nanomaterial whose physicochemical characteristics have already been widely studied. The composite coatings were made on a stainless-steel mesh, which, by covering the mesh openings with the mixture, allows to produce films with adequate porosity for filtration applications. The efficiencies of the filtration process for these films were determined by measuring the total filtration rate of pure water at different applied pressures.
The analysis technique used to study hydrodynamic flow in a non-invasive way was performed by a computational fluid dynamics study (CFD). This is an analysis technique used to study hydrodynamic flow in a non-invasive way. CFD is based on mathematical models for the solution of partial differential equations (PDE) that govern the flow and transport processes. These are known as the equations of change, conservation of mass and moment, and the continuity equation for individual chemical species [41,42,43]. These PDEs are coupled to the initial and boundary conditions and are solved using numerical methods and domain discretization techniques [1,43]. These flows are represented by the Darcy and Navier Stokes equations to perform the simulations of the regions of continuous free flow and porous flow that are analyzed in this study [44].
The CFD analysis was carried out to determine the distribution of flow velocities in the internal zone of the filtration cell, as well as through the nanocomposite coatings. For these tests, a simple filtration cell design was used, consisting of a vertical cylinder-shaped filtration zone, secured against leakage. This, so that its design would not intervene in the characterization of the flow through the synthesized nanocomposite coatings. With the information obtained by this analysis, we can understand how the characteristics of the nanocomposite coatings, such as their thickness and percentage of porosity, affect the flow and the working pressure requirement. Additionally, these studies provide details about the aspects of the filtration cell design and the structural properties of the coatings that could be modified to optimize the filtration process and to reduce the required working pressure.
2. Materials and Methods
2.1. Preparation of Materials
2.1.1. Preparation of the Catalyst for the Synthesis of Carbon Nanospheres
Colloidal silica was used as a support to produce the catalyst for the synthesis of carbon nanobeads. For the colloidal silica preparation, tetraethyl orthosilicate (TEOS) was used with a 98.0% (Minerales y Reactivos Company, Cuautitlan Izcalli, Mexico). Reagent grade nitric acid (J. T. Baker, Phillipsburg, NJ, USA) was used as the catalyst for the silica. Nickel nitrate (Ni(NO3)2·6H2O) (J. T. Baker, Phillipsburg, NJ, USA) was used to prepare the catalyst. Silica was prepared as described in the literature from Brinker and Sherer, 1990 [45].
The catalyst was made with colloidal silica prepared by the sol-gel process as a support, using a 1:1:4 ratio of tetraethyl orthosilicate (TEOS), ethanol and water. The TEOS had a purity of 98.0% and was supplied by Minerales y Reactivos Company (Cuautitlan Izcalli, Mexico). Reagent grade nitric acid from J. T. Baker (Phillipsburg, NJ, USA) was used as the catalyst for the silica. The catalyst was prepared using nickel nitrate hexahydrate, from Sigma Aldrich (Darmstadt, Germany). The necessary amount of nickel nitrate hexahydrate was added to the suspension of silica nanoparticles to obtain the weight fractions (50%) of silica and (50%) of nickel oxide.
The suspension was placed in a laboratory rotary oven with external heating for 3 h at 350 °C to evaporate the solvent. The reactor rotated at a speed of 100 rpm and a one-inch diameter rod was introduced to serve as the grinding medium. Once the catalyst powder was obtained, it was calcinated in an oxidizing atmosphere within a laboratory muffle furnace at 650 °C. All solutions were prepared using deionized water with a resistivity of 18 MΩ (obtained using a Millipore purification system) [45].
2.1.2. CNS Synthesis
The carbon nanospheres were synthesized using the CVD process [46,47,48]. The process was carried out using a 316 L stainless steel reactor, 2″ (inches) in external diameter, and 1.6 m long, with external heating. The heating was carried out using electrical resistances. The NiO nanoparticles supported on the silica were placed inside the reactor. Subsequently, using a vacuum of 200 mmHg, the oxygen present was evacuated for 1 min. To ensure the elimination of oxygen, a nitrogen flow of 1.0 L/min was continuously introduced for 30 min. Inside the reactor, NiO particles were reduced to metallic nickel using a hydrogen/nitrogen mixture of 90:10 v/v at a flow of 1.0 L/min for 30 min. To start the growth of the CNS, a flow of acetylene 0.5 L/min was introduced continuously for 30 min. Afterwards, the reactor was cooled to room temperature and subsequently, the CNS were removed from the reactor. Finally, the CNS were treated in an oxidizing atmosphere in a muffle furnace at 500 °C for one hour, in order to eliminate the amorphous carbon present on the surface of the CNS.
2.1.3. Preparation of the Epoxy Resin-CNS Mixture
We weighed 0.1 g of CNS to which 1 mL of glycerin was added. Epoxy-CNS mixtures with isopropanol variations were made using volumes of 0, 3 and 6 mL for each 10 g of epoxy resin, glycerin, and carbon nanomaterial mixture. These mixtures were subjected to magnetic stirring for 10 min and ultrasonic stirring for 10 min at room temperature. Once the stirring period was over, 4.26 g of epoxy resin catalyst (diethylenetriamine (DETA)) and 5.7 g of epoxy resin (bisphenol A, Resins—DEGBA) obtained from Recubrimientos y Resinas de Querétaro Company (Querétaro, México), were added. The resulting mixture was subjected to mechanical stirring of 5 min and 10 min of ultrasonic stirring.
2.1.4. Elaboration of the Composite Coating on Steel Mesh
For the preparation of the composite coating, a 304 stainless-steel mesh number 80 of the Tyler series was used, which has an opening of 0.178 mm. Pieces with dimensions of 12 × 4 cm were cut from the mesh to prepare the coating. The steel mesh pieces were sonicated in acetone (Baker) for 30 min to remove residual contaminants. Subsequently, the mesh pieces were rinsed with deionized water. Once the resin suspension with the nanospheres had been prepared, the mesh pieces were coated using an immersion-removal system. It should be noted that a scraper was added to the system to remove the excess suspension. Subsequently, the coated pieces were subjected to a heat treatment of 60 °C for one hour. Coatings with suspensions prepared with Vulcan XC-72 and epoxy resin were also prepared applying the methodology described in the Section 2.1.3 and Section 2.1.4 of Materials and Methods (Section 2.1). This was done to have a standard and make a comparison with a widely studied nanomaterial.
2.2. Physicochemical Characterization of Materials
The morphological analysis and particle size of the CNS were determined using the JEOL JSM-7610F brand scanning electron microscope (SEM). The structure of the materials was determined with Rikagu Dmax2100 X-ray diffractometer, using Cu Kα1.2 (λ = 1.5406/1.5442 Å). A Keyence microscope model VHX-5000 was also used to determine the porosity and surface morphology of the membrane. A Mitutoyo micrometer was used to determine the thickness of the coatings. Three nanocomposite coatings of each treatment were used for the determination of the mean ± standard deviation [SD] of the pore counting and the thickness determination.
2.3. Experimental Design
2.3.1. Composite Coating Filtration Process
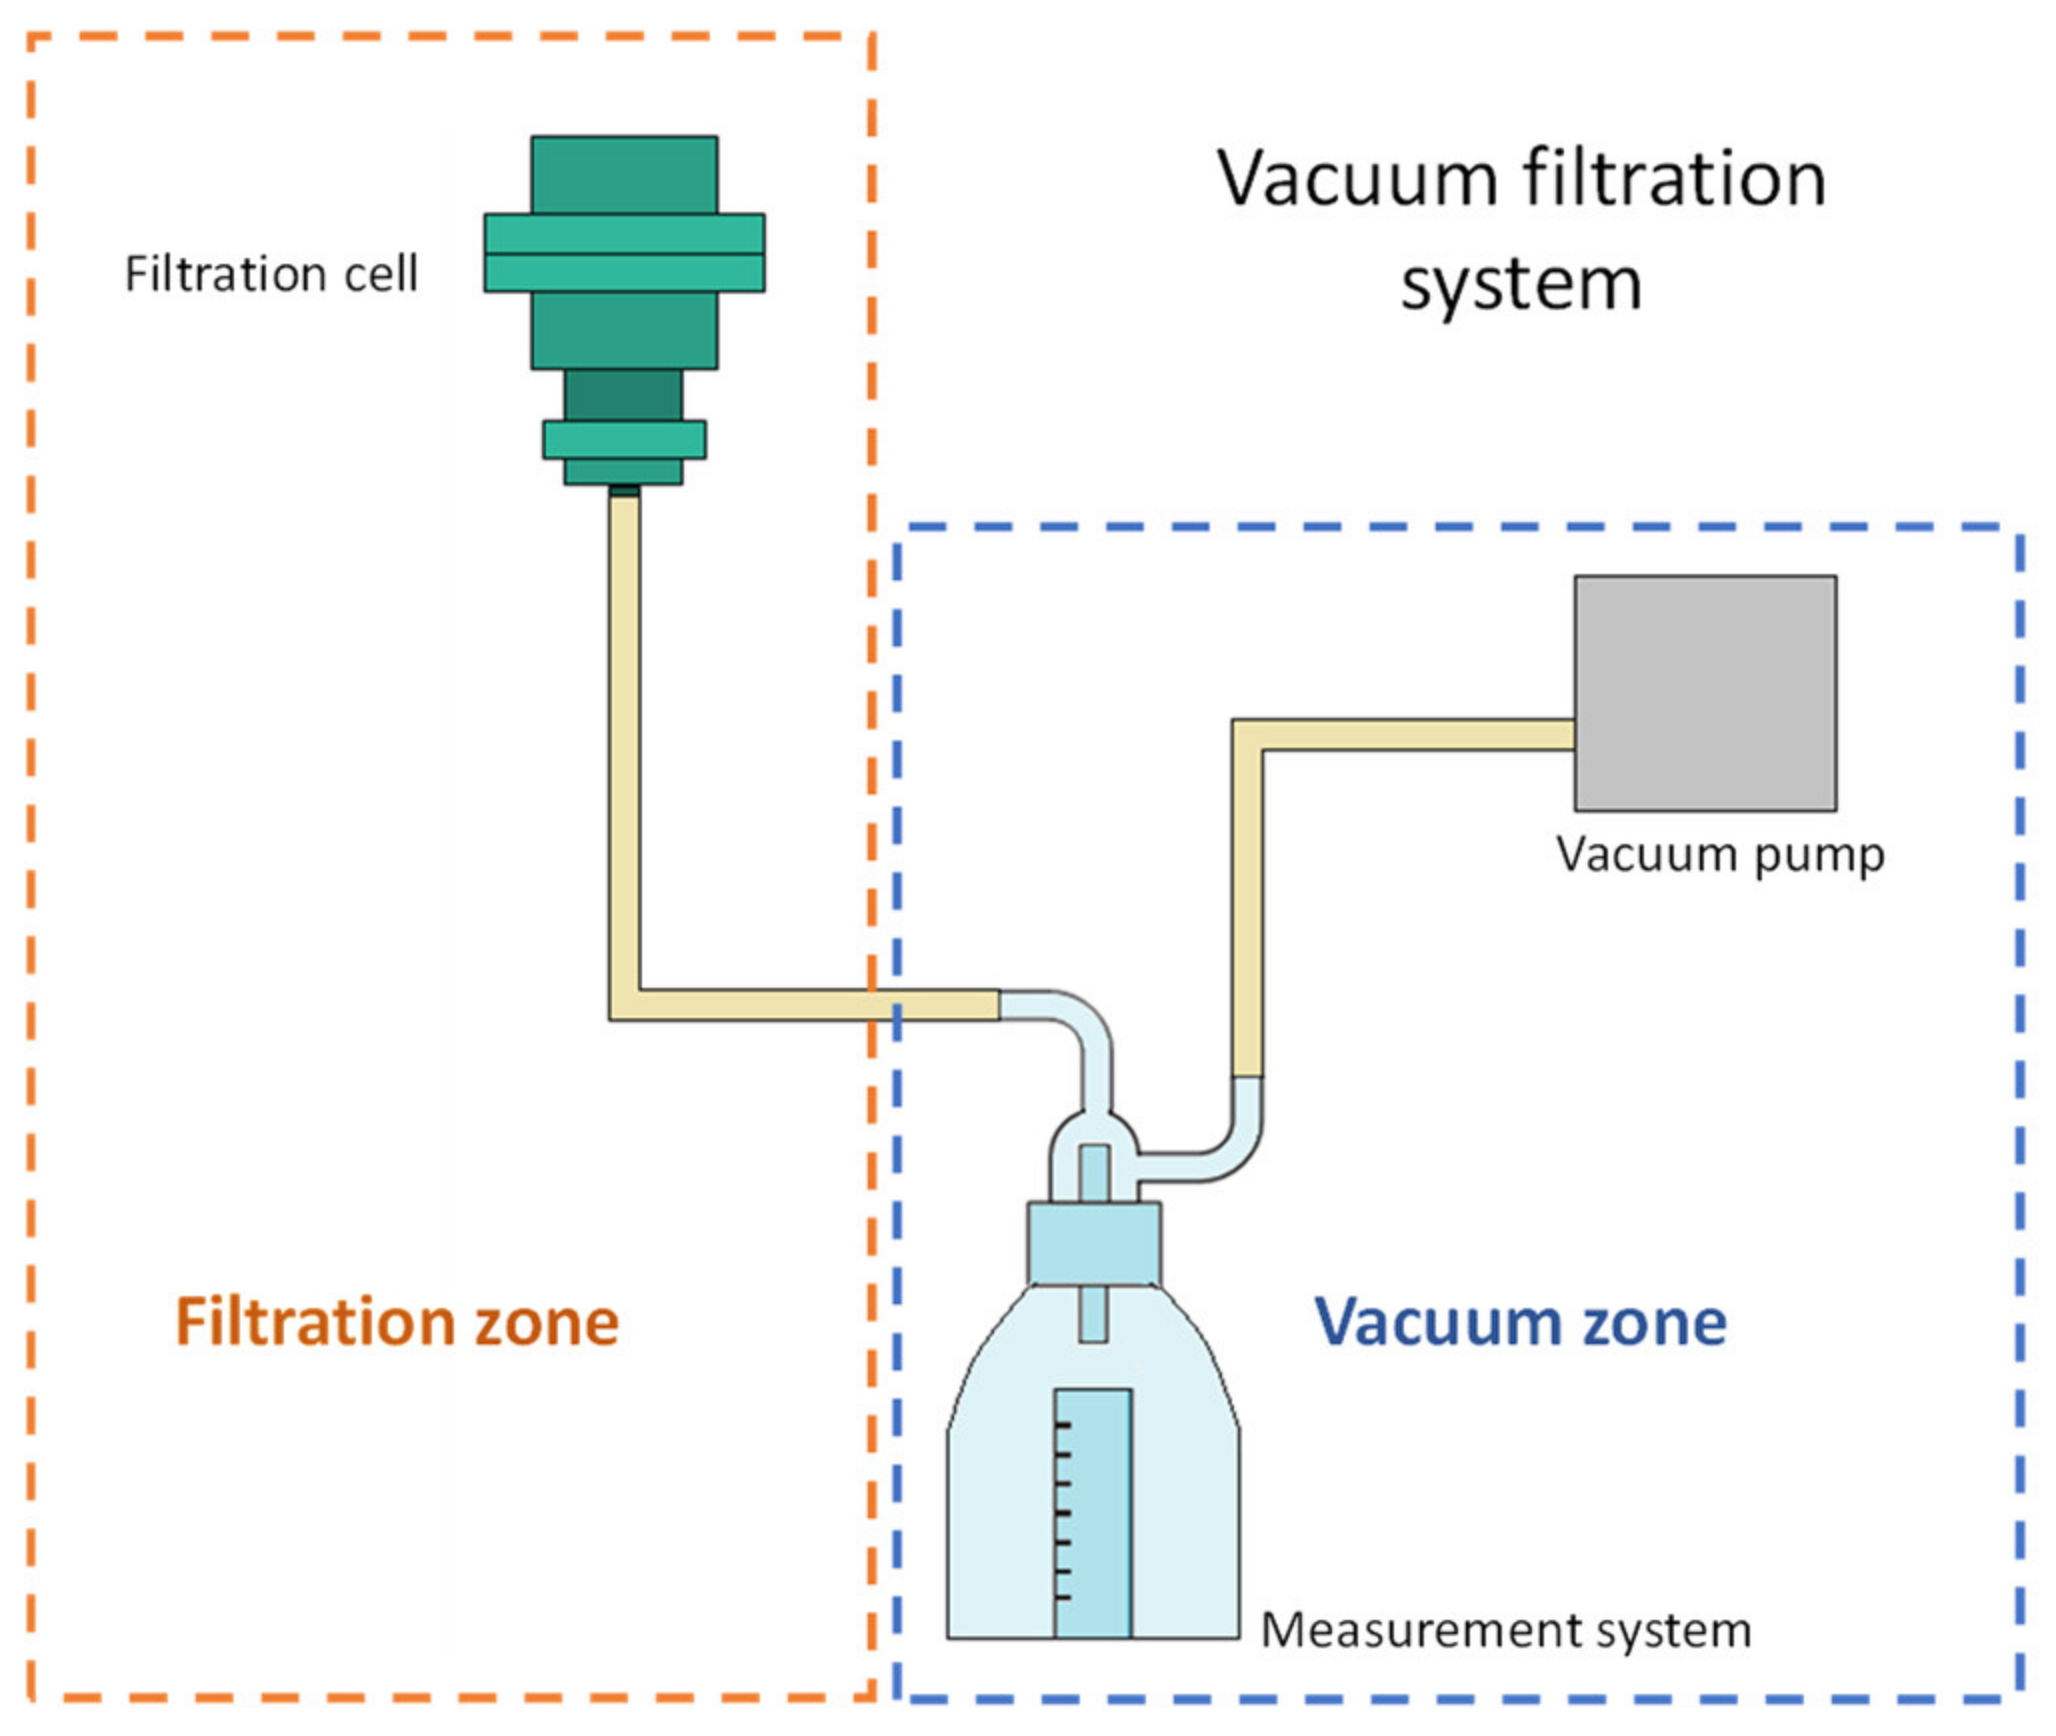
A filtration system was designed and built to perform the filtration tests. An adjustable vacuum pump Siemens model Q2-J14 (Siemens S. A. de C. V, Mexico City, Mexico) was used for the system, with which the suction pressure was varied from 13,332 to 39,996 Pa. The system allows measuring the volume of filtrate in a 10 mL cylinder. Figure 1 shows a filtration system diagram where the tests were carried out, it consists of a filtration zone and a vacuum zone. The vacuum is adjusted by varying the power of the pump.
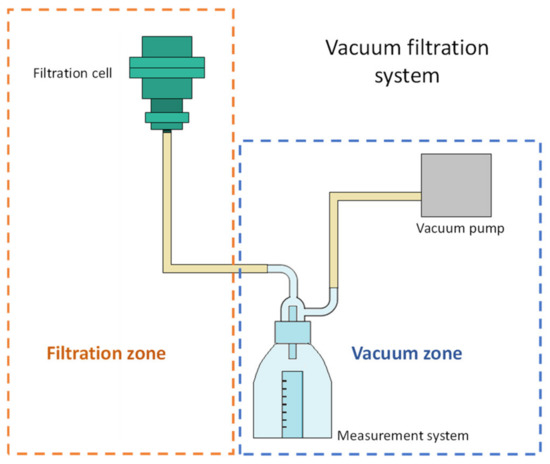
Figure 1.
Scheme of the vacuum filtration system.
2.3.2. Filtration Cell Design
The filter cell used in these experiments was manufactured by 3D printing, using polylactic acid (PLA) as printing material. Figure 2a shows the components of the filtration cell designed and built to execute the evaluations of the synthesized composite coatings. The cell is made up of a feeding section for the liquid to be filtered, which contains a circular hole for the set of the neoprene O-ring as a seal and to delimit the filtering area. Subsequently, the composite coated mesh to be evaluated is set on the neoprene gasket, which is fixed between the upper (feed) and lower (filtration) parts using screws tightened with a torque wrench. Figure 2b shows a diagram of the feeding zone where the liquid is fed through the upper part of the cell and the filtrate is collected in the lower part.
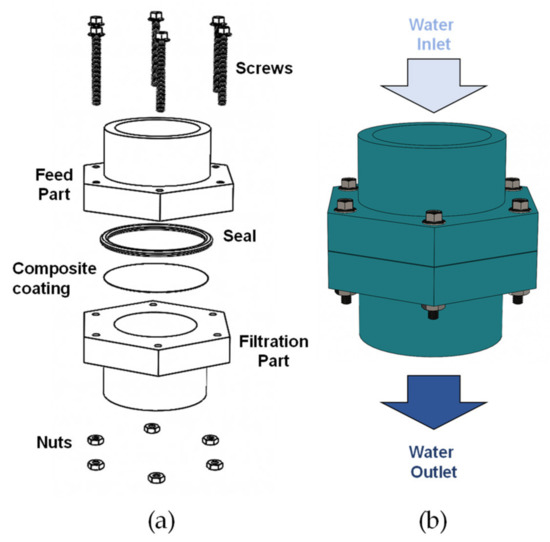
Figure 2.
(a) Scheme of the evaluated filtration cell, (b) description of the feeding and outlet of the filtered liquid.
2.3.3. Calculation of the Permeation Flux and Permeability of the Coating
The calculation of the permeation flux Q (cm3/s) of the coated meshes was carried out using Equation (1):
where V is the volume of the permeate (5 mL) and Δt is the filtration time. The intrinsic permeability k (m2) was also calculated using the Darcy equation Equation (2), which is given by:
where µ is the viscosity of the liquid to be filtered, in this case, water (0.001 Pa·s), L is the thickness of the coating (m), A is the evaluated area given by the interior of the O-ring (0.000178 m2), and ΔP is the pressure change to evaluate (Pa).
2.4. Computational Modeling
2.4.1. Description of the Simulation Domains
Figure 3 shows the domains used to perform the computational filtering simulation when applying vacuum. The dimensions of the domain are indicated as the diameter of the filtering section (Dfi) and the feeding section (Dfe). Figure 3 also shows the diameter of the composite coating (Dm), its thickness (Hm) the height of the filtration (Hfe) and feeding (Hfi) zones.

Figure 3.
Dimensions of the domains used.
Table 1 shows the symbols and values of the domain dimensions used in the simulation. As shown in the table, the filtering and feeding sections have the same measurements.

Table 1.
Dimensions of the domains evaluated in the filtration process.
2.4.2. Formulation of the Numerical Simulation
The Strokes-Brinkman flow function was selected to describe the behavior of the fluid in the coupled free and porous regimes in the cell.
Porous Medium
In the region of the porous composite coating, the flow is governed by the Brinkman equations, which is given by Equation (3) [43]:
where ρ is the density of the fluid, v is the velocity field, P is the pressure of the fluid, μ is the kinematic viscosity of the fluid, and k is the permeability.
Free Medium
On the other hand, the Navier-Stokes equations (Equation (4)) was used to solve the flow in the free region, which is given by:
Equation (5). represents the continuity equation for an incomprehensible fluid (Sahimi 2011).
2.4.3. Boundary Conditions
As a limit condition for the simulation, the area of the porosity in relation to the total area of the composite coating was determined, assuming that the coating is homogeneous. The temperature and density of the feed were constant. The conditions are time dependent; the feed stream is laminar, and no chemical reactions occur in the feed stream. Slip conditions were applied at the inner boundaries within the filtration cell sections.
3. Results and Discussion
3.1. Physicochemical Characterization of Materials
3.1.1. Characterization of Nanostructured Carbon Materials
The synthesized carbon material had a spongy appearance, which consisted of agglomerates of CNS. Figure 4 shows, a micrograph of the Scanning Electron Microscope (SEM) obtained at 25,000× with an energy of 3 kV using secondary electrons. With these conditions, it was possible to obtain high-resolution details of the morphology of the nanospheres. A round structure of the carbon nanospheres can be seen, with an average individual diameter of 216 nm. A growth with a linear tendency of agglomerate is observed in the nanospheres, with a uniform growth, greater details of the structure cannot be achieved by the equipment and the conditions used.
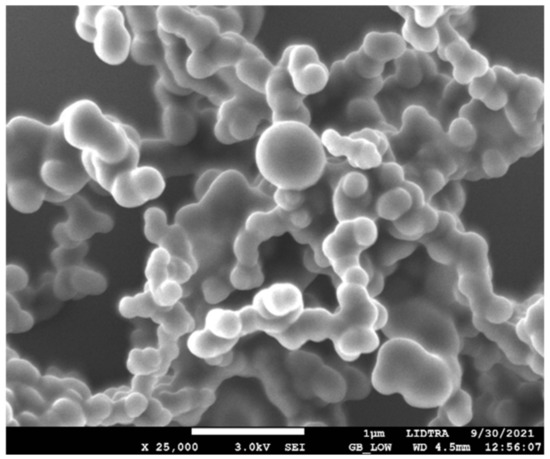
Figure 4.
SEM micrograph of carbon nanospheres.
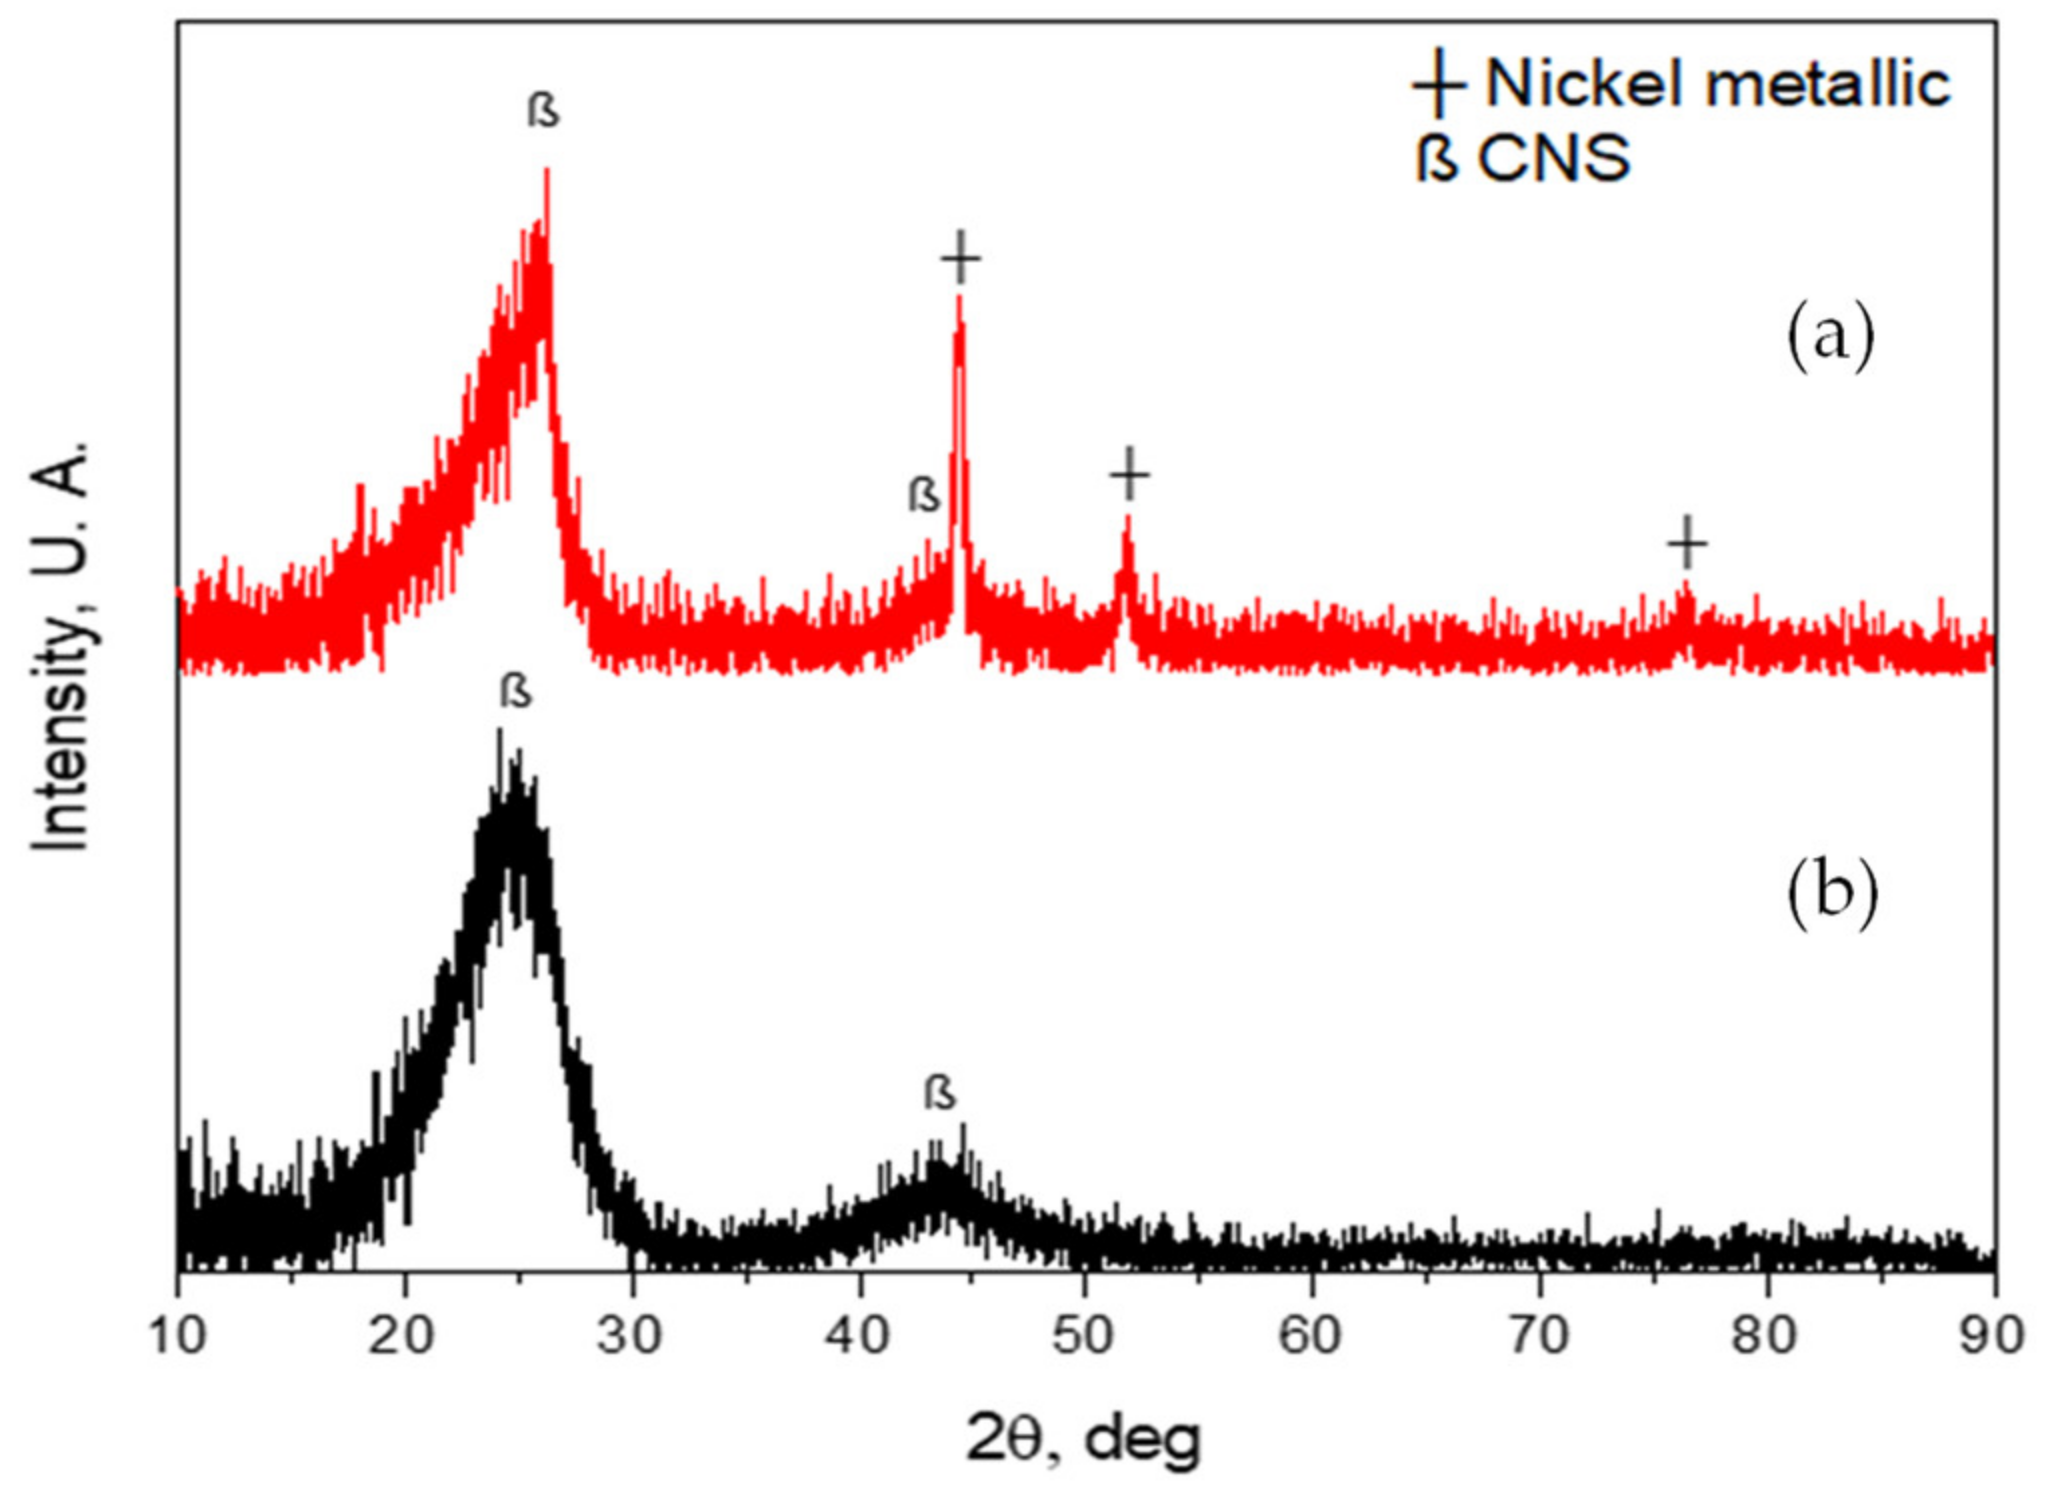
Figure 5a shows the diffractogram of the nanospheres from the CVD reactor with Ni catalyst traces. This figure shows the diffraction of the characteristic crystalline planes of carbon materials, in this case of the nanospheres (CNS), at 2θ of 26.126° and 43.58°; for nickel at 2θ 44.46°, 51.75° and 76.36°, which come from the catalyst to obtain the nanospheres [49,50,51,52]. On the other hand, Figure 5b shows the diffractogram of the nanospheres, but without Ni catalyst traces. In this figure, only the crystalline planes of the characteristic graphite of the nanospheres can be seen at 2θ of 26.126° and 43.58° [53,54]. The traces of Ni catalyst were present because these CNS were taken from the tray where the catalyst was poured before the CVD synthesis. CNS of both diffractograms were subjected with a thermal treatment at 500 °C for 1 h.

Figure 5.
(a) XRD of carbon nanospheres with Ni catalyst traces; (b) XRD of carbon nanospheres without Ni catalyst traces.
3.1.2. Characterization of Epoxy-Carbon Coatings
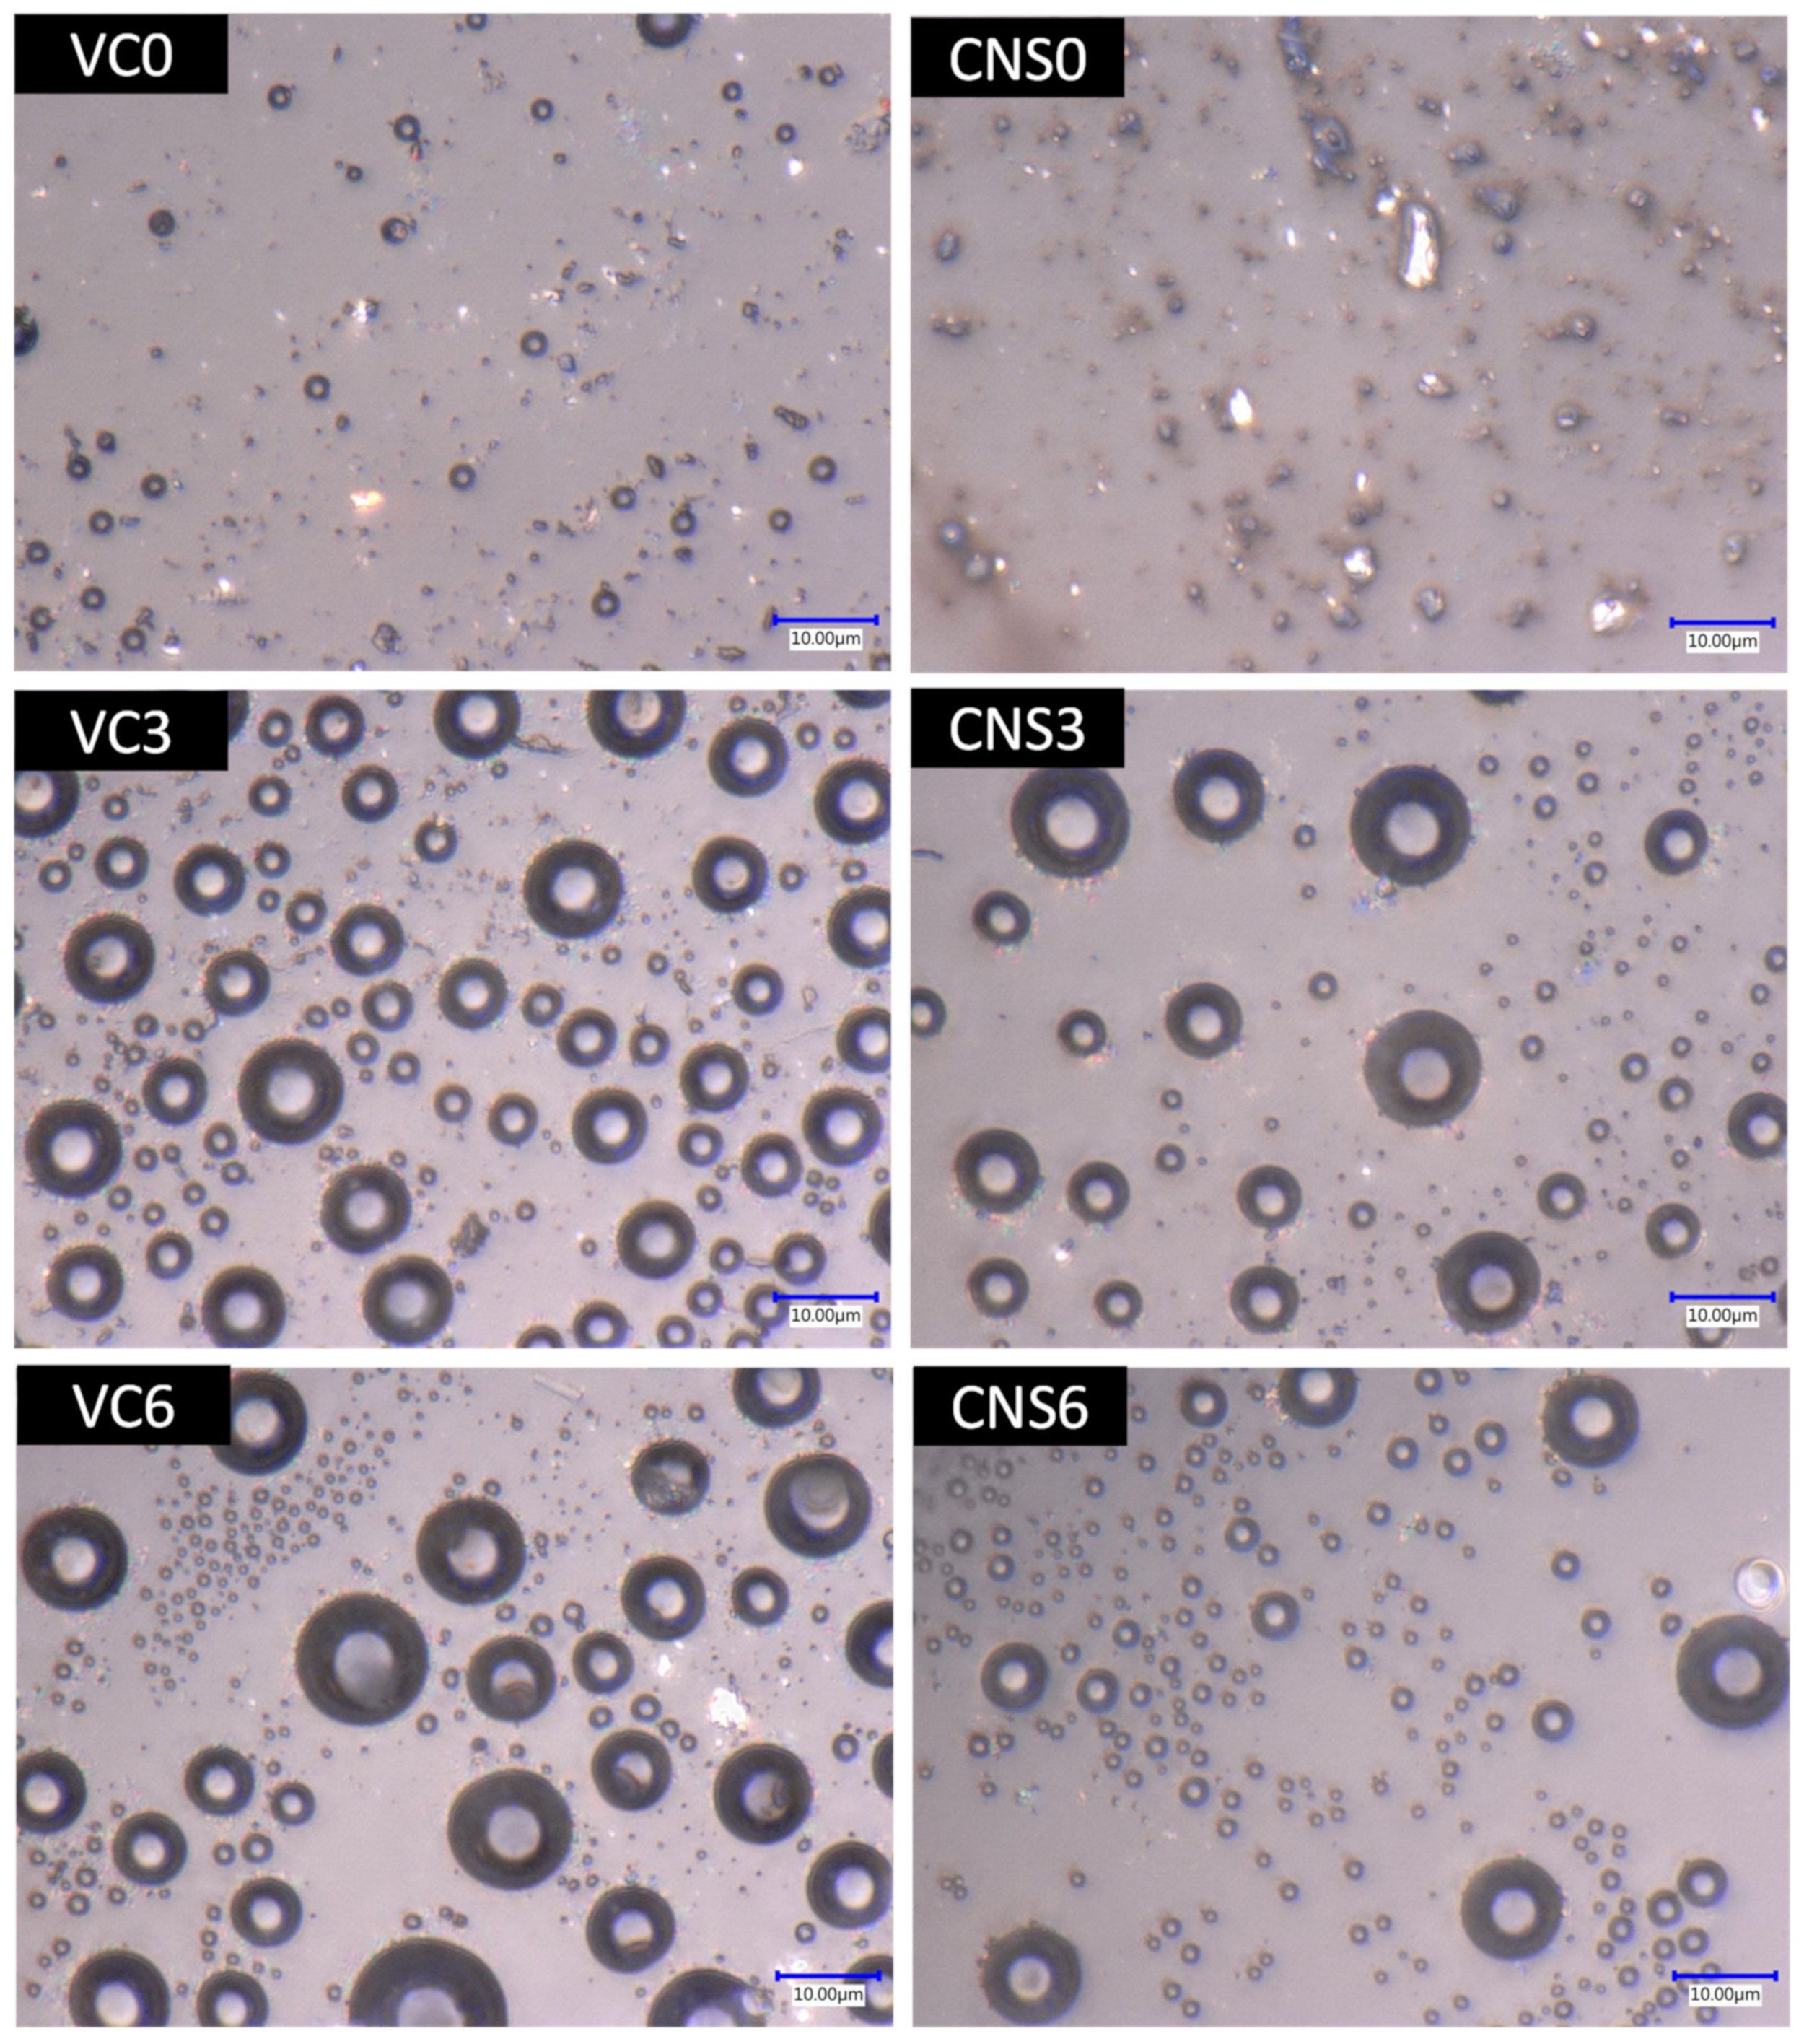
To demonstrate the effect of the application of isopropanol for the formation of pores in the epoxy-CNS and epoxy-VC coatings, microscopic images of the treatments were obtained with concentrations of 0, 3, and 6 mL of isopropanol per 10 g of epoxy mixture with nanomaterial (Figure 6). Without applying isopropanol (VC0), the epoxy-VC coating presented small surface bubbles of about 2 and 3 µm in size, but these were not considered pores since they did not permeate water after performing the vacuum filtration tests. On the other hand, there was no water permeation for epoxy-CNS coatings (CNS0), but they did not show bubbles on the surface. By adding 3 mL of isopropanol, both types of coating, VC3 and CNS3, formed pores presenting concave shapes like bubbles. These forms are due to the generation of bubbles from the isopropanol that evaporates and leaves the mixture during the heat treatment at 60 °C for 1 h.
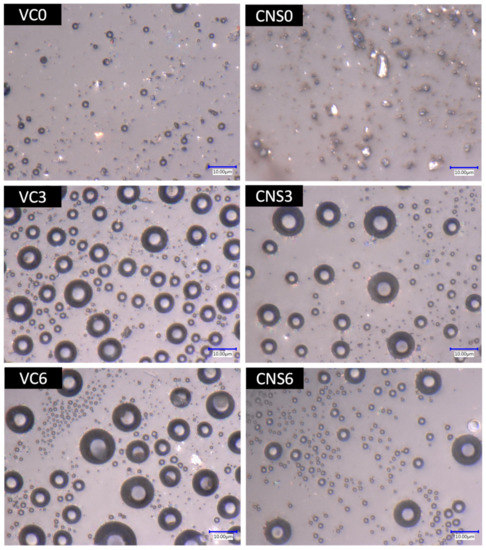
Figure 6.
Images of the surface of the epoxy-VC and epoxy-CNS coatings with different volumes of isopropanol, obtained at 4000 magnifications from the Keyence model VHX-5000 digital microscope.
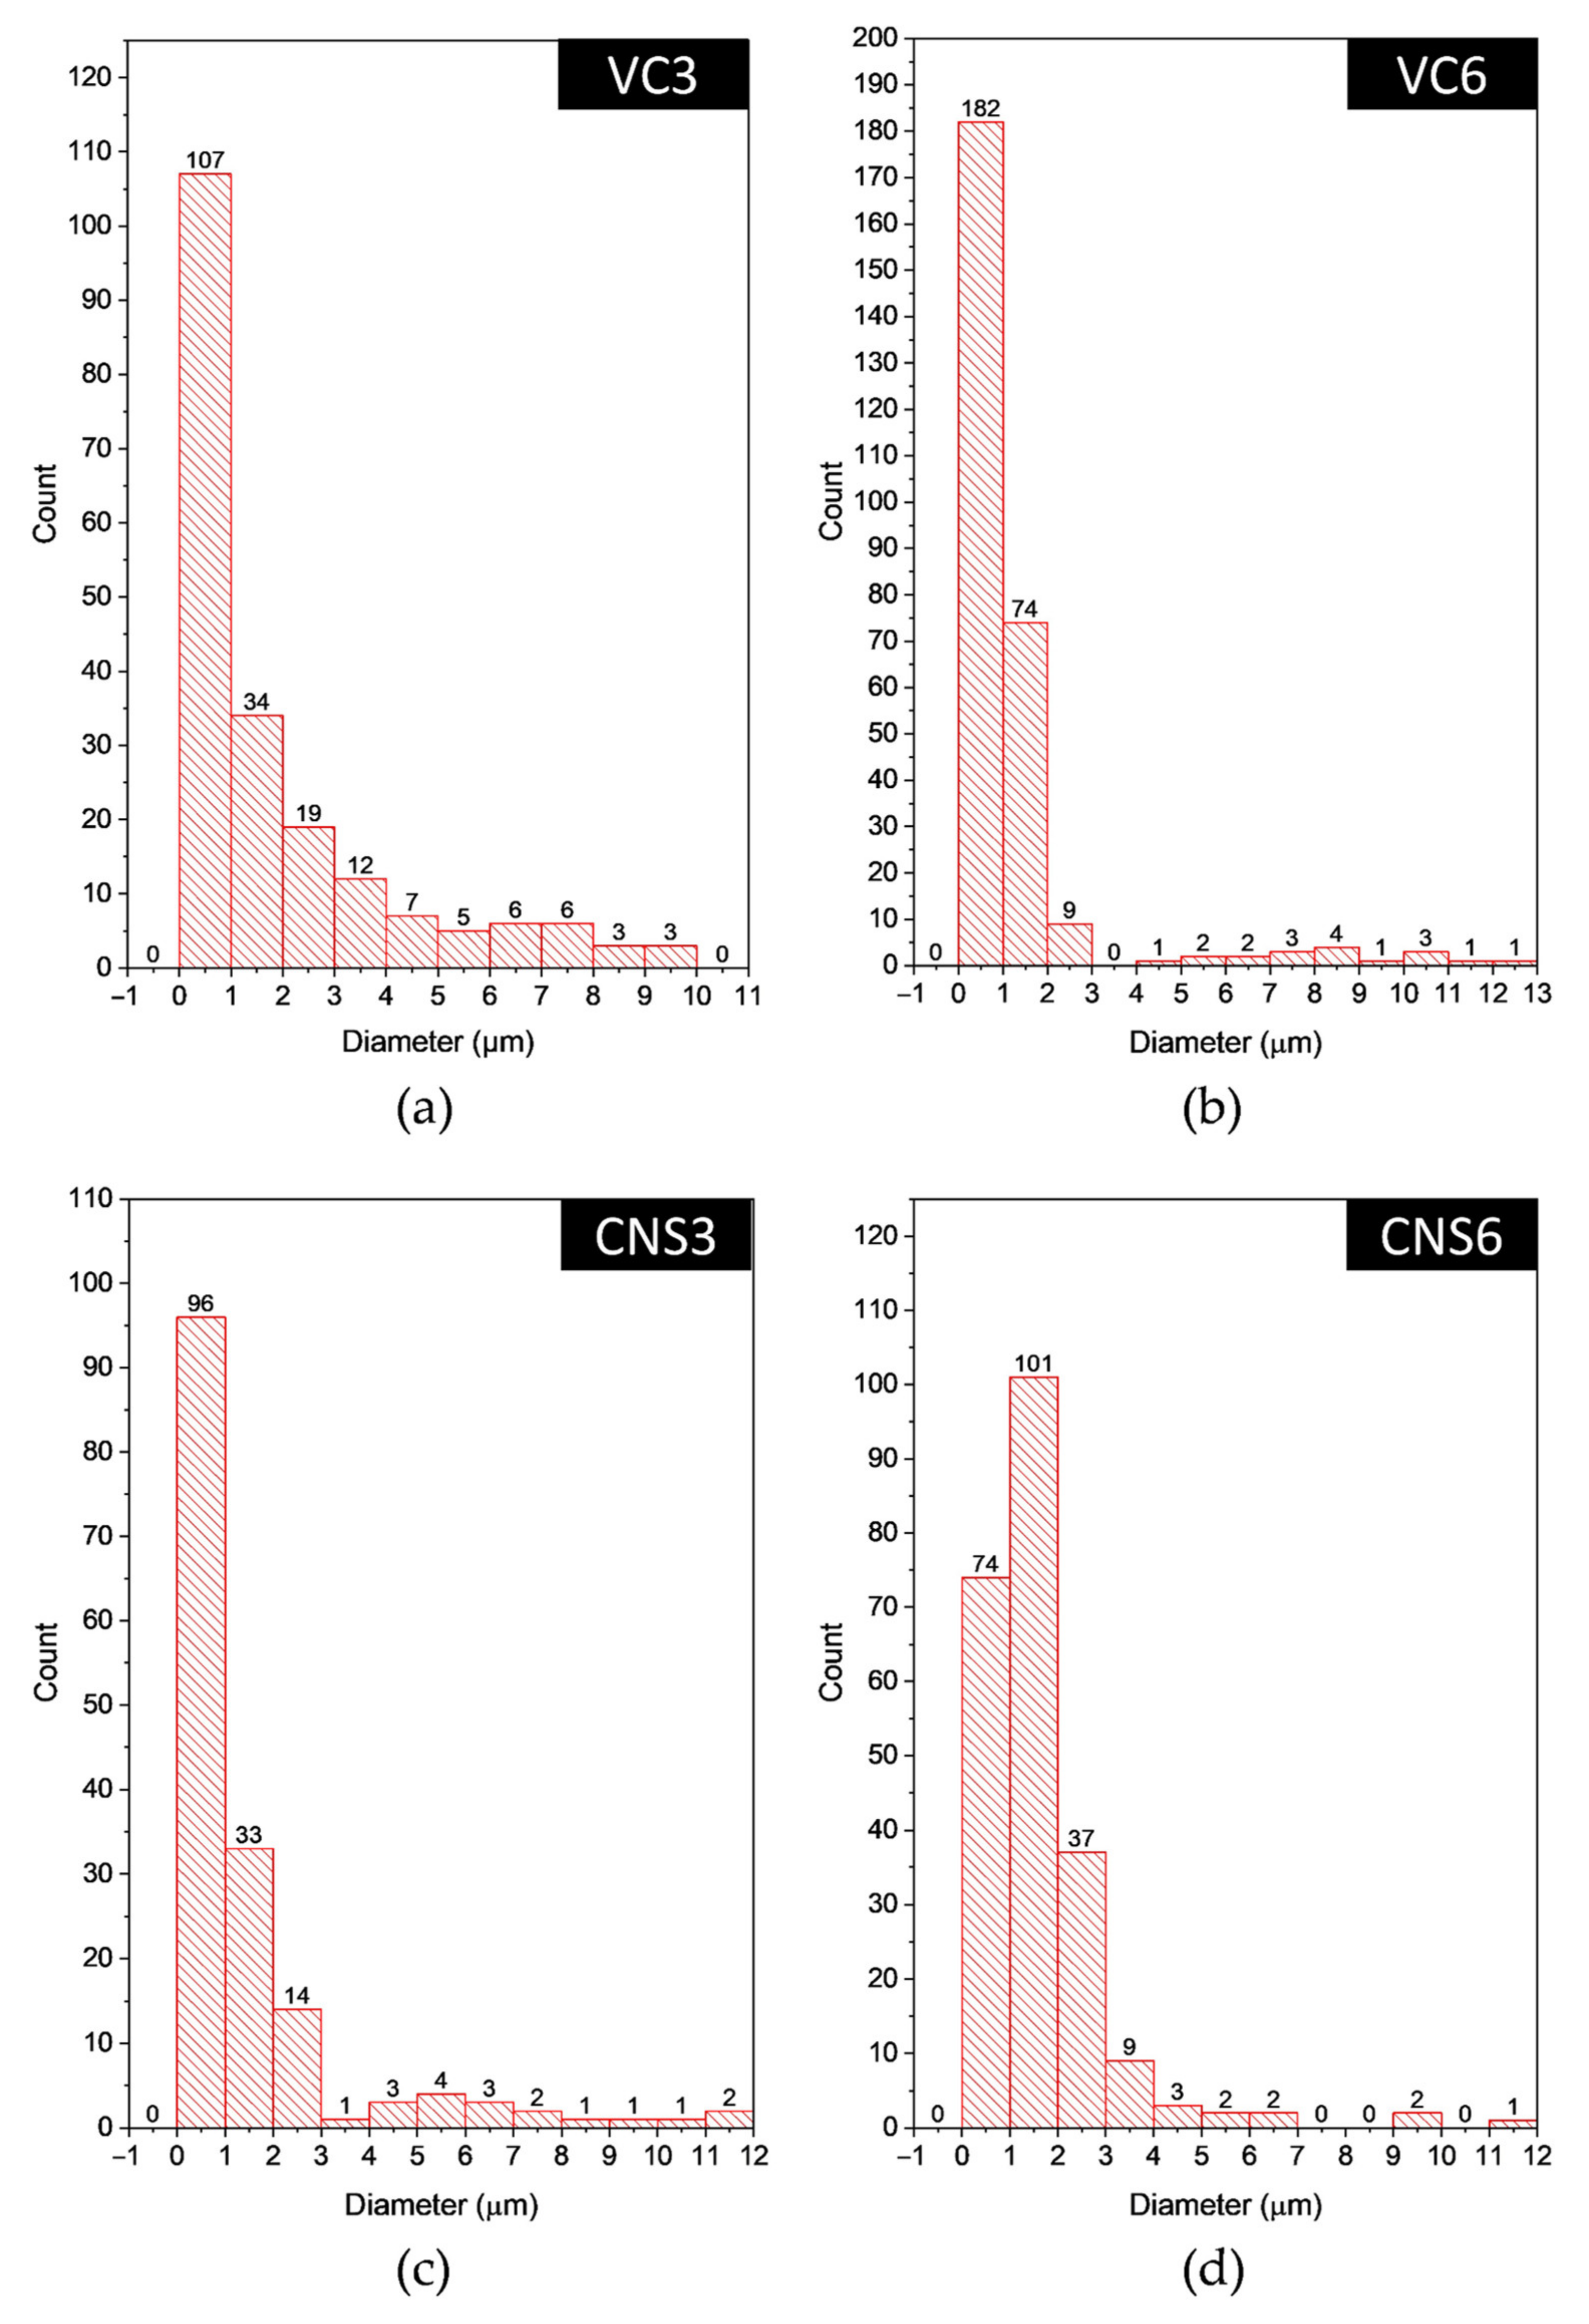
The VC3 coatings showed more pore formation than CNS3 coating. The pore distribution of both types of coating is homogeneous with various sizes. Pore diameter distributions were divided into two ranges to simplify their analysis. The pore dimensions were between 1–4 and 6–11 µm for VC3 coatings and 1–4 and 5–12.5 µm for CNS3 coatings. In the case of treatments where 6 mL of isopropanol was added, the pore sizes in both types of coatings were also variable, but the number of pores in the larger diameter range was significantly less than the number of pores in the smaller range in both cases. For VC6 coatings, the pores that are part of the larger diameter range were larger and more numerous than those in CNS6 coatings. The diameter ranges were 1–3 and 4–13 µm; and 1–3 and 4–11 µm for VC6 and CNS6, respectively.
Figure 7 shows the histograms of the pore diameter distribution of the epoxy-VC and epoxy-CNS coatings. These histograms show that most of the pores are in the 1 to 3 µm range. For VC3 the smallest diameter pores represent 79.2%, while for VC6 it is 93.6%. In the case of CNS3 the percentage of smaller diameter pores was 88%, and for CNS6 91.7%. In the case of CNS3 the total number of pores was lower than in all other coatings, thus, low permeability and permeation flux are expected. On the other hand, CNS6 coating presented the highest number of total pores and the highest percentage of small pores.
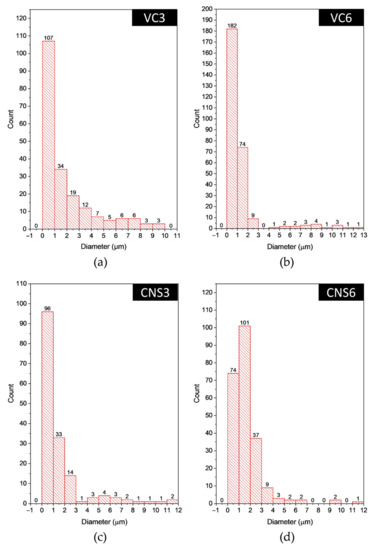
Figure 7.
Histograms of the pore diameter distribution in the surface of the epoxy-VC (a,b) and epoxy-CNS (c,d) coatings with different volumes of isopropanol.
The pore diameter ranges of the coatings obtained were from 1 to 13 µm for the epoxy-VC, and from 1 to 12.5 µm for the epoxy-CNS coatings.
Table 2 shows the pore count data for the epoxy-CNS and epoxy-VC coatings with three replicates. The mean ± standard deviation [SD] for each diameter range is included.
Table 2.
Diameter pore count and standard deviation of the Epoxy-VC and Epoxy-CNS coatings.
The smallest standard deviation values for epoxy-VC coatings were 0.03 (diameter range 8 µm) and 0.02 (diameter range 6 µm) for VC3 and VC6, respectively. The largest standard deviation values for epoxy-VC coatings were 0.39 (diameter range 4 µm) and 0.34 (diameter range 2 µm) for VC3 and VC6, respectively. The smallest standard deviation values for the epoxy-CNS coatings were 0.06 (diameter range 2 µm) and 0.07 (diameter range 12 µm) for CNS3 and CNS6, respectively. The largest standard deviation values were 0.4 (diameter range 7 µm) and 0.39 (diameter range 4 µm) for CNS3 and CNS6, respectively. As we can see in Table 2, the difference between the standard deviation values was greater for the epoxy-CNS coatings. This may be related to the difference in the physicochemical nature of the epoxy-CNS mixture, compared to the epoxy-VC mixture.
3.2. Filtration Tests Using Epoxy-Carbon Coatings
Filtration Evaluation of Epoxy-Carbon Coatings
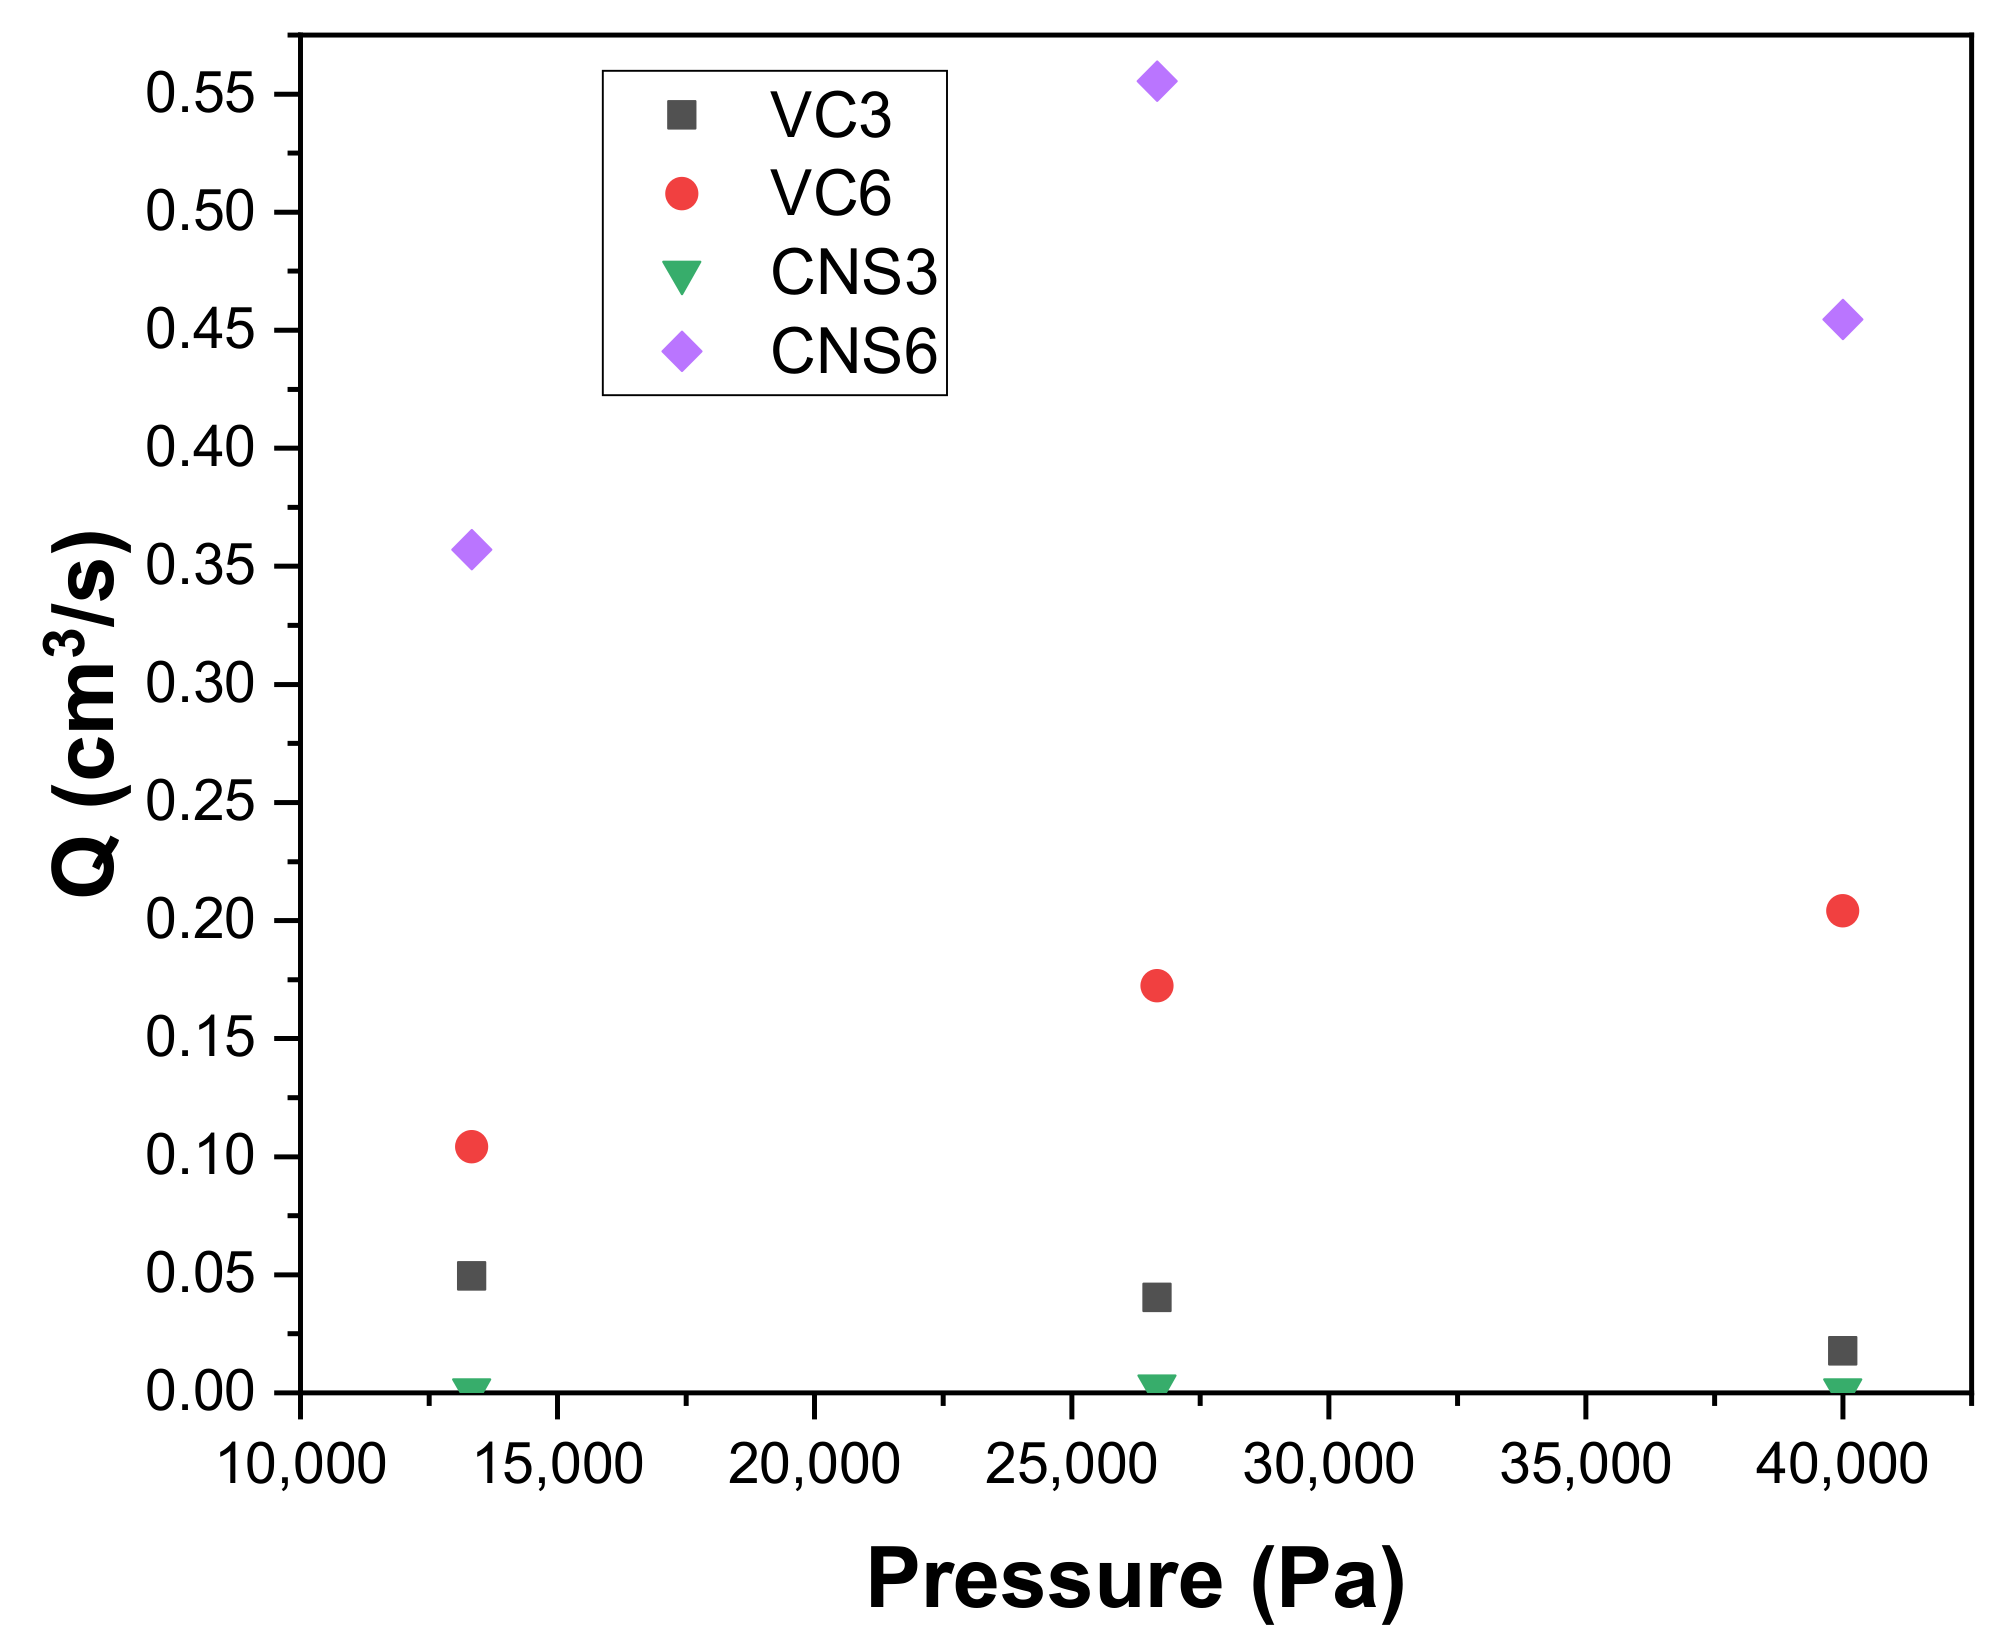
Figure 8 shows the permeation fluxes Q (cm3/s) of epoxy-VC and epoxy-CNS coatings produced with different concentrations of isopropanol during vacuum filtrations applying different working pressures. When comparing the permeation flux of the VC3 and VC6 coatings, the VC6 permeation fluxes are higher and increase with increasing working pressure: 0.1042 cm3/s for 13,332 Pa, 0.1724 cm3/s, 26,664 Pa, and 0.2041 cm3/s, 39,996 Pa. Meanwhile, for VC3 coatings, a decrease of permeation flux was observed with increasing applied pressure: 0.0495 cm3/s for 13,332 Pa; 0.0403 cm3/s for 26,664 Pa, and 0.0177 cm3/s for 39,996 Pa. This difference is observed despite both coatings having similar physical characteristics, with porosity percentages of 35% and 33%, and a thickness of 0.307 and 0.305 mm, for VC3 and VC6, respectively. The higher permeation flux obtained in VC6 coatings is explained by these coatings having larger pore diameters, with ranges of 4–13 µm, and have a higher quantity of small diameter pores, while for VC3 the pore diameters are between 6–11 µm. When analyzing the effect of the increase in the working pressure in the epoxy-VC coatings, in VC3, the increase in pressure generates a compaction in the pores, which results in decreasing the permeation flux [55,56]. However, in the case of VC6 coatings, the pressure increase does not appear to affect significantly.
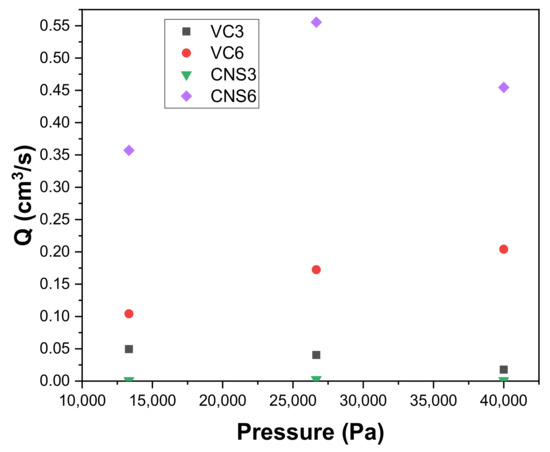
Figure 8.
Variation of the permeation flow Q with respect to the working pressure of epoxy-carbon coatings.
CNS6 coatings had the highest permeation fluxes compared to all other coatings at all applied working pressures. For CNS6 it was observed that when going from the working pressure 13,332 Pa to 26,664 Pa, the permeation flow increased from 0.3571 cm3/s to 0.5555 cm3/s. Due to these results, the pressure of 26,664 Pa causes an increase in flow without deformation of the pores. On the other hand, when the pressure was increased to 39,996 Pa, the permeation flow decreased to 0.4545 cm3/s, thus it is possible that a contraction of the pores is generated at said pressure. The permeation fluxes of the CNS3 coatings had a similar behavior to those of the CNS6 coatings but with significant lower permeation fluxes. For CNS3, an increase in permeation flows was observed from 0.0011 cm3/s to 0.0027 cm3/s for working pressures of 13,332 Pa and 26,664 Pa, respectively. Likewise, a decrease is observed when the pressure increases to 39,996 Pa, obtaining a permeation flow of 0.0011 cm3/s. In both epoxy-CNS coatings, the physical characteristics are very similar, with porosity percentages of 19% and 17%, and thicknesses of 0.307 and 0.305 mm, for CNS3 and CNS6, respectively. The higher permeation flux that was obtained in the CNS6 coatings was due to the higher number of pores, although most of them are pores with smaller diameter (1–3 μm) and only a few of the larger size range (4–12 μm). In the case of CNS3, there is a higher number of pores with larger size ranges (3–12 μm) compared to CNS6, but the number of pores with ranges between (1–3 μm) is much lower than for CNS6. This shows that a higher presence of pores in the polymeric matrix, even at small ranges, allows the pores to make connections that facilitate the passage of water and therefore generate an increase in the permeation flux. All the coatings evaluated, epoxy-VC and epoxy-CNS, are significantly affected by the applied pressure, causing a decrease in the permeation flow. Therefore, a suitable working pressure must be determined before handling the coatings for filtration. The only coating in which increasing working pressure did not decrease permeation flow was VC6. However, to confirm that the increase in the applied working pressure does not affect the filtration efficiency, it is necessary to evaluate its permeability when applying different pressures.
Figure 9 shows the permeabilities k (m2) as a function of the applied working pressures obtained with the epoxy-VC and epoxy-CNS coatings during vacuum filtrations. In all cases, epoxy-VC and epoxy-CNS coatings showed a decrease in permeability as working pressures increased. This was only different in the case of CNS3, where there was a slight increase in permeability when the pressure went from 13,332 Pa (3.61858 × 10⁻¹⁶ m2) to 26,664 Pa (4.44098 × 10⁻¹⁶ m2), and a notable decrease at 39,996 Pa (1.20619 × 10⁻¹⁶ m2).
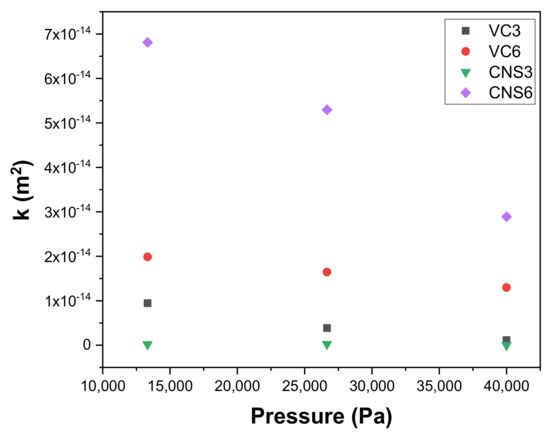
Figure 9.
Variation of permeability k with respect to the working pressure of epoxy-carbon coatings.
The behavior of the permeability values of the CNS3 coating is similar to the behavior for its permeation fluxes. This can be explained because the permeation fluxes at the applied pressures were minimal and, therefore, their permeabilities were low as well. Compared with the other treatments, the CNS6 coatings presented a significant decrease in their permeability values as the pressure increased, presenting 1.16707 × 10⁻¹³ m2 for 13,332 Pa, 9.07738 × 10⁻¹⁴ m2 for 26,664 Pa and 4.9513 × 10⁻¹⁴ m2 for 39,996 Pa. VC3 and VC6 coatings show a decrease in permeability with increasing applied pressure, from which VC6 presented a more abrupt decrease than VC3 with increasing pressure (3.4036 × 10⁻¹⁴ m2, 13,332 Pa; 2.8174 × 10⁻¹⁴ m2, 26,664 Pa; 2.22325 × 10⁻¹⁴ m2; 39,996 Pa), compared to VC3 (1.62852 × 10⁻¹⁴ m2; 13,332 Pa; 6.63229 × 10⁻¹⁵ m2; 26,664 Pa; 1.94078 × 10⁻¹⁵ m2; 39,996 Pa). The decrease in permeability observed in all coatings can be explained due to the contraction of the pore size with increasing working pressure. Based on this evidence, for all coatings evaluated, the working pressure can affect the size of the pores, which generates a significant decrease in permeability.
According to the permeability results obtained from the composite coatings in the vacuum filtrations, the permeability in all cases was higher at the lowest applied working pressure (13,332 Pa) and decreased with increasing pressure due to pore compaction. CNS3 was the only coating that had a different behavior, having the highest permeability at the working pressure of 26,664 Pa, but it decreased with the increasing pressure of 39,996 Pa. Since the highest permeability in most coatings was obtained at the lowest pressure, this indicates that the coatings can filter with good performance at 13,332 Pa. Since the pressure required for optimal of these coatings is considered low, these composite coatings represent an option for water filtration that requires low energy expenditure. In the case of CNS3, requiring a higher working pressure (26,664 Pa) to achieve excellent permeability may indicate that the internal pores of the coating are probably smaller in diameter than the pores of the other coatings. Another option may be that the number of pores is not sufficient to impregnate enough water. In the case of having smaller diameter pores, CNS3 could be used to eliminate smaller pollutants.
Table 3 shows the relation of the permeation fluxes (cm3/s) and permeabilities (m2) obtained according to the thickness (mm) and percentage of porosity (ε) of the epoxy-VC and epoxy-CNS coatings produced with different concentrations of isopropanol during vacuum filtrations applying different working pressures.
Table 3.
Thickness, percentage of porosity, permeability, and permeate flux of epoxy-carbon coatings.
The formation of pores in the epoxy-VC and epoxy-CNS, was attributed to the applied isopropanol, which evaporates and leaves the mixture during the heat treatment. Another effect that isopropanol has in the epoxy resin, is the property of making the coatings more flexible, and therefore, more likely to modify their pore size when pressure is applied. According to the literature, isopropanol causes a partial decomposition by breaking chemical bonds in the epoxy resin, causing the increase in flexibility [57,58]. A study where a similar behavior is observed is that of Qiu et al. (2021). In this study they reported that the presence of solvent in the composite mixture of cellulose nanocrystal (CNC) with epoxy resin may have lowered the crosslinking density and it also proved to be essential for the preparation of a well-dispersed CNC phase to form homogenous composite mixtures. It was shown that the CNC component reversed the solvent plasticizing effect through its superior mechanical reinforcing effects [59].
Through the evaluation of the relation between the pore sizes of the epoxy-CNS and epoxy-VC composite coatings with the permeation fluxes obtained through experimental filtrations, it was deduced that the number of pores in the coatings has a higher impact on permeation flow than the pore size.
Also, due to the differences observed in the number and size of pores obtained from epoxy-VC and epoxy-CNS coatings, prepared with different concentrations of isopropanol, it was verified that the physicochemical properties of each nanomaterial are another important factor that intervene in the pore morphology. The particle diameter of VC was reported to be between 20–50 nm, while the diameters of the CNS synthesized are around 216 nm. In the case of CNS, having a greater surface area improves the bonding performance with the epoxy resin, reducing the crack propagation and lengthening its durability of the coatings [21,22,23,24,25,26]. The specific surface area of CNS and pore volume is considerably greater than VC. This counteracts the effect of the partial decomposition of epoxy resin caused by the isopropanol [59,60,61,62].
An example of the effect of the surface area of nanoparticles in improving the durability of epoxy resin composites is the study of Reyhani et al. (2021). In this study, CNT-doped carbon aerogel (CNT-CA) and carbon aerogel (CA) were used in different weight ratios (0.1, 0.3, and 0.5 wt%) to reinforce epoxy (Ep) nanocomposites. The fabricated nanocomposites showed enhanced properties compared to the neat epoxy which is attributed to the penetration of polymer chains into the porous three-dimensional structure of the distributed aerogels. This phenomenon resulted in a high filler/matrix interaction, resulted in a better load transfer [63].
Another example is the study of Ravindran et al. (2021), where the structural properties of carbon fiber reinforced epoxy composite T-joints containing a small weight fraction (1%) of carbon nanotubes (CNTs), carbon nanofibers (CNFs) or graphene nanoplatelets (GNPs) within the polymer matrix phase was analyzed. Their experimental testing revealed that the strengthening effect depends on the nanoparticle type, with (CNFs) being the most effective at increasing the failure initiation load (~68%), ultimate failure load (46%) and absorbed energy capacity (~200%) of the T-joint [64].
A related study is that of Ning et al. (2022). They examined the effect of nanoparticles (NP) on the toughening of epoxy resins and analyzed how well the improvement in matrix toughness transfers to its carbon fiber reinforced composites. The NPs used contained the same percentage of soft and hard polymer composition, but the particles had different morphology, being homogenous versus core/shell structures. Their results showed that the core/shell particles, especially when the soft polymer is the core and the rigid polymer is the shell, give 851%, 185%, and 43% enhancement in GIC (epoxy), GIC (composite) and GIIC (composite), respectively, compared to the control specimen. Homogeneous particles were much less effective. Their study also suggests that the effective toughening of composite requires the combination of well dispersed and strong particle-resin and resin matrix-fiber interfaces [60].
These physicochemical differences in both nanomaterials affect the viscosity and chemical properties of the mixture with epoxy resin and isopropanol, due to their sizes, and the difference in the number of oxygen-containing functional groups present on its surface [30,65,66].
3.3. CFD Analysis of the Filtration Process
Evaluation of the Domains of the Filtration Process
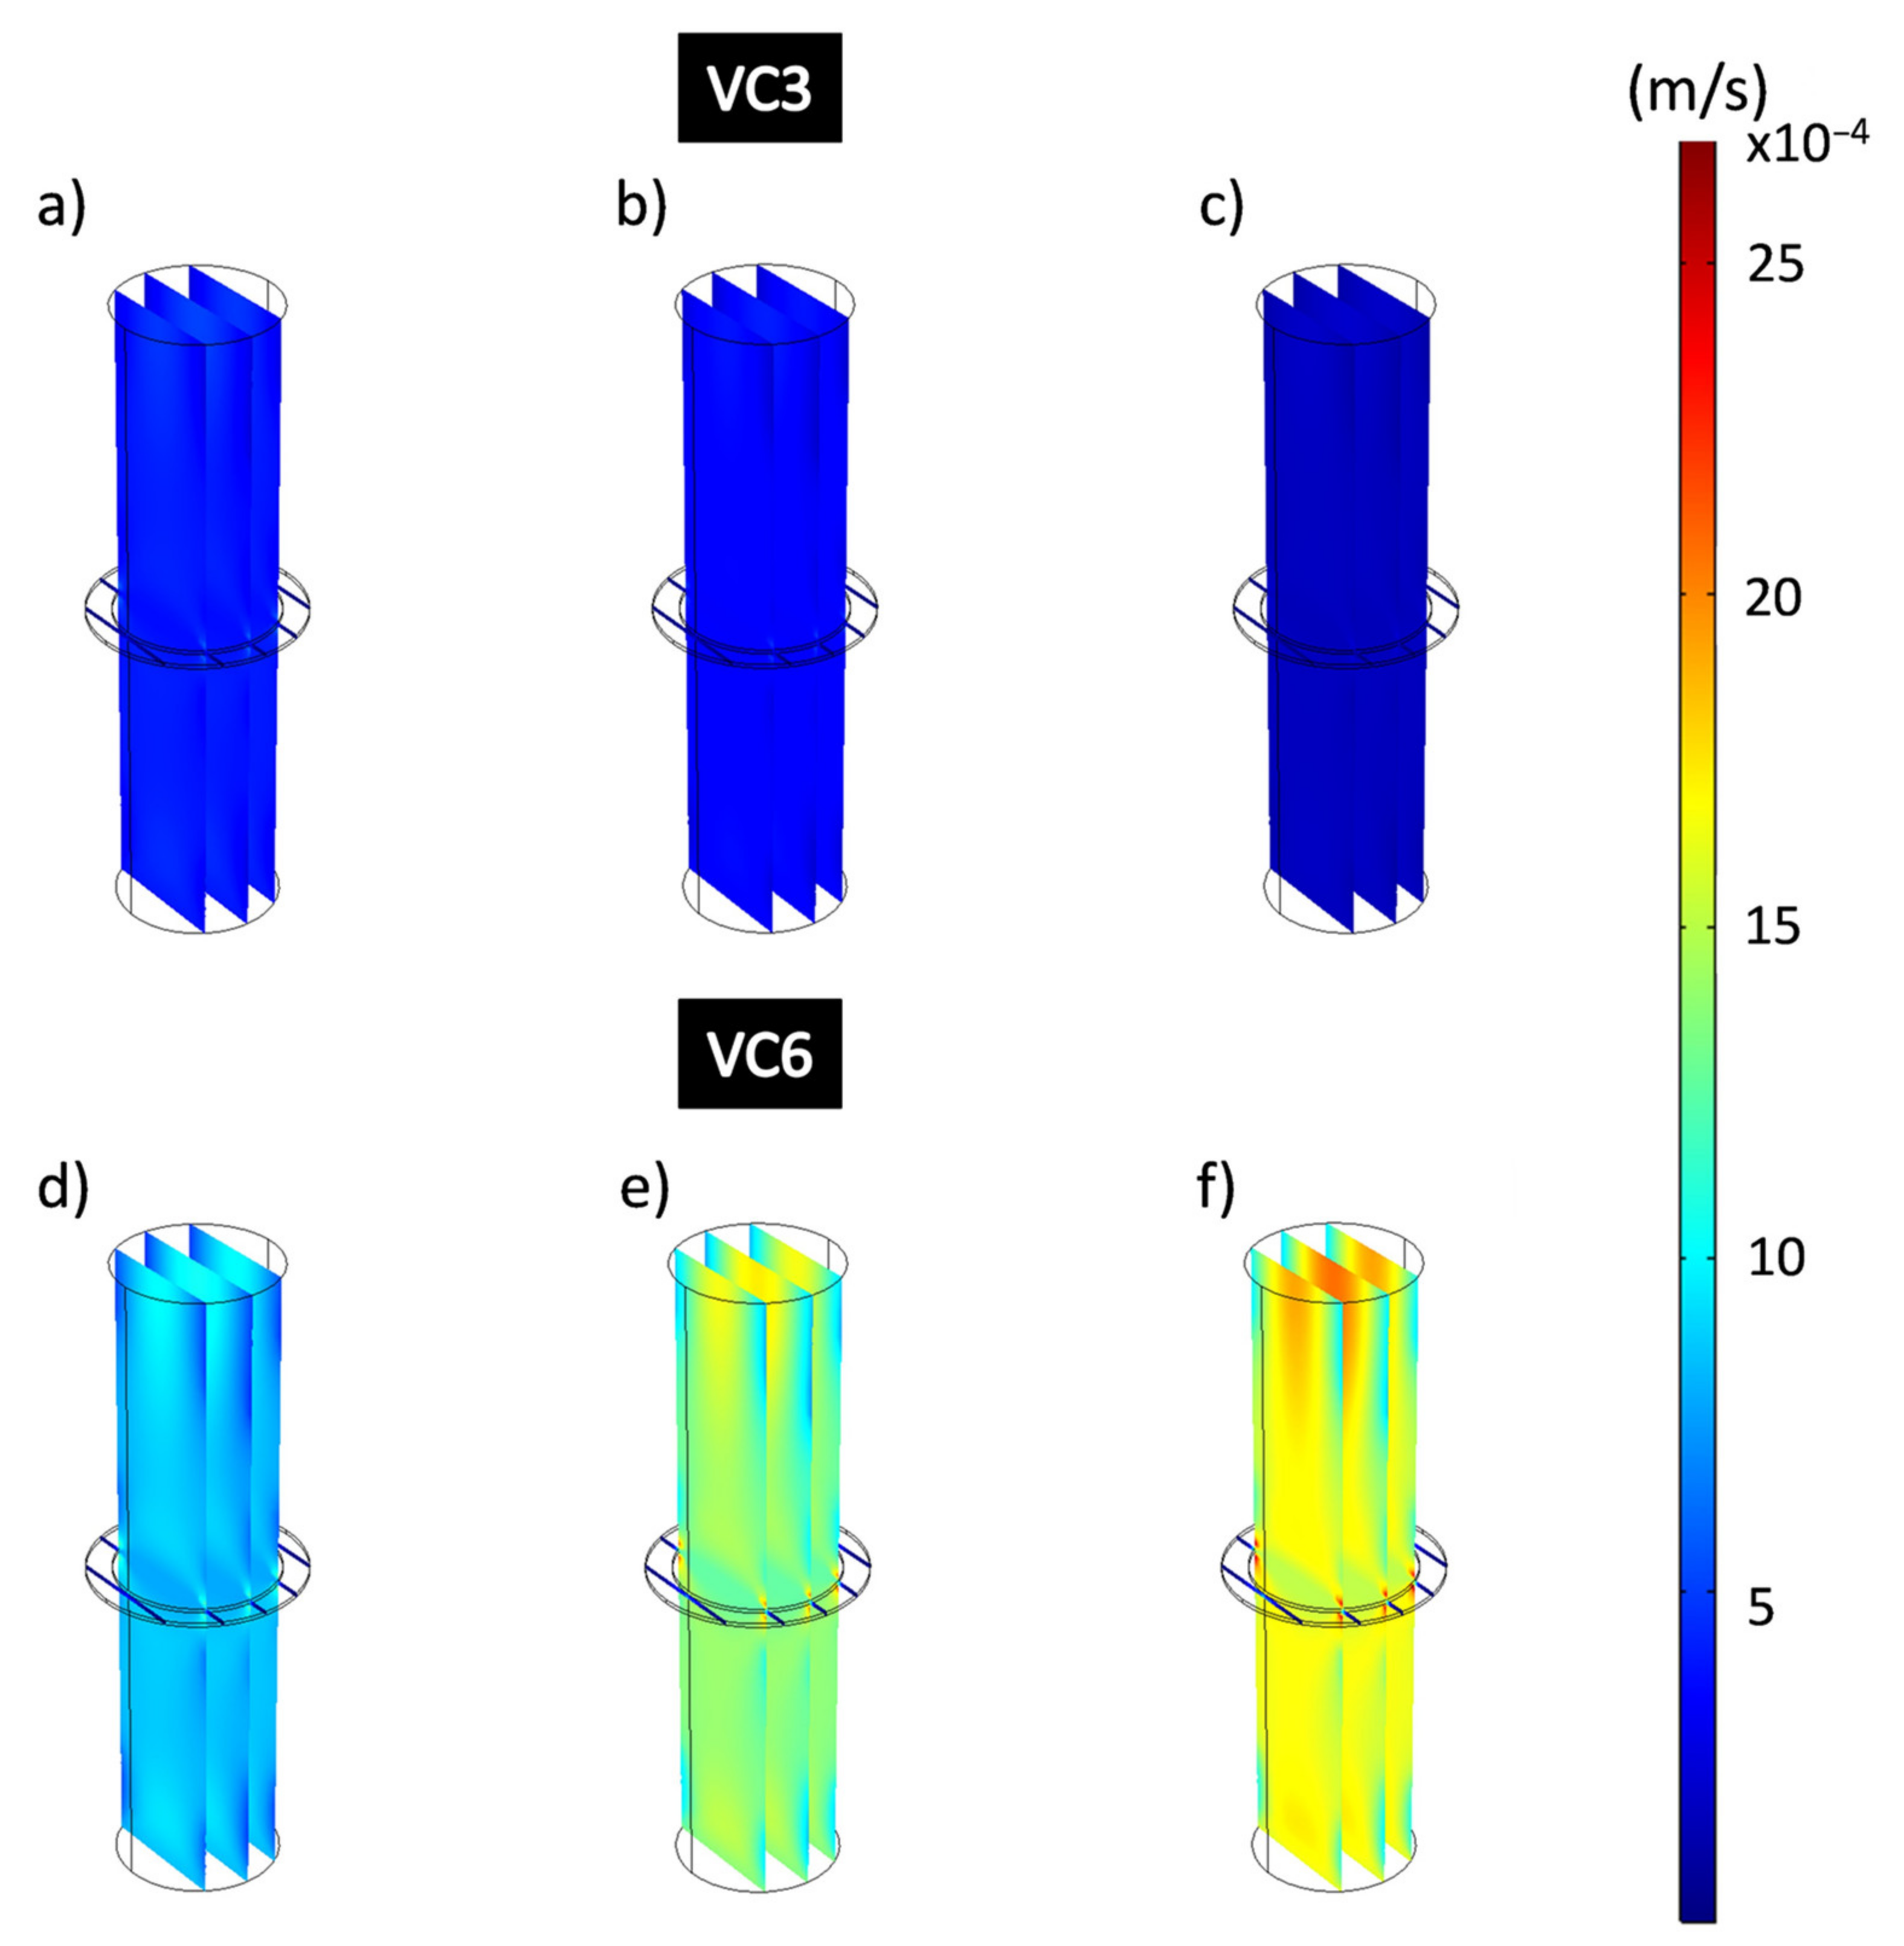
Figure 10 shows the flow velocities obtained from the hydrodynamic simulations that consider the domains governed by the physics of free flow and porous flow that represents the composite coating when applying different working pressures. The simulated images are represented on the same speed scale, shown on the right side of the figure, showing ranges between 8.09 × 10⁻⁸ m/s and 0.00269 m/s. Flow velocities (m/s) obtained at different pressures applied to VC3 coatings show a decrease as higher working pressures are applied. Figure 10a–c shows a uniform dark blue color that completely covers the dimension of the domains that represent the free-flow zone, and the coating. The decrease in flow velocity corresponds to the stress adsorbed by the porous coating, which is a consequence of the applied formulations of the Navier-Stokes and Brinkman equations. The flow velocities for VC3 obtained were 3.9 × 10⁻⁴ m/s for 13,332 Pa; 3.19 × 10⁻⁴ m/s for 26,664 Pa and 14 × 10−5 m/s for 39,996 Pa. Figure 10d–f shows the flow velocities of the VC6 coating at different applied pressures which have considerably higher flow rates than VC3. This is distinguished by observing the colors that represent higher flow velocities, being on average 8.25 × 10⁻⁴ m/s for 13,332 Pa; 0.0014 m/s for 26,664 Pa and 0.0016 m/s for 39,996 Pa for the domains that represent the free-flow zones. Here, from the applied pressure of 13,332 Pa to 26,664 Pa, the flow increases approximately 69.7%, and from 13,332 Pa at the pressure of 39,996 Pa, the flow rates increase by 93.9% for VC6.

Figure 10.
Flow velocity analysis of all domains of the filtration process for epoxy-VC. (a,d) 13,332 Pa, (b,e) 26,664 Pa, (c,f) 39,996 Pa.
It is noticeable that in the area where the composite coating is located, the flow rates behave considerably slower than in the free-flow areas, as they appear in dark blue color, which is related to the resistance to the permeation flow produced by the porosity of the material. Figure 11 shows the flow rates in the domain of the epoxy-VC composite coatings obtained from the results of the simulations of the filtration process at different working pressures. The central and perimeter flow rates of the VC3 and VC6 coatings were obtained. Figure 11a–c shows VC3 coating perimeter velocities calculated by CFD which were 5.22 × 10⁻⁶ m/s, 13,332 Pa; 2.66 × 10⁻⁶ m/s at 26,664 Pa and 7.22 × 10⁻⁷ m/s, 39,996 Pa, while the central velocities were 3.63 × 10⁻⁴ m/s, 13,332 Pa; 2.95 × 10⁻⁴ m/s at 26,664 Pa and 1.29 × 10⁻⁴ m/s at 39,996 Pa respectively. Figure 11d–f shows VC6 coatings, the perimeter flow velocities obtained were 2.30 × 10⁻⁶ m/s, 13,332 Pa; 4.39 × 10⁻⁶ m/s; 26,664 Pa; 7.89 × 10⁻⁶ m/s, 39,996 Pa and the central velocities were 7.64 × 10⁻⁴ m/s, 13,332 Pa; 0.0012 m/s, 26,664 Pa; 0.0015 m/s, 39,996 Pa. It is noticeable that the central flow rates in the VC6 coatings are higher than for the VC3 coatings.
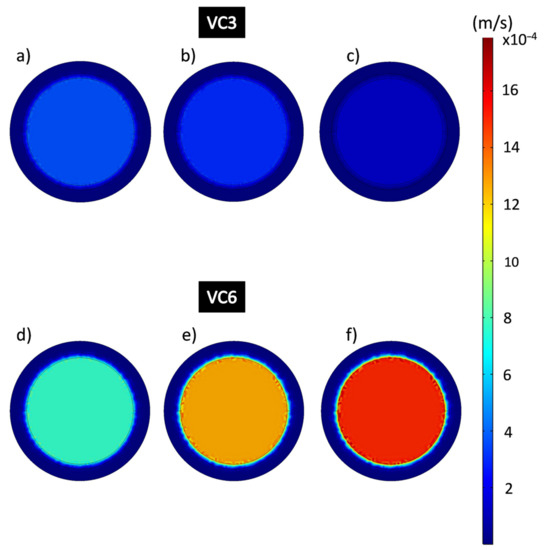
Figure 11.
Flow velocity analysis in the epoxy-VC composite coating domain during the filtration process. (a,d) 13,332 Pa; (b,e) 26,664 Pa; (c,f) 39,996 Pa.
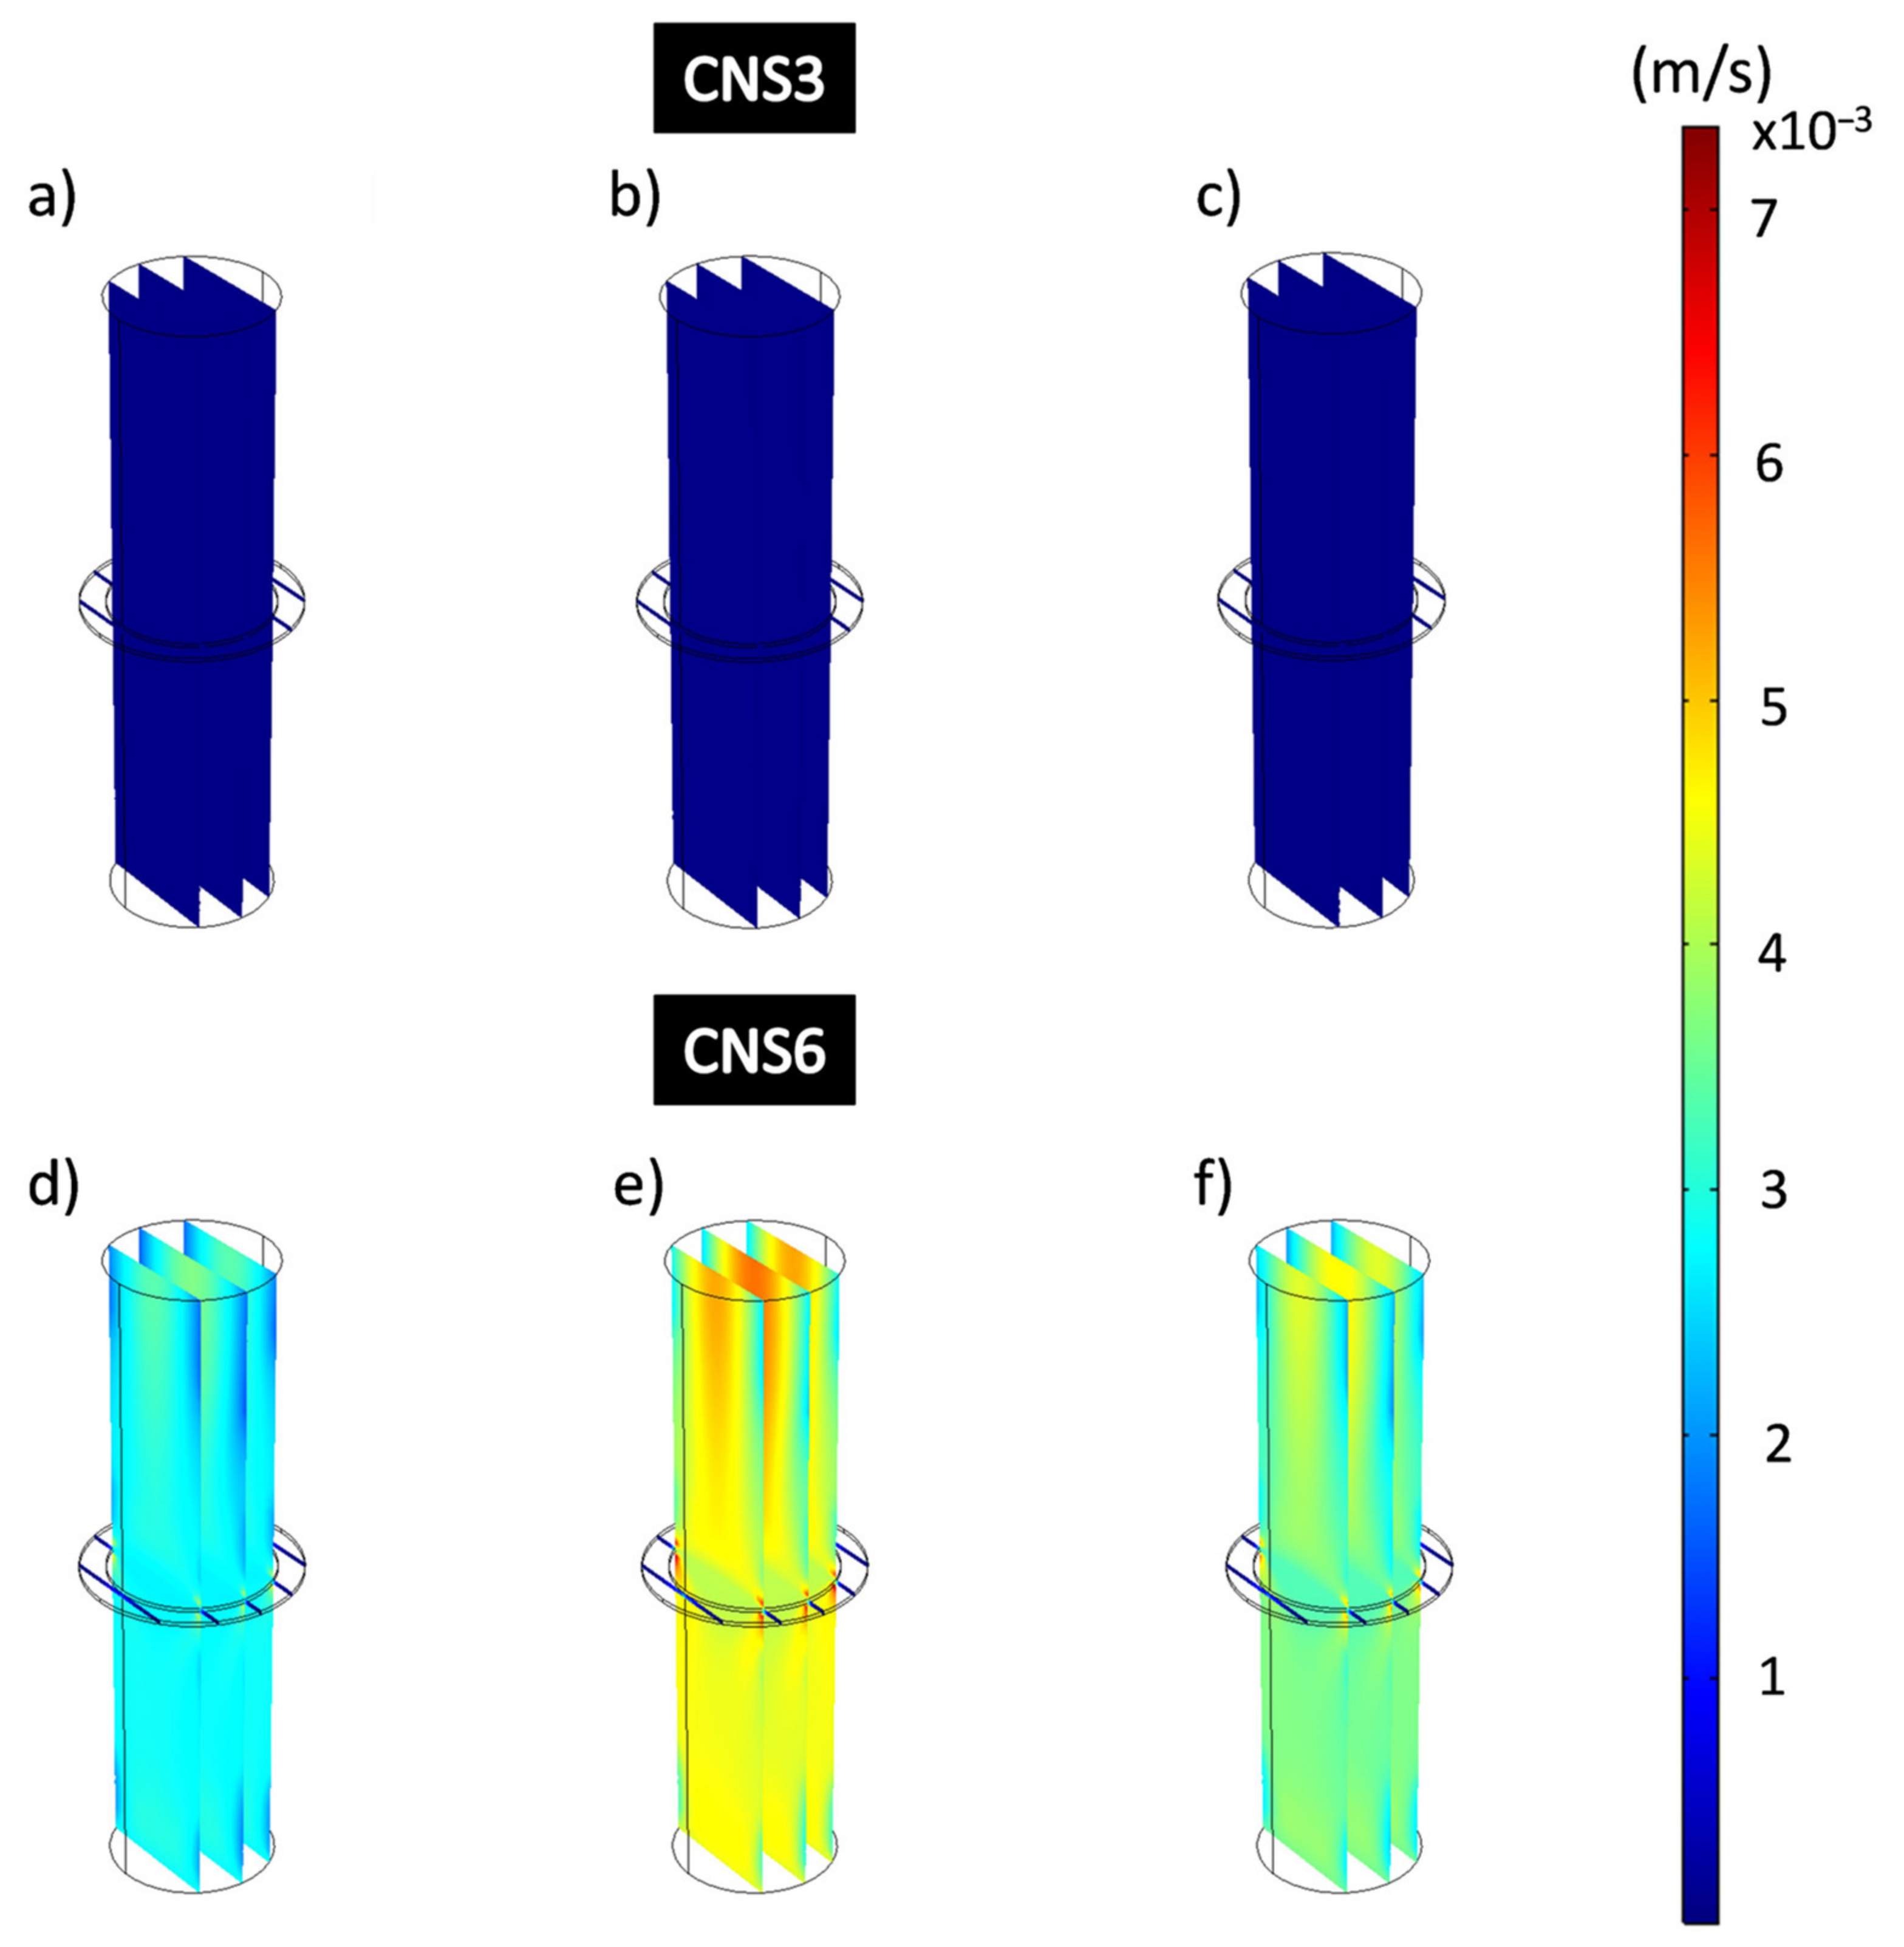
Figure 12 shows the results of the simulations for the analysis of the velocity of the filtration process in all the domains for the coatings CNS3 and CNS6. Figure 12a–c shows the CNS3 coatings with a dark blue color, without changes at the different applied pressures, which confirms that these are at the lowest speed value of the speed range showing average speeds of 8.7 × 10⁻⁶ m/s. In Figure 12d–f CNS6 coatings showed much higher flow rates than those obtained from the CNS3 coatings: 0.0028 m/s at 13,332 Pa; 0.0044 m/s at 26,664 Pa and 0.0036 m/s at 39,996 Pa. For CNS3, from the applied pressure of 13,332 Pa to 26,664 Pa, the flow velocity increased approximately 57.1%, and from 13,332 Pa at pressure 39,996 Pa, the flow rate only increased 28.6% for VC6.

Figure 12.
Flow velocity analysis of all domains of the filtration process for epoxy-CNS coatings. (a,d) 13,332 Pa, (b,e) 26,664 Pa, (c,f) 39,996 Pa.
The images of the flow velocities of the epoxy-CNS composite coatings domain (Figure 13) obtained by simulation, are represented on a scale between the ranges 1.92 × 10⁻⁹ m/s to 0.00481 m/s. Figure 13a–c shows the average perimeter speeds of CNS3 coatings, being, 1.17 × 10⁻⁷ m/s, and average central velocity of 8.07 × 10⁻⁶ m/s. In Figure 13d–f CNS6, showed perimeter coating speeds of 6.65 × 10⁻⁶ m/s at 13,332 Pa; 2.04 × 10⁻⁵ m/s at 26,664 Pa and 6.31 × 10⁻⁶ m/s at 39,996 Pa and central velocities of 0.0026 m/s at 13,332 Pa; 0.004 m/s at 26,664 Pa and 0.0033 m/s at 39,996 Pa.
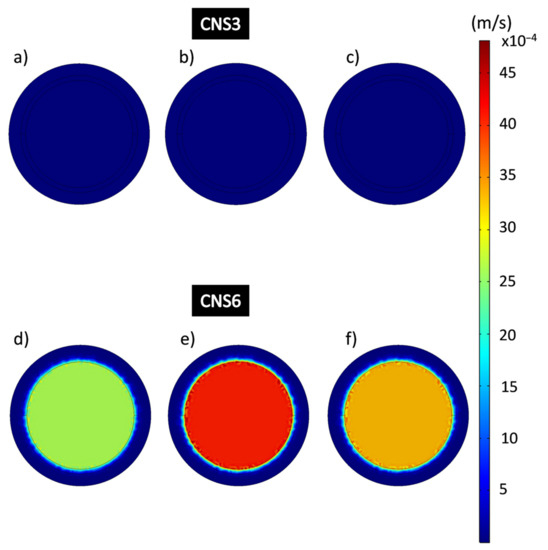
Figure 13.
Flow velocity analysis in the epoxy-CNS composite coating domain during the filtration process. (a,d) 13,332 Pa, (b,e) 26,664 Pa, (c,f) 39,996 Pa.
The crossflow rates through the composite coatings during the filtration of pure water were determined by CFD modeling. With this information we can compare the filtration performance of epoxy-VC and epoxy-CNS coatings with the performance of MF membranes. The permeation flux velocities obtained by MF can be obtained between 10−4–10−2 m/s for deionized (DI) water filtration through membranes without fouling. These filtrations are operated at transmembrane pressures of 10,000–350,000 Pa [67,68,69]. The flow velocities obtained with the highest permeabilities, and therefore the best performance, for the epoxy-VC coatings were 3.9 × 10⁻⁴ m/s for VC3 at 13,332 Pa; and 8.25 × 10⁻⁴ m/s for VC6 at 13,332 Pa. While for the epoxy-CNS coatings, the flow rates with the best performance were 8.7 × 10⁻⁶ m/s for CNS3 at 26,664 Pa; and 2.8 × 10⁻³ m/s for CNS6 at 13,332 Pa.
The flow velocities previously reported for MF filtration, are close to the flow velocities obtained with the epoxy-VC and epoxy-CNS coatings, at applied pressures near to 10,000 Pa. However, MF membranes present pore sizes with ranges between 0.05 and 0.5 µm, with which suspended colloids and particles in the approximate size range of 100 nm to 10 µm can be retained. These pressures can be considered relatively low if we compare them with the pressures necessary for ultrafiltration (UF) (2 × 10⁵–1 × 10⁷ Pa), nanofiltration (NF) (5 × 10⁴–2 × 10⁵ Pa), and reverse osmosis (RO) (5 × 10⁵–12 × 106 Pa) [69]. To have a better understanding of the performance of commercial MF membranes, some examples of their use are shown below.
A study that illustrates the performance of commercial microfiltration membranes is the work by Yuan et al. (2002). In this study, they filtrate DI water using polycarbonate MF membranes (obtained from Osmonics (Livermore, CA, USA) with a pore size of 0.22 µm. The transmembrane pressure applied was 69,000 Pa, obtaining flow rates between 9.0 × 10⁻⁴ and 9.5 × 10⁻⁴ m/s [70]. In the study by Abid et al. (2018), Millipore PVDF membranes with a pore size of 0.22 µm were used, with a pressure of 50,000 Pa was applied. A pure water flow of 4177.05 (L/m2 h) was obtained, which converted to velocity yields to 1.2 × 10⁻³ m/s [71]. Lastly, in the study by Song et al. (2006) carried out filtrations through carbon membranes with a pore size of 1.0 µm under operating conditions of 1 × 10⁵ Pa of pressure, for which they obtained a cross-flow velocity of 0.1 m/s [72].
The thickness of commercial MF membranes ranges between 10–20 µm [73]. While the thickness of the epoxy-VC and epoxy-CNS coatings obtained in this study ranged between 305 µm and 316 µm. This is what generates of flow rates similar to those obtained by the MF membranes, mentioned above. A greater thickness of the epoxy-CV and epoxy-CNS coatings represents an advantage since it increases its capacity to retain contaminants and gives greater mechanical resistance. Additionally, epoxy resin, being highly resistant, is a viable option for producing filtration materials that withstand chemical cleaning methods when plugged with contaminants. It has been reported that carbon nanoparticles had been used as reinforcements showing potential to improve strength, toughness, thermal stability, and electrical/thermal conductivities of the epoxy composites [16,61,63,74].
One example of this effect is the study of Starkova et al. (2021). In this study, amino-functionalized graphene oxide (mGO) nanoparticles were incorporated into the epoxy, adding a weight fraction up to 1.72%, to enable the cross-linking reactions and to provide high interfacial adhesion, superior reinforcement efficiency and enhanced resistance to hydrothermal ageing of nanocomposites. This amine cured epoxy adhesive is widely used in automotive, aerospace, construction, and marine industries [75].
Studies have been reported where the corrosion resistance of mild steel and wet adhesion strength of epoxy resin coatings improves when blending with carbon nanocomposite materials. This may result in the decrease of the risk of the polymeric matrix becoming detached from the stainless-steel mesh is reduced [22,34,64,76,77]. With these advances, the continuous reuse of these coatings for the treatment of agricultural irrigation water can be made possible.
Since the synthesized epoxy-VC and epoxy-CNS composite coatings presented pore diameters between 1 to 13 µm, these show to be adequate for the removal of fine particles in suspension. Due to the pore diameters obtained, the type of filtration carried out by these coatings is conventional filtration [68,78]. These coatings can be useful in agriculture to remove suspended organic solids and particles formed by the precipitation of salts and minerals in irrigation water.
By using CFD modeling, it was confirmed that simulation studies are adequate to better understand the flow behavior through the synthesized epoxy-VC and epoxy-CNS composite coatings during the filtration of pure water, as to determine the crossflow rates inside the filtration cell. These types of studies are important since the development of new filtration materials based on polymer blends with nanomaterials generate composites with structural and physical properties that are very different from the properties of existing MF membranes. The challenges related to the architecture and the firm structure of new filtration materials like nanofibers and nanocomposites is an obstacle to study the filtration properties in dynamic systems [79,80,81].
Therefore, creating specialized filtration systems and determining the ideal filtration conditions for new filtration composites is necessary to characterize their filtration behavior correctly, without wasting energy related to the applied pressures and chemical reagents. These studies are essential before carrying out filtration tests for the removal of contaminants, as well as, for the planning to scale up filtration processes using this type of composite coatings.
4. Conclusions
By determining the permeabilities of the composite coatings with different working pressures, it was deduced that the decrease in permeability is due to the contraction of the pores generated by the increase in the working pressure, and the number of pores in the coatings has a higher impact on permeation flow, than the pore size.
The pressure with which the highest performance of filtration is obtained in VC3, VC6 and CNS6, is 13,332 Pa. This is convenient due to its low energy consumption. Only for CNS3, the working pressure that generated the highest permeability was 26,664 Pa. Epoxy-VC and epoxy-CNS coatings present pore diameters with adequate sizes to remove fine particles and suspended solids in water, which will be evaluated in future studies for the cleaning of irrigation water.
Conducting permeability and permeation flux studies combined with CFD modeling analysis, represents a suitable option to predict the filtration performance of nanocomposite coating material before performing contaminant removal tests. This is because the production on a large scale of porous nanocomposite materials presents obstacles such as the high consumption of reagents and energy. For this reason, determining the ideal filtration conditions of a new nanocomposite coating, such as the working pressure and the configuration of the filtration system is necessary to optimize the contaminant removal test processes.
According to the recent reported studies, there is evidence showing that nanocomposite materials based on mixtures of carbon nanoparticles with epoxy resin and isopropanol have important advantages for their use in the synthesis of new filtration materials for the removal of contaminants.
Studies mentioned in this work have suggested that solvents can increase the dispersion of nanomaterials to form homogeneous mixtures, also increasing the flexibility of the epoxy-based composites. Other studies show that the surface area of the nanoparticles has a reinforcing effect on the epoxy mixtures, which is due to the penetration of the polymeric chains in the three-dimensional porous structure of the distributed material. The factors found to be the most important in determining the reinforcing effects in epoxy resin compounds are the architecture of the nanoparticles, their porosity and surface area, as well as their rigidity and chemical composition. Therefore, it must be emphasized that the type of nanomaterial used greatly influences the characteristics of epoxy resin composites.
These findings suggest that a complete characterization of the physicochemical and structural properties of the filler nanoparticles to be used is essential to understand their behavior in the nanocomposite coating during filtration.
Author Contributions
In this work all authors participated in the analysis of the results and contributed to the writing of the conclusions. E.E.-M. and J.L.P.-D. conceived and designed the main aspects of the study and carried out the methodology. E.E.-M. carried out the writing, review and editing of the Manuscript. J.L.P.-D. participated in the management of the software. J.A.M.-R. and A.R.-L. participated in the analysis and in the article writing validation. J.d.J.P.-B. contributed with the tool software and with resources for the data analysis. G.M.S.-Z. and J.F.P.-R. participated in the project administration. Finally, J.F.P.-R. provided resources for the experimental realization and contributed with the original draft preparation. All authors have read and agreed to the published version of the manuscript.
Funding
Funding for this work was provided by the National Council for Science and Technology (CONACYT), a decentralized public organization of the Mexican federal government. The support program is 005040—Doctorate in Biosystems Engineering, with support number 719658.
Institutional Review Board Statement
Not applicable.
Informed Consent Statement
Not applicable.
Data Availability Statement
Not applicable.
Acknowledgments
The authors would like to thank Carolina Espinoza Márquez for the translation of the complete Manuscript to English, as well as to Jannu Ricardo Casanova-Moreno (CIDETEQ) for the technical help.
Conflicts of Interest
The authors declare that they have no conflict of interest.
References
- Gharibian, S.; Hazrati, H.; Rostamizadeh, M. Continuous electrooxidation of Methylene Blue in filter press electrochemical flowcell: CFD simulation and RTD validation. Chem. Eng. Process. Process Intensif. 2020, 150, 107880. [Google Scholar] [CrossRef]
- Fynn Jerome, A. Advancements in Osmosis-and Pressure Driven Membrane Separation Processes-Optimizations of Membrane Module Designs through Computational Uid Dynamics; Technical University of Denmark: Bygningstorvet, Denmark, 2020; ISBN 978-3-527-40485-8. [Google Scholar]
- Pendergast, M.M.; Hoek, E.M.V. A review of water treatment membrane nanotechnologies. Energy Environ. Sci. 2011, 4, 1946–1971. [Google Scholar] [CrossRef] [Green Version]
- Das, R.; Abd Hamid, S.B.; Ali, M.E.; Ismail, A.F.; Annuar, M.S.M.; Ramakrishna, S. Multifunctional carbon nanotubes in water treatment: The present, past and future. Desalination 2014, 354, 160–179. [Google Scholar] [CrossRef]
- Khosravanipour Mostafazadeh, A.; Zolfaghari, M.; Drogui, P. Electrofiltration technique for water and wastewater treatment and bio-products management: A review. J. Water Process Eng. 2016, 14, 28–40. [Google Scholar] [CrossRef]
- Grafton, R.Q. Policy review of water reform in the Murray–Darling Basin, Australia: The “do’s” and “do’nots”. Aust. J. Agric. Resour. Econ. 2019, 63, 116–141. [Google Scholar] [CrossRef]
- O’Connor, N.; Mehta, K. Modes of greenhouse water savings. Procedia Eng. 2016, 159, 259–266. [Google Scholar] [CrossRef] [Green Version]
- Guo, W.; Ngo, H.H.; Li, J. A mini-review on membrane fouling. Bioresour. Technol. 2012, 122, 27–34. [Google Scholar] [CrossRef] [PubMed]
- Alwatban, A.M.; Alshwairekh, A.M.; Alqsair, U.F.; Alghafis, A.A.; Oztekin, A. Effect of membrane properties and operational parameters on systems for seawater desalination using computational fluid dynamics simulations. Desalin. Water Treat. 2019, 161, 92–107. [Google Scholar] [CrossRef] [Green Version]
- Li, X.; Nayak, K.; Stamm, M.; Tripathi, B.P. Zwitterionic silica nanogel-modified polysulfone nanoporous membranes formed by in-situ method for water treatment. Chemosphere 2021, 280, 130615. [Google Scholar] [CrossRef]
- De Volder, M.F.L.; Tawfick, S.H.; Baughman, R.H.; Hart, J.A. Carbon Nanotubes: Present and Future Commercial Applications. Science 2013, 339, 535–539. [Google Scholar] [CrossRef] [Green Version]
- Spitalsky, Z.; Tasis, D.; Papagelis, K.; Galiotis, C. Carbon nanotube-polymer composites: Chemistry, processing, mechanical and electrical properties. Prog. Polym. Sci. 2010, 35, 357–401. [Google Scholar] [CrossRef]
- Wen, Y.; Yuan, J.; Ma, X.; Wang, S.; Liu, Y. Polymeric nanocomposite membranes for water treatment: A review. Environ. Chem. Lett. 2019, 17, 1539–1551. [Google Scholar] [CrossRef]
- Li, H.; Zhao, M.; Jin, B.; Wen, Z.; Liu, H.K.; Jiang, Q. Mesoporous Nitrogen-Doped Carbon Nanospheres as Sulfur Matrix and a Novel Chelate-Modified Separator for High-Performance Room-Temperature Na-S Batteries. Small 2020, 16, 1907464. [Google Scholar] [CrossRef]
- Kotia, A.; Yadav, A.; Raj, T.R.; Keischgens, M.G.; Rathore, H.; Sarris, I.E. Carbon nanoparticles as sources for a cost-effective water purification method: A comprehensive review. Fluids 2020, 5, 230. [Google Scholar] [CrossRef]
- Giraud, L.; Tourrette, A.; Flahaut, E. Carbon nanomaterials-based polymer-matrix nanocomposites for antimicrobial applications: A review. Carbon 2021, 182, 463–483. [Google Scholar] [CrossRef]
- Gryta, M. Fouling in direct contact membrane distillation process. J. Memb. Sci. 2008, 325, 383–394. [Google Scholar] [CrossRef]
- Mairal, A.P.; Greenberg, A.R.; Krantz, W.B. Investigation of membrane fouling and cleaning using ultrasonic time-domain reflectometry. Desalination 2000, 130, 45–60. [Google Scholar] [CrossRef]
- Yu, W.; Liu, T.; Crawshaw, J.; Liu, T.; Graham, N. Ultrafiltration and nanofiltration membrane fouling by natural organic matter: Mechanisms and mitigation by pre-ozonation and pH. Water Res. 2018, 139, 353–362. [Google Scholar] [CrossRef]
- Zularisam, A.W.; Ismail, A.F.; Salim, R. Behaviours of natural organic matter in membrane filtration for surface water—A review. Desalination 2006, 194, 211–231. [Google Scholar] [CrossRef] [Green Version]
- Katuri, K.P.; Werner, C.M.; Jimenez-Sandoval, R.J.; Chen, W.; Jeon, S.; Logan, B.E.; Lai, Z.; Amy, G.L.; Saikaly, P.E. A novel anaerobic electrochemical membrane bioreactor (AnEMBR) with conductive hollow-fiber membrane for treatment of low-organic strength solutions. Environ. Sci. Technol. 2014, 48, 12833–12841. [Google Scholar] [CrossRef]
- Haddadi, S.A.; Ramazani, A.S.A.; Mahdavian, M.; Taheri, P.; Mol, J.M.C. Mechanical and Corrosion Protection Properties of a Smart Composite Epoxy Coating with Dual-Encapsulated Epoxy/Polyamine in Carbon Nanospheres. Ind. Eng. Chem. Res. 2019, 58, 3033–3046. [Google Scholar] [CrossRef]
- Li, C.; Rasheed, T.; Tian, H.; Huang, P.; Mai, Y.; Huang, W.; Zhou, Y. Solution Self-Assembly of an Alternating Copolymer toward Hollow Carbon Nanospheres with Uniform Micropores. ACS Macro Lett. 2019, 8, 331–336. [Google Scholar] [CrossRef]
- Liao, Z.; Nguyen, M.N.; Wan, G.; Xie, J.; Ni, L.; Qi, J.; Li, J.; Schäfer, A.I. Low pressure operated ultrafiltration membrane with integration of hollow mesoporous carbon nanospheres for effective removal of micropollutants. J. Hazard. Mater. 2020, 397, 122779. [Google Scholar] [CrossRef]
- Lu, X.; Dou, H.; Zhang, X. Mesoporous carbon nanospheres inserting into graphene sheets for flexible supercapacitor film electrode. Mater. Lett. 2016, 178, 304–307. [Google Scholar] [CrossRef]
- Serp, P.; Feurer, R.; Kalck, P.; Kihn, Y.; Faria, J.L.; Figueiredo, J.L. A chemical vapour deposition process for the production of carbon nanospheres. Carbon 2001, 39, 621–626. [Google Scholar] [CrossRef]
- Inagaki, M. Discussion of the formation of nanometric texture in spherical carbon bodies. Carbon 1997, 35, 711–713. [Google Scholar] [CrossRef]
- Hank, A.M.; Nyamupangedengu, C.; Mutuma, B.K.; Li, H.; Coville, N.J.; Leifer, K.; Sigalas, I. Comparative Characterisation of CNS/Epoxy and BN/Epoxy Nanodielectrics using Electrical Tree PD Measurements and Atomic Force Microscopy. Int. J. Eng. Res. Afr. 2020, 48, 24–37. [Google Scholar] [CrossRef]
- Yadav, S.; Saleem, H.; Ibrar, I.; Naji, O.; Hawari, A.A.; Alanezi, A.A.; Zaidi, S.J.; Altaee, A.; Zhou, J. Recent developments in forward osmosis membranes using carbon-based nanomaterials. Desalination 2020, 482, 114375. [Google Scholar] [CrossRef]
- Yu, H.; Gu, L.; Wu, S.; Dong, G.; Qiao, X.; Zhang, K.; Lu, X.; Wen, H.; Zhang, D. Hydrothermal carbon nanospheres assisted-fabrication of PVDF ultrafiltration membranes with improved hydrophilicity and antifouling performance. Sep. Purif. Technol. 2020, 247, 116889. [Google Scholar] [CrossRef]
- Zhang, C.; Gao, Q.; Zhou, B.; Bhargava, G. Preparation, characterization, and surface conductivity of nanocomposites with hollow graphitic carbon nanospheres as fillers in polymethylmethacrylate matrix. J. Nanoparticle Res. 2017, 19, 269. [Google Scholar] [CrossRef]
- Gui, X.; Wei, J.; Wang, K.; Cao, A.; Zhu, H.; Jia, Y.; Shu, Q.; Wu, D. Carbon nanotube sponges. Adv. Mater. 2010, 22, 617–621. [Google Scholar] [CrossRef] [PubMed]
- Miao, J.Y.; Hwang, D.W.; Narasimhulu, K.V.; Lin, P.I.; Chen, Y.T.; Lin, S.H.; Hwang, L.P. Synthesis and properties of carbon nanospheres grown by CVD using Kaolin supported transition metal catalysts. Carbon 2004, 42, 813–822. [Google Scholar] [CrossRef]
- Wu, C.; Chen, X.; Tang, L.; Wei, Q.; Wei, X.; Liang, J.; Wang, L. Rationally Constructing A Nano MOF-Derived Ni and CQD Embedded N-Doped Carbon Nanosphere for the Hydrogenation of Petroleum Resin at Low Temperature. ACS Appl. Mater. Interfaces 2021, 13, 10855–10869. [Google Scholar] [CrossRef] [PubMed]
- Yu, W.; Yu, T.; Graham, N. Development of a stable cation modified graphene oxide membrane for water treatment. 2D Mater. 2017, 4, 045006. [Google Scholar] [CrossRef]
- Karak, N. Nanocomposites of Epoxy and Carbon Dots. Sustainable Epoxy Thermosets and Nanocomposites; ACS Publications: Tezpur, India, 2021; pp. 169–200. ISBN 1947-5918. [Google Scholar]
- Haddadi, S.A.; Ramazani, S.A.A.; Mahdavian, M.; Arjmand, M. Epoxy nanocomposite coatings with enhanced dual active/barrier behavior containing graphene-based carbon hollow spheres as corrosion inhibitor nanoreservoirs. Corros. Sci. 2021, 185, 109428. [Google Scholar] [CrossRef]
- Stavropoulos, S.G.; Sanida, A.; Psarras, G.C. Carbon allotropes/epoxy nanocomposites as capacitive energy storage/harvesting systems. Appl. Sci. 2021, 11, 7059. [Google Scholar] [CrossRef]
- Sitole, S.; Nyamupangedengu, C.; Magubane, A.; Coville, N. Synthesis of Hollow Carbon Spheres for Fabrication of C\Epoxy Nanocomposite Insulation. In Proceedings of the IEEE AFRICON Conference, Accra, Ghana, 25–27 September 2019; IEEE: Johannesburg, South Africa, 2019; pp. 1–6. [Google Scholar]
- Chu, T.; Yang, Y.; Lu, Y.; Du, X.; Ye, X. Clogging process by suspended solids during groundwater artificial recharge: Evidence from lab simulations and numerical modelling. Hydrol. Process. 2019, 33, 3226–3235. [Google Scholar] [CrossRef]
- Alshwairekh, A.; Alghafis, A.A.; Usta, M.; Alwatban, A. The Effect of Porous Support Layer in Forward Osmosis Membranes-A Computational Fluid Dynamics Simulation. In Proceedings of the 2018 International Mechanical Engineering Congress & Exposition, Pittsburgh, PA, USA, 9–15 November 2018. Imece2018-86328, V007T09A036. [Google Scholar] [CrossRef]
- Chen, V.; Li, H.; Fane, A.G. Non-invasive observation of synthetic membrane processes—A review of methods. J. Memb. Sci. 2004, 241, 23–44. [Google Scholar] [CrossRef]
- Teepakorn, C.; Grenier, D.; Fiaty, K.; Charcosset, C. Characterization of hydrodynamics in membrane chromatography devices using magnetic resonance imaging and computational fluid dynamics. Chem. Eng. Res. Des. 2016, 113, 61–73. [Google Scholar] [CrossRef]
- Nassehi, V.; Hanspal, N.S.; Waghode, A.N.; Ruziwa, W.R.; Wakeman, R.J. Finite-element modelling of combined free/porous flow regimes: Simulation of flow through pleated cartridge filters. Chem. Eng. Sci. 2005, 60, 995–1006. [Google Scholar] [CrossRef]
- Brinker, C.J.; Scherer, G.W. Sol-Gel Science: The physics and chemistry of sol-gel processing. Brinker 1990, 1990, 462. [Google Scholar]
- Zhao, S.; Fan, Y.; Zhu, K.; Zhang, D.; Zhang, W.; Chen, S.; Liu, R.; Yao, M.; Liu, B. The effect of hydrogenation on the growth of carbon nanospheres and their performance as anode materials for rechargeable lithium-ion batteries. Nanoscale 2015, 7, 1984–1993. [Google Scholar] [CrossRef]
- Wang, N.; Yang, Z.; Xu, F.; Thummavichai, K.; Chen, H.; Xia, Y.; Zhu, Y. A generic method to synthesise graphitic carbon coated nanoparticles in large scale and their derivative polymer nanocomposites. Sci. Rep. 2017, 7, 11829. [Google Scholar] [CrossRef] [Green Version]
- Zia, A.W.; Birkett, M.; Badshah, M.A.; Iqbal, M. Progress in-situ synthesis of graphitic carbon nanoparticles with physical vapour deposition. Prog. Cryst. Growth Charact. Mater. 2021, 67, 100534. [Google Scholar] [CrossRef]
- Gonzalez-Reyna, M.; Rodriguez-Lopez, A.; Pérez-Robles, J.F. One-step synthesis of carbon nanospheres with an encapsulated iron-nickel nanoalloy and its potential use as an electrocatalyst. Nanotechnology 2021, 32, 095706. [Google Scholar] [CrossRef]
- Gonzalez-Reyna, M.; Luna-Martínez, M.S.; Perez-Robles, J.F. Nickel supported on carbon nanotubes and carbon nanospheres for ammonia oxidation reaction. Nanotechnology 2020, 31, 235706. [Google Scholar] [CrossRef]
- Hoyos-Palacio, L.M.; García, A.G.; Pérez-Robles, J.F.; González, J.; Martínez-Tejada, H.V. Catalytic effect of Fe, Ni, Co and Mo on the CNTs production. IOP Conf. Ser. Mater. Sci. Eng. 2014, 59, 012005. [Google Scholar] [CrossRef] [Green Version]
- Tian, F.; He, C.N. Fabrication and growth mechanism of carbon nanospheres by chemical vapor deposition. Mater. Chem. Phys. 2010, 123, 351–355. [Google Scholar] [CrossRef]
- Luhrs, C.C.; Moberg, M.; Maxson, A.; Brewer, L.; Menon, S. IF-WS2/nanostructured carbon hybrids generation and their characterization. Inorganics 2014, 2, 211–232. [Google Scholar] [CrossRef] [Green Version]
- Popova, A.N. Crystallographic analysis of graphite by X-Ray diffraction. Coke Chem. 2017, 60, 361–365. [Google Scholar] [CrossRef]
- Alventosa-deLara, E.; Barredo-Damas, S.; Alcaina-Miranda, M.I.; Iborra-Clar, M.I. Ultrafiltration technology with a ceramic membrane for reactive dye removal: Optimization of membrane performance. J. Hazard. Mater. 2012, 209–210, 492–500. [Google Scholar] [CrossRef]
- Ghadhban, M.Y.; Majdi, H.S.; Rashid, K.T.; Alsalhy, Q.F.; Lakshmi, D.S.; Salih, I.K.; Figoli, A. Removal of dye from a leather tanning factory by flat-sheet blend ultrafiltration (UF) membrane. Membranes 2020, 10, 47. [Google Scholar] [CrossRef] [Green Version]
- Jiang, G.; Pickering, S.J.; Lester, E.H.; Warrior, N.A. Decomposition of epoxy resin in supercritical isopropanol. Ind. Eng. Chem. Res. 2010, 49, 4535–4541. [Google Scholar] [CrossRef]
- Yi, R.; Xia, X.; Yang, R.; Yu, R.; Dai, F.; Chen, J.; Liu, W.; Wu, M.; Xu, J.; Chen, L. Selective reduction of epoxy groups in graphene oxide membrane for ultrahigh water permeation. Carbon 2021, 172, 228–235. [Google Scholar] [CrossRef]
- Qiu, K.; Tannenbaum, R.; Jacob, K.I. Effect of processing techniques and residual solvent on the thermal/mechanical properties of epoxy-cellulose nanocrystal nanocomposites. Polym. Eng. Sci. 2021, 61, 1281–1294. [Google Scholar] [CrossRef]
- Ning, N.; Wang, M.; Zhou, G.; Qiu, Y.; Wei, Y. Effect of polymer nanoparticle morphology on fracture toughness enhancement of carbon fiber reinforced epoxy composites. Compos. Part B Eng. 2022, 234, 109749. [Google Scholar] [CrossRef]
- Das, S.; Halder, S.; Paul, B.; Khan, N.I.; Goyat, M.S. Impact of silanized milled graphite nanoparticles on thermo-mechanical properties of epoxy nanocomposite. Mater. Chem. Phys. 2022, 278, 125601. [Google Scholar] [CrossRef]
- Basha, S.I.; Kumar, A.M.; Maslehuddin, M.; Ahmad, S.; Rahman, M.M.; Shameem, M.; Hakeem, A.S.; Aziz, M.A. Preparation of submicron-/nano-carbon from heavy fuel oil ash and its corrosion resistance performance as composite epoxy coating. J. Clean. Prod. 2021, 319, 128735. [Google Scholar] [CrossRef]
- Reyhani, R.; Zadhoush, A.; Salman Tabrizi, N.; Nazockdast, H.; Naeimirad, M. The influence of CNT-doped carbon aerogels on microstructural, rheological and mechanical properties of epoxy nanocomposites. Compos. Sci. Technol. 2021, 215, 109031. [Google Scholar] [CrossRef]
- Ravindran, A.R.; Ladani, R.B.; Wang, C.H.; Mouritz, A.P. Strengthening of composite T-joints using 1D and 2D carbon nanoparticles. Compos. Struct. 2021, 255, 112982. [Google Scholar] [CrossRef]
- Wikander, K.; Ekströrn, H.; Palmqvist, A.E.C.; Lundblad, A.; Holmberg, K.; Lindbergh, G. Alternative catalysts and carbon support material for PEMFC. Fuel Cells 2006, 6, 21–25. [Google Scholar] [CrossRef]
- Khoo, Y.S.; Lau, W.J.; Liang, Y.Y.; Karaman, M.; Gürsoy, M.; Ismail, A.F. Eco-friendly surface modification approach to develop thin film nanocomposite membrane with improved desalination and antifouling properties. J. Adv. Res. 2022, 36, 39–49. [Google Scholar] [CrossRef] [PubMed]
- Belfort, G.; Davis, R.H.; Zydney, A.L. The behaviour of suspentions and macromolecular solutionsfiltration. J. Memb. Sci. 1994, 96, 1–58. [Google Scholar] [CrossRef]
- Bora, T.; Dutta, J. Applications of nanotechnology in wastewater treatment-A review. J. Nanosci. Nanotechnol. 2014, 14, 613–626. [Google Scholar] [CrossRef]
- Van Der Bruggen, B.; Vandecasteele, C.; Van Gestel, T.; Doyen, W.; Leysen, R. A review of pressure-driven membrane processes in wastewater treatment and drinking water production. Environ. Prog. 2003, 22, 46–56. [Google Scholar] [CrossRef]
- Yuan, W.; Kocic, A.; Zydney, A.L. Analysis of humic acid fouling during microfiltration using a pore blockage-cake filtration model. J. Memb. Sci. 2002, 198, 51–62. [Google Scholar] [CrossRef]
- Abid, H.S.; Johnson, D.J.; Clifford, B.; Gethin, D.T.; Bertoncello, P.; Hashaikeh, R.; Hilal, N. Periodic electrolysis technique for in situ fouling control and removal with low-pressure membrane filtration. Desalination 2018, 433, 10–24. [Google Scholar] [CrossRef] [Green Version]
- Song, C.; Wang, T.; Pan, Y.; Qiu, J. Preparation of coal-based microfiltration carbon membrane and application in oily wastewater treatment. Sep. Purif. Technol. 2006, 51, 80–84. [Google Scholar] [CrossRef]
- Yin, X.; Guan, K.; Gao, P.; Peng, C.; Wu, J. A preparation method for the highly permeable ceramic microfiltration membrane-precursor film firing method. RSC Adv. 2018, 8, 2906–2914. [Google Scholar] [CrossRef] [Green Version]
- Panchal, M.; Minugu, O.P.; Gujjala, R.; Ojha, S.; Mallampati Chowdary, S.; Mohammad, A. Study of environmental behavior and its effect on solid particle erosion behavior of hierarchical porous activated carbon-epoxy composite. Polym. Compos. 2022. [Google Scholar] [CrossRef]
- Starkova, O.; Gaidukovs, S.; Platnieks, O.; Barkane, A.; Garkusina, K.; Palitis, E.; Grase, L. Water absorption and hydrothermal ageing of epoxy adhesives reinforced with amino-functionalized graphene oxide nanoparticles. Polym. Degrad. Stab. 2021, 191, 109670. [Google Scholar] [CrossRef]
- Verma, C.; Olasunkanmi, L.O.; Akpan, E.D.; Quraishi, M.A.; Dagdag, O.; El Gouri, M.; Sherif, E.S.M.; Ebenso, E.E. Epoxy resins as anticorrosive polymeric materials: A review. React. Funct. Polym. 2020, 156, 104741. [Google Scholar] [CrossRef]
- Liu, J.; Li, R.; Yang, B. Carbon Dots: A New Type of Carbon-Based Nanomaterial with Wide Applications. ACS Cent. Sci. 2020, 6, 2179–2195. [Google Scholar] [CrossRef]
- Liu, H.; Vecitis, C.D. CNT-Based Electrochemical Filter for Water Treatment: Mechanisms and Applications. Doctoral Dissertation, Harvard University, Cambridge, MA, USA, 2015. [Google Scholar]
- Jakubczak, M.; Karwowska, E.; Rozmysłowska-Wojciechowska, A.; Petrus, M.; Woźniak, J.; Mitrzak, J.; Jastrzębska, A.M. Filtration materials modified with 2d nanocomposites-a new perspective for point-of-use water treatment. Materials 2021, 14, 182. [Google Scholar] [CrossRef]
- Bavatharani, C.; Muthusankar, E.; Wabaidur, S.M.; Alothman, Z.A.; Alsheetan, K.M.; mana AL-Anazy, M.; Ragupathy, D. Electrospinning technique for production of polyaniline nanocomposites/nanofibres for multi-functional applications: A review. Synth. Met. 2021, 271, 116609. [Google Scholar] [CrossRef]
- Xue, Q.; Zhang, K. MXene nanocomposite nanofiltration membrane for low carbon and long-lasting desalination. J. Memb. Sci. 2021, 640, 119808. [Google Scholar] [CrossRef]


Publisher’s Note: MDPI stays neutral with regard to jurisdictional claims in published maps and institutional affiliations. |
© 2022 by the authors. Licensee MDPI, Basel, Switzerland. This article is an open access article distributed under the terms and conditions of the Creative Commons Attribution (CC BY) license (https://creativecommons.org/licenses/by/4.0/).