Abstract
Weaker sections of a railway track, such as the approach sections, are prone to differential settlement under the action of repeated train loads. The railway tracks degrade more quickly at a critical section adjacent to a traditional rail bridge because of progressive deterioration. Opting for an integral abutment instead of a traditional bridge is gaining importance due to its improved performance in terms of track stiffness and reduced settlement. It is essential to understand such issues with the appropriate methodologies. This study investigates the behavior of an integral abutment bridge with the transition zone subjected to train loading. Generally, the transition zone is a two-part wedge section consisting of unbound granular material and cement bound mixture. A field monitored traditional abutment bridge system is used to validate the developed two-dimensional Finite Element (FE) model. The model is further developed to simulate the dynamic behavior of the transition zone against the varying speeds of the train. The parametric study is performed on the transition zone by varying its geometric configurations and considering different materials for the backfill. The results indicate that the trapezoidal approach slab influences the track displacement significantly. The transition zone thickness and material properties of the backfill have a greater effect on the overall track response. Based on the results, the stable transition zones are identified to cater to the gradual stiffness variation during train–track interaction.
1. Introduction
The railway track near the abutments deteriorates more quickly than the other track components. One of the main reasons for such degradation is the subtle transition zone where the variation of track stiffness and track settlement occurs due to irregular train-track interaction [1]. Previous studies on the transition zone effectiveness constituting long and thick sleepers, concrete approach slab, additional rails, and improved subgrade drainage have resulted in a swift and smooth adaptation of the stiffness and reduced the uniform settlement [2].
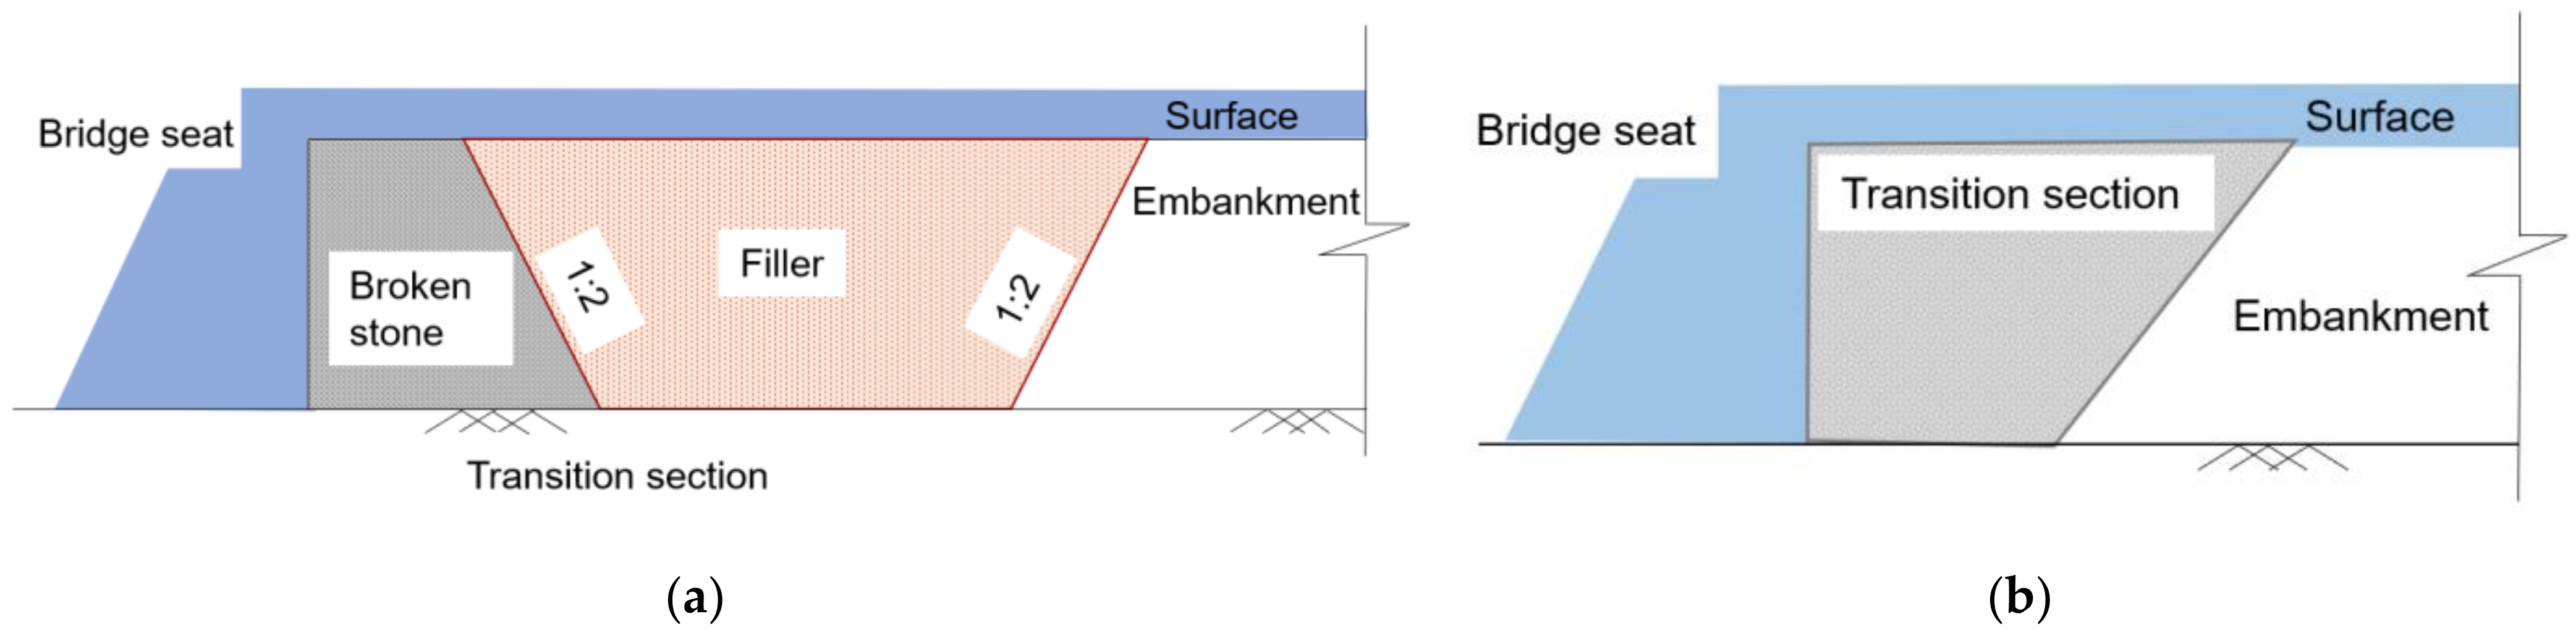
For High-Speed Trains (HST), the track structure is either ballasted or ballastless. The ballast is the principal component in a ballast track, while a concrete slab constitutes the ballastless track. Even though the dynamic loading developed in a ballastless track system is less, the transition zone helps in the uniform distribution of loading on the track and transfers the track load to the abutment smoothly through a gradual transition of stiffness between the track and the abutment [3]. The Chinese code suggests the implementation of the transition zone to the slab track either by a two-part transition or an inverted trapezoid section as in shown in Figure 1. Shan et al. [2] evaluated the dynamic response of slab tracks using both types of transition zones and concluded that the two-part transition section is more effective for HST operations.
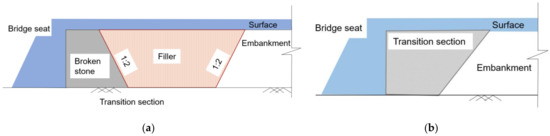
Figure 1.
Transition zone (a) two-part transition and (b) inverted trapezoid transition (modified after Shan et al. [2]).
At the transition sections, excitation of various components due to the escalated dynamic loading increases the track settlement and causes deterioration [4]. The disparity of the track stiffness along the supports or the abutments in a track bridge generates increased forces, thereby leading to track aberration. The track modulus and track irregularity define the vertical stiffness under the dynamic force [5]. The ideal value of the track modulus ranges from 14–69 N/mm/mm. When the track modulus is less than 14 N/mm/mm, it represents a weak subgrade and a value of more than 69 N/mm/mm depicts a strong subgrade which can accelerate undesirable dynamic vehicle/track interaction [6]. Increased vertical stiffness (k) reduces the settlement, while decreased vertical stiffness leads to resonance [7].
The train–track irregularities at the transition section are typically higher, leading to reduced passenger comfort, increased derailing risk, and escalated degradation of the train and track components. Therefore, for better performance of the transition zone, Railway Infrastructure Managers (RIM) suggest providing a well-compacted backfill with numerous layers of different materials between the embankment and the bridge [8]. Alves et al. [9] have performed experiments on introducing the Under Sleeper Pads (USP) in the transition zone of a ballasted track and noticed the smooth transfer of the elevated track stiffness between the components.
In the 1970s, trilateral transition zones were first incorporated in HST abutments, which were composed of a cement granular mixture and soil–cement as the base and the top layers, respectively [10]. European rail researchers designed the transition sections with proper guidelines suggested by the RIM [10,11]. It is suggested that the dominant factor governing an efficient design includes reducing the faults and irregularities of the transition zone [4]. The most common practice is the inclusion of two-part wedge transition sections, which consist of layers of various materials such as Unbound Granular Material (UGM) and Cement Bound Mixture (CBM). Paixão et al. [8] also adopted two-part wedge transition sections to perform experimental and numerical studies to check for the dynamic interaction forces and stiffness variations in the transition zone. A part of the transition zone lying above the granular material should be more unresponsive to deformation than the embankment material. The contributions from past research for the enumeration of various transition zones are listed in Table 1.

Table 1.
Past research studies for transition sections.
The traditional track bridges are constructed to include expansion joints to deal with the superstructure displacement; however, these joints can cause more track deterioration. Thus, restoration becomes quite challenging and expensive [15]. In recent years, Integral Abutment Bridges (IABs) have been replacing the conventional seat type abutments. The Integral Abutment Bridge (IAB) is a monolithic structure with no joints, consisting of a superstructure and a substructure. The provision for expansion and contraction depends on the integral abutments supported by a series of piles rather than expansion joints, as shown in Figure 2. The IABs are dynamically more stable structures with improved passenger safety and comfort and much-reduced construction and maintenance costs [16]. The design of each component of the IAB needs to be appropriate to deal with the impact forces and temperature changes, as the bridge movement causes displacement that leads to the settlement of the soil supporting it [17]. A field study has been performed by Talbott [18] highlighting the performance of the IAB for a period of 3 to 4 years. However, a long-term performance for larger lengths of the IABs needs to be evaluated more rigorously. Al-qarawi et al. [15] investigated the performance of the IAB by including a polystyrene geofoam as a fill material. The reduction of lateral pressure and settlement was one of the primary features of this jointless bridge.
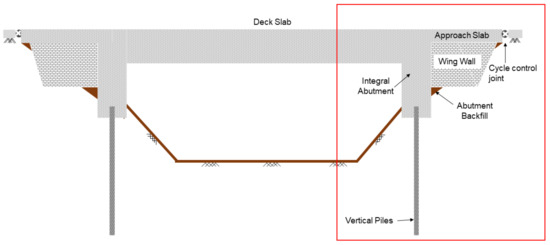
Figure 2.
Components of an integral abutment bridge and the highlighted box portion is considered in the analysis.
Research performed to highlight the dynamic behavior of monolithic structures based on the surface interactions suggests that the pile stability and backfill characteristics influence the abutment behavior, which in turn affects the transition zone [19]. Previous studies have suggested many mitigation techniques for such critical sections [20]. The IAB behavior is nonlinear in nature due to the non-linearities involved in the abutment-soil-pile system through various interactions. The behavior of the transition zone under the train loading depends on the hysteretic behavior of backfill soil. The main focus of this study is to recognize the abiding nature of the transition zone in a much-elaborated manner. Bridge designers commonly ignore the support of soil below the transition and design the approach slab as simply supported with standard loads [21]. The poor performance of approach slabs occurs due to various reasons such as soil erosion, settlement of backfill soil, movement of the bridge due to temperature and load and incidental forces such as creep and shrinkage [21]. To capture the transition zone behavior under the train loading properly, numerical simulations are necessary. The numerical simulation takes into consideration the whole structure, including the restraint involved in the super structure and Soil Structure Interaction (SSI) effects at piles and abutments. The present study highlights the modelling of IAB with the transition zone, as depicted in a box in Figure 2, and considers the SSI effects realistically by the master-slave concept in the ABAQUS simulations.
2. Numerical Model of the Integral Abutment Bridge
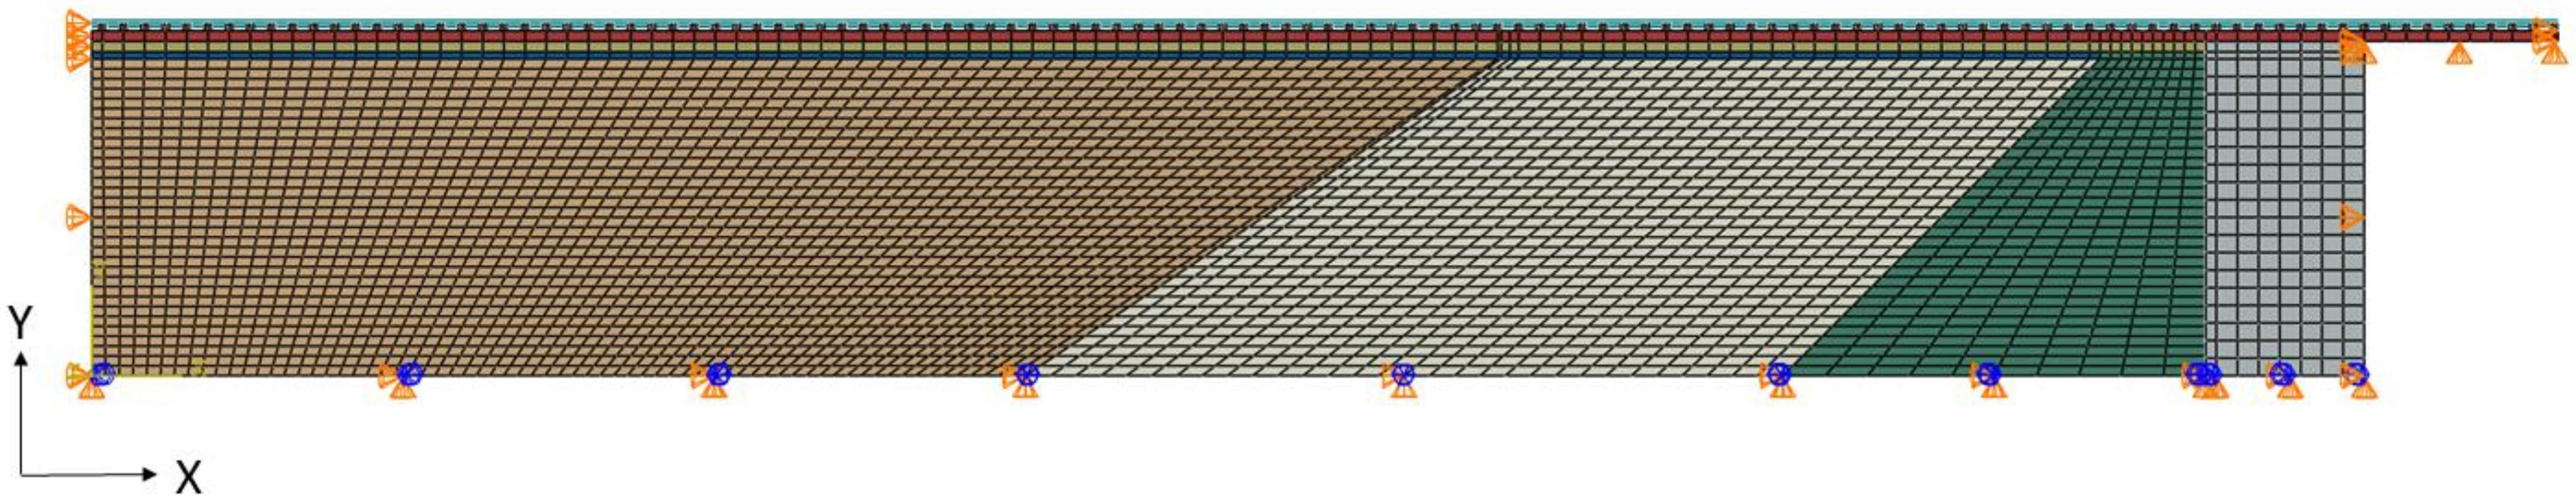
A two-dimensional (2D) FE model is developed using the software package ABAQUS, considering the different components of the train–track–abutment–pile system as shown in Figure 3a. A variation in length and thickness of the transition zone is considered in the analysis. The edge-to-edge contact at the interfaces such as sleeper–ballast, slab–ballast, foundation soil–pile and abutment–backfill are simulated by adopting the master-slave concept. To capture the SSI, normal behavior is simulated as hard contact and tangential behavior is simulated by Coulomb friction model inbuilt in ABAQUS [22].
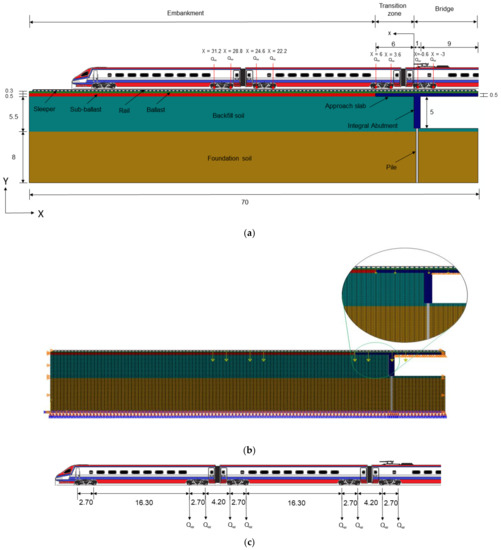
Figure 3.
Train–track–abutment–pile model: (a) Schematic geometry (all units in m), (b) FE mesh, and (c) Train loading (Qw in kN) configuration showing distance between axles (in m).
Boundary and Loading Conditions
The FE model encompasses the 70 m long rail section which is resting on 116 sleepers, each spaced at 0.6 m. The standard boundary conditions are adopted in the model. The roller supports are applied on the lateral sides and a fixed boundary condition at the bottom. The highest speed of the moving train considered in the study is 220 km/h. The calibration process incorporates the determination of the adequate properties of the different components as included in the FE model. Table 2 gives the corresponding properties of the materials. In this study, a 60 kg/m CrMg steel rail and a prestressed concrete sleeper are adopted. The backfill and foundation soils considered in the FE model are the dense sand and hard clay, respectively. The behavior of the materials is simulated by corresponding constitutive models, as given in Table 2.
Table 2.
Material properties of the model.
The behavior of the IAB-transition zone system is simulated using linear and nonlinear constitutive models. The rail, sleepers, integral abutment, and transition zone along with approach slab are simulated using linear elasticity. The nonlinear model is adopted to capture the behavior of ballast, sub-ballast, backfill, and foundation soils. The Rayleigh coefficients, ‘α’ and ‘β’, are determined using the following equations:
where is the damping ratio and and are the angular frequencies for a frequency interval with viscous damping equal to or less than [25]. The dimensions of the schematic model geometry are shown in Figure 3a. The FE mesh is discretised (3348 elements) using a 4-node bilinear plane strain element with reduced integration (CPE4R), as shown in Figure 3b. The integral abutment is supported by 8 m long HP piles, firmly socketed into the rock. The HP piles have many advantages, such as ease of installation, high bending moment capacity, and increased serviceability. The loading on the FE model is applied following the stage-wise procedure. The effective stresses (σ’ = σ − u, where σ is the total stress and u is the pore water pressure) in the model are generated by gravity loading (g = 9.81 m/s2). The settlement that resulted due to the gravity loading is considered as zero. A schematic representation of the train loading at different wheel axles is illustrated in Figure 3c.
The ABAQUS standard implicit analysis is performed to simulate the train wheel loading. The track displacement is obtained for different lengths, thicknesses, and inclinations of the transition zone configuration. The linearly varying trapezoidal transition zone is also simulated in the study. The thickness and length of the approach slab for practical considerations and development of design aids is usually varied from 300 to 900 mm and 3 to 18 m, respectively [26]. Therefore, in the present study, three thicknesses are chosen: 300, 500 and 700 mm. Similarly, the lengths of the approach slab are chosen as 6, 9, 12 and 15 m. The density of the backfill soil is also varied to assess its effect on the performance of the transition zone.
3. Parametric Study
The efficacy of the transition zone in effective load transfer and reducing the track settlement is determined by performing the parametric study. The static and cyclic loadings are applied for each of the configurations of the IAB-transition zone system. The loose, medium, and dense states of the backfill are simulated to evaluate the effectiveness of the backfill in reducing the track displacements. The train speed is simulated by using an equivalent static loading multiplier in accordance with the Dynamic Amplification Factor (DAF). The higher train speeds above 220 km/h will induce the critical velocity effects, which in turn significantly increases the dynamic train load. Hence, the train speeds are considered as 60, 100, 150, and 200 km/h and the same are used in the present study.
3.1. Variation of the Length of the Transition Zone
The length of the transition zone is varied as 6, 9, 12, and 15 m by keeping the thickness constant. The influence of the varying length of the transition zone on the track displacement is illustrated in Figure 4. The track maximum displacement occurs when the length of the transition zone is equal to 6 m, albeit the track section at the transition zone–embankment intersection shows larger displacements than the rest of the track. The track displacements continue to decrease with the increase in the length of the transition zone (i.e., 6 to 9 m). However, for the further increased length (i.e., 12 and 15 m), there is no change in the track displacement. It is noted from the results that the track section at the transition–embankment intersection is the most vulnerable. However, the varying length of the transition zone does not affect the track displacement at the transition–embankment intersection. The track displacement is found to be maximum at the embankment and then at the transition zone and the least at the bridge. Similar observations have also been made by Coelho et al. [27].
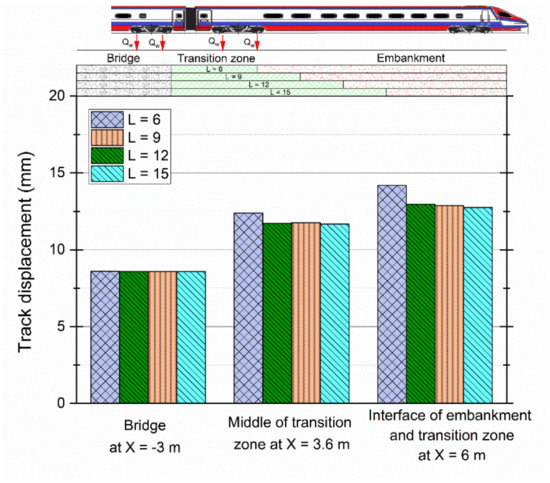
Figure 4.
Variation of track displacement with changing lengths of the transition zone.
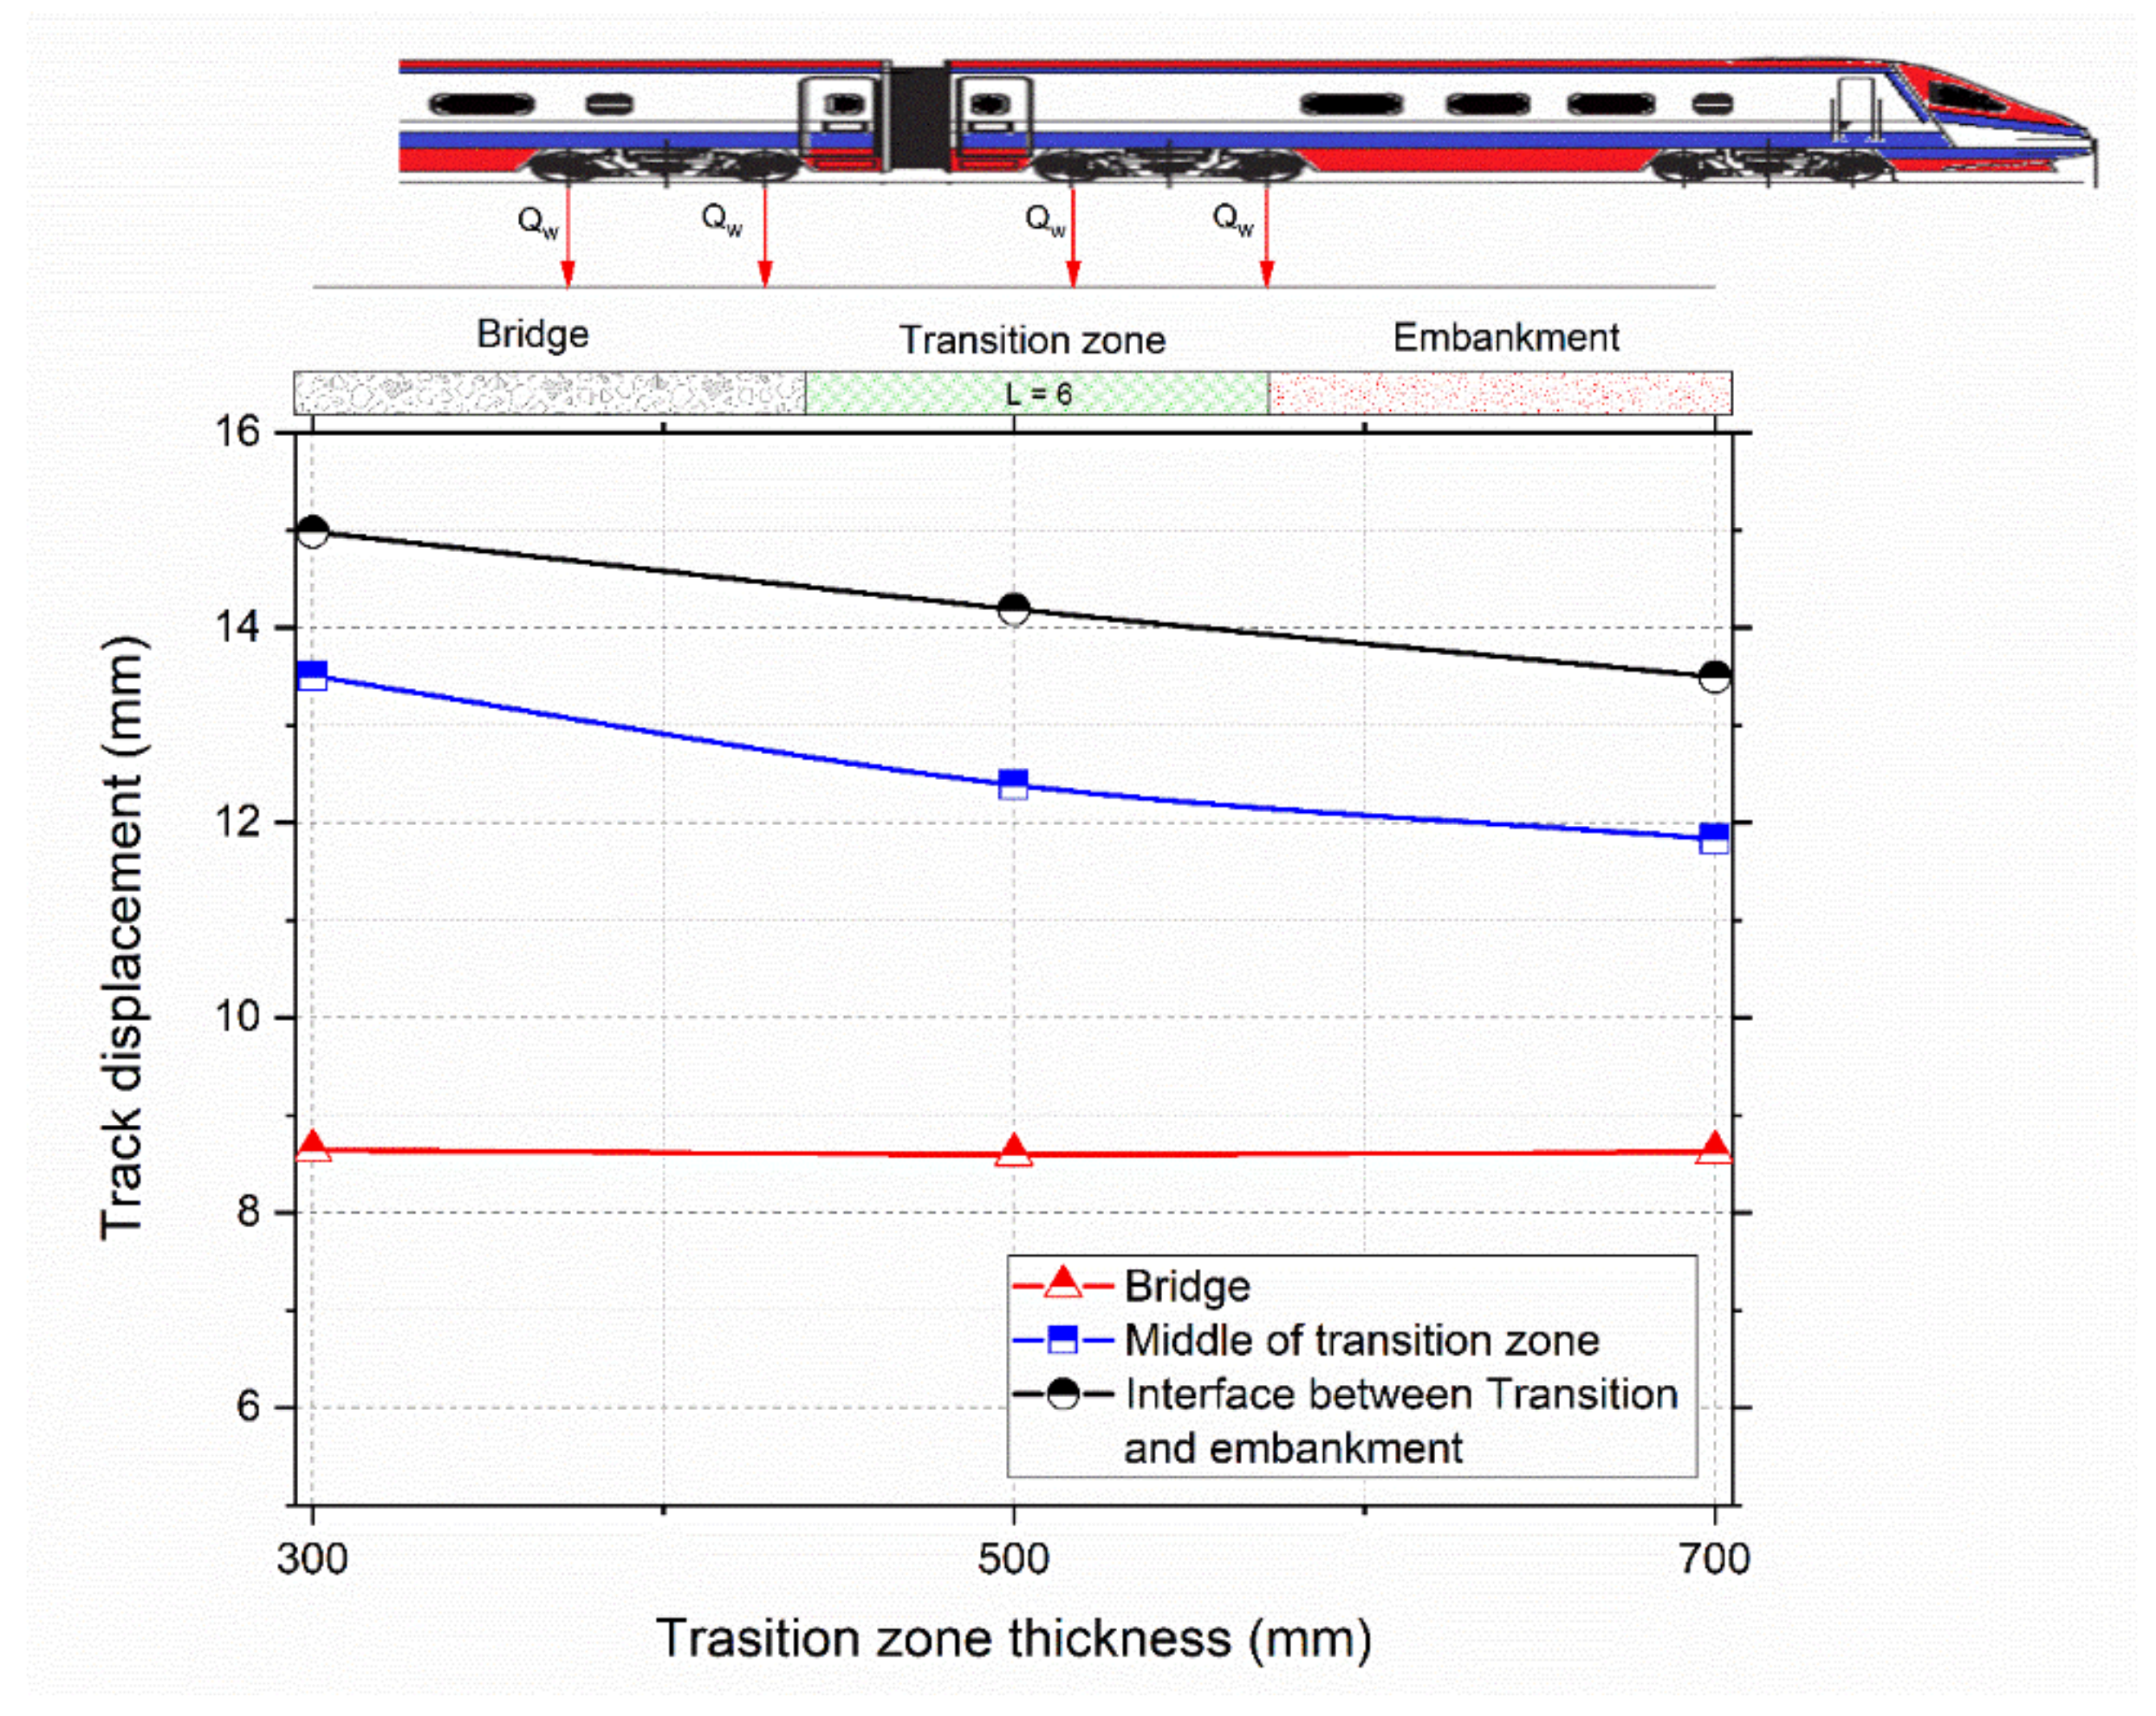
3.2. Variation of the Transition Zone Thickness
Keeping the length of the transition zone as 6 m, the thickness of the transition zone is varied from 300 to 700 mm. Figure 5 shows the track displacement with varying thickness of the transition zone at the bridge, middle of the transition zone, and interface of the transition zone–embankment section. The track maximum displacement occurs at the interface of the transition zone-–embankment when the thickness of the transition zone is 300 mm. This indicates the benefit of the increased thickness of the transition zone in reducing the track displacement, especially along the most critical section of the track (i.e., interface of the transition zone–embankment). It is noted that the increased thickness of the transition zone does not affect the settlement of the bridge section.
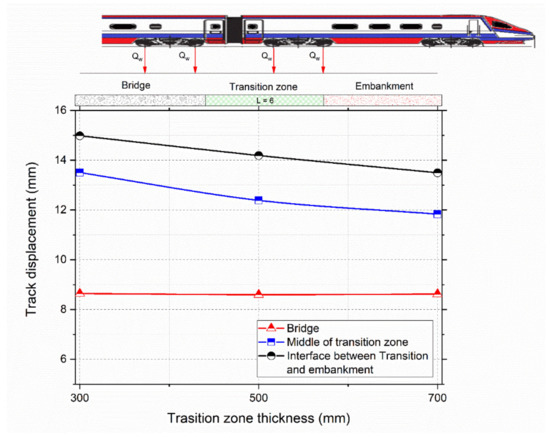
Figure 5.
Variation of track displacement with thickness of transition zone.
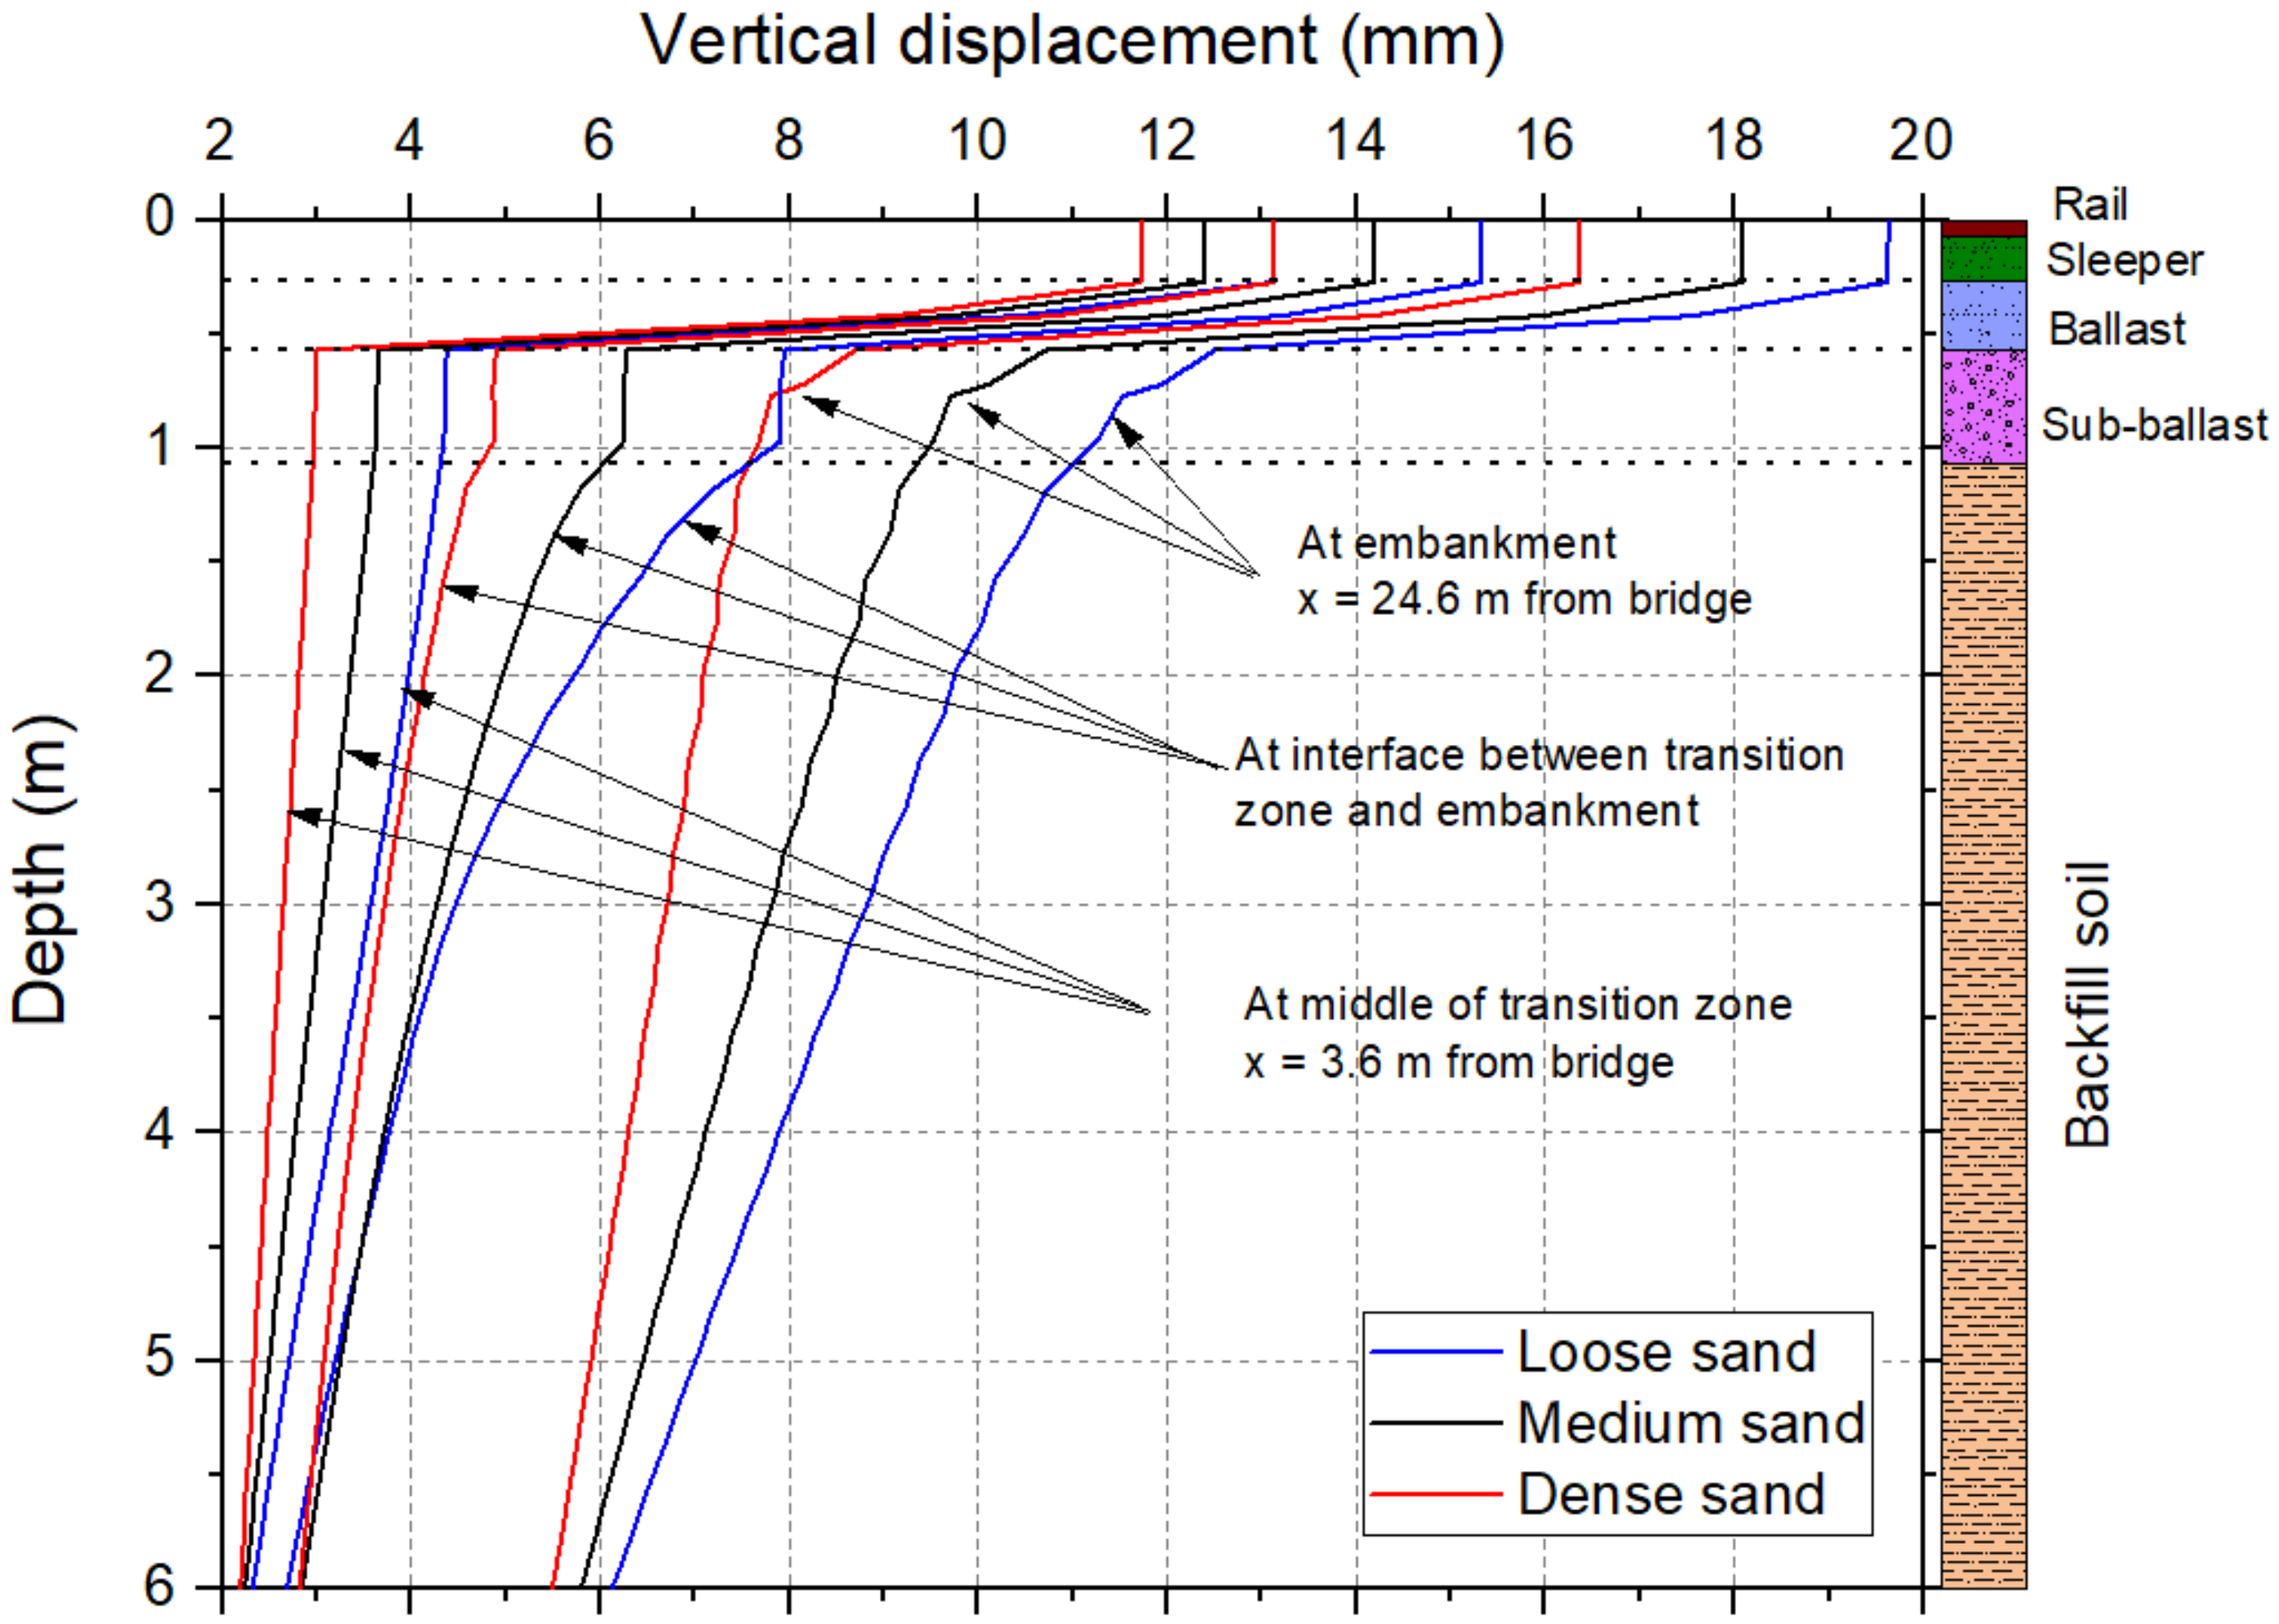
3.3. Variation of Backfill Soil Density
The backfill soil density is varied to simulate the loose, medium, and dense states to assess its impact on the track performance. Figure 6 depicts the vertical displacement across the depth for different compaction states of the backfill soil. The maximum displacement occurs at the embankment section. The transition zone experiences the least displacement due to its immediate vicinity to the approach slab. The loose and dense sand backfills show the maximum and minimum displacements, respectively. The maximum ballast settlement occurs at the bridge span and decreases at the embankment due to the efficient load transfer to the subgrade and in turn to the backfill. The ballast layer at the bridge-transition zone rests over the rigid concrete section and undergoes more settlement as compared to the embankment, where the ballast rests on the soil subgrade.
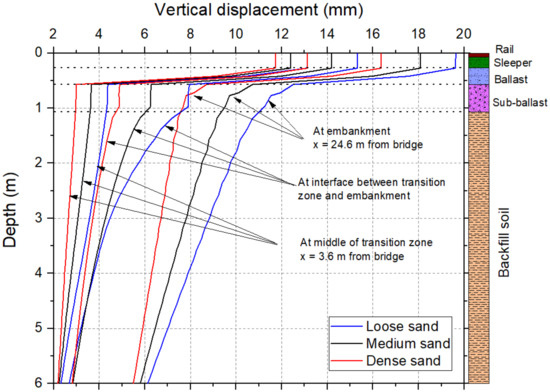
Figure 6.
Variation of vertical displacement with depth for different backfill soils.
The vertical displacement is more significant in the top layer of the backfill and decreases with depth, as seen in Figure 6. However, beneath the transition zone, the difference in the vertical displacement is negligible between the top and bottom layers of the backfill. The minimum ballast settlement is observed for the case of loose backfill material. At the embankment section, the backfill soil density does not affect the compression of the ballast layer.
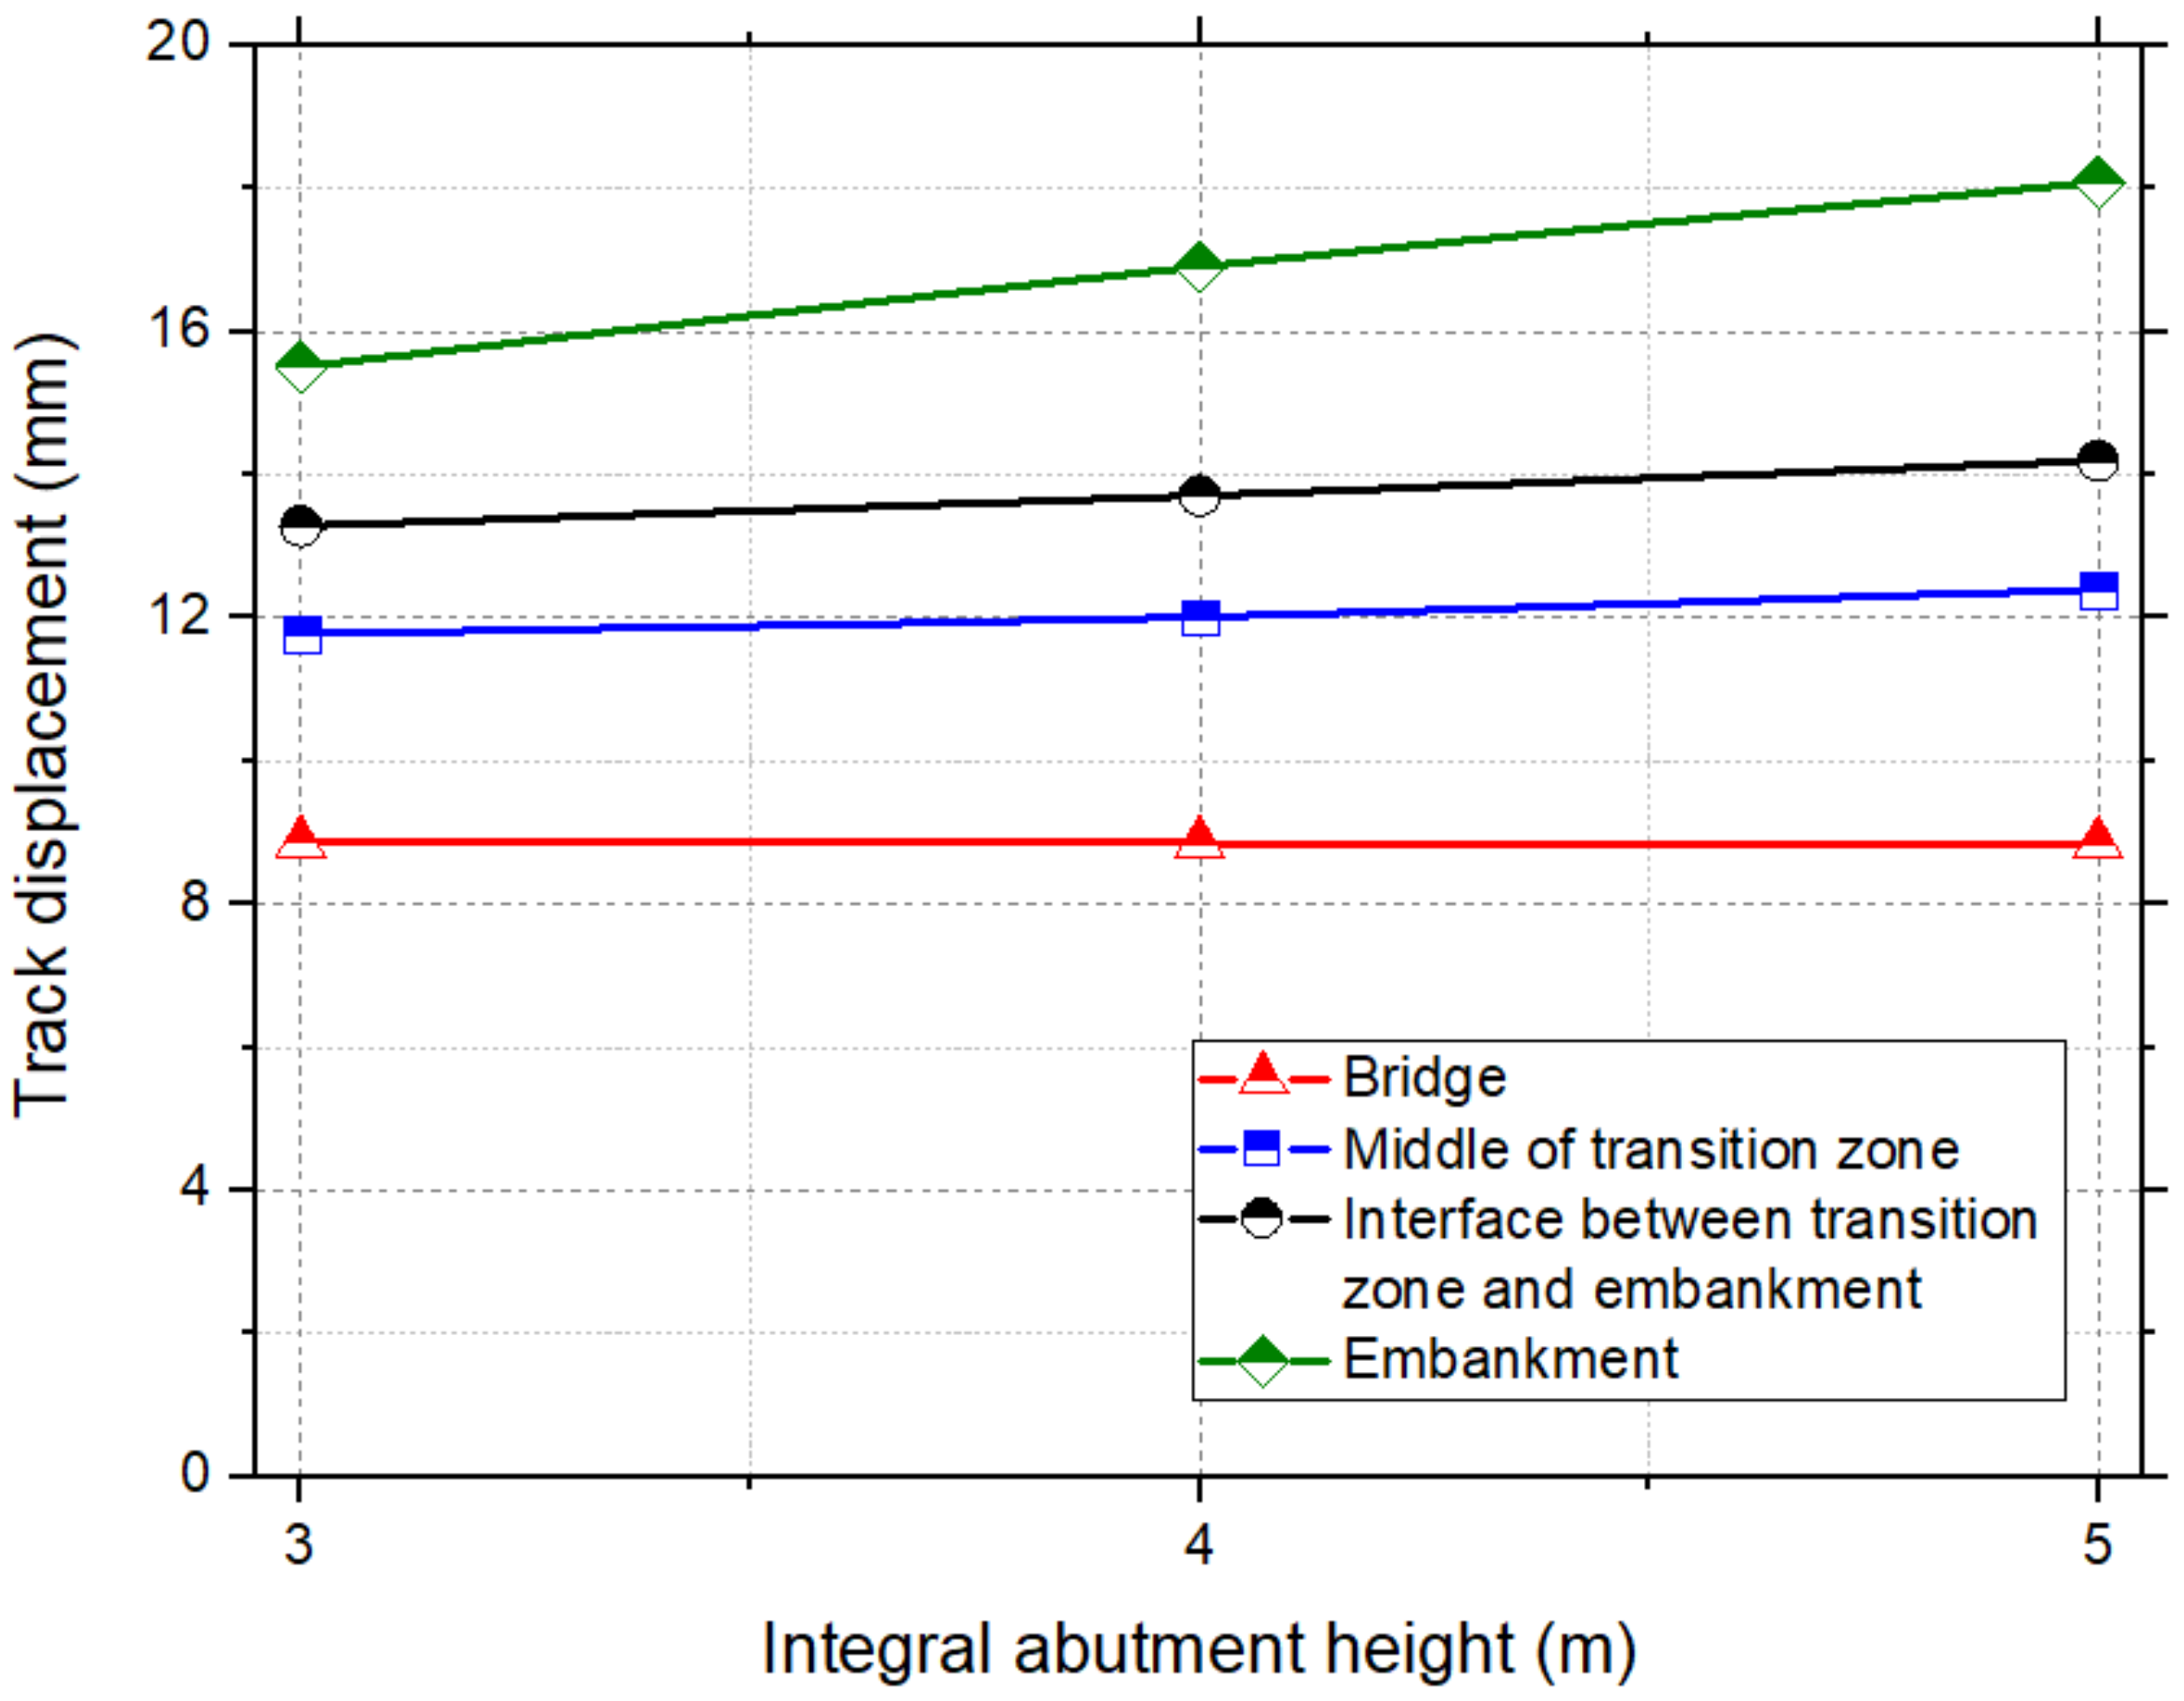
3.4. Variation of Height of the Integral Abutment
The height of the integral abutment is varied as 3, 4, and 5 m to evaluate the track displacement. The variation of the track displacement with different heights of the integral abutment is depicted in Figure 7. The track displacement increases with the increase in the height of the integral abutment, notably at the embankment. At the interface of the transition zone–embankment, the transition zone, and the bridge section, this trend is not observed. The increase in the height of the integral abutment causes a minor difference in the track displacement at the transition zone due to the train load transfer from the ballast layer to the approach slab. The compression of the backfill soil is higher at the embankment zone than in the transition zone, as the train loading is transferred from the ballast to the sub-ballast and then to the backfill soil.
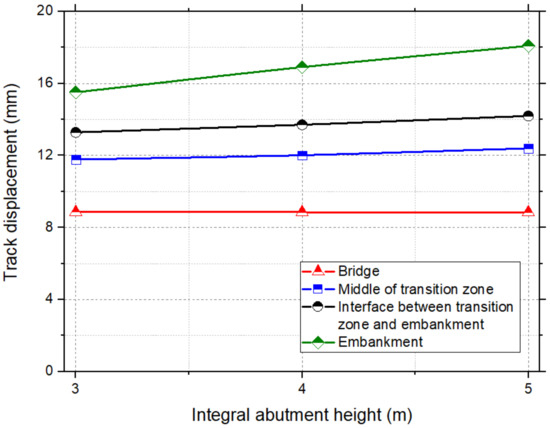
Figure 7.
Variation of track displacement with height of the integral abutment.
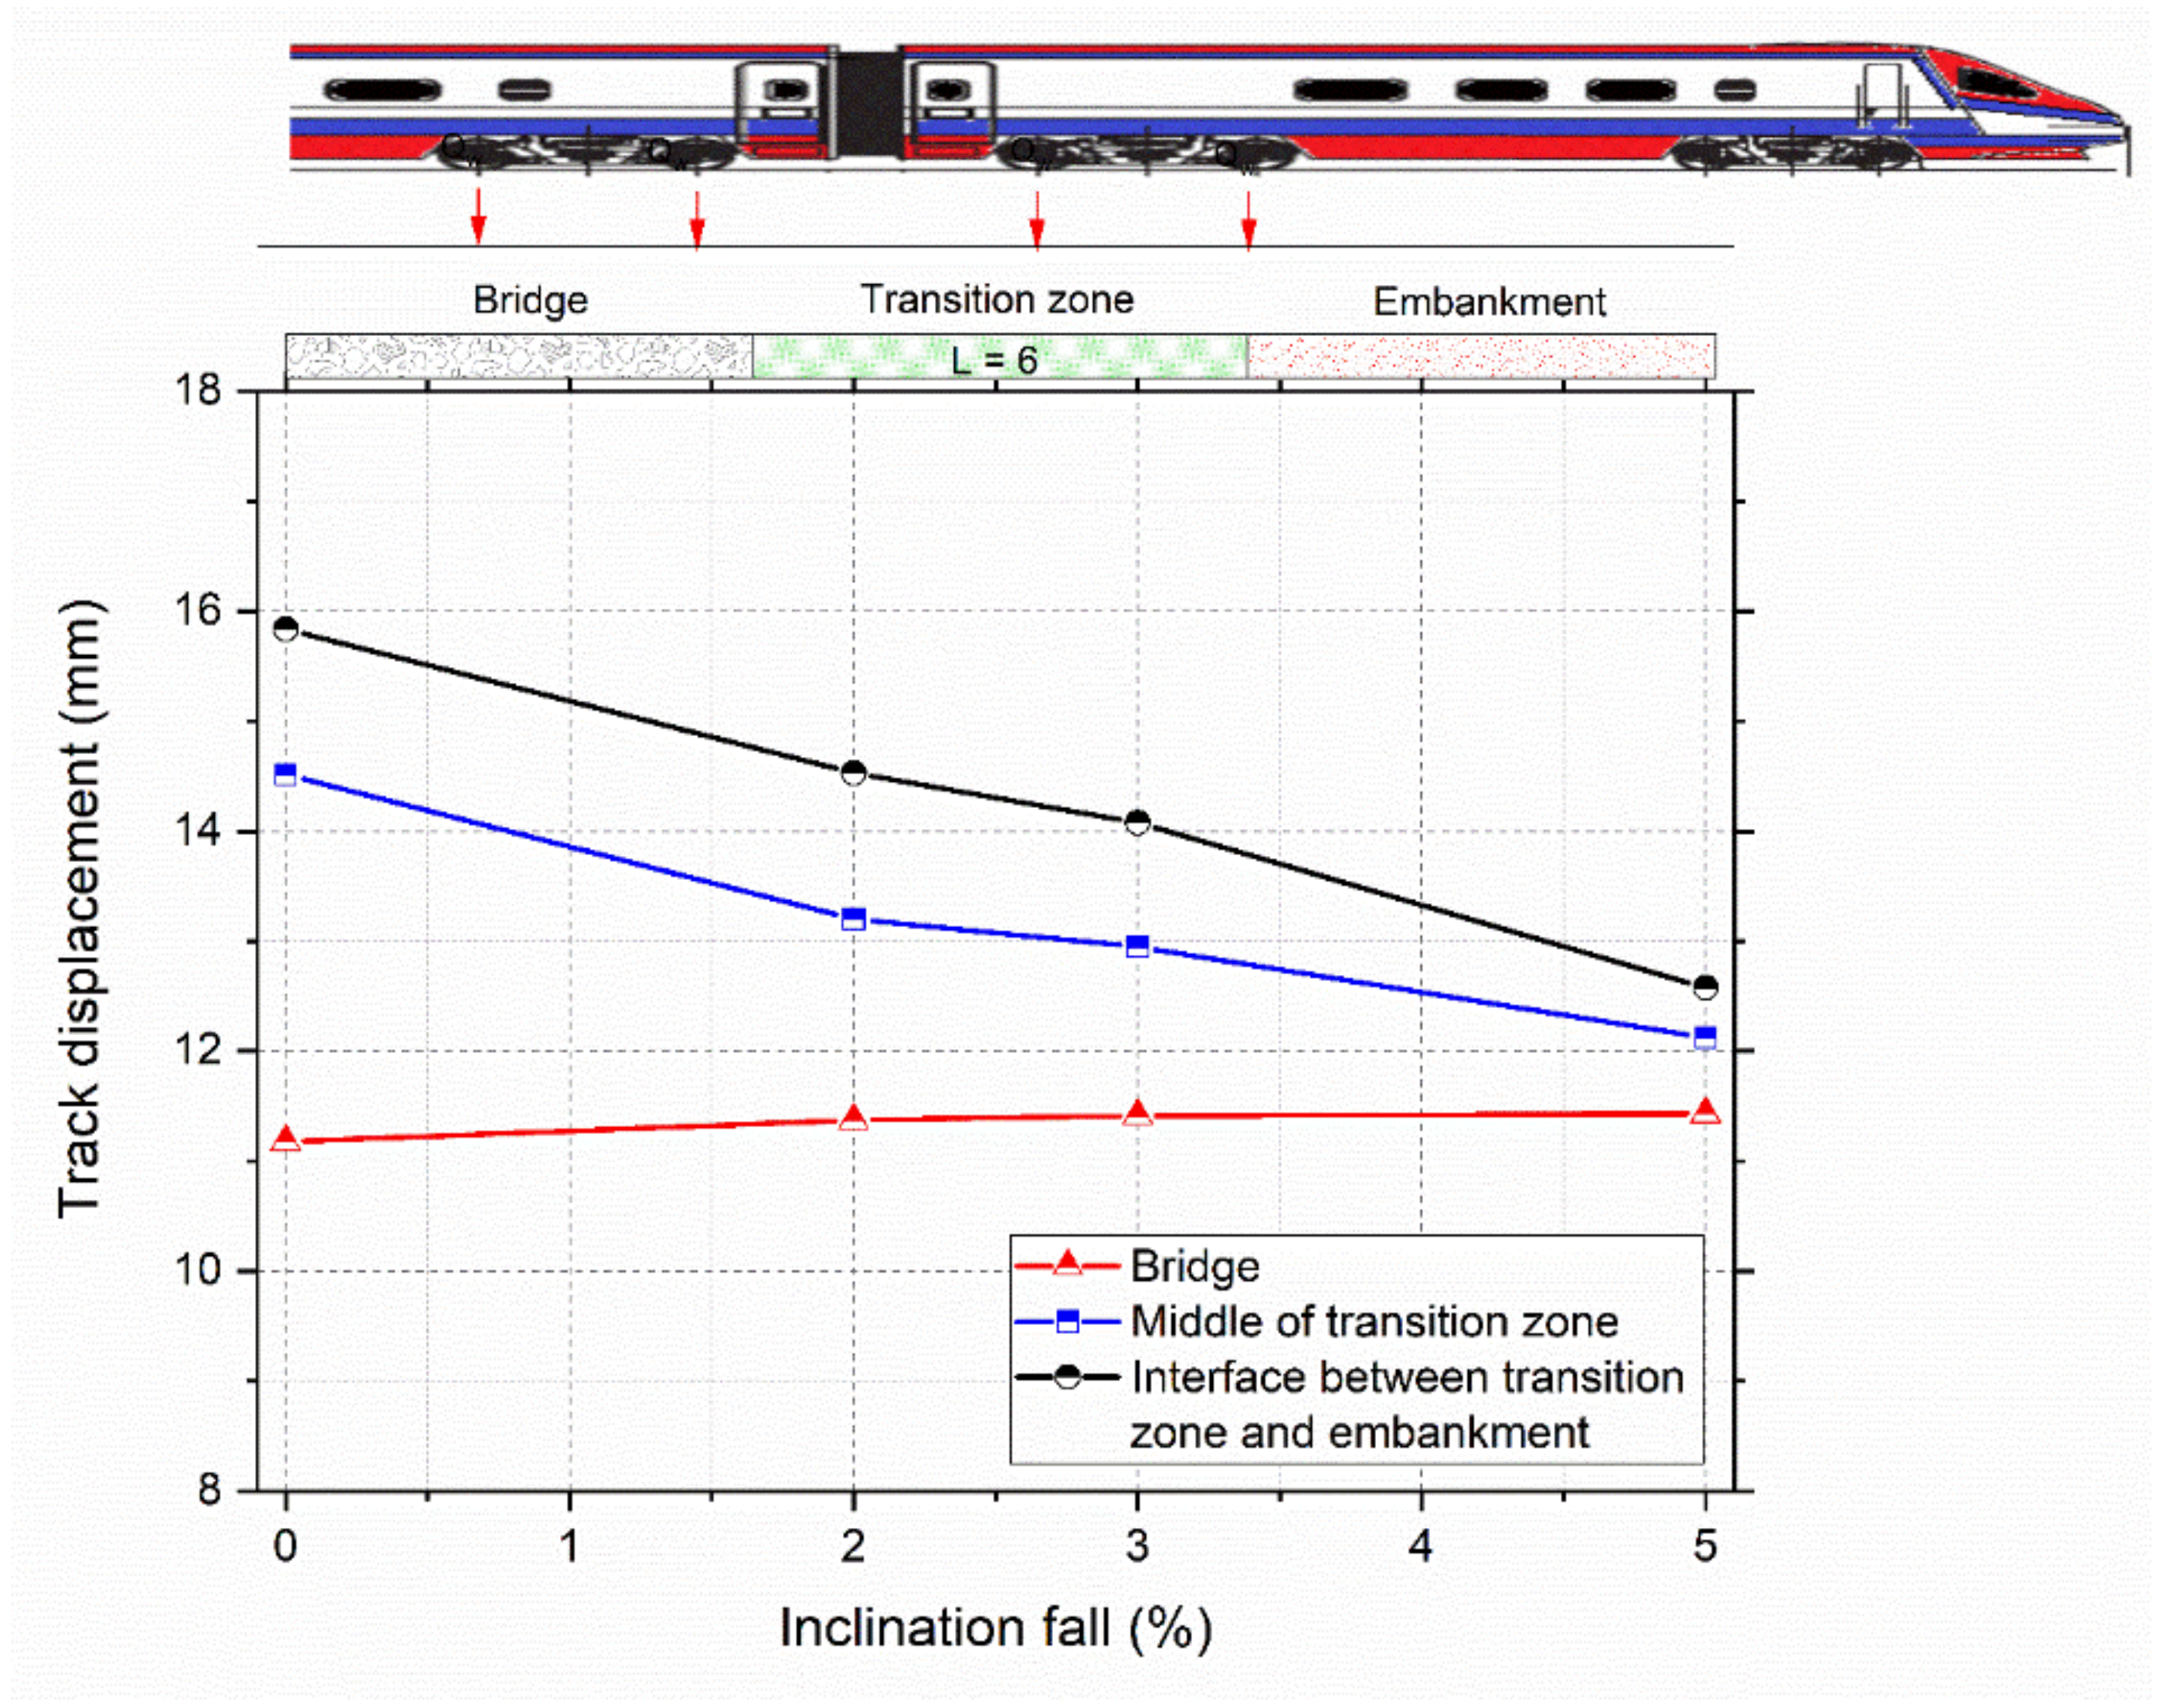
3.5. Variation of Inclination of Transition Zone
The track displacement at the transition zone and bridge is evaluated for varying inclination of the approach slab with magnitudes of fall as 0, 2, 3, and 5%. The approach slab is responsible for reducing the track displacement. Figure 8 shows the variation of the track displacement with fall in inclination at the bridge and transition zone. The increase in the fall results in the reduction of the track displacement at the critical sections. However, the track displacement at the bridges is unaffected with the fall in the inclination of the approach slab because there are no geometrical changes at the bridge.
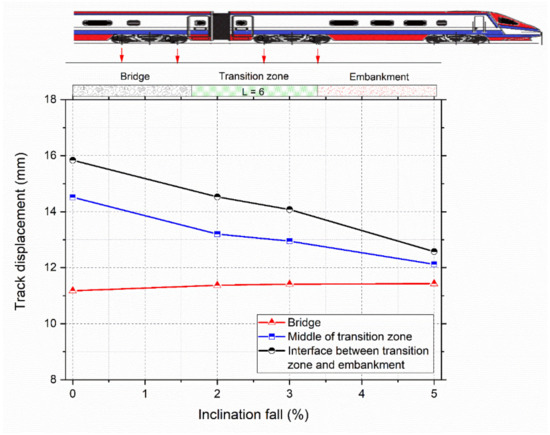
Figure 8.
Variation of track displacement with fall in the approach slab.
4. Dynamic Loading: Simulation and Results
The Dynamic Amplification Factor (DAF) is used to simulate the dynamic effects of the moving train over the tracks. In this study, the DAF is evaluated for train speeds of 60, 100, 150, and 200 km/h. The past literature suggests several methods to calculate the DAF. In this study, the DAF is calculated by the equivalent dynamic wheel load method [28] as
where V is the velocity of the train in km/h and C is the coefficient equal to 0.3. These factors are multiplied with the static wheel loading to simulate the dynamic wheel loading effect. Figure 9 shows the variation of ballast displacement across the length of the model from the bridge to the embankment. It is seen that the consideration of DAF in lieu of train speed captured the dynamic loading effects. The comparison of displacements due to different train speeds highlights the predominant difference in the ballast settlement at the embankment, transition zone, and the bridge. The higher DAF results in higher displacement throughout the bridge structure. The results obtained in the present study are consistent with those reported in the previous studies (e.g., Coelho et. al. [27]). The effect of the dynamic wheel loading is also evaluated for different thickness and fall in the inclination of the approach slab.
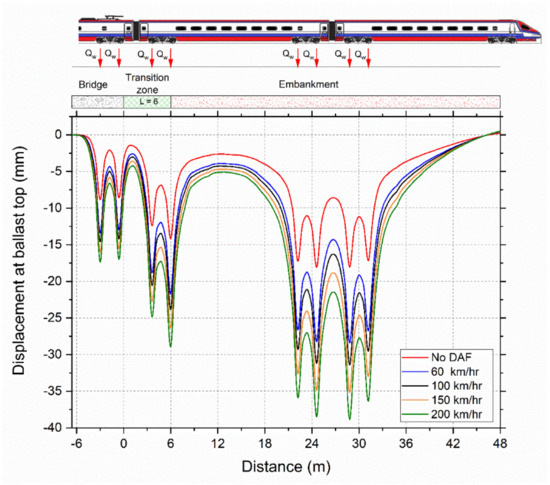
Figure 9.
Variation of displacement at the top of ballast due to change in train velocity.
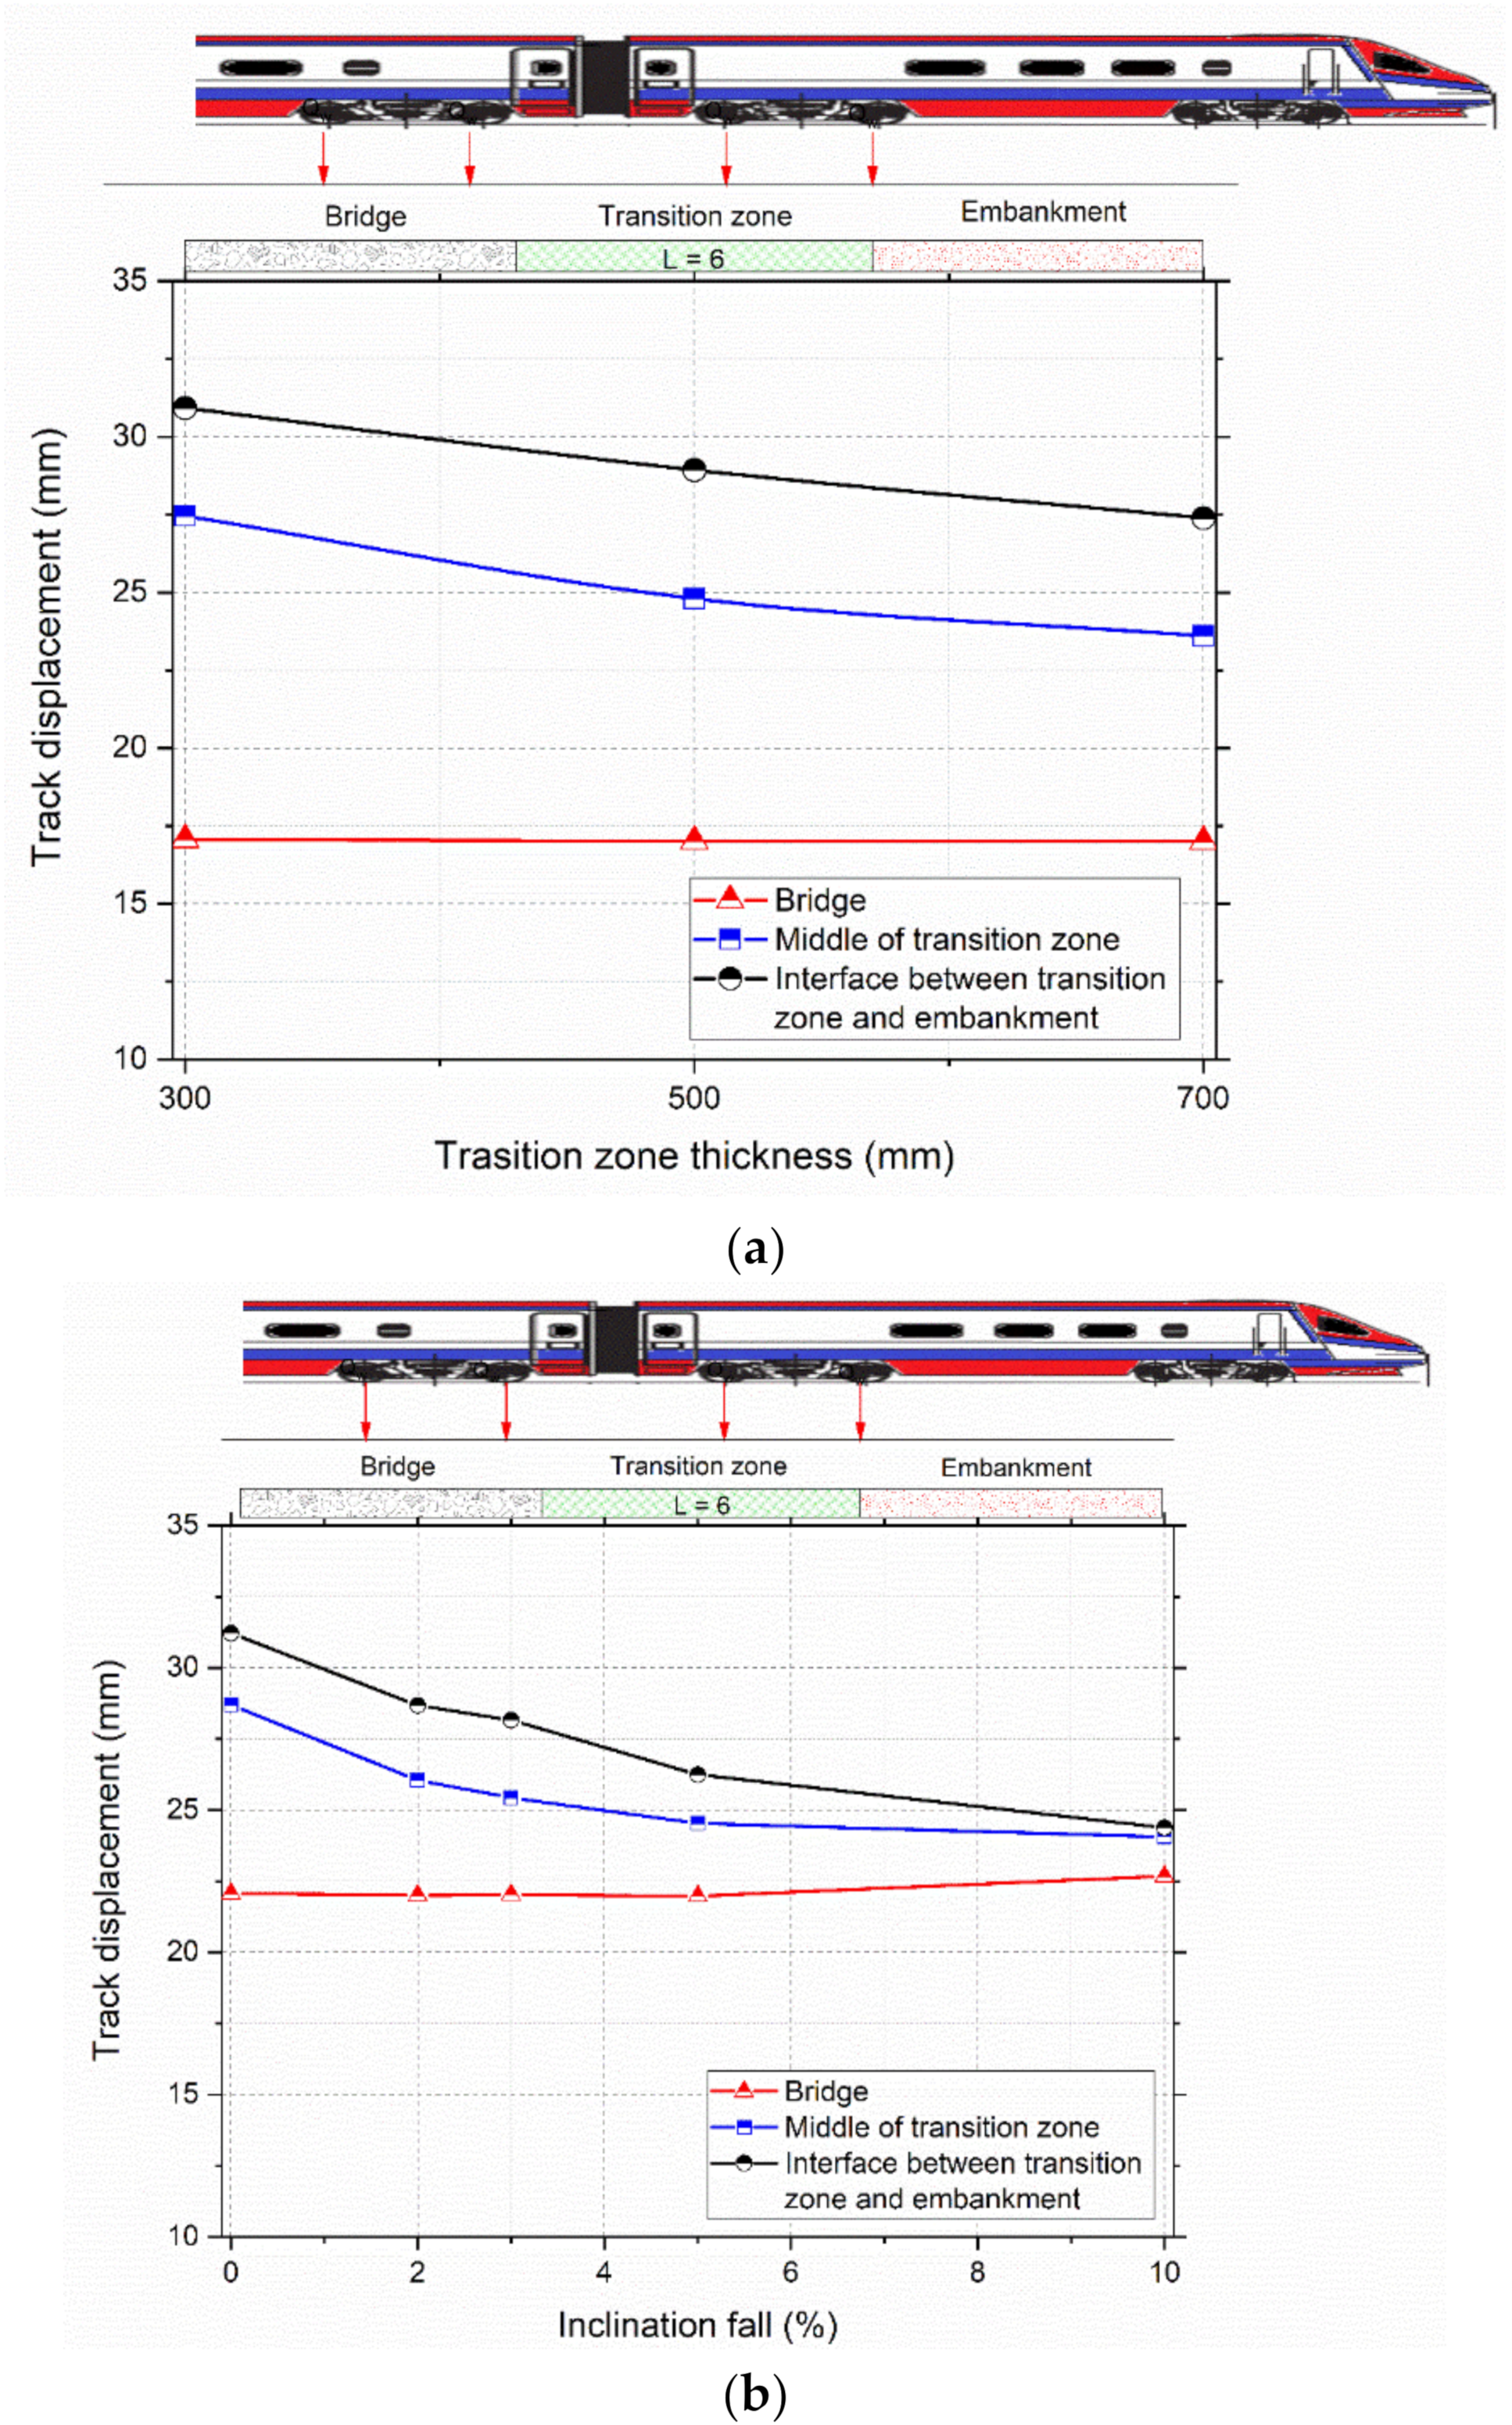
Variation in Thickness and Fall in Inclination of the Approach Slab
The track displacement for different dynamic wheel loading is evaluated for different thicknesses of the approach slab and is depicted in Figure 10a. The result shows that the track displacement reduces with the increase in the thickness of the approach slab. A similar trend is observed earlier for the static loading, but the displacements are increased significantly due to the dynamic wheel loading. The track displacement at the bridge deck is shown in comparison with the transition zone. The geometric properties of the bridge deck section are held constant during the FE simulations. The track displacement at the bridge deck is independent of the transition zone. Hence, it is almost the same for different thicknesses of the transition zone. The load coming on the bridge may change slightly due to variations in thickness of the approach slab at the transition zone. However, in the present study, the loading on the bridge deck is kept constant. The geometric properties of the transition zone are varied in this study. At the bridge section, the rail and sleeper are supported on the ballast and the ballast is supported on the bridge deck. The load from the bridge deck is transferred to the abutment. At the transition zone, the ballast layer is supported on the approach slab, and in turn this slab is supported directly on the backfill soil. Because of this load transfer mechanism, the track displacement changes only in the transition zone. Figure 10b shows the variation of the track displacement with fall in the inclination of the approach slab. The decrease in the track displacement is observed similarly as in the case of static loading; however, the magnitudes of the track displacement are much higher due to the dynamic wheel loading.
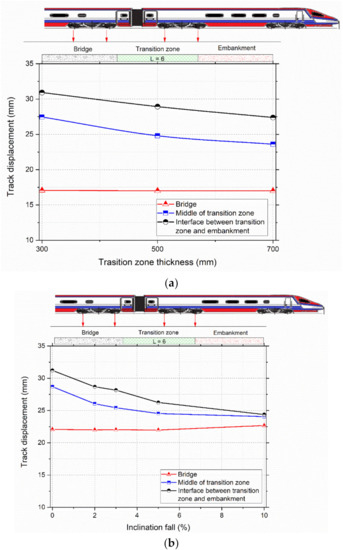
Figure 10.
Variation of track displacement with (a) thickness, and (b) fall in inclination of the approach slab.
5. Cyclic Loading
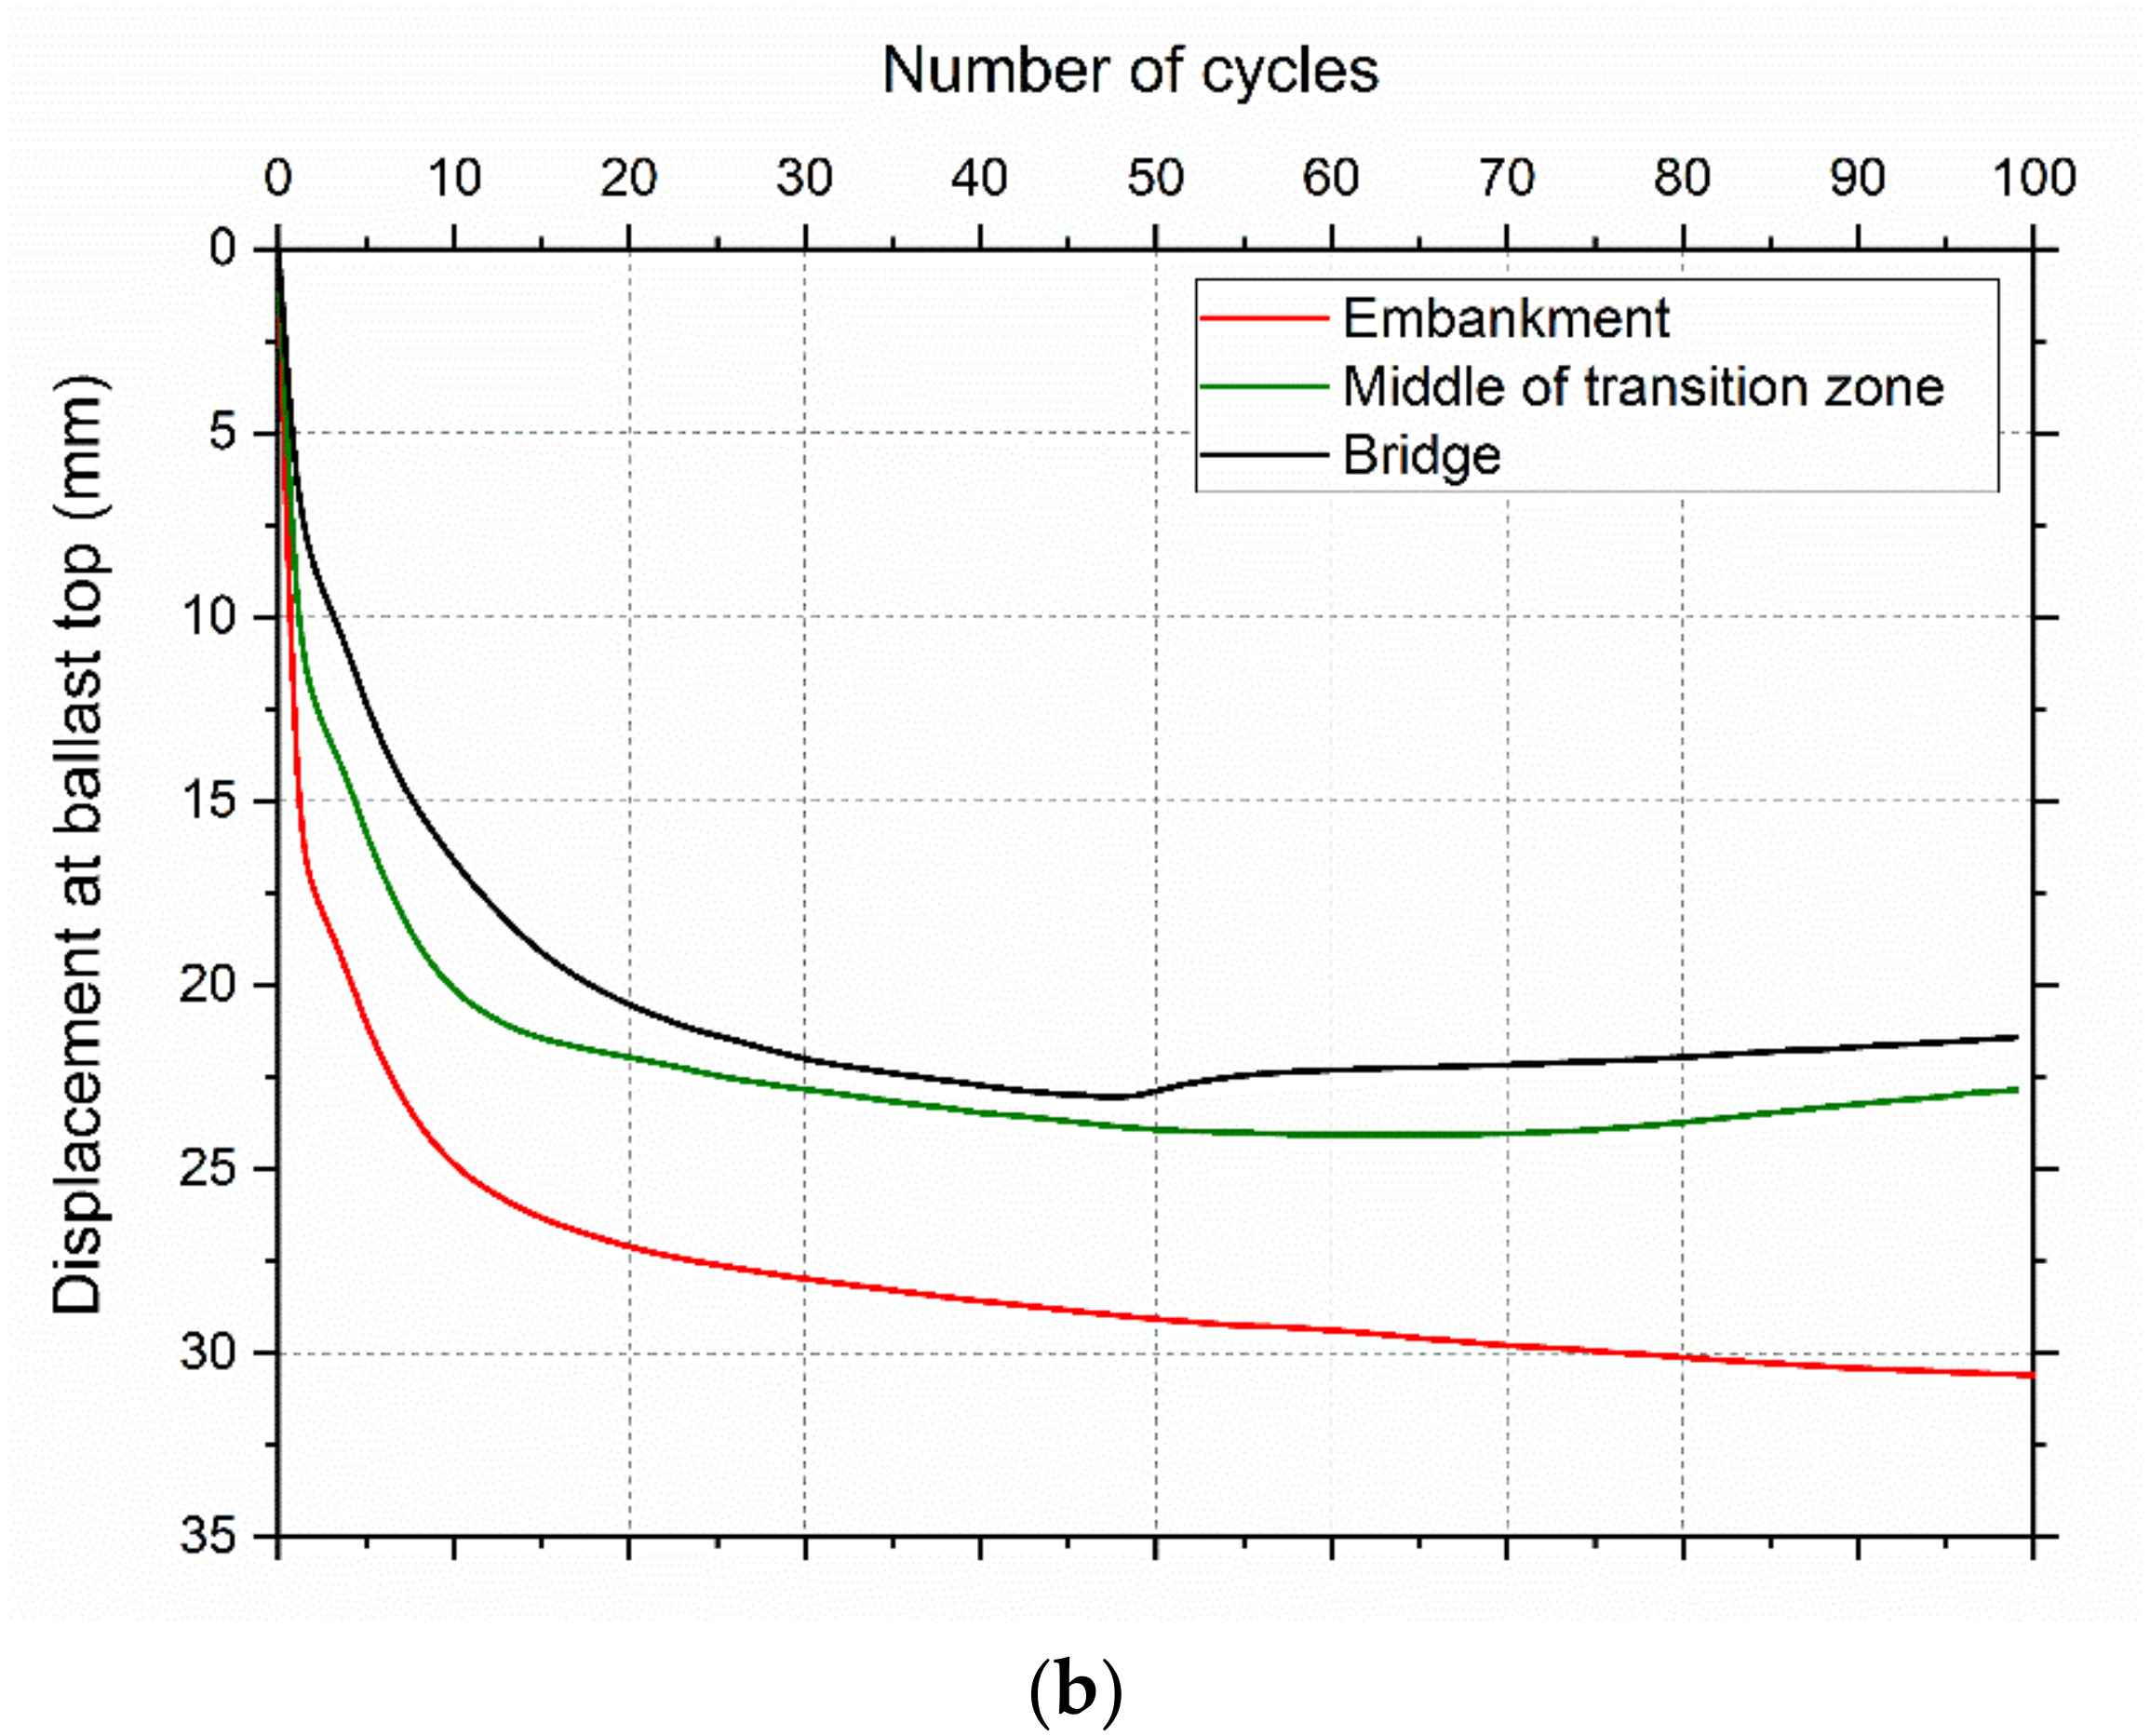
The train wheel loading acts as the repetitive wheel loading during the entire train passage at a point on the rail track above the sleeper. The train load for the entire train passage is simulated via a stationary cycling (repetitive) wheel loading. At the bridge, the middle of the transition zone, the interface of the transition–embankment, and the embankment, a cyclic loading at 100 kN was applied. The effect of cycling loading on the displacement of the ballast increases as the number of cycles of loading increases. Figure 11a depicts the ballast displacement for the entire stretch after the 1st, 5th, 10th, 24th, 50th, and 100th cycles of loading. Due to cyclic loading, the ballast displacement increases rapidly for the first ten cycles, then slowly increases for the next ten cycles. Figure 11b shows the displacement at the top of the ballast at the bridge, the transition zone, and the embankment after 100 cycles of loading. It is seen that the displacement of the ballast is constant after 100 cycles of loading, which is almost equal to the displacement of the center of the transition zone. With the increase in the number of cycles, the ballast displacement on the embankment increases.
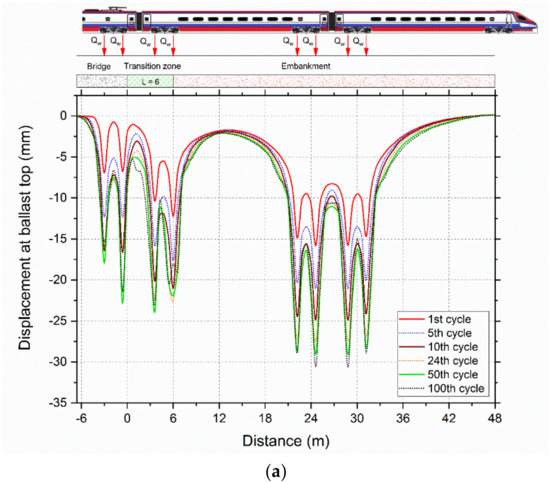

Figure 11.
Variation of ballast displacement (a) at 1st, 5th, 10th, 24th, 50th, and 100th cycle across the stretch (b) with different cycles of loading.
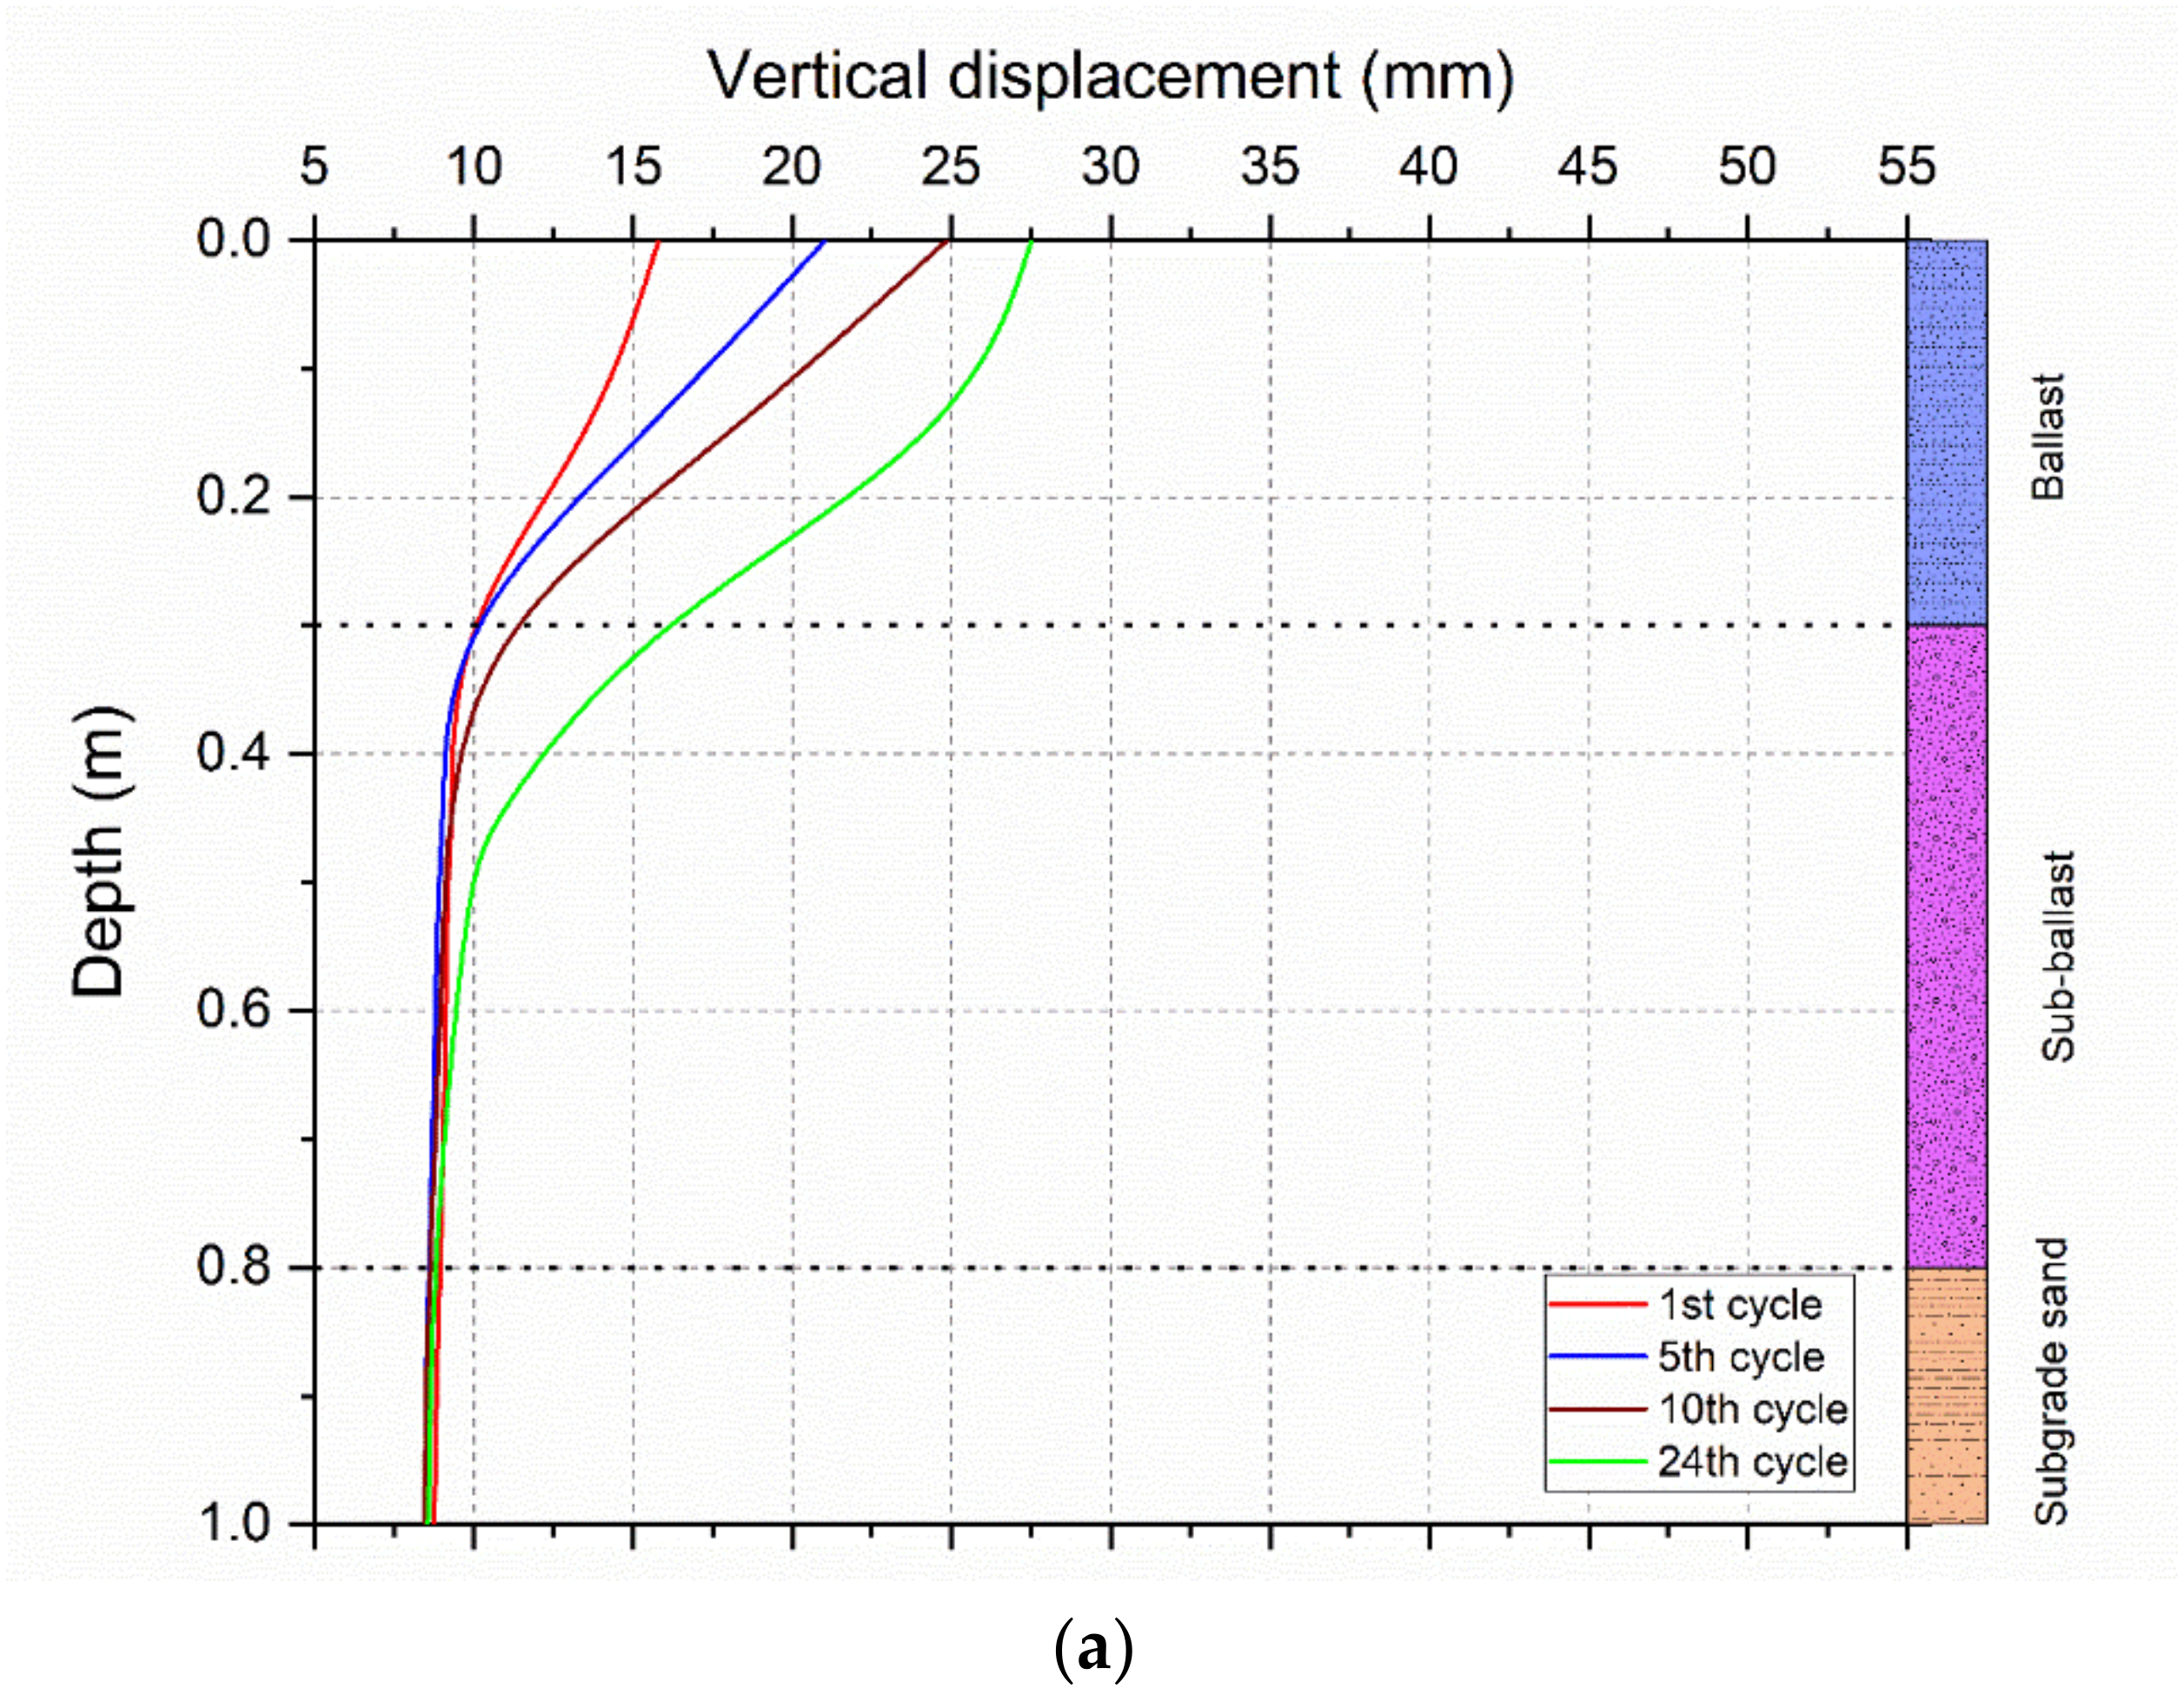
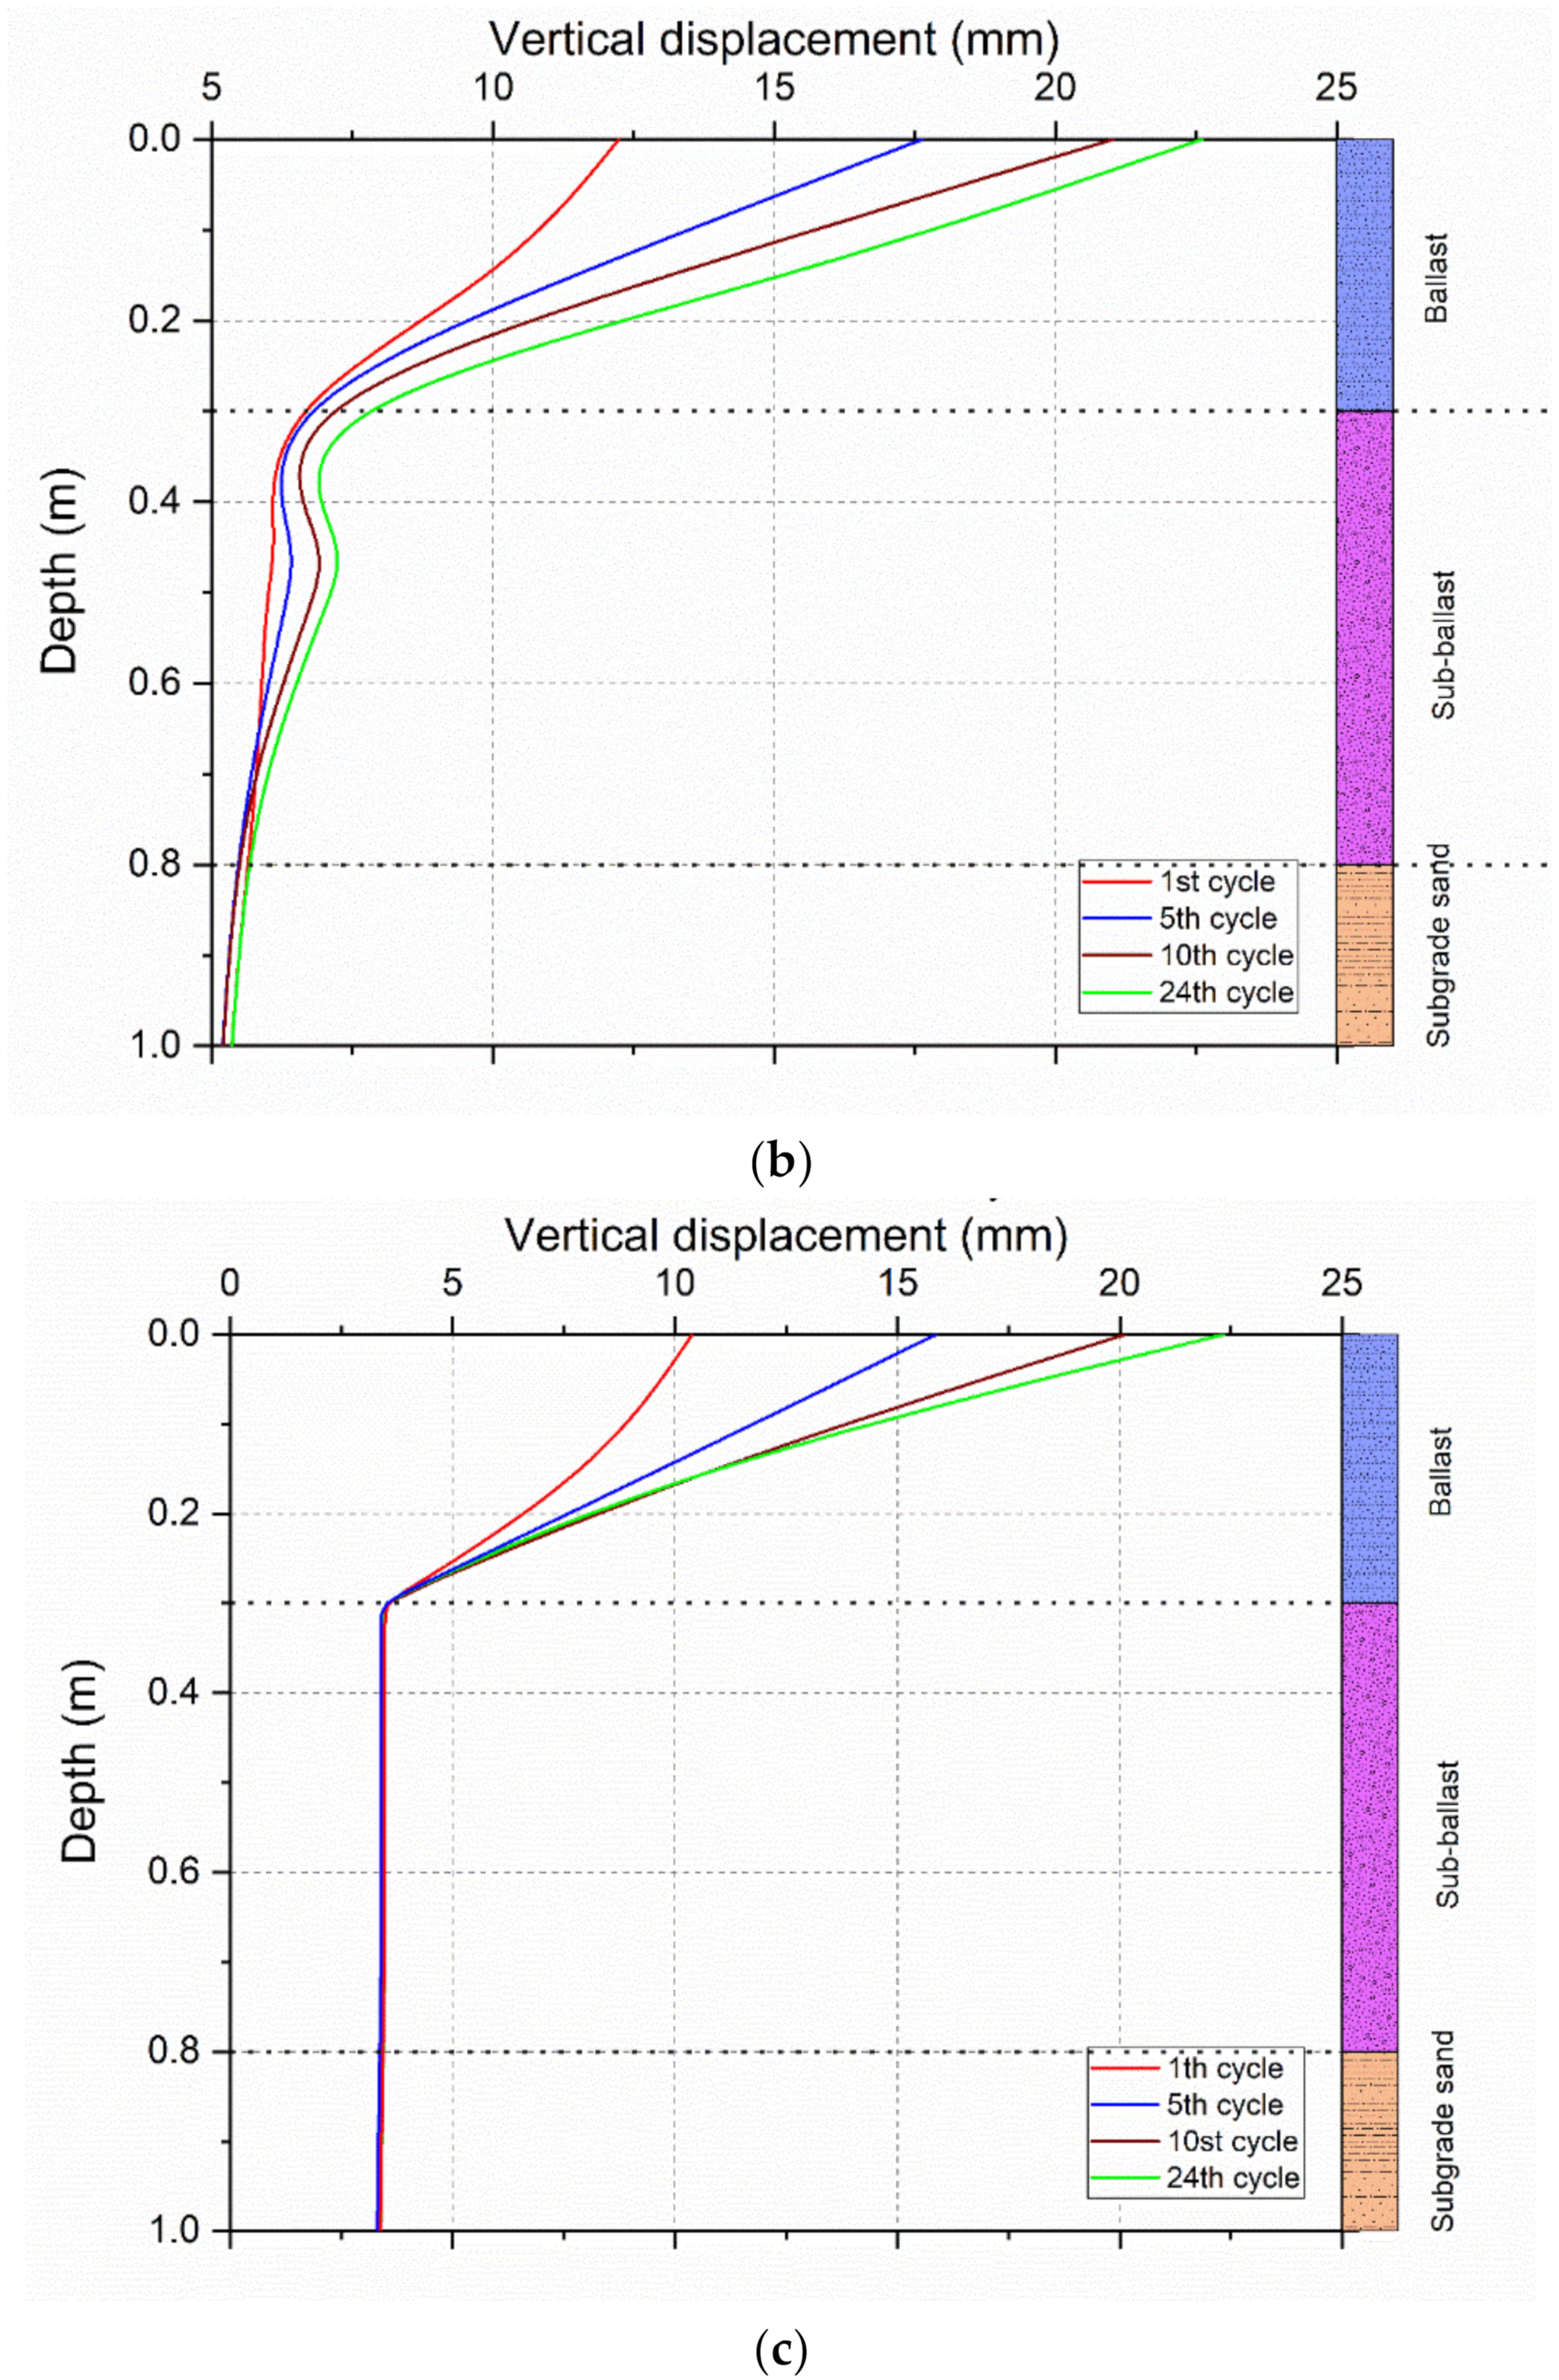
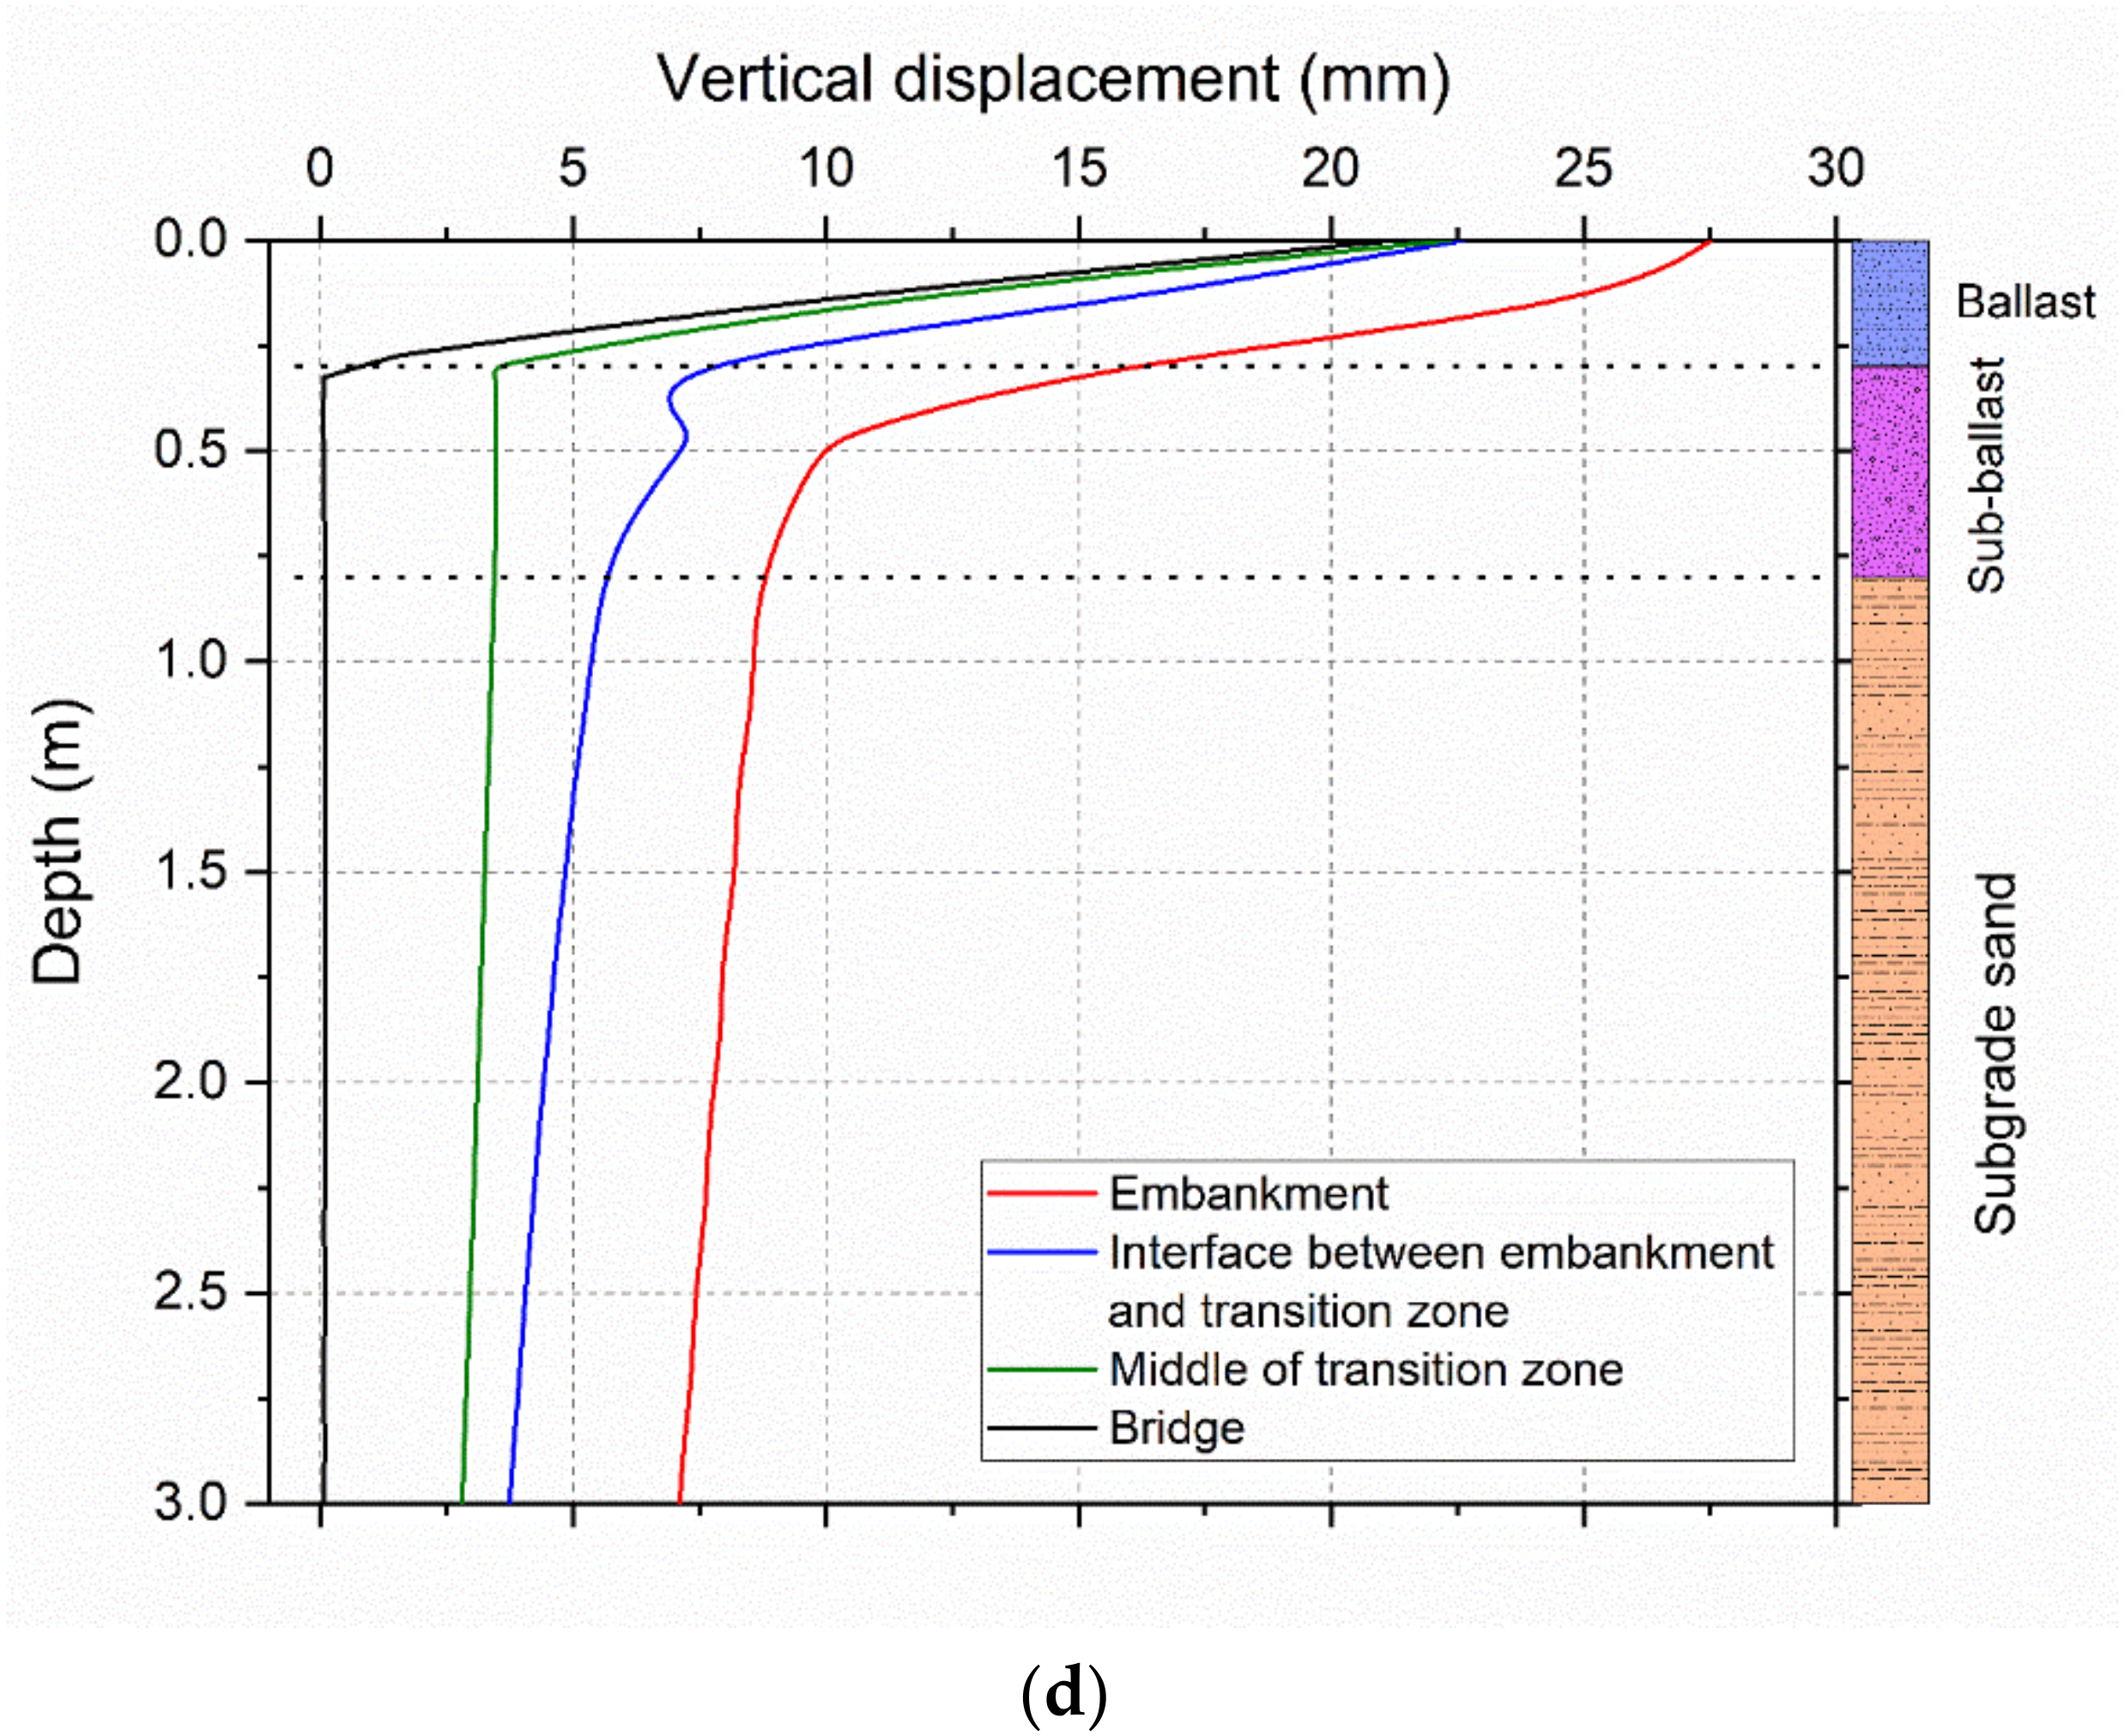
The vertical displacement profiles across the depth at different sections such as the embankment, the interface between the embankment and transition zone, and the middle of the transition zone are shown in Figure 12a–c for different loading cycles. It is noted that the increase in the number of loading cycles increases the vertical displacement of the track. For the 24th cycle, the results are shown up to a depth of 3 m as in Figure 12d, wherein the vertical displacement is maximum at the embankment and minimum at the bridge.


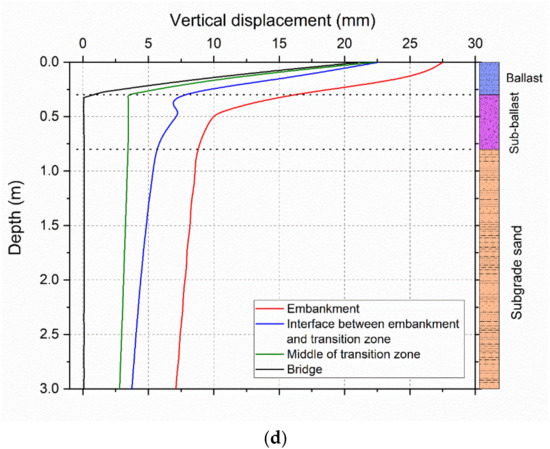
Figure 12.
Variation of vertical displacement with depth at different locations along the track (a) at embankment (b) between the embankment and the transition zone (c) middle of the transition zone (d) for one train passage (24th cycle).
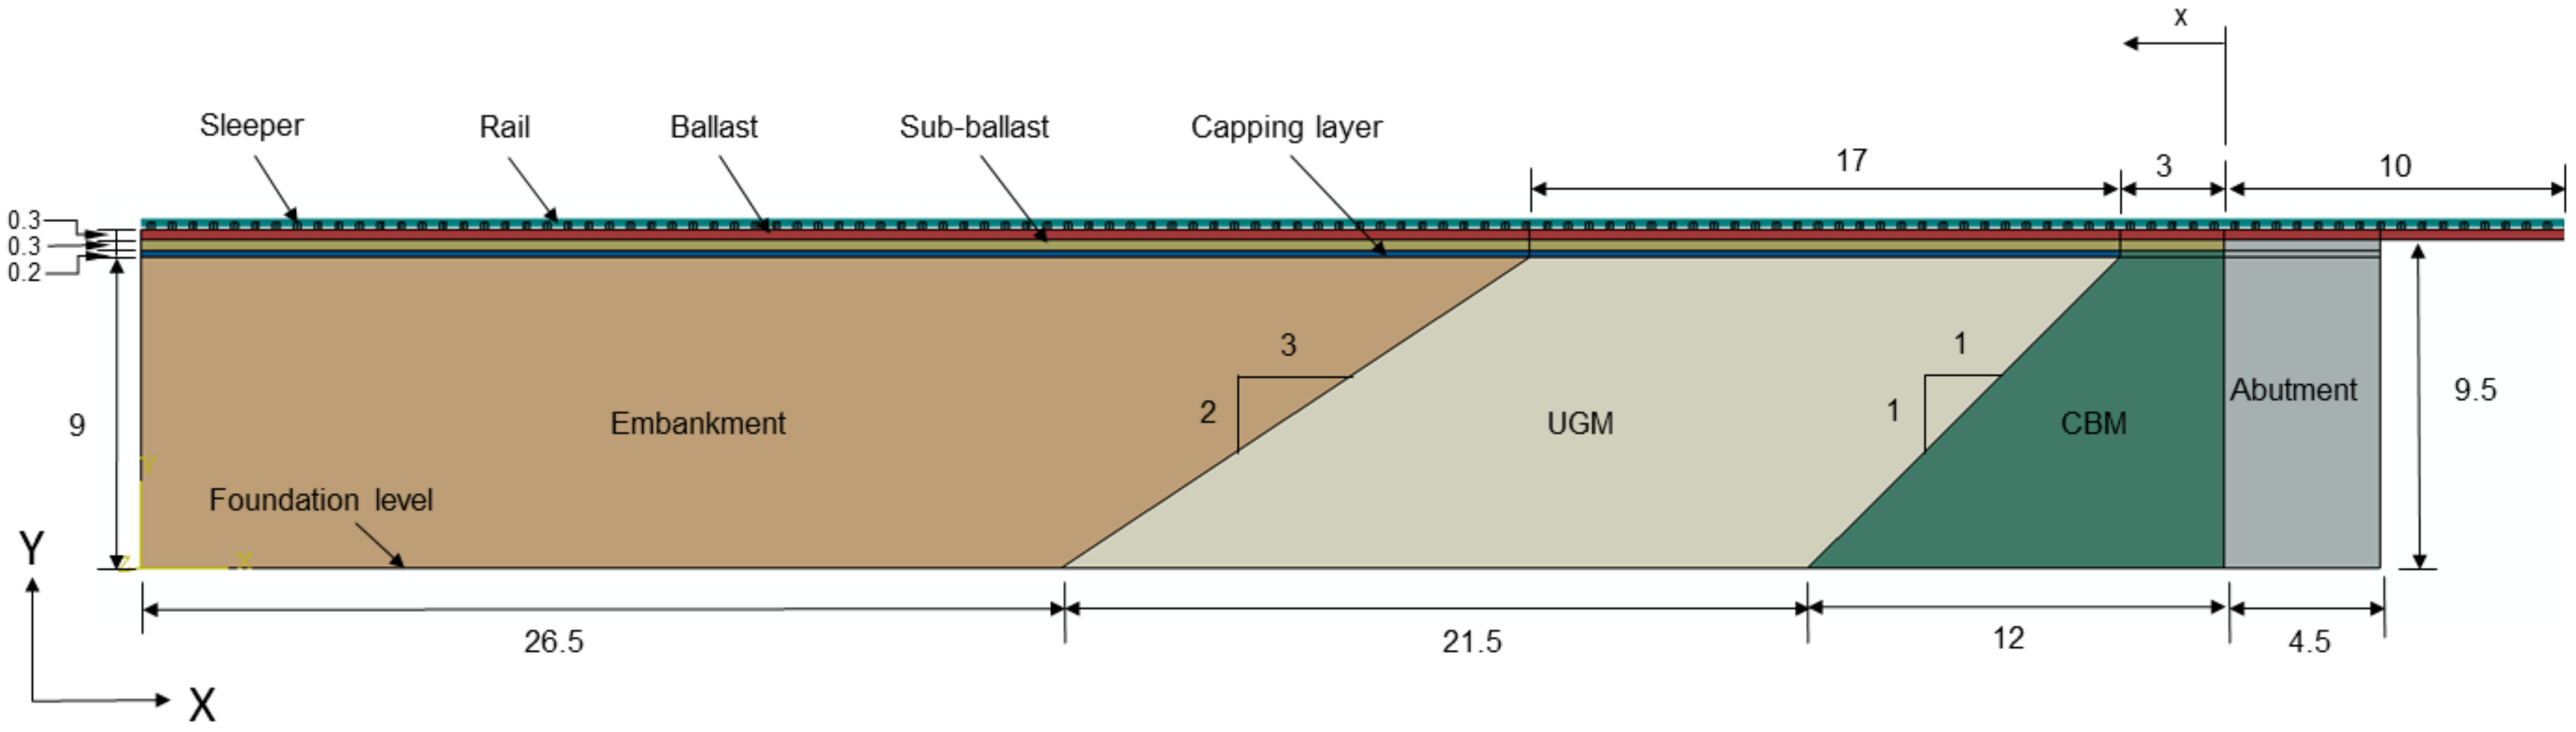
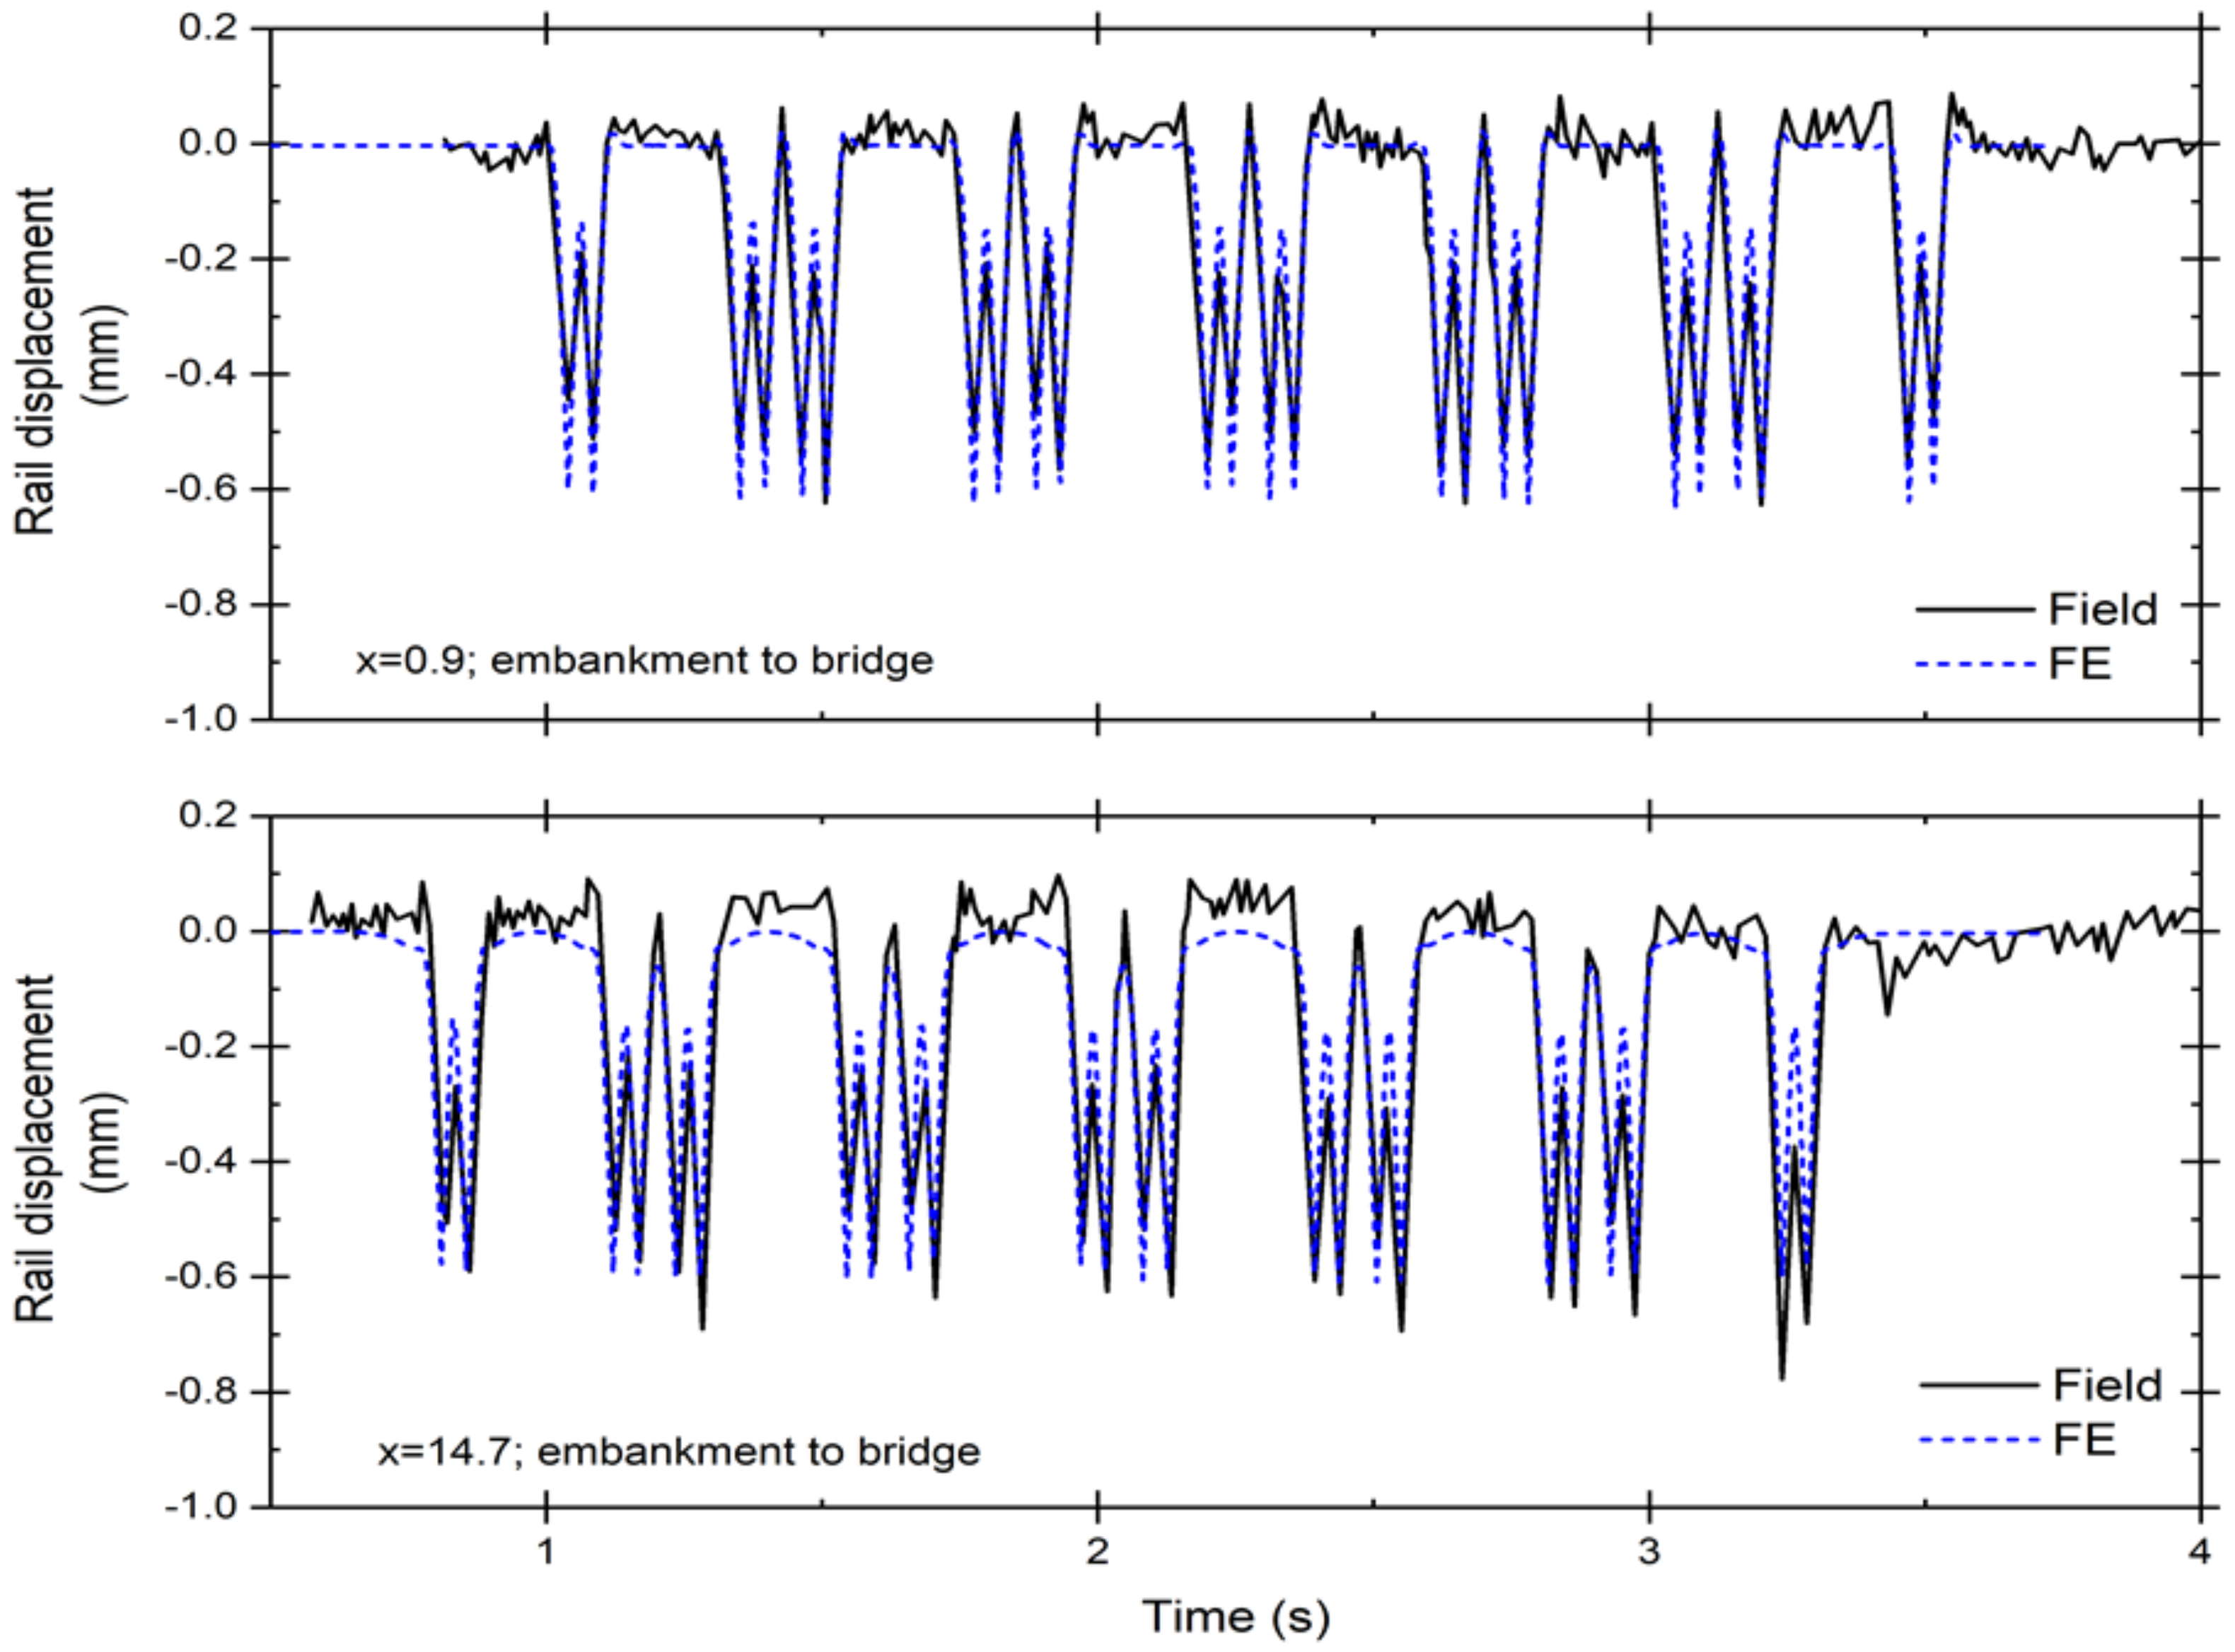
6. Model Validation
The calibration of the FE model was performed using the data of Paixão et al. [8], where the transition zone is analyzed experimentally and numerically for Alfa Pendular rail in the Portuguese Railway network. Figure 13 illustrates the validation model of the transition zone consisting of a rail mounted on the rail pad with a rectangular cross-sectional area of 0.0154 m2 and the dimensions as 0.1232 m × 0.125 m. The backfill was modelled using the Mohr–Coulomb model. The rail pads were modelled as a spring-damper system and the bridge deck as a continuous beam element. For the transition zone, the maximum length considered was 60 m with a length of 21.5 m, 12 m, and 4.5 m distributed for the UGM, CBM, and abutment. The rail displacements are evaluated for the CBM and UGM at x = 0.9 m and x = 14.7 m from the abutment. Figure 14 depicts the comparison between the FE results and the data reported in Paixão et al. [8]. It is seen that the FE results are consistent with the experimental results. The peaks of the rail displacements also match the field data for different times of the train passage. The rail displacements at the UGM are found to be slightly higher when compared to the displacements at the CBM. The rail displacement is maximum at the embankment, lesser at the UGM, and is still lesser at the CBM and is considerably less at the bridge abutment.

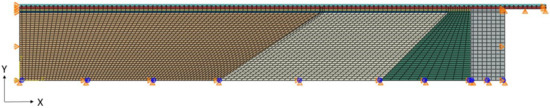
Figure 13.
Validation model with FE mesh modified after Paixão et al. [8] [all dimensions in m].
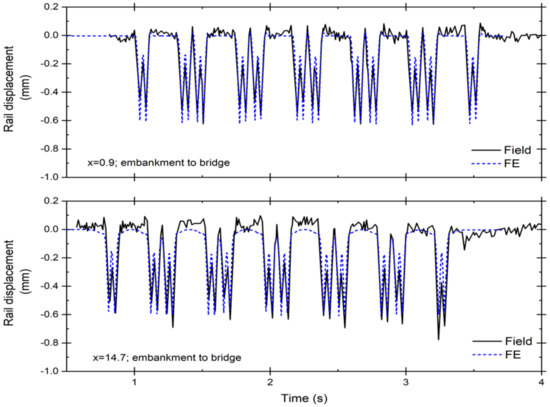
Figure 14.
Comparison of rail displacement with data reported in Paixão et al. [8].
7. Conclusions
The primary goal of this study is to reduce the track displacements caused by the static and cyclic loading in the critical sections of the integral abutment bridges. The developed finite element analysis procedure using ABAQUS captures the long-term behavior of the transition zone for the IAB during train passage. It is found that the interface between the embankment and the transition zone is susceptible to excessive vertical displacements under the static and dynamic wheel loading. The track displacement is significantly higher for the corresponding magnitude in the case of dynamic loading.
With the increase in the number of cycles of loading, the track displacement increases significantly along the entire stretch. The installation of the approach slab improves the track’s stability. The performance of the transition zone is highly dependent on the properties of the backfill. The displacement of the ballast layer is higher when the backfill has a dense state compared to a loose state. At the embankment portion, the vertical displacement is significant at the top of the backfill. The enhanced load transfer from the ballast to the approach slab of the transition zone has helped reduce the vertical displacement of the track. The simulations with the FE model of the IAB-transition zone system with different thicknesses and lengths have provided a smooth transition of the stiffness, thereby decreasing the settlement of the transition zone and hence improving track stability and performance of the IAB. This information can be advantageous while proportioning the transition zone dimensions for HST applications.
For the increased length of the transition zone, a marginal reduction in the track displacement has been noted; however, a drastic reduction in the displacement has taken place due to the increased thickness of the approach slab. The increase in the inclination of the approach slab under the static and dynamic loading resulted in the increased stability of the track. This fact demonstrates the benefit of using the trapezoidal approach slab for HST applications in a sustainable manner and provides an attractive solution for the enhanced performance of the IAB. The higher degree of complexity associated with the train–track system at the transition zone requires more rigorous studies to assess the long-term performance of the transition zone.
Author Contributions
Conceptualization and resources, S.N.; supervision, review and editing, S.N. and G.R.D.; methodology, S.N., G.R.D. and A.S.; validation, formal analysis, and investigation, A.S.; writing original manuscript, A.S. and H.F. All authors have read and agreed to the published version of the manuscript.
Funding
This research received no external funding.
Institutional Review Board Statement
Not applicable.
Data Availability Statement
Data can be provided upon request to the corresponding author.
Conflicts of Interest
The authors declare no conflict of interest. The funders had no role in the design of the study; in the collection, analyses, or interpretation of data; in the writing of the manuscript, or in the decision to publish the results.
References
- Banimahd, M. Advanced Finite Element Modelling of Coupled Train-Track Systems: A Geotechnical Perspective; Heriot-Watt University: Edinburgh, UK, 2008. [Google Scholar]
- Shan, Y.; Albers, B.; Savidis, S.A. Influence of different transition zones on the dynamic response of track–subgrade systems. Comput. Geotech. 2013, 48, 21–28. [Google Scholar] [CrossRef]
- Giannakos, K.; Tsoukantas, S. Transition Zone between Ballastless and Ballasted Track: Influence of Changing Stiffness on Acting Forces. Procedia Soc. Behav. Sci. 2012, 48, 3548–3557. [Google Scholar] [CrossRef] [Green Version]
- Banimahd, M.; Woodward, P.K.; Kennedy, J.; Medero, G.M. Behaviour of train-track interaction in stiffness transitions. Proc. Inst. Civ. Eng.—Transp. 2012, 165, 205–214. [Google Scholar] [CrossRef]
- Dahlberg, T. Railway track stiffness variations—Consequences and countermeasures. Int. J. Civ. Eng. 2010, 8, 1–12. [Google Scholar]
- Li, D.; Davis, D. Transition of railroad bridge approaches. J. Geotech. Geoenviron. Eng. 2005, 131, 1392–1398. [Google Scholar] [CrossRef]
- Sañudo, R.; dell’Olio, L.; Casado, J.A.; Carrascal, I.A.; Diego, S. Track transitions in railways: A review. Constr. Build. Mater. 2016, 112, 140–157. [Google Scholar] [CrossRef]
- Paixão, A.; Fortunato, E.; Calçada, R. Transition zones to railway bridges: Track measurements and numerical modelling. Eng. Struct. 2014, 80, 435–443. [Google Scholar] [CrossRef]
- Alves Ribeiro, C.; Paixão, A.; Fortunato, E.; Calçada, R. Under sleeper pads in transition zones at railway underpasses: Numerical modelling and experimental validation. Struct. Infrastruct. Eng. 2015, 11, 1432–1449. [Google Scholar] [CrossRef]
- Paixão, A.; Fortunato, E.; Calçada, R. Design and construction of backfills for railway track transition zones. Proc. Inst. Mech. Eng. Part F J. Rail Rapid Transit 2015, 229, 58–70. [Google Scholar] [CrossRef]
- Wilk, S.T.; Stark, T.D.; Rose, J.G. Evaluating tie support at railway bridge transitions. Proc. Inst. Mech. Eng. Part F J. Rail Rapid Transit 2016, 230, 1336–1350. [Google Scholar] [CrossRef]
- Liu, K.; Su, Q.; Ni, P.; Zhou, C.; Zhao, W.; Yue, F. Evaluation on the dynamic performance of bridge approach backfilled with fibre reinforced lightweight concrete under high-speed train loading. Comput. Geotech. 2018, 104, 42–53. [Google Scholar] [CrossRef]
- Wang, H.; Markine, V. Corrective countermeasure for track transition zones in railways: Adjustable fastener. Eng. Struct. 2018, 169, 1–14. [Google Scholar] [CrossRef]
- Shi, C.; Zhao, C.; Zhang, X.; Andersson, A. Analysis on dynamic performance of different track transition forms using the discrete element/finite difference hybrid method. Comput. Struct. 2020, 230, 106187. [Google Scholar] [CrossRef]
- Al-qarawi, A.; Leo, C.; Liyanapathirana, D.S. Effects of Wall Movements on Performance of Integral Abutment Bridges. Int. J. Geomech. 2020, 20, 4019157. [Google Scholar] [CrossRef]
- Kunin, J.; Alampalli, S. Integral Abutment Bridges: Current Practice in United States and Canada. J. Perform. Constr. Facil. 2000, 14, 104–111. [Google Scholar] [CrossRef]
- Lovell, M.D. Long Term Behavior of Integral Abutment Bridges; ProQuest Dissertations Publishing: Ann Arbor, MI, USA, 2010. [Google Scholar]
- Talbott, A.M. Earthquake Resistance of Integral Abutment Bridges; ProQuest Dissertations Publishing: Ann Arbor, MI, USA, 2008. [Google Scholar]
- Pak, D.; Bigelow, H.; Feldmann, M. Design of composite bridges with integral abutments. Steel Constr. 2017, 10, 23–30. [Google Scholar] [CrossRef] [Green Version]
- Nimbalkar, S.; Indraratna, B.; Dash, S.K.; Christie, D. Improved Performance of Railway Ballast under Impact Loads Using Shock Mats. J. Geotech. Geoenviron. Eng. 2012, 138, 281–294. [Google Scholar] [CrossRef]
- Thiagarajan, G.; Gopalaratnam, V.; Halmen, C.; Ajgaonkar, S.; Ma, S.; Gudimetla, B.; Chamarthi, R. Bridge Approach Slabs for Missouri DOT Looking at Alternative and Cost Efficient Approaches; Report No.-OR 11.009; Missouri Department of Transportation: Jefferson City, MO, USA, 2010. Available online: https://rosap.ntl.bts.gov/view/dot/18591 (accessed on 20 January 2022).
- Terzaghi, K.; Peck, R.B.; Mesri, G. Soil Mechanics in Engineering Practice, 3rd ed.; John Wiley & Sons: New York, NY, USA, 1996. [Google Scholar]
- Farooq, M.A.; Nimbalkar, S.; Fatahi, B. Three-dimensional finite element analyses of tyre derived aggregates in ballasted and ballastless tracks. Comput. Geotech. 2021, 136, 104220. [Google Scholar] [CrossRef]
- Li, L.; Nimbalkar, S.; Zhong, R. Finite element model of ballasted railway with infinite boundaries considering effects of moving train loads and Rayleigh waves. Soil Dyn. Earthq. Eng. 2018, 114, 147–153. [Google Scholar] [CrossRef]
- Kramer, S.L. Geotechnical Earthquake Engineering; Pearson Education India: New Delhi, India, 1996. [Google Scholar]
- Shi, X. Structural Performance of Approach Slab and Its Effect on Vehicle Induced Bridge Dynamic Response. Ph.D. Thesis, Louisiana State University, Baton Rouge, LA, USA, 2006. Available online: https://digitalcommons.lsu.edu/gradschool_dissertations/2752 (accessed on 20 January 2022).
- Coelho, B.; Hölscher, P.; Priest, J.; Powrie, W.; Barends, F. An assessment of transition zone performance. Proc. Inst. Mech. Eng. Part F J. Rail Rapid Transit 2011, 225, 129–139. [Google Scholar] [CrossRef]
- Shin, E.C.; Kim, D.H.; Das, B.M. Geogrid-reinforced railroad bed settlement due to cyclic load. Geotech. Geol. Eng. 2002, 20, 261–271. [Google Scholar] [CrossRef]


Publisher’s Note: MDPI stays neutral with regard to jurisdictional claims in published maps and institutional affiliations. |
© 2022 by the authors. Licensee MDPI, Basel, Switzerland. This article is an open access article distributed under the terms and conditions of the Creative Commons Attribution (CC BY) license (https://creativecommons.org/licenses/by/4.0/).